The influence of dietary lipid inclusion and daily ration on … FINAL.pdf · inclusion, with upper...
28
1 The influence of dietary lipid inclusion and daily ration on growth and smoltification in 1+ Atlantic salmon (Salmo salar) parr. Berrill, I. K. a *, Porter, M. J. R. b and Bromage, N. R. a a Institute of Aquaculture, University of Stirling, Scotland, FK9 4LA. b School of Aquaculture, University of Tasmania, Launceston, 7250, Tasmania, Australia. * Corresponding author. Current address: School of Ocean Sciences, University of Wales, Bangor, Menai Bridge, Anglesey, LL59 5AB. UK. Tel.: +44 1248 382846 Fax: +44 1248 716367. E-mail: [email protected]
Transcript of The influence of dietary lipid inclusion and daily ration on … FINAL.pdf · inclusion, with upper...

1
The influence of dietary lipid inclusion and daily ration on growth and
smoltification in 1+ Atlantic salmon (Salmo salar) parr.
Berrill, I. K. a *, Porter, M. J. R. b and Bromage, N. R. a
a Institute of Aquaculture, University of Stirling, Scotland, FK9 4LA. b School of Aquaculture, University of Tasmania, Launceston, 7250, Tasmania,
Australia.
* Corresponding author. Current address: School of Ocean Sciences, University of
Wales, Bangor, Menai Bridge, Anglesey, LL59 5AB. UK. Tel.: +44 1248 382846
Fax: +44 1248 716367. E-mail: [email protected]

2
Abstract
The effects of diet regime on growth and smoltification in 1+ Atlantic salmon parr
were studied. Two groups of approximately 400 salmon parr, in triplicate, were fed
diets containing either 25% or 12.5% lipid from first-feeding. Two further treatments
were fed either the 25% or 12.5% lipid diet for 98 days, after which they were fed the
alternate diet. In a second experiment three groups of 550 parr, in duplicate, were fed
at full, two-thirds or one-third of the manufacturers’ recommended ration, from first-
feeding. All groups were maintained on their respective diet regimes until
smoltification approximately one year after first-feeding.
In experiment 1, lipid level had a significant effect on whole body lipid content.
However growth and the incidence of smoltification was not affected by dietary lipid
inclusion, with upper modal group fish from each treatment achieving a similar smolt
status (in terms of condition factor and Na+, K+-ATPase) at seawater transfer. In
experiment 2, growth and the incidence of smolt transformation increased with ration.
Full and two-thirds ration fish maintained similar body lipid contents throughout the
experiment, with that of the one-third ration fish lower only during early
development, indicating that growth was controlled by the maintenance of a distinct
lipid level.
It is concluded that ration, and not dietary lipid inclusion, has a significant effect on
growth and the decision to undergo smoltification in salmon parr.
Keywords: Atlantic salmon, parr, growth, smoltification, nutrition
3
1. Introduction
It is well established that growth in Atlantic salmon parr is an important determinant
in life history strategy. In particular, the yearly cycle of growth leads to the
development of a bimodal population structure in the first growing season (Thorpe,
1977; Bailey et al., 1980; Kristinsson et al., 1985). Smoltification is thought to be
dependant on individuals attaining a particular size threshold (Elson, 1957;
Kristinsson et al., 1985; Skilbrei, 1988), prior to winter, which is followed by a period
of rapid growth (Kristinsson et al., 1985; Skilbrei, 1991). These individuals typically
smolt in the following spring (Kristinsson et al., 1985; Skilbrei, 1988; Duston and
Saunders, 1992), with lower modal group fish requiring at least a further year in fresh
water before migration is possible (Thorpe, 1977, 1987). Although environmental
parameters are known to be important cues for smoltification (Eriksson and
Lundqvist, 1982; Duston and Saunders, 1992; Solbakken et al., 1994), their influence
on growth may determine which individuals can proceed with smoltification many
months prior to seawater transfer.
Energy intake ultimately influences fish growth and development (Jobling, 1994),
with such effects mediated through diet quality and quantity. Where feed is unlimited,
dietary lipid inclusion has been found to have only negligible effects on growth in
juvenile salmonids (Reinitz, 1983; Shearer et al., 1997; Shearer and Swanson, 2000),
having a greater influence on whole body lipid levels (Reinitz, 1983; Grisdale-
Helland and Helland, 1997; Shearer et al. 1997; Shearer and Swanson, 2000).
However, ration influences growth (Storebakken and Austreng, 1987; Stead et al.,
1996; Shearer et al., 1997), with body lipid levels only affected by ration when lower
rates are applied (Storebakken and Austreng, 1987). Subsequently, it has been

4
suggested that salmonid feed intake and therefore growth is controlled by a lipostatic
mechanism (Silverstein et al., 1997; Jobling and Johansen, 1999; Johansen et al.,
2001).
Although such relationships have been proposed with regards to the effects that diet
has on growth, the direct effects of feed regime on smoltification are poorly
understood. Smoltification results in a distinct reduction in body lipid (Woo et al.,
1978; Birt and Green, 1986; Helland and Grisdale-Helland, 1998), although at
conflict with these findings it has been suggested that high fat levels are not necessary
for smoltification (Saunders et al., 1982). In fact neither dietary lipid level (Redell et
al., 1988) nor winter feed restriction (Dickhoff et al., 1989; Larsen et al., 2001) have
been shown to directly influence smoltification. However, such studies have focused
on nutritional influences during smoltification, rather than the preceding year.
The current study aimed to investigate these interactions, in particular, the effects of
long-term diet manipulation on freshwater development.
2. Materials and Methods
2.1. Fish stock and rearing conditions: Experimental fish (Salmo salar) were of
Scottish stock, maintained at the Buckieburn Freshwater Research Facility, Scotland
(56°N) under ambient water temperatures except during early development in the
hatchery, when the ambient water temperatures were artificially elevated (Fig. 1).
Flow rates were maintained at 1 l.s-1 with oxygen levels >8 mg.l-1.
5
2.1.1. Dietary lipid experiment
From first-feeding on 16th March 2000, 2500 fish were placed into each of two, 1m
square tanks and exposed to LD24:0. Each tank was supplied with one of two,
separately formulated, experimental diets (EWOS; UK) (Table 1), containing either
12.5% (proximate composition: 51.2±0.8% protein, 12.3±0.3% lipid, 6.6±0.6%
moisture; mean±S.E.M) or 25% (proximate composition: 49.8±0.8% protein,
24.6±0.3% lipid, 5.3±0.4% moisture; mean±S.E.M) lipid inclusion. Each diet was fed
at the manufacturer’s recommended rate for commercial feeds, throughout the light
phase of the photoperiod. On 16th May, 400 fish from each diet were placed into each
of six, 0.7m diameter, circular tanks. Fish were maintained on their respective diets
under LD24:0 until 21st June, when three tanks from each diet regime were
transferred onto the alternative diet, creating four experimental treatments in triplicate
(Fig. 1) termed the 25/25, 25/12.5, 12.5/25 and 12.5/12.5 groups respectively. From
this time groups were exposed to a simulated natural photoperiod.
2.1.2. Ration experiment
From first-feeding on 22nd April 2001, 2500 fish were placed into each of three, 1m
square tanks and exposed to LD24:0. Each tank was supplied with a commercial feed
(EWOS Micro, EWOS; UK) fed at 100%, 66% or 33% of the manufacturers’
recommended daily ration. On 28th June, 550 fish from each group were placed into
two 1m2 tanks and exposed to a simulated natural photoperiod, with the duplicated
treatments maintained on their respective rations.
6
2.2. Sampling regime:
For both experiments, six batch weight measurements per treatment were taken at
monthly intervals from first-feeding until late June. Then from late June until the
conclusion of the experiments in mid May, individual fork length (±1mm) and weight
(±0.1g) measurements were taken at monthly intervals from 90 to 180 individuals per
treatment. At each sample point, 6 samples per replicate were taken for the
assessment of whole body lipid content, using the Soxhlet extraction method. Samples
taken for whole body fat determination were dried to a constant mass at 100oC prior
to analysis, with the lipid subsequently extracted using petroleum ether (Fisher
Scientific; Loughborough, UK).
In mid February, and then at 14 day intervals from mid March until the conclusion of
the experiments, gill samples were taken from 15 to 20 upper modal group (UMG)
fish per treatment for the determination of gill Na+, K+-ATPase, using the method
detailed by McCormick (1993). Modal groups were determined based on size (UMG
>130mm fork length) and the presence of body silvering. At the conclusion of the
experiments in mid May the remaining fish were culled with the numbers of upper
and lower modal group (LMG) fish recorded.
2.3. Calculations and statistical analysis: Condition factor (CF) was calculated as:
weight (g).fork length (cm)-3.100. Data were analysed using Minitab v13.1. Changes
in weight, condition factor, whole body lipid level, gill Na+, K+-ATPase and
population structure were compared using a General Linear Model. To improve
statistical analysis, natural log and arcsine transformations were used for the weight
and population structure data respectively. Residual plots were used to confirm
7
normality and homogeneity of variance. A significance level of 5% was applied to the
statistical tests (Zar, 1999).
3. Results
3.1. Growth:
All groups increased in size over the experimental period (P<0.001) (Fig. 2). In the
dietary lipid experiment no differences were found among the weight of treatment
groups at any time during the study (Fig. 2a). For the daily ration experiment, the full
and two-thirds ration fish became heavier than the one-third ration fish from late July
(P<0.01) until the conclusion of the experiment (Fig. 2b), with those fed the full
ration heavier than the two-thirds ration fish from mid August (P<0.01).
In the dietary lipid experiment, the condition factor of the 12.5/25 and 12.5/12.5
groups increased between mid June and mid September (P<0.05) (Fig. 3a), with the
CF of all groups then declining to the conclusion of the experiment (P<0.001).
However, throughout the experiment no consistent differences could be found among
treatment groups (P>0.05). For the daily ration experiment, the CF of all groups
initially increased (P<0.001) (Fig. 3b), peaking in late July for the one-third ration
fish and then in mid August for the full and two-thirds ration fish. Subsequently, the
CF of all groups declined to the conclusion of the experiment (P<0.001). The CF of
the full and two-thirds ration fish remained similar throughout the experiment
(P>0.05), with that of the one-third ration fish lower (P<0.05) than the full ration fish
from mid September until mid October, and lower than the two-thirds ration fish in
mid September and mid April (Fig. 3b).

8
3.2. Whole body lipid levels:
All groups in the dietary lipid experiment showed an overall increase in whole body
lipid level until mid October (Fig. 4a) (P<0.05), with a subsequent decline to the end
of the experiment (P<0.001). The lipid content of fish was maintained at levels
relative to the dietary lipid inclusion they were being fed. As such, between mid May
and mid June, the 25/25 and 25/12.5 fish had higher lipid levels than the 12.5/25 and
12.5/12.5 fish (P<0.001). Following the change in diet on 21st June, the lipid level of
the 12.5/25 fish increased (P<0.01) to similar levels as the 25/25 fish, with that of the
25/12.5 fish becoming similar to the 12.5/12.5 fish. Then from mid August, until the
conclusion of the experiment, the 25/25 and 12.5/25 fish maintained similar lipid
levels, being significantly higher (P<0.01) than those of the 25/12.5 and 12.5/12.5
fish.
All groups in the ration experiment showed an overall increase in lipid level until mid
October (Fig. 4b), with a subsequent decrease to the conclusion of the experiment
(P<0.001). The full ration fish had a higher lipid content than the one-third ration fish
from late July until mid January (P<0.01) and then from mid April onwards (P<0.05),
whereas the lipid content of the two-thirds ration fish was only higher from mid July
until early December (P<0.01). The full and two-thirds ration fish had similar lipid
levels throughout the experiment (P>0.05).
3.3. Na+, K+ -ATPase levels:
The Na+, K+-ATPase levels of UMG fish from all groups increased between mid
February and mid May (P<0.01) (Fig. 5). Furthermore, during both the lipid (Fig. 5a)
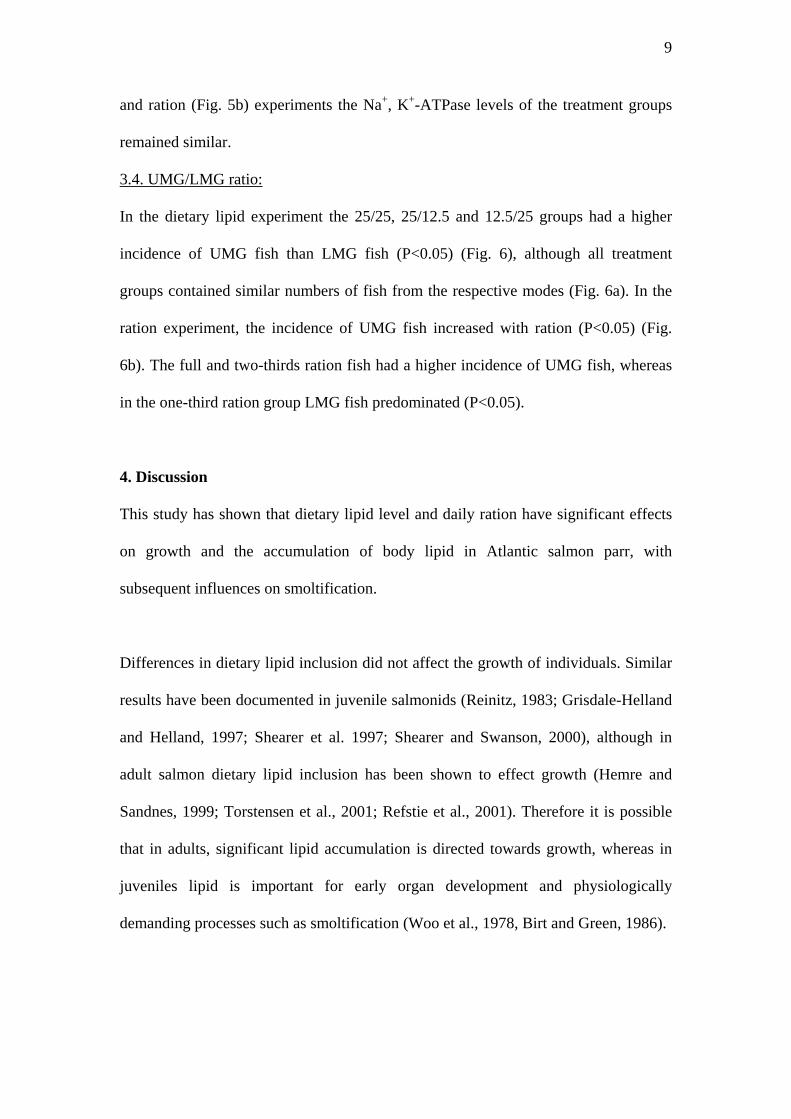
9
and ration (Fig. 5b) experiments the Na+, K+-ATPase levels of the treatment groups
remained similar.
3.4. UMG/LMG ratio:
In the dietary lipid experiment the 25/25, 25/12.5 and 12.5/25 groups had a higher
incidence of UMG fish than LMG fish (P<0.05) (Fig. 6), although all treatment
groups contained similar numbers of fish from the respective modes (Fig. 6a). In the
ration experiment, the incidence of UMG fish increased with ration (P<0.05) (Fig.
6b). The full and two-thirds ration fish had a higher incidence of UMG fish, whereas
in the one-third ration group LMG fish predominated (P<0.05).
4. Discussion
This study has shown that dietary lipid level and daily ration have significant effects
on growth and the accumulation of body lipid in Atlantic salmon parr, with
subsequent influences on smoltification.
Differences in dietary lipid inclusion did not affect the growth of individuals. Similar
results have been documented in juvenile salmonids (Reinitz, 1983; Grisdale-Helland
and Helland, 1997; Shearer et al. 1997; Shearer and Swanson, 2000), although in
adult salmon dietary lipid inclusion has been shown to effect growth (Hemre and
Sandnes, 1999; Torstensen et al., 2001; Refstie et al., 2001). Therefore it is possible
that in adults, significant lipid accumulation is directed towards growth, whereas in
juveniles lipid is important for early organ development and physiologically
demanding processes such as smoltification (Woo et al., 1978, Birt and Green, 1986).

10
The current study provides further evidence that growth is correlated to ration in
juvenile salmon (Storebakken and Austreng, 1987, Stead et al., 1996; Shearer et al.,
1997). However, it is possible that environmental factors such as temperature and
photoperiod affect an individuals response to different rations, with those receiving
high rations maintaining a good physiological condition, allowing energy to be
diverted away from growth at seasonally or developmentally critical periods
Both dietary lipid inclusion and ration level affected the accumulation of body lipid,
similar to previous findings in juvenile salmonids (Reinitz, 1983; Storebakken and
Austreng, 1987; Shearer and Swanson, 2000). However, during the dietary lipid
experiment, as well as body fat being maintained at levels relative to those in the diet,
when a change in dietary lipid occurred individuals rapidly changed their body fat
content. The rapid replenishment of lipid reserves following periods of restricted
feeding has been documented in juvenile salmon (Miglavs and Jobling, 1989;
Metcalfe and Thorpe, 1992; Morgan and Metcalfe, 2001) and it is likely that the small
size of juveniles is of significance in such a rapid physiological change.
Traditionally, compensatory growth following periods of nutritional restriction has
been considered in terms of an individuals size (Weatherley and Gill, 1981; Miglavs
and Jobling, 1989; Nicieza and Metcalfe, 1997). However, the current study suggests
that salmon growth may be under lipostatic control, with increases in size dependant
on the maintenance of a distinct body fat content (Silverstein et al., 1997; Jobling and
Johansen, 1999; Johansen et al., 2001). The full and two-thirds ration fish maintained
a similar lipid level throughout the experiment, regardless of differences in size.
Although it may be that these fish had achieved a maximum lipid load, this finding

11
may indicate a lipostatic mechanism. If this is the case, it seems that during the early
stages of the experiment it was not possible for the one-third ration fish to reach the
lipid threshold, despite large reductions in growth. However, after mid December
similar lipid levels were recorded in all groups of fish. Previously, O’Connor et al.
(2000) recorded a reduction in the metabolic rate of food deprived salmon and Elliott
(1976) has found that growth and the accumulation of fat are affected by an
interaction between ration and temperature. Therefore it is possible that a reduction in
metabolic rate, as well as the low winter temperatures, affected lipid deposition
relative to that of the full and two-thirds ration fish, thus allowing the one-third ration
fish to achieve the lipid level maintained through lipostatic regulation.
Previously, short-term dietary lipid treatment has been shown to have a negligible
effect on smoltification (Redell et al., 1988). The current study suggests that this is
also the case where long-term dietary lipid regimes are applied. Within the range of
lipid treatments used in the current study (12.5% and 25%) all groups displayed a
reduction in CF and an increase in Na+, K+-ATPase indicative of the parr-smolt
transformation (c.f. Solbakken et al., 1994; Duncan and Bromage, 1998; Handeland
and Stefansson, 2001). However, although not statistically significant, a levelling of
ATPase activity was indicated in the 12.5/12.5 group at the final sample, with this
also the case for the one-third ration fish in the second experiment. It is therefore
possible that these individuals had passed through the smoltification window more
rapidly than the other groups.
Thorpe (1986) and Shearer (1994) suggested that smoltification is dependant upon the
attainment of a distinct lipid threshold. However, similar numbers of fish within the

12
lipid treatments entered the UMG and underwent successful smoltification,
suggesting that high fat levels may not be necessary for smoltification (Saunders et
al., 1982). In support, the previously documented winter reduction in lipid content
(Komourdjian et al., 1976; Saunders and Henderson, 1978; Higgins and Talbot, 1985)
occurred at similar rate in all of the treatments. Although Higgins and Talbot (1985)
recorded this reduction to occur at similar rates in upper and lower mode fish it has
typically been linked to the physiological demands imposed by smoltification (Woo et
al., 1978; Birt and Green, 1986; Helland and Grisdale-Helland, 1998). However, if a
high lipid threshold regulated smoltification one might expect a differential response
for individuals with different body lipid contents. Consequently it may be more
appropriate to consider smoltification as requiring only low lipid reserves, with the
winter decline in body fat content more a result of a temperature induced reduction in
feed intake and activity (Metcalfe and Thorpe, 1992; Nicieza and Thorpe, 1997).
Different rations had a distinct effect on the number of individuals undergoing
smoltification, with the full ration group having high recruitment to the UMG and
72% of the one-third ration group remaining in the LMG. It is likely that the
differential in recruitment to the UMG was a result of ration related growth that
affected the numbers of fish achieving the size threshold for smoltification (Elson,
1957; Skilbrei, 1988).
Interestingly, all groups displayed a reduction in CF, which has previously been
linked to the parr-smolt transformation (Solbakken et al., 1994; Duncan and Bromage,
1998). However, ration influenced the incidence of UM fish and in the one-third
ration group very low numbers of fish smolted. Duncan and Bromage (1998) found

13
that smoltification parameters were not necessarily well synchronised, suggesting that
the decrease in condition may not be solely due to smoltification. Combined with the
findings of the current experiment it may be that CF is not necessarily a good measure
of smoltification. Alternatively, it may be that all of the fish in the experiment were
stimulated to attempt smoltification by the changing photoperiod (Duston and
Saunders, 1992) (as indicated by the reduction in CF) but only those which were able
to successfully complete the parr-smolt transformation continued to develop as
smolts.
Salmon hatcheries aim to supply high numbers of competent smolts at predetermined
times of the year. The current study has highlighted the influence of ration on the
incidence of smoltification in Atlantic salmon and as such feed rates should not be
compromised during freshwater development. Dietary lipid levels did not greatly
affect smoltification and freshwater production may not be impaired by a reduction in
dietary lipid content. However, the relationships between juvenile and adult
development are not well documented, and such reductions may affect adult growth
or maturation rates. Therefore it is important that future investigations consider the
longer term effects of dietary variations in salmonids.
Acknowledgements
The authors would like to thank the staff at the Buckieburn Freshwater Research
Facility, Allan Porter for advice on whole body lipid determination and EWOS for
providing the experimental diets. This work was supported by a NERC CASE award
to IB and NERC ROPA and Marine Harvest Scotland grants to NB and MP.

14
References
Bailey, J.K., Saunders, R.L., Buzeta, M.I., 1980. Influence of parental smolt age and
sea age on growth and smolting of hatchery-reared Atlantic salmon (Salmo salar).
Can. J Fish. Aquat. Sci. 37, 1379-1386.
Birt, T.P., Green, J.M., 1986. Parr-smolt transformation in female and sexually
mature male anadromous and nonanadromous Atlantic salmon, Salmo salar. Can. J
Fish. Aquat. Sci. 43, 680-686.
Dickhoff, W.W., Mahnken, C.V.W., Zaugg, W.S., Waknitz, W.F., Bernard, M.G.,
Sullivan, C.V., 1989. Effects of temperature and feeding on smolting and seawater
survival of Atlantic salmon (Salmo salar). Aquaculture 82, 93-102.
Duncan, N.J., Bromage, N.R., 1998. The effect of different periods of constant short
day on smoltification in juvenile Atlantic salmon (Salmo salar). Aquaculture 168,
369-386.
Duston, J., Saunders, R.L., 1992. Effect of 6-, 12-, and 18-month photoperiod cycles
on smolting and sexual maturation in juvenile Atlantic salmon (Salmo salar). Can.
J Fish. Aquat. Sci. 49, 2273-2280.
Elliott, J.M., 1976. Body composition of brown trout (Salmo trutta L.) in relation to
temperature and ration size. J Anim. Ecol. 45, 273-289.
Elson, P.F., 1957. The importance of size in the change from parr to smolt in Atlantic
salmon. Can. Fish Cult. 21, 1-6.
Eriksson, L.-O., Lundqvist, H., 1982. Circannual rhythms and photoperiod regulation
of growth and smolting in Baltic salmon (Salmo salar L.). Aquaculture 28, 113-
121.
Grisdale-Helland, B., Helland, S.J., 1997. Replacement of protein by fat and
carbohydrate in diets for Atlantic salmon (Salmo salar) at the end of the freshwater
15
phase. Aquaculture 152, 167-180.
Handeland, S.O., Stefansson, S.O., 2001. Photoperiod control and influence of body
size on off-season parr-smolt transformation and post-smolt growth. Aquaculture
192, 291-307.
Helland, S.J., Grisdale-Helland, B., 1998. The influence of replacing fish meal in the
diet with fish oil on growth, feed utilisation and body composition of Atlantic
salmon (Salmo salar) during the smoltification period. Aquaculture 162, 1-10.
Hemre, G.-I., Sandnes, K., 1999. Effect of dietary lipid level on muscle composition
in Atlantic salmon Salmo salar. Aquaculture Nutrition 5, 9-16.
Higgins, P.J., Talbot, C., 1985. Growth and feeding in juvenile Atlantic salmon
(Salmo salar L.). In: Cowey, C.B., Mackie, A.M., Bell, J.G., (Eds.) Nutrition and
Feeding in Fish, Academic Press Inc.: London, UK. pp. 243-263.
Jobling, M., 1994. Fish Bioenergetics. Chapman and Hall: London, England. 309pp
Jobling, M., Johansen, S.J.S., 1999. The lipostat, hyperphagia and catch-up growth.
Aquacult. Res. 30, 473-478.
Johansen, S.J.S., Ekli, M., Stangnes, B., Jobling, M., 2001. Weight gain and lipid
deposition in Atlantic salmon, Salmo salar, during compensatory growth: evidence
for lipostatic regulation? Aquacult. Res. 32, 963-974.
Komourdjian, M.P., Saunders, R.L., Fenwick, J.C., 1976. Evidence for the role of
growth hormone as a part of a "light-pituitary axis" in growth and smoltification of
Atlantic salmon (Salmo salar). Can. J Zool. 56, 544-551.
Kristinsson, J.B., Saunders, R.L., Wiggs, A.J., 1985. Growth dynamics during the
development of bimodal length-frequency distribution in juvenile Atlantic salmon
(Salmo salar L.). Aquaculture 45, 1-20.
Larsen, D.A., Beckman, B.R., Dickhoff, W.W., 2001. The effect of low temperature
16
and fasting during the winter on growth and smoltification of coho salmon. North
Amer. J Aquacult. 63, 1-10.
McCormick, S.D., 1993. Methods for nonlethal gill biopsy and measurement of Na+,
K+-ATPase activity. Can. J Fish. Aquat. Sci. 50, 656-658.
Metcalfe, N.B., Thorpe, J.E., 1992. Anorexia and defended energy levels in over
wintering juvenile salmon. J Anim. Ecol. 61, 175-181.
Miglavs, I., Jobling, M., 1989. The effects of feeding regime on proximate body
composition and patterns of energy deposition in juvenile Arctic charr, Salvelinus
alpinus. J Fish Biol. 35, 1-11.
Morgan, I.G., Metcalfe, N.B., 2001. Deferred costs of compensatory growth after
autumnal food shortage in juvenile salmon. Proc. Royal Soc. Lon. Series B 268,
295-301.
Nicieza, A.G., Metcalfe, N.B., 1997. Growth compensation in juvenile Atlantic
salmon: Responses to depressed temperature and food availability. Ecol. 78, 2385-
2400.
O'Connor, K.I., Taylor, A.C., Metcalfe, N.B., 2000. The stability of standard
metabolic rate during a period of food deprivation in juvenile Atlantic salmon. J
Fish Biol. 57, 41-51.
Redell, L.A., Rottiers, D.V., Lemm, C.A., 1988. Lack of dietary effects on the timing
of smoltification in Atlantic salmon. Prog. Fish Cult. 50, 7-11.
Refstie, S., Storebakken, T., Baeverfjord, G., Roem, A.J., 2001. Long-term protein
and lipid growth of Atlantic salmon (Salmo salar) fed diets with partial replacement
of fish meal by soy protein products at medium or high level. Aquaculture 193,
91-106.
Reinitz, G., 1983. Relative effect of age, diet, and feeding rate on the body

17
composition of young rainbow trout (Salmo gairdneri). Aquaculture 35, 19-27.
Saunders, R.L., Henderson, E.B., 1978. Changes in gill ATPase activity and smolt
status of Atlantic salmon (Salmo salar). J Fish. Res. Bd. Can. 35, 1542-1546.
Saunders, R.L., Henderson, E.B., Glebe, B.D., 1982. Precocious sexual maturation
and smoltification in male Atlantic salmon (Salmo salar). Aquaculture 28, 211-
229.
Shearer, K.D., 1994. Factors affecting the proximate composition of cultured fish
with emphasis on salmonids. Aquaculture 119, 63-88.
Shearer, K.D., Silverstein, J.T., Dickhoff, W.W., 1997. Control of growth and
adiposity of juvenile chinook salmon (Oncorhynchus tshawytscha). Aquaculture
157, 311-323.
Shearer, K.D., Swanson, P., 2000. The effect of whole body lipid on early maturation
of 1+ age male chinook salmon (Oncorhynchus tshawytscha). Aquaculture 190,
343-367.
Silverstein, J.T., Shimma, H., Ogata, H., 1997. Early maturation in Amago salmon
(Oncorhynchus masu ishikawai): An association with energy storage. Can. J Fish.
Aquat. Sci. 54, 444-451.
Skilbrei, O.T., 1988. Growth pattern of pre-smolt Atlantic salmon (Salmo salar L.):
the percentile increment method (PIM) as a new method to estimate length-
dependant growth. Aquaculture 69, 129-143.
Skilbrei, O.T., 1991. Importance of threshold length and photoperiod for the
development of bimodal length-frequency distribution in Atlantic salmon (Salmo
salar). Can. J Fish. Aquat. Sci. 48, 2163-2172.
Solbakken, V.A., Hansen, T., Stefansson, S.O., 1994. Effects of photoperiod and
temperature on growth and parr-smolt transformation in Atlantic salmon (Salmo

18
salar L.) and subsequent performance in seawater. Aquaculture 121, 13-27.
Stead, S.M., Houlihan, D.F., McLay, H.A., Johnstone, R., 1996. Effect of ration and
seawater transfer on food consumption and growth of Atlantic salmon (Salmo salar)
smolts. Can. J Fish. Aquat. Sci. 53, 1030-1037.
Storebakken, T., Austreng, E., 1987. Ration level for salmonids I. Growth, survival,
body composition, and feed conversion in Atlantic salmon fry and fingerlings.
Aquaculture 60, 189-206.
Thorpe, J.E., 1977. Bimodal distribution of length of juvenile Atlantic salmon (Salmo
salar L.) under artificial rearing conditions. J Fish Biol. 11, 175-184.
Thorpe, J.E., 1986. Age at first maturity in Atlantic salmon, Salmo salar: Freshwater
period influences and conflicts with smolting. In: Meerburg, D.J., (Ed.) Salmonid
age at maturity. Can. Spec. Pub. Fish. Aquat. Sci.., pp. 7-14.
Thorpe, J.E., 1987. Environmental regulation of growth patterns in juvenile Atlantic
salmon. In: Summerfelt, R. C., Hall, G. E., (Ed.) The age and growth of fish. Iowa
State University Press: Ames, Iowa. pp.463-474
Torstensen, B.E., Lie, Ø., Hamre, K., 2001. A factorial experimental design for
investigation of effects of dietary lipid content and pro- and antioxidants on lipid
composition in Atlantic salmon (Salmo salar) tissues and lipoproteins. Aquaculture
Nutrition 7, 265-276.
Weatherley, A.H., Gill, H.S., 1981. Recovery growth following periods of restricted
rations and starvation in rainbow trout Salmo gairdneri Richardson. J Fish Biol.
18, 195-208.
Woo, N.Y.S., Bern, H.A., Niskioka, R.S., 1978. Changes in body composition
associated with smoltification and premature transfer to seawater in coho salmon
(Oncorhynchus kisutch) and king salmon (O. tschawytscha). J Fish Biol. 13, 421-

19
428.
Zar, J.H., 1999. Biostatistical analysis. 4th Ed., Prentice Hall: Upper Saddle River,
New Jersey. 662pp.

20
Table 1. The formulations used to create two experimental diets (EWOS; UK)
containing either 12.5% or 25% lipid inclusion. a) crumble diet formulation, b) pellet
diet formulation. The fish oil (Cargill; Liverpool, UK) used was primarily herring oil.
Percentage inclusion a) Constituent
12.5% diet 25% diet
Low temperature fish meal (LT94) 50 65
Wheat 15 14
Soybean meal 17 -
Rapeseed meal 9 - Fry
vitamin/mineral 1 1
Finnstim 1 1
Fish oil 7 19
Percentage inclusion b) Constituent
12.5% diet 25% diet
Low temperature fish meal (LT94) 50 67
Wheat 15 13
Soybean meal 17 - Rapeseed meal 10 -
Fry vitamin/mineral 1 1
Finnstim 1 1 Fish oil 6 18

21
Fig. 1. Ambient water temperatures experienced during experiments in which
Atlantic salmon parr were reared using different dietary lipid inclusions (a) or ration
levels (b). Between ‘x’ and ‘y’ water temperatures were artificially elevated to
improve early rearing. The percentage lipid inclusions used during the dietary lipid
experiment are shown relative to the temperature profile; i) 25% throughout
development, ii) 25% until 21st June, 12.5% thereafter, iii) 12.5% until 21st June 25%
thereafter, iv) 12.5% throughout development.
Fig. 2. Changes in weight of Atlantic salmon parr reared using different dietary lipid
inclusions (a) or ration levels (b) (mean ± S.E.M., n=3 for the lipid experiment, n=2
for the ration experiment). Figure legends denote the dietary lipid inclusions and daily
rations experienced in the respective experiments. Differences in lettering denotes
statistical differences (P<0.05). Where lettering has been stacked it is displayed in the
same order as the graph lines.
Fig. 3. Changes in condition factor of Atlantic salmon parr reared using different
dietary lipid inclusions (a) or ration levels (b) (mean ± S.E.M., n=3 for the lipid
experiment, n=2 for the ration experiment). Figure legends denote the dietary lipid
inclusions and daily rations experienced in the respective experiments. Differences in
lettering denotes statistical differences (P<0.05). Where lettering has been stacked it
is displayed in the same order as the graph lines.
Fig. 4. Changes in the whole body lipid content of Atlantic salmon parr reared using
different dietary lipid inclusions (a) or ration levels (b) (mean ± S.E.M., n=3 for the
lipid experiment, n=2 for the ration experiment). Figure legends denote the dietary

22
lipid inclusions and daily rations experienced in the respective experiments.
Differences in lettering denotes statistical differences (P<0.05). Where lettering has
been stacked it is displayed in the same order as the graph lines.
Fig. 5. Changes in the gill Na+, K+-ATPase activities of upper modal group Atlantic
salmon parr reared using different dietary lipid inclusions (a) or ration levels (b)
(mean ± S.E.M., n=3 for the lipid experiment, n=2 for the ration experiment). Figure
legends denote the dietary lipid inclusions and daily rations experienced in the
respective experiments. Differences in lettering denotes statistical differences
(P<0.05).
Fig. 6 The structure of Atlantic salmon parr populations recorded at the conclusion of
experiments (mid May) in which groups of fish were reared using different dietary
lipid inclusions (a) or ration levels (b). Figure legends denote the dietary lipid
inclusions and daily rations experienced in the respective experiments. Closed bars
denote the length-frequency structure of a population sample (n=180 for the lipid
experiment, n=100 for the ration experiment), open bars denote the percentage of
UMG and LMG fish from the entire population (mean ± S.E.M., n=3 for the lipid
experiment, n=2 for the ration experiment). Differences in lettering denotes statistical
differences (P<0.05). Capital lettering denotes between treatment differences in either
UM or LM groups, lower case lettering denotes within treatment differences between
UM and LM groups.

23
Fig. 1
Mar 00 Jun 00 Sep 00 Dec 00 Mar 01 Jun 01
02
468
10
1214
1618
x
y
25%
25%
25%
25% 25%
12.5%12.5%
12.5%
12.5% 12.5%
i)
ii)
iii)
iv)
Die
tary
lipi
d
Date
Apr 01 Jun 01 Aug 01 Oct 01 Dec 01 Feb 02 Apr 02 Jun 02
Tem
pera
ture
(o C)
0
2
4
6
8
10
12
14
16
18
x
y
a)
b)

24
Fig. 2
a)
Mar 00 Jun 00 Sep 00 Dec 00 Mar 01 Jun 01
Wei
ght (
g) 0
10
20
30
40
50
25% throughout25% until 21th June, 12.5% thereafter12.5% until 21st June, 25% thereafter12.5% throughout
Change indietary lipid
b)
Date
Mar 01 Jun 01 Sep 01 Dec 01 Mar 02 Jun 02 0
10
20
30
40
50
Full rationTwo-thirds rationOne-third ration
aab
c
a
a
a
aa
a a
a
a a
b b
bb b
b b
b
b
b
cc c c c c c c
c

25
Fig. 3
a)
Jun 00 Sep 00 Dec 00 Mar 01 Jun 01
Con
ditio
n fa
ctor
0.00
1.00
1.05
1.10
1.15
1.20
1.25
1.30
1.35
25% throughout25% until 21st June, 12.5% thereafter12.5% until 21st June, 25% thereafter12.5% throughout
b)
Date
Jun 01 Sep 01 Dec 01 Mar 02 Jun 02 0.00
1.00
1.05
1.10
1.15
1.20
1.25
1.30
1.35
Full rationTwo-thirds rationOne-third ration
Change indietary lipid
aabb
aab
aabb
aabb

26
Fig. 4
a)
Mar 00 Jun 00 Sep 00 Dec 00 Mar 01 Jun 01
Who
le b
ody
lipid
leve
l (%
wet
wei
ght)
0
2
4
6
8
10
12
25% throughout25% until 21st June, 12.5% thereafter12.5% until 21st June, 25% thereafter12.5% throughout
b)
Date
Mar 01 Jun 01 Sep 01 Dec 01 Mar 02 Jun 02 0
2
4
6
8
10
12
Full rationTwo-thirds rationOne-third ration
aa
bb
aa
bb
abb
aab
aa
aa
aa
aa a
abaa
aa a
a aa
aa
bb
bb
bb
bb
bcc b
b bb b
b bb
bb
a
a
bb
b
b bb
a
a
aa
a
aab
aa
a
b
b
Change indietary lipid
aab a
ab
27
Fig. 5
a)
Feb 01 Mar 01 Apr 01 May 01 Jun 01
Na+ , K
+ -AT
Pase
( µm
ol A
DP
hydr
olys
ed. m
g-1. p
rote
in-1
. h-1
)
0
2
4
6
8
10
12
25% throughout25% until 21st June, 12.5% thereafter12.5% until 21st June, 25% thereafter12.5% throughout
b)
Date
Feb 02 Mar 02 Apr 02 May 02 Jun 02 0
2
4
6
8
10
12
Full rationTwo-thirds rationOne-third ration

28
Fig. 6
25% throughout
0
20
40
60
80
100
25% until 21st June,12.5% thereafter
0
20
40
60
80
100
12.5% until 21st June,25% thereafter
0
20
40
60
80
100
12.5% throughout
Length (mm)
80 100 120 140 160 180 200
Freq
uenc
y (%
)
0
20
40
60
80
100
Aa
Ab
Aa
Ab
Ab
Aa
Aa
Aa
a)
Fullration
0
20
40
60
80
100
Two-thirdsration
0
20
40
60
80
100
One-thirdration
Length (mm)
80 100 120 140 160 180 2000
20
40
60
80
100
Freq
uenc
y (%
)
Aa
Ab
Ba
Ab
Bb
Ca
b)