The Influence of Corporate Social Responsibility ...574464/FULLTEXT01.pdf · Social Responsibility...
44
Damiao Xu and Duo Yang The Influence of Corporate Social Responsibility Initiatives on University Students’ Buying Behavior Business Administration Master’s Thesis 15 ECTS Term: Spring 2012 Supervisor: Sveinung Jorgensen
Transcript of The Influence of Corporate Social Responsibility ...574464/FULLTEXT01.pdf · Social Responsibility...
Damiao Xu and Duo Yang
The Influence of Corporate
Social Responsibility Initiatives on University Students’ Buying
Behavior
Business Administration Master’s Thesis
15 ECTS
Term: Spring 2012
Supervisor: Sveinung Jorgensen
ASTRACT
Existing literature shows that consumer loyalty; consumer attitude; product evaluation;
and word-of-mouth are aspects that play an important role in consumers’ buying
behavior and are likely to be influenced by companies’ CSR initiatives. The purpose
of this thesis is to test whether companies’ CSR initiatives have impact on university
students’ buying behavior with regard to these four aspects. Four hypotheses are
formulated accordingly.
The quantitative research method is chosen to serve the research purpose. Data is
collected through self-complemented questionnaire. Questionnaires have been sent to
Karlstad University’s students who are the samples of this thesis.
The finding of this thesis shows that company’s CSR initiatives have significant
influence on all four aspects. However, some indicators, which are suggested by the
existing literatures as important, are not proved to play an important role on our
respondents’ behavior of purchasing.
These indicators are resistance to switching to competitor to the aspect of consumer
loyalty; product price to the aspect of product evaluation and shared information of
employee behavior to the aspect of word-of-mouth. This means these indicators
unlike what the existing literature claims are not relevant in the university students’
buying behavior.
Key words: Corporate social responsibility; consumer behavior; consumer loyalty;
consumer attitude; product evaluation; word-of-mouth
TABLE of CONTENTS
Table of Contents
1. Introduction ............................................................................................................. 4
1.1. Background .................................................................................................. 4
1.2. Research Problem ........................................................................................ 6
1.3. Purpose and Research Question .................................................................. 7
1.4. Definition of CSR ........................................................................................ 7
1.5. Structure of Research ................................................................................... 8
2. Theoretical Framework ........................................................................................... 9
2.1. Corporate Social Responsibility and Consumer Behavior .......................... 9
2.2. CSR Initiatives and Four Aspects of Consumer Behavior ........................ 10
2.2.1. Consumer Loyalty .......................................................................... 10
2.2.2. Consumer Attitude .......................................................................... 11
2.2.3. Product Evaluation ......................................................................... 12
2.2.4. Word-of-Mouth (WOM) ................................................................. 12
2.3. Overall Model ............................................................................................ 13
3. Methodology ......................................................................................................... 15
3.1. Research Method ....................................................................................... 15
3.2. Sampling and Data Collection ................................................................... 15
3.3. Questionnaire Design ................................................................................ 17
3.3.1. Basic Data Description ................................................................... 18
3.4. Validity and Reliability ............................................................................. 19
3.4.1. Validity of the Questionnaire ......................................................... 19
3.4.2. Reliability ....................................................................................... 20
4. Results and Analysis ............................................................................................. 21
4.1. Statistical Package for the Social Sciences (SPSS) ................................... 21
4.2. Regression Analysis .................................................................................. 21
4.3. Statistical Significance .............................................................................. 22
4.3.1. P-value ............................................................................................ 22
4.3.2. Z-value ............................................................................................ 22
4.4. Median and Skewness Value ..................................................................... 23
4.4.1. Median ............................................................................................ 23
4.4.2. Skewness Value .............................................................................. 23
4.5. The Model Fit of the Hypotheses .............................................................. 24
4.5.1. Model Fit of Hypothesis One: There is a positive relationship
between company’s CSR initiatives and university students’ loyalty towards
their products. .............................................................................................. 24
4.5.2. Model Fit of Hypothesis Two: There is a positive relationship
between company’s CSR initiatives and university students’ attitude
towards their products. ................................................................................. 26
4.5.3. Model Fit of Hypothesis Three: There is a positive relationship
between company’s CSR initiatives and university students’ product
evaluation towards their products. ............................................................... 27
4.5.4. Model Fit of Hypothesis Four: There is a positive relationship
between company’s CSR initiatives and university students’ word-of-mouth
towards their products. ................................................................................. 29
5. Conclusion, Limitations and Future Research ...................................................... 31
5.1. Conclusion ................................................................................................. 31
5.2. Limitations ................................................................................................. 31
5.3. Further research ......................................................................................... 32
6. Reference .............................................................................................................. 33
7. Appendix ............................................................................................................... 37

4
1. Introduction
1.1. Background
Nowadays in the highly globalized economic system, along with rapid
development of the society, the change of social environment and the increasing
consumer awareness, enterprises have been expected to take more social
responsibility. Under increasing pressure companies have been showing good
corporate responsibility in each country which they operate their business
(Pinkston & Carroll, 1994 according to Morsing and Beckmann, 2006:165a).
Nowadays, companies perform ethical, economic and legal obligations not only
towards their shareholders but also for their customers, employees and other
stakeholders and so on (Sen and Bhattacharya, 2001 according to Morsing and
Beckmann, 2006: 165b). Many enterprises have shifted their positioning from
pure profit-seeking economic entities to responsible citizens who have a strong
sense of social responsibility. Corporate social responsibility has become an
important concern of many companies. Since globalization has contributed to the
increase number of multinational companies and their global supply chains,
different national governments and intergovernmental bodies establish acceptable
social norms of behavior in order to monitor these companies. It is important for a
company to take corporate social responsibility in their business to deal with the
problems about environment protection, sustainable development, human
resources management and security (Industry Canada 2012). A company cannot
just pursuit for profit at the cost of neglecting the issues of environmental
contamination, community sustainable development, product quality and the
employee welfare. Undertaking corporate social responsibility (CSR) has become
a vital factor for a company to achieve the goal for sustainable management.
Corporate social responsibility is also a very important component for a company
to build enterprise competitiveness. CSR is changing the business rules gradually;
many enterprise managers have realized that CSR is an absolutely necessary
element in the company’s development. After the competition of price and
quality, the competition of CSR initiatives is an important symbol in the new
round of international competition. Some large enterprise and multinational
5
corporations start to include CSR promotion in their business strategies and regard
relevant CSR strategies as important parts in their core business operations. They
release CSR reports at regular intervals and establish the “corporate social
responsibility” column on their company website to show their conditions of
perform social responsibility to the public. These enable these companies to gain
more competitiveness advantages in market competitions. It is thus clear that to be
responsible for corporate social responsibility have become an important trend for
companies’ future development. In the 21 century corporate social responsibility
has been viewed as the entry ticket for companies to doing their business (Altman,
1998 according to Morsing and Beckmann, 2006: 165c).
Companies use different ways to show their corporate social responsibility
practices which related to employee welfare, environment, community, charities
and so on. Companies dedicating themselves into a serious of CSR practices
because they believed that customers provide more support to the responsible
companies. Obtaining customers’ support and having loyal customers are very
important aspects for the operations of modern enterprises.
A company’s external environment is primarily composed of various
stakeholders, and the consumers occupy an important position among these
stakeholders. The consumers’ purchasing behavior may directly influence a
company’s performance and development. The consumers’ behaviors and
decisions have significant influence on a company’s profit, and they are very
important indicators to evaluate a company’s management conditions. There are
many methods can help a company to get consumer’ support and loyalty, one
effective way is to establish good corporate prestige in the minds of consumers.
The corporate prestige is important because it is an “effective weapon” to build a
company’s sustainable competitive advantage and to build trust from
stakeholders, especially for their consumers.
A company can improve their corporate prestige by fulfilling their corporate
social responsibility. Because the CSR activities of a company can strengthen the
company’s prestige, and promote consumers’ impression of the company,
6
increase the trust between the company and the consumers, and thus influence
their purchasing behavior.
1.2. Research Problem
For a company, one of the most important challenges is to get trust and
recognition from their consumers. Whether or not a responsible company could
get more support is dependent on the customers’ decision. According to Brown
and Dacin (1997), usually consumers’ evaluation of a company’s image and
product is paralleled with the company’s corporate social responsibility. Some
consumers concerning the CSR initiatives when they buy products, they view
CSR as a referential factor for their purchase decision. Meanwhile, they resist the
products made by the irresponsible company. When doing the research about
corporate social responsibility, the consumer’s expectation and demand should
also be concerned. At the present, most of the CSR literatures were discussed
from the enterprise perspective, including the structure of CSR system, the ways a
company undertakes CSR and its influence and so on. But few researches have
been done from consumer’s perspective. Therefore, this paper tries to investigate
the effect of companies’ CSR initiatives on consumer buying behavior from the
consumers’ perspective.
Crowther and Rayman-Bacchus (2003) stated that there are several factors
influencing the corporate social responsibility such as top manager, shareholder,
government, civil society, consumer behavior and so on. They all play a role in
the corporate social responsibility strategy, and thus they are all of interesting
factors when doing research on corporate social responsibility initiatives.
However it is almost impossible to address all the factors in detail in a single
study. Therefore, we choose to focus on only one factor which is consumer
behavior. Consumer behavior is defined as “how individuals or group buy, use
and dispose of goods, services, ideas or satisfy their needs and wants” (Kotler et
al, 2009: 224). Being one of the key processes in the model of corporate social
responsibility initiatives, we are more interested in this factor’s influence on
university students.
7
Consumer can be divided into different groups by different categories with each
sub-group has its own specifications. In this thesis we will focus on the consumer
group of university students for the consideration that they are receiving higher
education, having more sense of the society’s sustainable development which is a
big issue of concern and discussion topic within university campus. It is
reasonable to believe that they are more sensible to the companies’ CSR
initiatives.
1.3. Purpose and Research Question
Existing literature shows that Company’s corporate social responsibility (CSR)
initiatives have effect on consumer buying behavior through four aspects:
consumer loyalty (Oliver 1999; Bhattacharya and Sen, 2004), consumer attitude
(Folkes and Kamins,1999; Becker-Olsen et al.,2006), product evaluation (Brown
and Dacin, 1997; Sen and Bhattacharya, 2001), and word-of-mouth (Herr et al,
1991; Carrigan and Attalla, 2001; Bhattacharya and Sen, 2004). As a group of
consumers, it is reasonable to assume that company’s CSR initiatives have
influence on University Students’ buying behavior in these four aspects too.
The purpose of this thesis is to test: Whether companies’ CSR initiatives have
impact on university students’ buying behavior with regard to these four aspects.
The research question is: Is there a positive relationship between company’s
corporate social responsibility initiatives and university students’ buying
behavior.
In order to answer the research question, a survey study is designed. A self-
complemented questionnaire is sent to a carefully selected sample in Karlstad
University in Sweden.
1.4. Definition of CSR
By now corporate social responsibility has been defined in many ways. In this
thesis Corporate social responsibility has been defined as “a company’s
commitment to minimizing or eliminating any harmful effects and maximizing its
long-run beneficial impact on society” (Harris et al, 2001: 47).
8
1.5. Structure of Research
This thesis consists of five major parts including introduction, theoretical
framework, methodology, result and analysis, and conclusion. The first part is
introduction which includes an overview of background, problem statement,
research question, purpose, structure. The second part is theoretical framework.
Articles from previous research are reviewed and findings are summarized. The
basic concepts, the corporate social responsibility initiatives as well as its four
aspects, attitude, loyalty, product evaluation, and word-of-mouth will be
discussed. The third part is methodology contains research method, sampling and
data collection, questionnaire design, data description and basic data description.
The fourth part is the result and analysis. This section is going to analyze data
which is collected from questionnaires. The final part is conclusion, limitations
and further research. This part will summarize previous findings from the analysis
parts and also will discuss limitations of this thesis.
9
2. Theoretical Framework
2.1. Corporate Social Responsibility and Consumer Behavior
Existing literature shows the influence of corporate social responsibility on
consumer buying behavior. Previous studies have proved that companies can get
benefits from conducting corporate social responsibility, CSR can influence
consumer’s behavior in many aspects such as purchase intent (Mohr and Webb,
2005 according to Morsing and Beckmann, 2006: 192d); product evaluations;
brand recommendations and product select (Brown and Dacin 1997; Drumwright,
1994 and Sen and Bhattacharya, 2001 according to Morsing and Beckmann,
2006:192e). Morsing and Beckmann (2006) also argued that the corporate social
responsibility influence not only on consumers’ purchasing decisions but also on
consumers’ evaluation of new products.
Since consumer attitude, loyalty, product evaluation, word-of-mouth are main
aspects that play a role in the consumer’s buying process (Schiffman and Kanuk,
2007); and company’s corporate social responsibility initiatives have been proved
to have effect on the same four aspects of consumer loyalty (Oliver 1999;
Bhattacharya and Sen, 2004), consumer attitude (Folkes and Kamins,1999;
Becker-Olsen et al.,2006), product evaluation (Brown and Dacin, 1997; Sen and
Bhattacharya, 2001), and word-of-mouth (Herr et al, 1991; Carrigan and Attalla,
2001; Bhattacharya and Sen, 2004). Therefore it is reasonable to believe that
consumer buying behavior has been affected by company’s CSR initiatives.
Existing literature have also shown that CSR initiatives have strong influence on
consumer purchasing behavior. Creyer and Ross (1997) stated that CSR initiatives
plays an important role in consumer purchase decisions; Similarly Boulstridge and
Carrigan (2000) proved that corporate socially responsible behavior could directly
influence on consumers’ purchasing behavior; and Carrigan and Attalla (2001)
showed that there is a positive relationship between CSR initiatives and consumer
behavior.
10
2.2. CSR Initiatives and Four Aspects of Consumer Behavior
2.2.1. Consumer Loyalty
Consumer loyalty is defined as “a deeply held commitment to re-buy or re-
patronize a preferred product/service consistently in the future (Oliver,
1999:34).” This indicates loyalty consumers prefer a company to other companies,
and they will keep on re-purchasing from this company in the future. In this
situation consumer’s loyalty can be a repeated purchasing behavior. Consumer’s
repeated purchasing behavior could be a top target for each company. Therefore to
attract consumer to do repeated purchasing behavior become one of the most
important challenges for every company. However, Pirsch et al (2007) stated that
company’ CSR initiatives could be an extremely helpful method to achieving it.
Bhattacharya and Sen (2004) pointed that if a consumer purchasing a company’s
product it means that the consumer has convinced of and identify with the
company’s CSR performance. For example, some animal protectors tend to buy
The Body Shop’s products because The Body Shop promises that they have never
tested products on animals.
Existing literature has shown that consumer loyalty have been influenced strongly
by company’s corporate social responsibility initiatives (Oliver 1999). Meanwhile
there is a positive relationship between company’s corporate social responsibility
initiatives and consumer’ loyalty (Bhattacharya and Sen, 2004). It may suggest
that if a company’s CSR initiatives are adequate, consumers will purchase other
company’s products or brands. Then the consumer’s loyalty is low. However, if a
company pay more attention to CSR performance, then consumers are more likely
to become loyal to the company. As a group of consumers, it is reasonable to
assume that this could happen on university students’ buying behavior. If the
company’s performance on CSR is good, then university students may re-
purchase the company’s products or bands in the future. As mentioned before, the
following hypothesis is proposed:
H1: There is a positive relationship between company’s CSR initiatives and
university students’ loyalty towards their products.
11
2.2.2. Consumer Attitude
Peter et al (1999:133) defined attitude as “a person’s favorable or unfavorable
feelings toward an object”. Previous literature has provided useful contribution on
consumer attitude with regard to its relation to the company’s CSR initiatives.
Meanwhile, more and more studies have shown that a company which promotes
CSR initiatives can lead consumers hold a positive attitude to this company.
Lafferty and Goldsmith (1999) conducted an experiment, they controlled
spokesperson and corporate credibility by using advertisement and newspaper; the
result showed that corporate credibility had significant influence on consumer
buying decision and consumer attitude to a brand, while a company’s
contributions to environmental protection and charity can reflect a positive
corporate credibility. Some marketing research found that consumers usually
patronize the company which takes CSR actively. For instance, Becker-Olsen et al
(2006) argued that CRS-based promotion should not be perceived as the reason to
a negative incident of the past or the motivation of increasing profit if it tends to
be the success. Folkes and Kamins (1999) mentioned that there is a relationship
between CSR initiatives and consumer attitude. Consumer attitudes can be
influenced by a company’s ethical behavior, and consumer attitude can influence
the consumer estimate of the company and its product. A company’s ethical
behavior can be viewed as an important factor which influences consumer buying
decision. When a product’s attribute is excellent, consumers appear to be more
willing to choices an ethically behaving company than chose an unethically
behaving company (Folkes and Kamins, 1999). Consumers are able to compare
the ethical behavior of different companies, while take the moral evaluation to
help them perform purchasing decision, as Folkes and Kamins (1999) argued CSR
will help companies to distinguish their products from competitors through
creating a superior consumer attitude towards a particular quality product. As a
group of consumers, it is reasonable to assume that this could happen on
university students’ buying behavior. If a company performs good CSR, then
university students show positive attitude toward the company’s products or
bands. As mentioned before, the following hypothesis is proposed:
12
H2: There is a positive relationship between company’s CSR initiatives and
university students’ attitude towards their products.
2.2.3. Product Evaluation
Product evaluation has been defined as “consumers’ judgment and choices among
alternatives based on marketer provided cues and on other sources of information
about product characteristics” (Cordell, 1997 according to Lee J.K. and Lee W.N.,
2009:142). According to Folkes and Kamins (1999:245), “a consumer has certain
associations with a firm and evaluates the firm accordingly”. Positive CSR
associations make consumers take a positive evaluation to the company, and the
positive CSR associations also have taken a positive effect on consumers’
response to the company’s product and service; in contrast, a negative
associations cause negative influence on consumers’ evaluation to the company
and its product(Brown and Dacin, 1997). This implies that the positive CSR can
enhance the company’s product evaluation, but negative CSR will harm the
company’s product evaluation. If a company provides consumers positive CSR
information to consumers, as a response the consumers will react positively to the
company (Brown and Dacin, 1997). Sen and Bhattacharya (2001) mentioned that
CSR initiatives have significant influence on consumers’ product evaluation, if a
consumer highly supports a company’s CSR activities, he or she usually believe
that this company which actively commit to CSR practices will be able to produce
decent products. As a group of consumers, it is reasonable to assume that this
situation could happen on university students. As mentioned before, the following
hypothesis is proposed:
H3: There is a positive relationship between company’s CSR initiatives and
university students’ product evaluation towards their products.
2.2.4. Word-of-Mouth (WOM)
Word-of-mouth has been defined as “informal communications between private
parties concerning evaluations of goods and services” and WOM has two
perspectives which are negative and positive (Anderson 1998:6). Both two
perspectives reflect a response to a company’s performance from consumer’s
13
view. For example: if the company’s performance meets or exceed consumer
expects, then consumer could share their positive purchasing experience to others;
while if the company’s performance does not good enough to meet consumer’s
expects, they also would like to communicate their negative purchasing
experience to someone else. Hence, WOM plays a vital role in consumer buying
decision and product evaluation (Herr et al, 1991). Furthermore, Bhattacharya and
Sen (2004) pointed out WOM also can be a foundation for helping CRS’ impact,
since the weakness of CSR initiatives is lack of consumers’ awareness, companies
should improve CSR commitment by various methods.
Previous studies show that WOM have been influenced by company’s corporate
social responsibility initiatives and there is a positive relationship between WOM
and CSR initiatives (Bhattacharya and Sen 2004). Indicating that if a company
perform a better CSR, then consumers would like to pay more money on the
company’s products; meanwhile the consumer recommends as well the
company’s products or brands to their friend. Even though some consumers who
themselves did not consider a company’s CSR initiatives during purchase
decision, they still recommend their friend to purchase socially responsible
company’s products or brands (Bhattacharya and Sen 2004). As a group of
consumers, it is reasonable to assume that this situation could happen on
university students too. Most university student would like share their purchasing
experiences to their friends. As mentioned before, the following hypothesis is
proposed:
H4: There is a positive relationship between company’s CSR initiatives and
university students’ word-of-mouth towards their products.
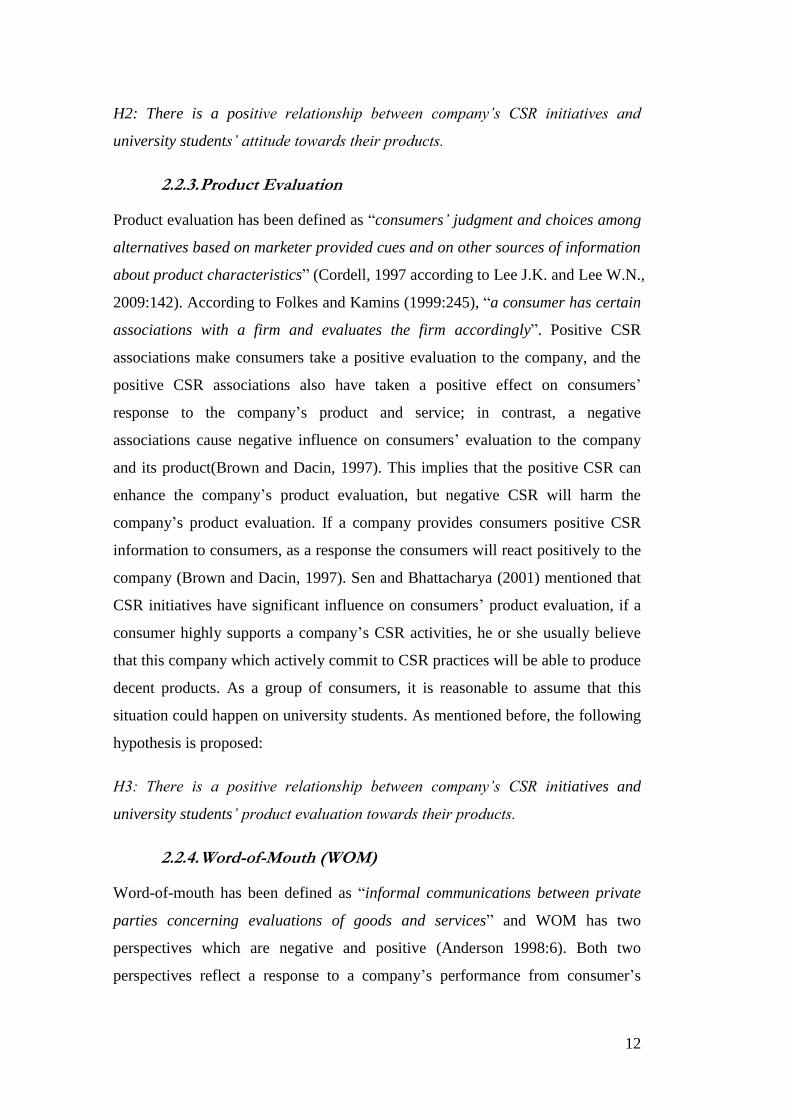
2.3. Overall Model
Figure 1: structural model of the hypotheses
14
This hypothetic model is based on the existing theories that have mentioned
before. According to this model CSR initiatives are supposed to have positive
impact on consumer buying behavior aspects of consumer loyalty, consumer
attitude, product evaluation and word of mouth respectively. This will be tested
and analyzed in the next parts of this thesis.
15
3. Methodology
3.1. Research Method
Generally, there are two types of research methods which are commonly used in
business studies. They are quantitative research and qualitative research.
Qualitative research is good at answering the research question of ‘why’ or ‘how’.
Quantitative research, on the other hand, is good at testing hypotheses. It
emphasizes quantification in the collection and analysis of data, in which strength
is placed on the testing of theories. This is exactly the research strategy this thesis
follows.
The quantitative research uses quantified data analysis for explaining research and
solving problems. Data from the quantitative research is based on variables and
numbers (Bryman & Bell, 2007). The data can easily be transferred into results.
This research is established based on questions and basic concepts, and it is used
for large-scale studies. The quantitative research is widely used in the deductive
approach of the theories and hypotheses (Bryman & Bell, 2007).
Our thesis aims to test the formulated hypotheses. It is deductive research in
nature. Quantitative research is suitable for the research purpose. Thus,
quantitative research will be used in this thesis.
Different methods have their own characteristics. Therefore, selecting a suitable
method plays an important role in investigations. According to the research aim
questionnaires have been chosen as the data collection method.
3.2. Sampling and Data Collection
In order to investigate CSR initiatives’ influence on buying behavior of university
students, we choose students from Karlstad University of Sweden as our sample.
It is based on several reasons: firstly, this university is one of the important
Swedish universities. Secondly, it is located in West part of Sweden and is the
only university in that area. And the students come from all over the country and
even different parts of the world. Thirdly, since the university pays more attention
to sustainability efforts such as making environment-friendly purchases and
16
journeys; reducing paper consumption; offers a good equality on students and so
on (Karlstad University 2012a); and “academic institution committed to
sustainability not only help students understand the roots of environmental
degradation and motivated them to seek environmentally sustainable practices but
also teaching the roots of today’s injustices in full integration with modeling
justice and humaneness (Clugston and Calder, 2002).” Therefore, it is reasonable
to believe that Karlstad University students could pay more attention to
companies’ CSR initiatives when they purchase products.
However, by now there are about 12,500 students in Karlstad University (Karlstad
University 2012b). It is hard to do a strict random sampling in such a large
population. Hence, for the convenience of the research, we decide to use snowball
sampling. According to Castillo (2009) snowball sampling is defined as “a non-
probability sampling technique that is used by researchers to identify potential
subjects in studies where subjects are hard to locate (Castillo 2009 according to
experiment resources.com).” It means by using this type of sampling technique
researchers can get their subject from the existing respondents. Then these
respondents will send the subject to others with the similar trait, thereby
expanding the sampling. In this situation, the researchers can get more
respondents. In this thesis, the questionnaire will be distributed online. Initially,
we will send the link of a website to our friends who study in Karlstad University.
And then our friends send the link to their friends in the same way. Finally, by
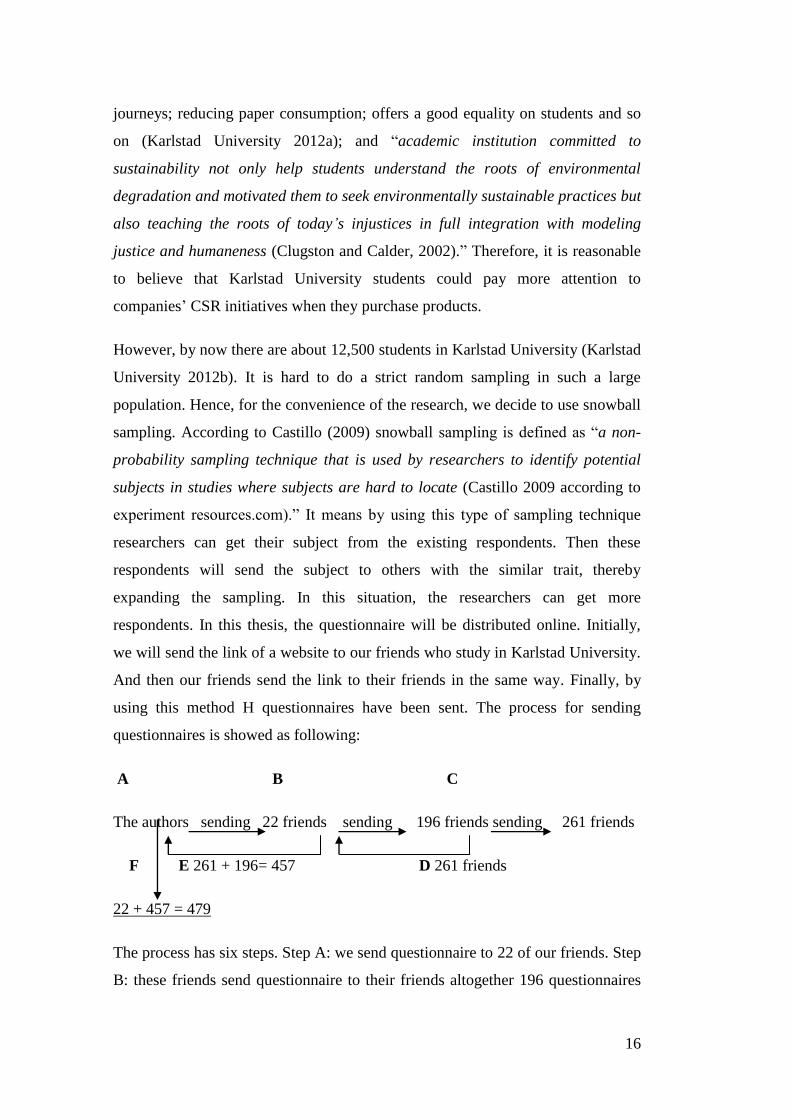
using this method H questionnaires have been sent. The process for sending
questionnaires is showed as following:
A B C
The authors sending 22 friends sending 196 friends sending 261 friends
F E 261 + 196= 457 D 261 friends
22 + 457 = 479
The process has six steps. Step A: we send questionnaire to 22 of our friends. Step
B: these friends send questionnaire to their friends altogether 196 questionnaires
17
are sent. Step C: 196 friends send questionnaire to their friends altogether 261
questionnaires are sent. Step D: 196 friends report the number of the
questionnaires that they sent to the friends mentioned in step B. Step E: 22 friends
calculate 457 questionnaires have been sent and then they report the number to us.
Step F: we totally calculate 479 questionnaires distributed for the study.
3.3. Questionnaire Design
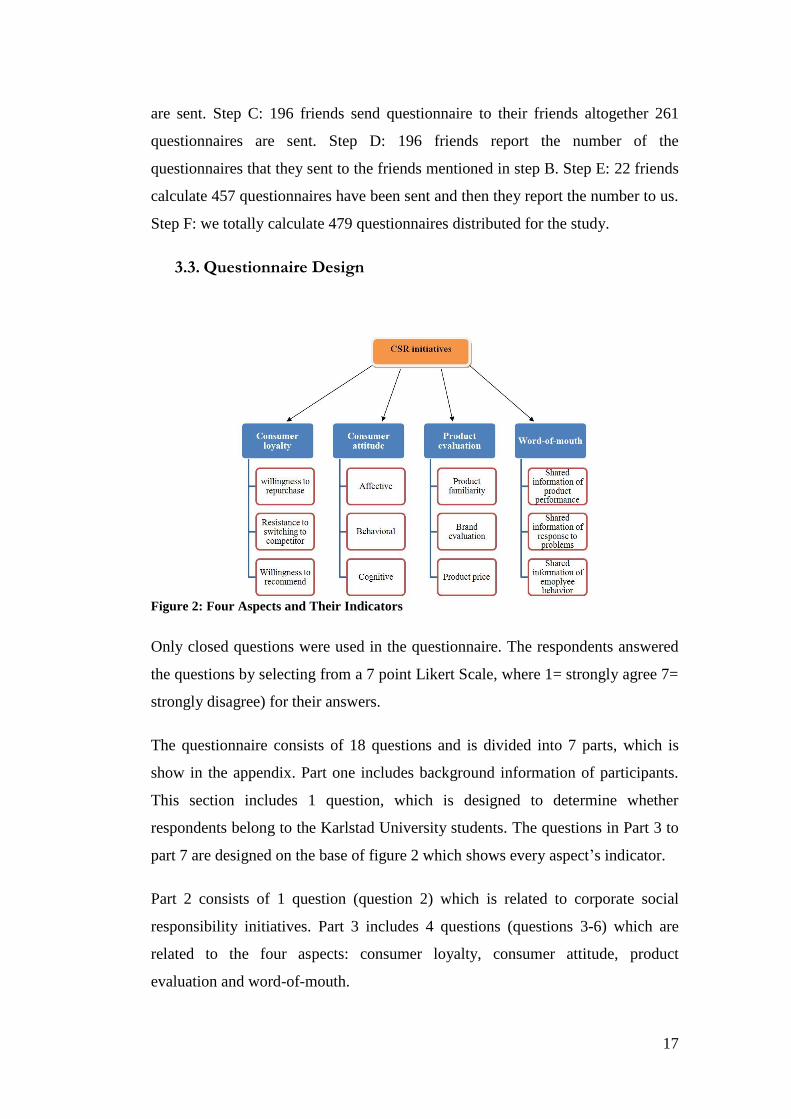
Figure 2: Four Aspects and Their Indicators
Only closed questions were used in the questionnaire. The respondents answered
the questions by selecting from a 7 point Likert Scale, where 1= strongly agree 7=
strongly disagree) for their answers.
The questionnaire consists of 18 questions and is divided into 7 parts, which is
show in the appendix. Part one includes background information of participants.
This section includes 1 question, which is designed to determine whether
respondents belong to the Karlstad University students. The questions in Part 3 to
part 7 are designed on the base of figure 2 which shows every aspect’s indicator.
Part 2 consists of 1 question (question 2) which is related to corporate social
responsibility initiatives. Part 3 includes 4 questions (questions 3-6) which are
related to the four aspects: consumer loyalty, consumer attitude, product
evaluation and word-of-mouth.
18
According to Uncles and Laurents (1997) there are three indicators related to the
understanding of consumer loyalty: first willingness to repurchase; second
resistance to switching to competitor that is superior to preferred shop and third
willingness to recommend preferred shop to friends and relatives. Part 4 consists
of 3 questions (questions 7-9) which measures consumer loyalty by using these
three indicators.
Solomon (2009) identifies three indicators of consumer attitude which are
affective (“the feeling an individual has regarding an object”); behavioral (“the
represents the emotion or opinion about a product or service”); and cognitive
(“an individual’s belief or knowledge about attitude object”). Thus, part 5
includes 3 questions (questions 10-12) which are related to these indicators of
consumer attitude.
Raju (1977) identifies three indicators of product evaluation which includes
product familiarity, brand name, and price. Therefore, part 6 includes 3 questions
(questions 13-15) which are related to these indicators of product evaluation.
According to Sundaram et al (1998) there are three indicators related to the
understanding of word of mouth: shared information of product performance,
shared information of response to problems and shared information of employee
behavior (such as employee dressing and the way of employee’s spoke). Hence,
part 7 includes 3 questions (questions 16-18) which are related to these indicators
of WOM
3.3.1. Basic Data Description
After a period of collection, 500 questionnaires have been stent, 479
questionnaires were completed and returned, indicating a respond rate of 95.8%.
There is no strict criterion of the acceptable respond rate. However in social
research a respond rate between 15% and 20% is regard to be acceptable
(Denscombe 2004). This means the respond rate of this thesis is relevant to
analysis. According to the aim of this research, the responses are trimmed. Those
respondents that are not drop in Karlsatd University fulltime students are taken
away. Thus, there are 441 questionnaires are left for analysis. The background
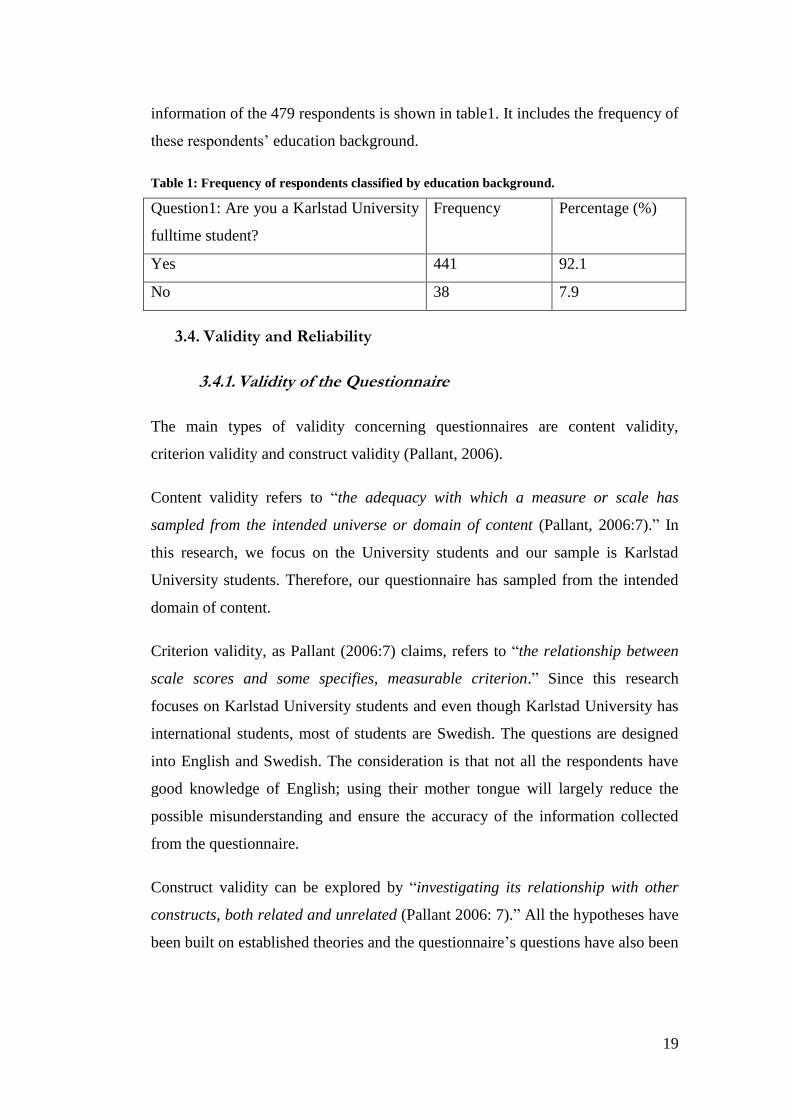
19
information of the 479 respondents is shown in table1. It includes the frequency of
these respondents’ education background.
Table 1: Frequency of respondents classified by education background.
Question1: Are you a Karlstad University
fulltime student?
Frequency Percentage (%)
Yes 441 92.1
No 38 7.9
3.4. Validity and Reliability
3.4.1. Validity of the Questionnaire
The main types of validity concerning questionnaires are content validity,
criterion validity and construct validity (Pallant, 2006).
Content validity refers to “the adequacy with which a measure or scale has
sampled from the intended universe or domain of content (Pallant, 2006:7).” In
this research, we focus on the University students and our sample is Karlstad
University students. Therefore, our questionnaire has sampled from the intended
domain of content.
Criterion validity, as Pallant (2006:7) claims, refers to “the relationship between
scale scores and some specifies, measurable criterion.” Since this research
focuses on Karlstad University students and even though Karlstad University has
international students, most of students are Swedish. The questions are designed
into English and Swedish. The consideration is that not all the respondents have
good knowledge of English; using their mother tongue will largely reduce the
possible misunderstanding and ensure the accuracy of the information collected
from the questionnaire.
Construct validity can be explored by “investigating its relationship with other
constructs, both related and unrelated (Pallant 2006: 7).” All the hypotheses have
been built on established theories and the questionnaire’s questions have also been
20
designed based on theories. This indicates that the questionnaire has good
construct validity.
3.4.2. Reliability
Reliability refers to the consistency of the measurement chosen for a certain
research. One common way to estimate the reliability is internal consistency.
Reliability coefficient is used to measure the internal consistency of the scales.
One of the most commonly used indicators of internal consistency is Cronbach’s
alpha coefficient. In general, the coefficient range is between 0 and 1. A good
level of a coefficient is higher than 0.8, indicating that the scale measures the
same way each time it is under the same condition with the same subjects. The
more the reliability coefficient is closer to 1, the higher the internal consistent is
higher between aspects and indicators. This research reliability of results has been
estimated through a computer program Statistical Package for Social Sciences
(SPSS). According to Bryman and Bell (2007), the scales are believed to be
reliable when Cronbach’s alpha coefficients are larger than 0.8. And the results
are shown in table 2.
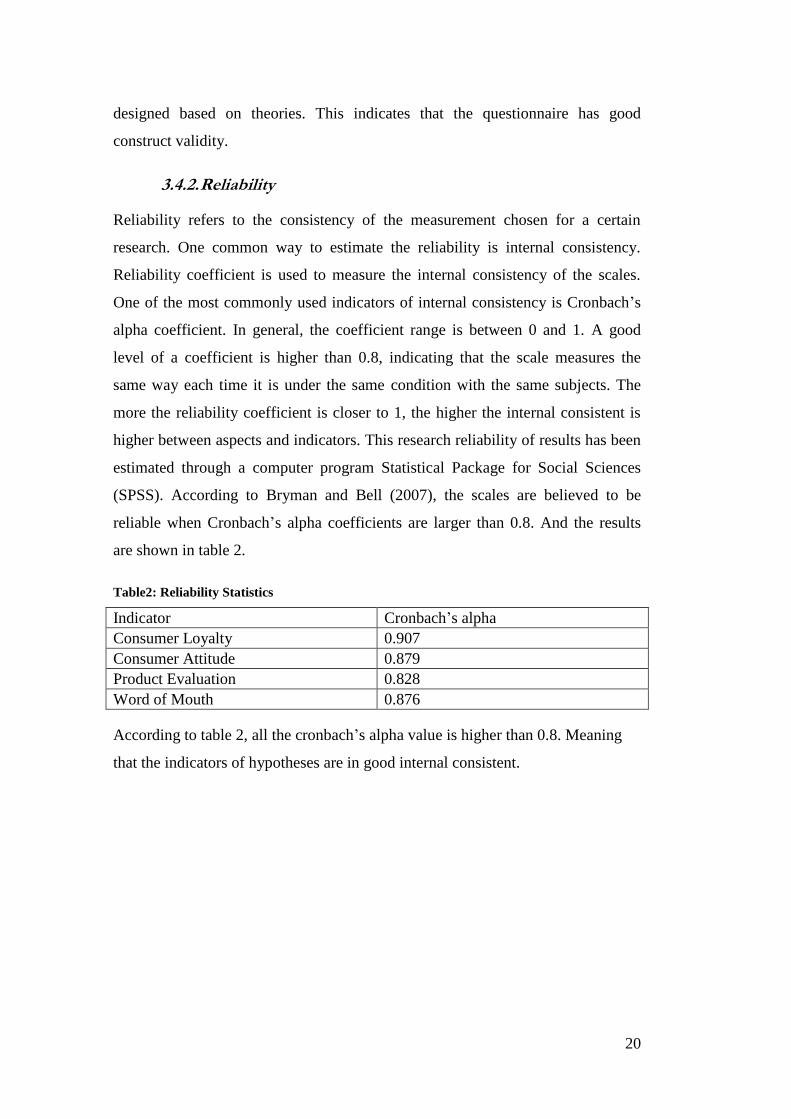
Table2: Reliability Statistics
Indicator Cronbach’s alpha
Consumer Loyalty 0.907
Consumer Attitude 0.879
Product Evaluation 0.828
Word of Mouth 0.876
According to table 2, all the cronbach’s alpha value is higher than 0.8. Meaning
that the indicators of hypotheses are in good internal consistent.
21
4. Results and Analysis
4.1. Statistical Package for the Social Sciences (SPSS)
SPSS has been chosen to analyze the data. Because SPSS is one of the most
popular software used in social science research. Second, according to Collier
(2009) SPSS for completing analysis for a one-off small dissertation, that
appraisal is most certainly correct. Third, SPSS is very common used to test
quantitative research; build structural equation model and do regression analysis.
Therefore, we choose this software to analyze data.
4.2. Regression Analysis
Regression analysis “is a statistical technique that attempts to explain movements
in the dependent variable, as a function of movements in a set of independent
variable (or variables), through the quantification of equation” (Studenmund,
2006: 6). Usually this quantification of equation can set a type of regression
model which is single-equation linear regression model.
Single-equation linear regression model is the simplest model which shows
relationship between a dependent variable and only one independent variable. For
example Y=B+AX this equation states that Y is the dependent variable; X is the
independent variable; B is the constant. Y will change when X increases by one
unit; and Y also will change when X decrease by one unit. Furthermore if A is
positive then there is a positive relationship between the dependent variable (Y)
and independent variable (X); if A is negative then there is a negative relationship
between the dependent variable (Y) and independent variable (X). In this research
single- equation linear regression model is used to test our hypotheses if they are
supported. For example, the aim of this research is to test if company’s CSR
initiatives have impact on the four aspects of consumer buying behavior
respectively. The null hypothesis is that the answers that support the statement are
the same as the answers that are against them. Initially, we assume that all the null
hypotheses are true. Then we set a single-equation linear regression model of all
aspects: Y=B+AX. If A is positive and X’s p-value is smaller than 0.05 (this will
be described as following paragraph), then this result lead us to support null
22
hypothesis, then we can get the conclusion that the answers that agree with a
certain statement are significantly more than answer that disagree with the
statements.
4.3. Statistical Significance
4.3.1. P-value
Since “t-test is the test that usually use to test hypotheses about individual
regression slope coefficients” (Studenmund, 2006:121). Meaning that t-test can
help us to know about each aspect’s significance. One of the most commonly used
parameter to measure the significance is p-value. In general if p-value is lower
than 0.05 at 95% confidential internal (95% CI), then there is a significant
relationship between the dependent and the independent variables (Studenmund,
2006:129).
4.3.2. Z-value
The Z-value is used as a main indicator to illustrate the distributions of the
answers. Because “Z-valued is appropriate for large random samples selected
from general population which with few limitations on the probability distribution
of the underlying population (McClave et al, 1998:869).” Meaning that Z-value
can help us to know about the probability of pretention university students from a
large random samples. Moreover, the Z-value can lead us to judge whether
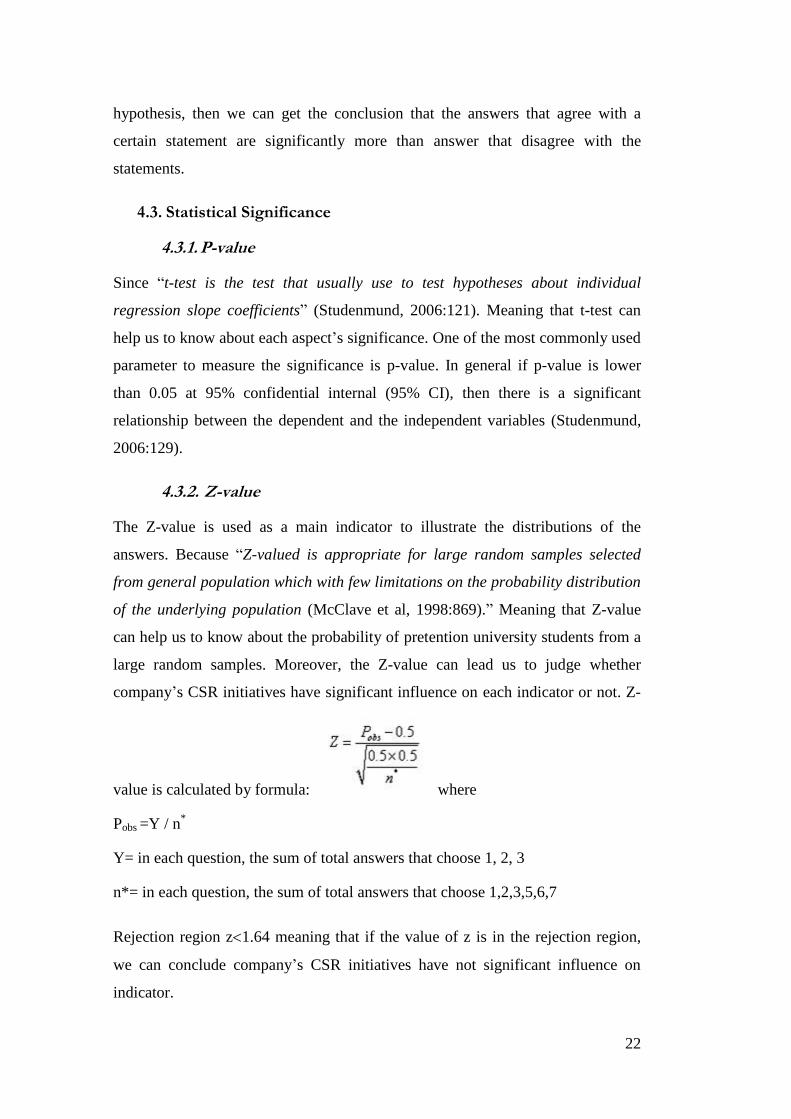
company’s CSR initiatives have significant influence on each indicator or not. Z-
value is calculated by formula: where
Pobs =Y / n*
Y= in each question, the sum of total answers that choose 1, 2, 3
n*= in each question, the sum of total answers that choose 1,2,3,5,6,7
Rejection region z1.64 meaning that if the value of z is in the rejection region,
we can conclude company’s CSR initiatives have not significant influence on
indicator.
23
The Z-value of results has been calculated through a computer program Minitab in
order to improve the accuracy of the results. 9 indicators’ Z-values are >1.64.
And 3 indicators’ Z-value is <1.64. The results are shown in table 4; 8 and 10.
4.4. Median and Skewness Value
4.4.1. Median
We also adopt median and skewness value of the answers in order to examine the
distribution pattern. In statistics, median is defined as “the middle number when
the measurements are arranged in ascending or descending order (McClave et al,
1998:55).” Meaning that median is the number which 50% respondents of the
answers drop to the side that is less than that and the other 50% drop to the side
that is large than the median value. For example, median value of Y1.2 (in table 3)
is 3.00. It means that 50% respondents have chosen degree 3 or less on the Likert
scale. Degrees less than or equal 3 indicates that the respondents positively agree
with the statements. Hence, Y1.2 can be regarded as being supported. Hence, for
this thesis smaller median numbers indicate that the statements get more support
from the respondents. For instance, median value of Y1.2 is 3.00 and median value
of Y1.1 is 4.00 (in table 3). Indicating Y1.2 get more support than Y1.1.
4.4.2. Skewness Value
According to Pallant (2006), skewness is a measure of the degree of asymmetry of
a distribution. Skewness value can be a positive or negative value. In general,
when the skewness value is positive, it means that the answers have a left-skewed
distribution pattern. The greater skewness value the higher degree of left-skewed.
When skewness value is negative, it means that the answers have a right-skewed
distribution pattern. The smaller skewness value the higher degree of right-
skewed (Marques de Sa 2007:64). When skewness value is negative, it means that
the answers have a right-skewed distribution pattern. The smaller skewness value
the higher degree of right-skewed (Marques de Sa 2007:64). For example, Y3.2
and Y3.3 (in table 8), skewness value of Y3.3 is -0.016 which is negative, meaning
that the answers of Y3.3 shows a right-skewed distribution pattern. Skewness value
24
of Y3.2 is 0.568 which is positive. It means that Y3.2 shows a left-skewed
distribution pattern.
4.5. The Model Fit of the Hypotheses
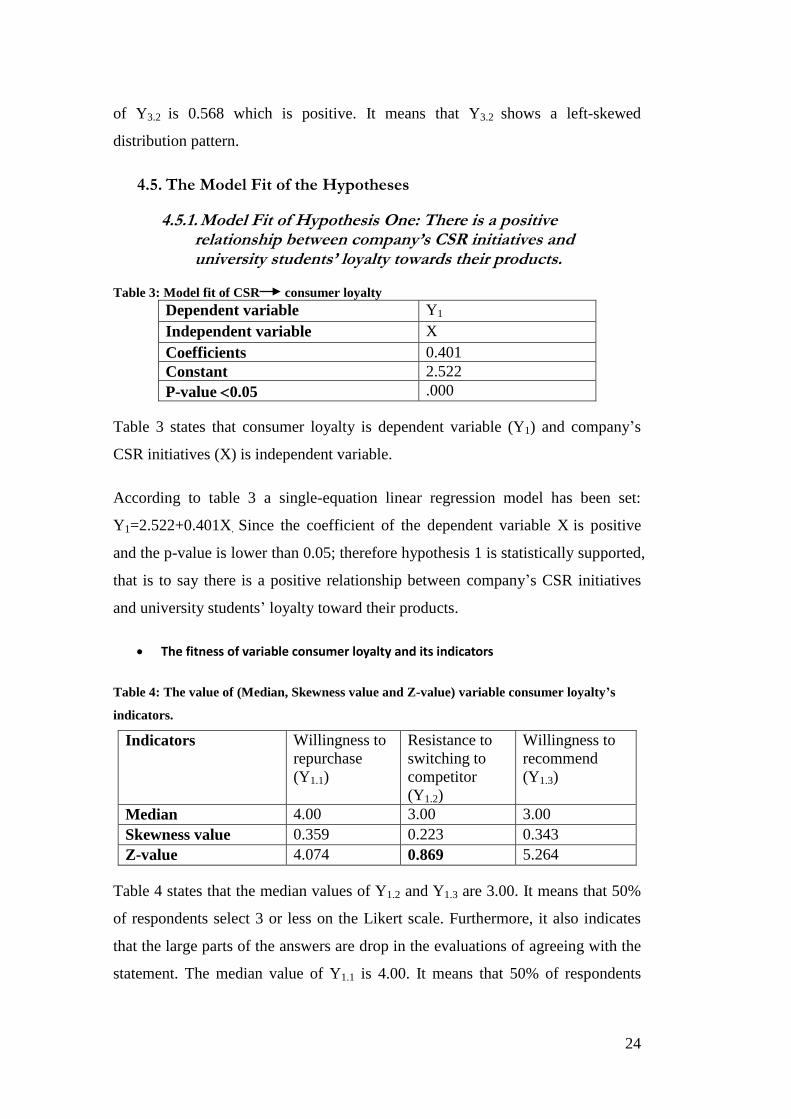
4.5.1. Model Fit of Hypothesis One: There is a positive relationship between company’s CSR initiatives and university students’ loyalty towards their products.
Table 3: Model fit of CSR consumer loyalty
Dependent variable Y1
Independent variable X
Coefficients 0.401
Constant 2.522
P-value 0.05 .000
Table 3 states that consumer loyalty is dependent variable (Y1) and company’s
CSR initiatives (X) is independent variable.
According to table 3 a single-equation linear regression model has been set:
Y1=2.522+0.401X. Since the coefficient of the dependent variable X is positive
and the p-value is lower than 0.05; therefore hypothesis 1 is statistically supported,
that is to say there is a positive relationship between company’s CSR initiatives
and university students’ loyalty toward their products.
The fitness of variable consumer loyalty and its indicators
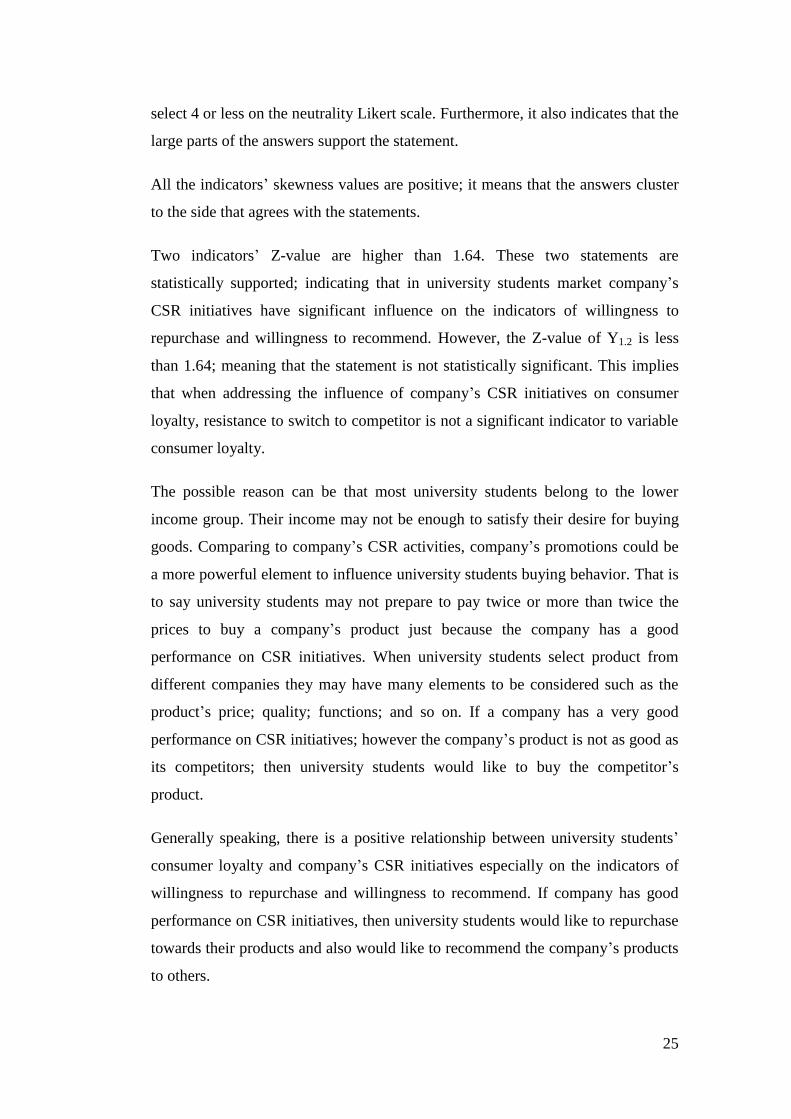
Table 4: The value of (Median, Skewness value and Z-value) variable consumer loyalty’s
indicators.
Indicators Willingness to
repurchase
(Y1.1)
Resistance to
switching to
competitor
(Y1.2)
Willingness to
recommend
(Y1.3)
Median 4.00 3.00 3.00
Skewness value 0.359 0.223 0.343
Z-value 4.074 0.869 5.264
Table 4 states that the median values of Y1.2 and Y1.3 are 3.00. It means that 50%
of respondents select 3 or less on the Likert scale. Furthermore, it also indicates
that the large parts of the answers are drop in the evaluations of agreeing with the
statement. The median value of Y1.1 is 4.00. It means that 50% of respondents
25
select 4 or less on the neutrality Likert scale. Furthermore, it also indicates that the
large parts of the answers support the statement.
All the indicators’ skewness values are positive; it means that the answers cluster
to the side that agrees with the statements.
Two indicators’ Z-value are higher than 1.64. These two statements are
statistically supported; indicating that in university students market company’s
CSR initiatives have significant influence on the indicators of willingness to
repurchase and willingness to recommend. However, the Z-value of Y1.2 is less
than 1.64; meaning that the statement is not statistically significant. This implies
that when addressing the influence of company’s CSR initiatives on consumer
loyalty, resistance to switch to competitor is not a significant indicator to variable
consumer loyalty.
The possible reason can be that most university students belong to the lower
income group. Their income may not be enough to satisfy their desire for buying
goods. Comparing to company’s CSR activities, company’s promotions could be
a more powerful element to influence university students buying behavior. That is
to say university students may not prepare to pay twice or more than twice the
prices to buy a company’s product just because the company has a good
performance on CSR initiatives. When university students select product from
different companies they may have many elements to be considered such as the
product’s price; quality; functions; and so on. If a company has a very good
performance on CSR initiatives; however the company’s product is not as good as
its competitors; then university students would like to buy the competitor’s
product.
Generally speaking, there is a positive relationship between university students’
consumer loyalty and company’s CSR initiatives especially on the indicators of
willingness to repurchase and willingness to recommend. If company has good
performance on CSR initiatives, then university students would like to repurchase
towards their products and also would like to recommend the company’s products
to others.

26
4.5.2. Model Fit of Hypothesis Two: There is a positive relationship between company’s CSR initiatives and university students’ attitude towards their products.
Table 5: Model fit of CSR consumer attitude
Dependent variable Y2
Independent variable X
Coefficients 0.477
Constant 2.143
P-value 0.05 .000
Table 5 states that consumer loyalty (Y2) is dependent variable and company’s
CSR initiatives is independent variable (X).
According to table 5 a single-equation linear regression model has been set:.
Y2=2.143+0.477X. Since the coefficient of the dependent variable X is positive
and the p-value is lower than 0.05; therefore hypothesis 2 is statistically supported,
that is to say there is a positive relationship between company’s CSR initiatives
and university students’ attitude toward their products.
The fitness of variable consumer attitude and its indicators
Table6: The value of (Median, Skewness value and Z-value) variable consumer attitude’s
indicators.
Indicators Affective (Y2.1) Behavior (Y2.2) Cognitive (Y2.3)
Median 3.00 3.00 3.00
Skewness value 0.608 0.787 0.514
Z-value 9.538 8.444 9.154
Table 6 shows that the median value of all indicators is 3.00. It means that 50% of
the respondents select 3 or less on the Likert scale. Furthermore, it also indicates
that the large parts of the answers drop in the evaluations of agreeing with the
statement.
All three indicators’ Skewness value is positive; it means that the answers cluster
to the side that agrees with the statements.
Three indicators’ Z-value are higher than 1.64. These statements are statistically
supported.
27
Generally speaking, all three indicators of consumer attitude are statistically
supported. This gives us confidence to claim that company’s CSR strategy is one
of important considerations which lead university students hold positive attitude
towards the company’s products.
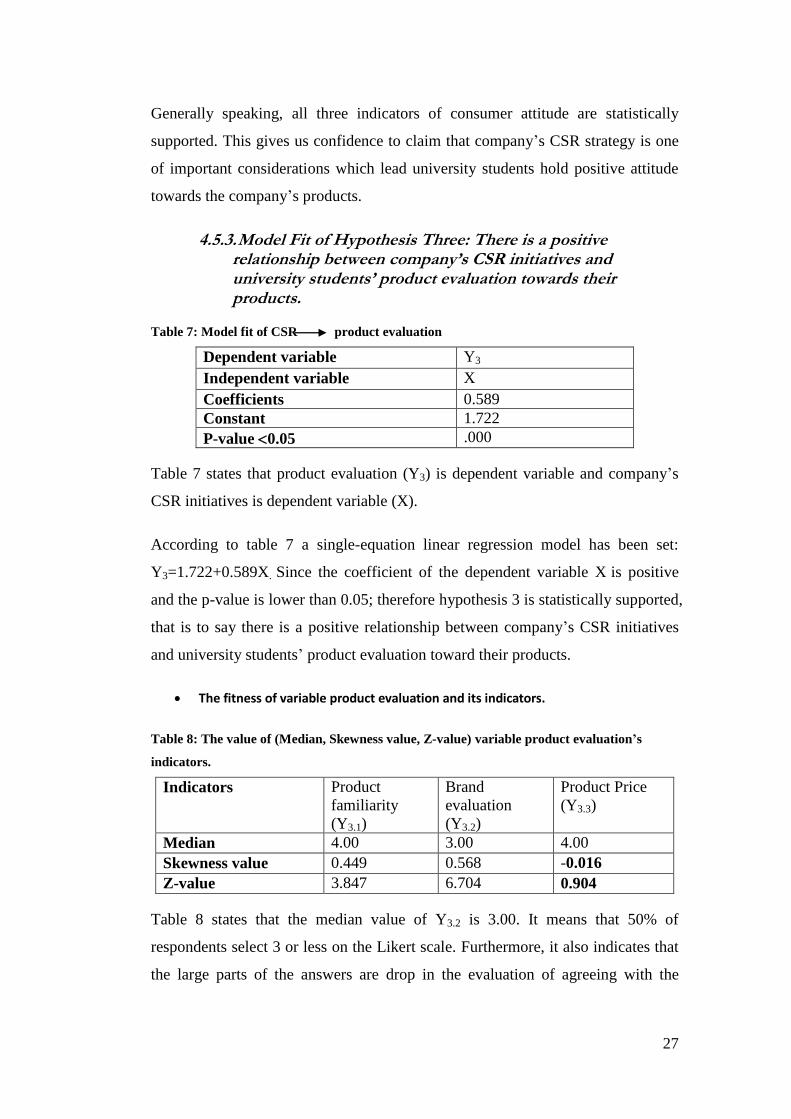
4.5.3. Model Fit of Hypothesis Three: There is a positive relationship between company’s CSR initiatives and university students’ product evaluation towards their products.
Table 7: Model fit of CSR product evaluation
Dependent variable Y3
Independent variable X
Coefficients 0.589
Constant 1.722
P-value 0.05 .000
Table 7 states that product evaluation (Y3) is dependent variable and company’s
CSR initiatives is dependent variable (X).
According to table 7 a single-equation linear regression model has been set:
Y3=1.722+0.589X. Since the coefficient of the dependent variable X is positive
and the p-value is lower than 0.05; therefore hypothesis 3 is statistically supported,
that is to say there is a positive relationship between company’s CSR initiatives
and university students’ product evaluation toward their products.
The fitness of variable product evaluation and its indicators.
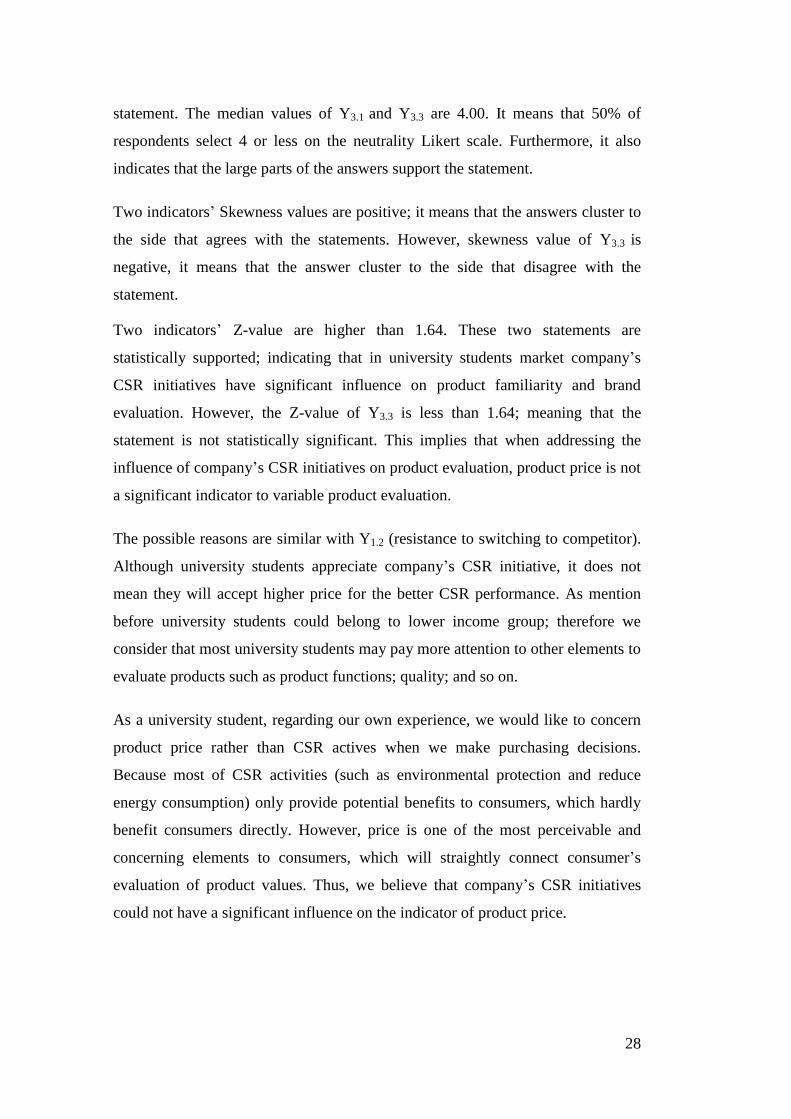
Table 8: The value of (Median, Skewness value, Z-value) variable product evaluation’s
indicators.
Indicators Product
familiarity
(Y3.1)
Brand
evaluation
(Y3.2)
Product Price
(Y3.3)
Median 4.00 3.00 4.00
Skewness value 0.449 0.568 -0.016
Z-value 3.847 6.704 0.904
Table 8 states that the median value of Y3.2 is 3.00. It means that 50% of
respondents select 3 or less on the Likert scale. Furthermore, it also indicates that
the large parts of the answers are drop in the evaluation of agreeing with the
28
statement. The median values of Y3.1 and Y3.3 are 4.00. It means that 50% of
respondents select 4 or less on the neutrality Likert scale. Furthermore, it also
indicates that the large parts of the answers support the statement.
Two indicators’ Skewness values are positive; it means that the answers cluster to
the side that agrees with the statements. However, skewness value of Y3.3 is
negative, it means that the answer cluster to the side that disagree with the
statement.
Two indicators’ Z-value are higher than 1.64. These two statements are
statistically supported; indicating that in university students market company’s
CSR initiatives have significant influence on product familiarity and brand
evaluation. However, the Z-value of Y3.3 is less than 1.64; meaning that the
statement is not statistically significant. This implies that when addressing the
influence of company’s CSR initiatives on product evaluation, product price is not
a significant indicator to variable product evaluation.
The possible reasons are similar with Y1.2 (resistance to switching to competitor).
Although university students appreciate company’s CSR initiative, it does not
mean they will accept higher price for the better CSR performance. As mention
before university students could belong to lower income group; therefore we
consider that most university students may pay more attention to other elements to
evaluate products such as product functions; quality; and so on.
As a university student, regarding our own experience, we would like to concern
product price rather than CSR actives when we make purchasing decisions.
Because most of CSR activities (such as environmental protection and reduce
energy consumption) only provide potential benefits to consumers, which hardly
benefit consumers directly. However, price is one of the most perceivable and
concerning elements to consumers, which will straightly connect consumer’s
evaluation of product values. Thus, we believe that company’s CSR initiatives
could not have a significant influence on the indicator of product price.

29
4.5.4. Model Fit of Hypothesis Four: There is a positive relationship between company’s CSR initiatives and university students’ word-of-mouth towards their products.
Table 9: Model fit of CSR word-of-mouth
Dependent variable Y4
Independent variable X
Coefficients 0.532
Constant 2.002
P-value 0.05 .000
Table 9 states that word-of-mouth (Y4) is dependent variable and company’s CSR
initiatives is independent variable (X).
According to table 9 a single-equation linear regression model has been set:
Y=2.002+0.532X4. Since the coefficient of the dependent variable X is positive
and the p-value is lower than 0.05; therefore hypothesis 4 is statistically supported,
that is to say there is a positive relationship between company’s CSR initiatives
and university students’ word-of-mouth toward their products.
The fitness of variable word-of-mouth and its indicators
Table 10: The value of (Median, Skewness value, Z-value) variable word of mouth’s
indicators.
Indicators Share
information of
product
performance
(Y4.1)
Share
information of
response to
problems (Y4.2)
Share
information of
employee
behavior (Y4.3)
Median 3.00 3.00 4.00
Skewness value 0.417 0.556 0.084
Z-value 7.965 6.940 1.044
Table 10 refers to the median values of Y4.1 and Y4.2 is 3.00. It means that 50% of
respondents select 3 or less on the Likert scale. Furthermore, it also indicates that
the large parts of the answers are drop in the evaluations of agreeing with the
statement. The median value of Y4.3 is 4.00. It means that 50% of respondents
select 4 or less on the neutrality Likert scale. Furthermore, it also indicates that the
large parts of the answers support with the statement.
30
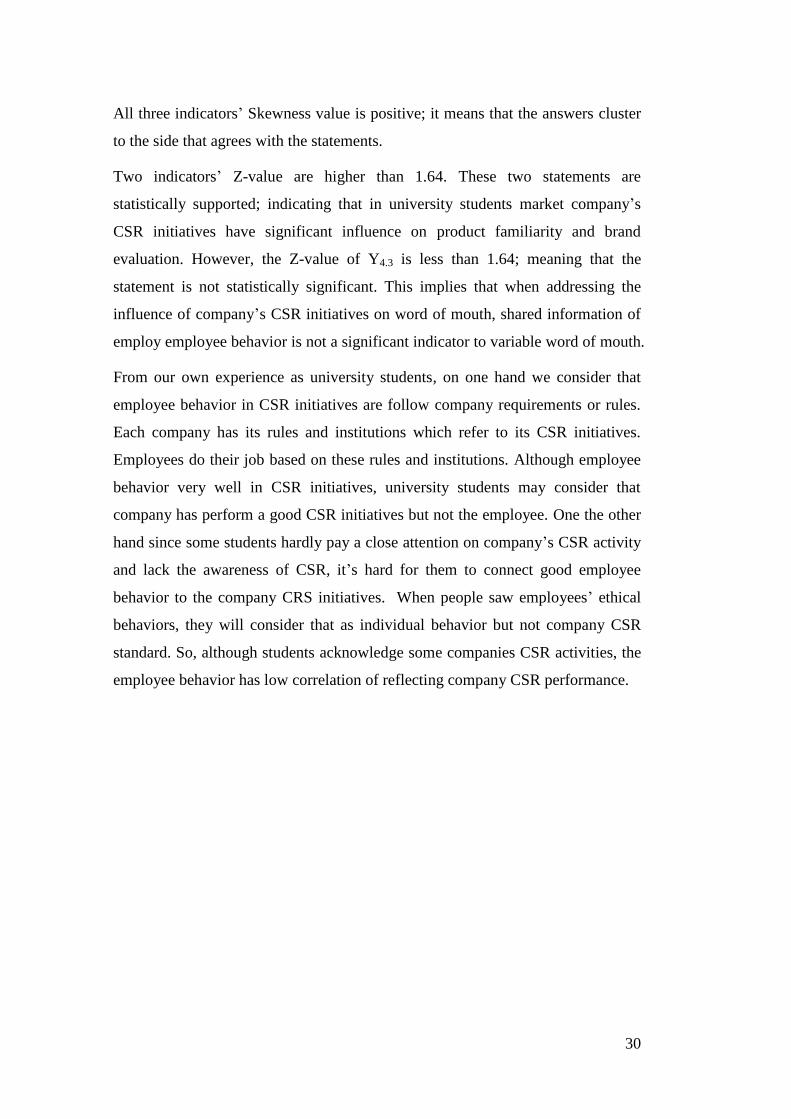
All three indicators’ Skewness value is positive; it means that the answers cluster
to the side that agrees with the statements.
Two indicators’ Z-value are higher than 1.64. These two statements are
statistically supported; indicating that in university students market company’s
CSR initiatives have significant influence on product familiarity and brand
evaluation. However, the Z-value of Y4.3 is less than 1.64; meaning that the
statement is not statistically significant. This implies that when addressing the
influence of company’s CSR initiatives on word of mouth, shared information of
employ employee behavior is not a significant indicator to variable word of mouth.
From our own experience as university students, on one hand we consider that
employee behavior in CSR initiatives are follow company requirements or rules.
Each company has its rules and institutions which refer to its CSR initiatives.
Employees do their job based on these rules and institutions. Although employee
behavior very well in CSR initiatives, university students may consider that
company has perform a good CSR initiatives but not the employee. One the other
hand since some students hardly pay a close attention on company’s CSR activity
and lack the awareness of CSR, it’s hard for them to connect good employee
behavior to the company CRS initiatives. When people saw employees’ ethical
behaviors, they will consider that as individual behavior but not company CSR
standard. So, although students acknowledge some companies CSR activities, the
employee behavior has low correlation of reflecting company CSR performance.
31
5. Conclusion, Limitations and Future Research
5.1. Conclusion
The purpose of this thesis is to test whether companies’ CSR initiatives have
impact on university students’ buying behavior with regard to these four aspects
The hypotheses that are formulated around this purpose are tested.
Generally, the structure model based on the hypotheses is statistically supported.
The results show that company’s CSR initiatives have positive impact on
university students’ loyalty, attitude, product evaluation, and word-of-mouth.
Nevertheless, unlike the existing literature suggests, several indicators are not
proved to be significant to their respective aspects when it comes to the influence
of CSR initiatives. These indicators are: resistance to switching to competitor,
product price, and share information of employee behavior. From our findings, we
would like to claim that CSR is an indispensable element for companies to operate
their business in university student market. Companies had better to ensure their
product quality (or service) at the same time try best to fulfill social responsibility.
On the other hand, a company could not only rely on its CSR strategy to defeat
competitors.
5.2. Limitations
This research has some limitations: firstly, this research only focuses on Karlstad
University students. Thus, the results may not be generalized to other university
students. Secondly, this research only focuses on university students market.
Different ranges of education may have different perceptions on company’s CSR
initiatives again the result of this study may not be generalized to consumers
belongs to other education levels. Thirdly, in order to have the valid result of the
quantitative research, the sample should be larger than the current sampling. Even
though the study gets the clear results of the relationship between company’s CSR
initiatives and consumer buying behavior, this study has a limited time to be
conducted. Therefore, there are only 441 questionnaires to be collected.
32
5.3. Further research
This study finds that three indicators to consumer loyalty, product evaluation and
word-of-mouth respectively are not significant influenced by company’s CSR
initiatives in university students market. From the quantitative data, the reasons
for this cannot be specified. Thus, it is interesting to further explore the reasons by
employ qualitative follow-up. Moreover, it may also be interesting to study
similar research which focuses on different education levels of consumers.
33
6. Reference
Anderson, E.W. (1998). Customer Satisfaction and Word of Mouth. Journal
of Service Research, Volume 1, No.1 August 1998-5-17. Available:
http://deepblue.lib.umich.edu/bitstream/2027.42/68654/2/10.1177_109467059
800100102.pdf [2012-05-20]
Becker-Olsen, K. L., Cudmore, B. A., & Hill, R. P. (2006). The Impact of
Perceived Corporate Social Responsibility on Consumer Behavior. Journal of
Business Research, 59(1), 46–53.
Bhattacharya, C.B. & Sen, S. (2004). Doing Better at Doing Good: When,
Why and How Consumers Respond to Corporate Social Initiatives. California
Management Review, 47(1), 9-24
Boulstridge, E. & Carrigan, M. (2000). Do Consumers Really Care About
Corporate Responsibility: Highlighting the Attitude-Behavior Gap. Journal of
Communication Management, 4(4), 358–368.
Brown, T.J. & Dacin, P.A. (1997). The Company and the Product: Corporate
Associations and Consumer Product Responses. Journal of Marketing, 61, 68–
84.
Bryman, A. & Bell, E. (2007). Business Research Methods. 2ed., Great
Clarendon: Oxford University Press.
Carrigan, M. & Attalla, A. (2001). The Myth of the Ethical Consumer – Do
Ethics Matter in Purchase Behavior? Journal of Consumer Marketing, 18(7),
560–577.
Castillo J.J. (2009). Snowball Sampling. Experiment-resources.com (2008-
2012) Available:http://www.experiment-resources.com/snowball-
sampling.html [2012-04-20]
Clugston R.M. and Calder W. (2002) Critical Dimensions of Sustainability in
Higher Education. International Journal of Sustainability in Higher
Education. Vol.3 No.3 MCB UP Limited [This article appeared originally in
34
Sustainability and University Life, Walter Leal Filho (1999). Published by
Peter Lang]
Collier J. (2009). Using SPSS Syntax: A Beginner’s Guide. Available:
http://srmo.sagepub.com.bibproxy.kau.se:2048/view/using-spss-syntax/n1.xml
[2012-06-10]
Creyer, E.H. & Ross, W.T. (1997). The Influence of Firm Behavior on
Purchase Intention: Do Consumers Really Care About Business Ethics?
Journal of Consumer Marketing, (14), 421– 432.
Crowther, D. & Rayman-Bacchus, L. (2003) Perspectives on Corporate Social
Responsibility. Crane, A. et al. (eds) The Oxford Handbook of Corporate
Social Responsibility. Oxford University Press (2008).
Folkes, V.S. & Kamins, M.A. (1999) Effects of Information About Firm’s
Ethical and Unethical Actions on Consumer’s Attitudes. Journal of Consumer
Psychology, 8(3), 243-259.
Harris K.E., Mohr L.A. & Webb D.J. (2001). Do consumers expect companies
to be social responsible? The impact of corporate social responsibility on
buying behavior. Journal of Consumers Affairs p45.
Herr, P. M., Kardes, F. R., & Kim, J. (1991). Effects of Word-of-Mouth and
Product- Attribute Information on Persuasion: An Accessibility-Diagnosticity
Perspective. Journal of Consumer Research, 17(March), 454–462.
Industry Canada (2012). Corporate Social Responsibility. Available:
http://www.ic.gc.ca/eic/site/csr-rse.nsf/eng/rs00129.html [2012-04-03]
Karlstad University (2012a). Environment. Available:
http://www.kau.se/en/about-university/main-university-
regulations/environment [2012-05-17]
35
Karlstad University (2012b). About University: General description.
[Electronic].Available:http://www.kau.se/en/about-university/general-
description/facts [2012-05-17]
Kotler, P., Keller, K.L., Brady, M., Goodman, M. & Hansen, T. (2009).
Marketing Management. Prentice Hall.
Lafferty, B.A. & Goldsmith, R.E. (1999). Attitudes and Purchase Intentions
Corporate Credibility’s Role in Consumer’s When a High Versus a Low
Credibility Endorser in Used in the AD. Journal of Business Research vol. 44
109-116.
Lee, J.K. & Lee, W.N. (2009) Country-of-Origin Effects on Consumer
Product Evaluation and Purchase Intention: The Role of Objective Versus
Subjective Knowledge. Journal of International Consumer Marketing, 21:2,
137-151. Available: http://dx.doi.org/10.1080/08961530802153722 [2012-05-
22]
Marques de Sa J.P. (2007). Applied Statistics Using SPSS, STATISTICA,
MATLAB and R. Speinger Publish. P64
McClave,J.T., Benson,P.G. & Boudreau, N.S.(1998). Statistics for Business
and Economics Prenrice-Hall, Inc. publish 7th
ed.
Morsing, M. & Beckmann, S.C. (2006). Strategic CSR Communication.
Copenhagen: DJOF.
Oliver, R.L. (1999). Whence Customer Loyalty? Journal of Marketing, 63
(special issue), 33-44.
Pallant J. (2006). SPSS Survival Manual. McGraw Hill Publish. P6
Peter J.P., Olson J., & Grunert K. G. (1999). Consumer Behavior and
Marketing Strategy. European edition. McGraw-Hill Publishing Company.
36
Pirsch, J., Gupta, S. & Grau, S.L. (2007). A Framework for Understanding
Corporate Social Responsibility Programs as a Continuum: An Exploratory
Study. Journal of Business Ethics, 70(2), 125– 140.
Raju, P.S. (1977) Product Familiarity, Brand Name, and Price Influences on
Product Evaluation. Advances in Consumer Research Volume 04, eds. William
D. Perreault, Jr., Atlanta: Association for Consumer Research, Pages: 64-71.
Available: http://www.acrwebsite.org/volumes/display.asp?id=9331 [2012-05-
10]
Sen, S. & Bhattacharya C. B. (2001). Does Doing Good Always Lead to
Doing Better? Consumer Reactions to Corporate Social Responsibility.
Journal of Marketing Research, 38, 225–243.
Solomon, M. (2009). Consumer Behavior Buying, Having, and Being (8th
ed.). Upper Saddle River, NJ: Pearson Prentice Hall.
Studenmund, A.H., (2006). Using Econometrics: A Practical Guide. 5ed.
Boston Mass: Addison Wesley.
Sundaram, D.S., Mitra, K. & Webster C. (1998). Word-of-Mouth
Communications: A Motivational Analysis. Advances in Consumer Research
Volume 25, eds. Joseph W. Alba & J. Wesley Hutchinson, Provo, UT:
Association for Consumer Research, Pages: 527-531. Available:
http://www.acrwebsite.org/volumes/display.asp?id=8208 [2012-05-10]
Uncles, M. & Laurent, G. (1997), “Editorial”, International. Journal of
Research in Marketing, Vol. 14, pp. 399-404.
Yuen K.T. (2007). The effect of customer trust on customer loyalty and
repurchase intention: the moderating influence of perceived CSR Avaiable:
http://libproject.hkbu.edu.hk/trsimage/hp/04006429.pdf [2012-05-20]
37
7. Appendix
Questionnaires in English
This research undertakes as a part of graduate thesis project of Accounting and
Finance program at Karlstad University. This questionnaire aims to investigate the
influence of company’s corporate social responsibility initiatives influence on
consumer buying behavior. Your response is of great value for our research.
Thank you for your cooperation!
Supervisor: Sveinung Jorgensen (Sveinung. [email protected] )
Authors: Damiao Xu([email protected])
Duo Yang ([email protected])
Before start, please note for Corporate Social Responsibility (CSR) initiatives we
mean all the activities of a certain company on protecting environmental (e.g.:
low-carbon operation; reduce energy consumption); contributing communities
(e.g.: sponsor a charity fund; caring about the children without proper education);
maintaining economical sustainability (e.g. provide fair trued; guarantee
stakeholders’ benefits).
Part 1: Background information
1: Are you a Karlstad University fulltime student? Yes No
For answering the following question, please identify a company that you think is
good in CSR initiatives, and you are its consumer. This company can either be a
physical products producer or service provider. The word ‘product’ below means
the offering that this company provides, thus can be either physical products or
service. Please answer the questions with respect to the company (and its CSR
initiatives) you have chosen.
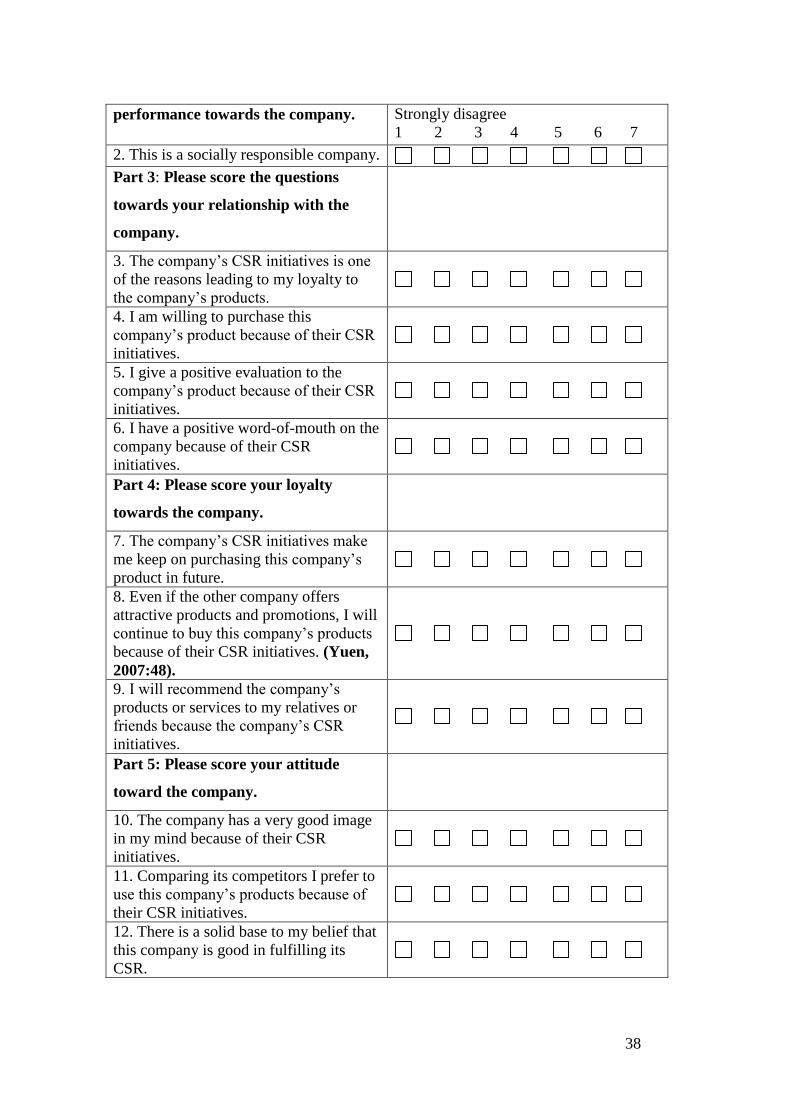
Part 2: Please score the CSR
Strongly agree
38
performance towards the company. Strongly disagree
1 2 3 4 5 6 7
2. This is a socially responsible company.
Part 3: Please score the questions
towards your relationship with the
company.
3. The company’s CSR initiatives is one
of the reasons leading to my loyalty to
the company’s products.
4. I am willing to purchase this
company’s product because of their CSR
initiatives.
5. I give a positive evaluation to the
company’s product because of their CSR
initiatives.
6. I have a positive word-of-mouth on the
company because of their CSR
initiatives.
Part 4: Please score your loyalty
towards the company.
7. The company’s CSR initiatives make
me keep on purchasing this company’s
product in future.
8. Even if the other company offers
attractive products and promotions, I will
continue to buy this company’s products
because of their CSR initiatives. (Yuen,
2007:48).
9. I will recommend the company’s
products or services to my relatives or
friends because the company’s CSR
initiatives.
Part 5: Please score your attitude
toward the company.
10. The company has a very good image
in my mind because of their CSR
initiatives.
11. Comparing its competitors I prefer to
use this company’s products because of
their CSR initiatives.
12. There is a solid base to my belief that
this company is good in fulfilling its
CSR.
39
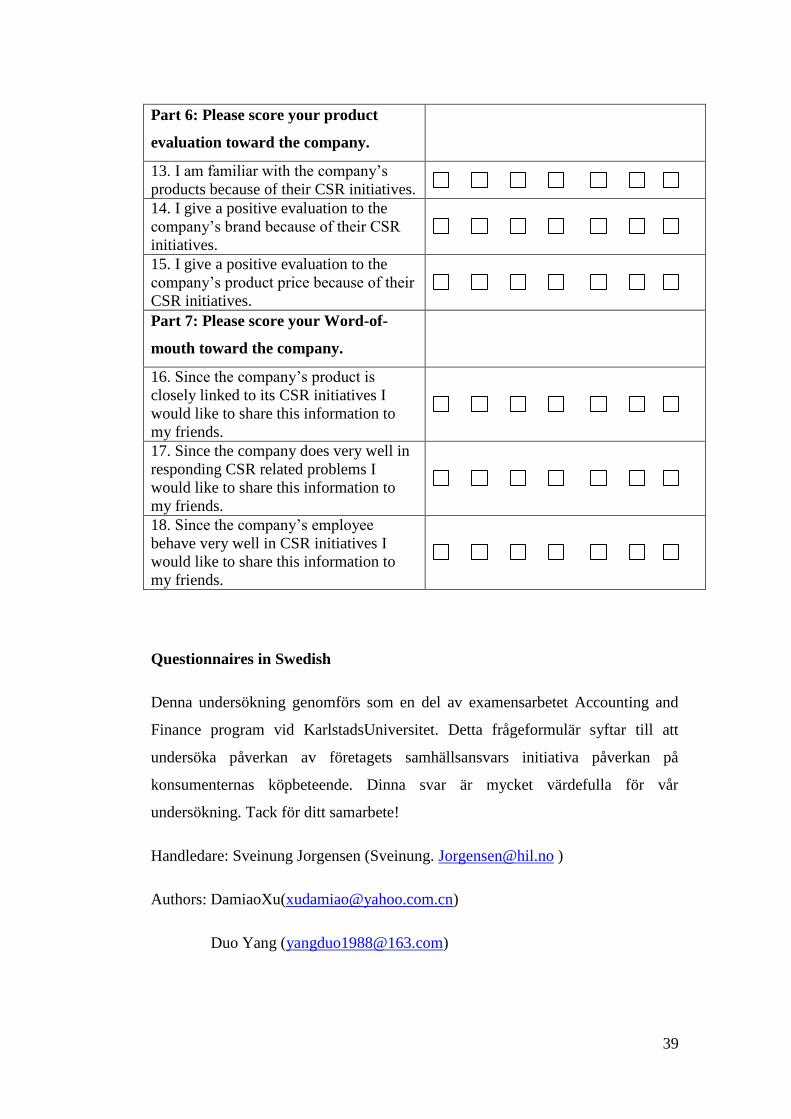
Part 6: Please score your product
evaluation toward the company.
13. I am familiar with the company’s
products because of their CSR initiatives.
14. I give a positive evaluation to the
company’s brand because of their CSR
initiatives.
15. I give a positive evaluation to the
company’s product price because of their
CSR initiatives.
Part 7: Please score your Word-of-
mouth toward the company.
16. Since the company’s product is
closely linked to its CSR initiatives I
would like to share this information to
my friends.
17. Since the company does very well in
responding CSR related problems I
would like to share this information to
my friends.
18. Since the company’s employee
behave very well in CSR initiatives I
would like to share this information to
my friends.
Questionnaires in Swedish
Denna undersökning genomförs som en del av examensarbetet Accounting and
Finance program vid KarlstadsUniversitet. Detta frågeformulär syftar till att
undersöka påverkan av företagets samhällsansvars initiativa påverkan på
konsumenternas köpbeteende. Dinna svar är mycket värdefulla för vår
undersökning. Tack för ditt samarbete!
Handledare: Sveinung Jorgensen (Sveinung. [email protected] )
Authors: DamiaoXu([email protected])
Duo Yang ([email protected])
40
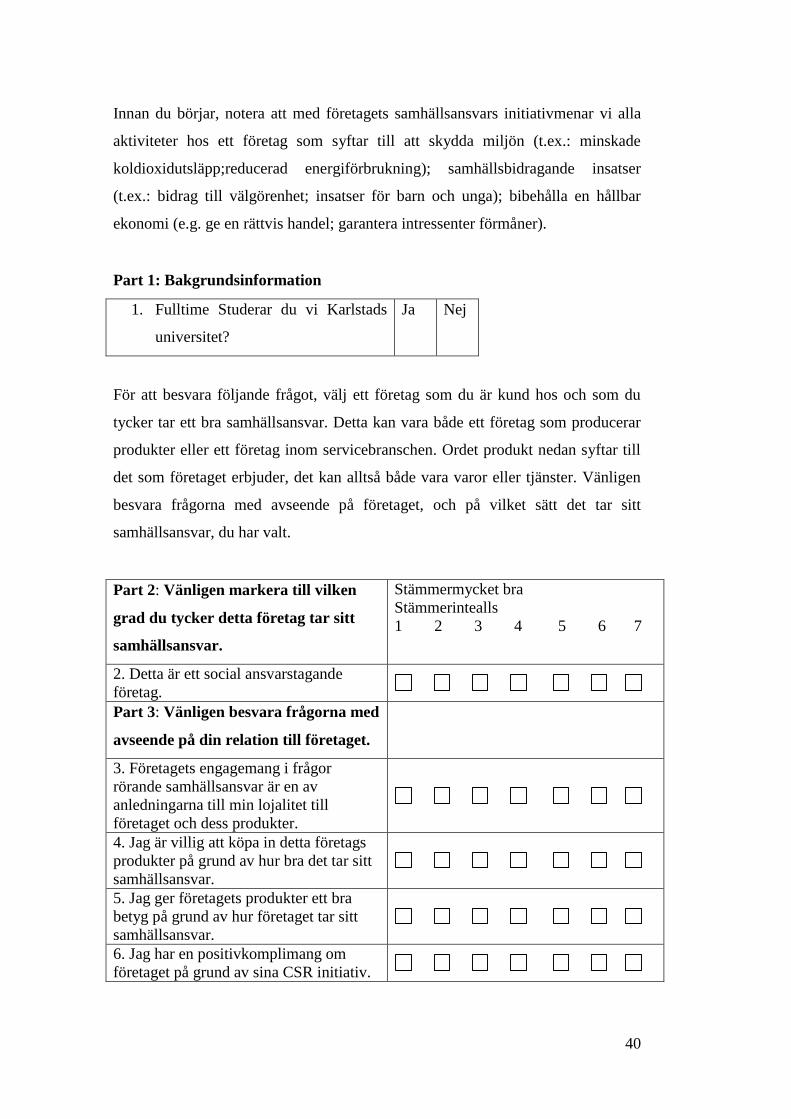
Innan du börjar, notera att med företagets samhällsansvars initiativmenar vi alla
aktiviteter hos ett företag som syftar till att skydda miljön (t.ex.: minskade
koldioxidutsläpp;reducerad energiförbrukning); samhällsbidragande insatser
(t.ex.: bidrag till välgörenhet; insatser för barn och unga); bibehålla en hållbar
ekonomi (e.g. ge en rättvis handel; garantera intressenter förmåner).
Part 1: Bakgrundsinformation
1. Fulltime Studerar du vi Karlstads
universitet?
Ja Nej
För att besvara följande frågot, välj ett företag som du är kund hos och som du
tycker tar ett bra samhällsansvar. Detta kan vara både ett företag som producerar
produkter eller ett företag inom servicebranschen. Ordet produkt nedan syftar till
det som företaget erbjuder, det kan alltså både vara varor eller tjänster. Vänligen
besvara frågorna med avseende på företaget, och på vilket sätt det tar sitt
samhällsansvar, du har valt.
Part 2: Vänligen markera till vilken
grad du tycker detta företag tar sitt
samhällsansvar.
Stämmermycket bra
Stämmerintealls
1 2 3 4 5 6 7
2. Detta är ett social ansvarstagande
företag.
Part 3: Vänligen besvara frågorna med
avseende på din relation till företaget.
3. Företagets engagemang i frågor
rörande samhällsansvar är en av
anledningarna till min lojalitet till
företaget och dess produkter.
4. Jag är villig att köpa in detta företags
produkter på grund av hur bra det tar sitt
samhällsansvar.
5. Jag ger företagets produkter ett bra
betyg på grund av hur företaget tar sitt
samhällsansvar.
6. Jag har en positivkomplimang om
företaget på grund av sina CSR initiativ.
41
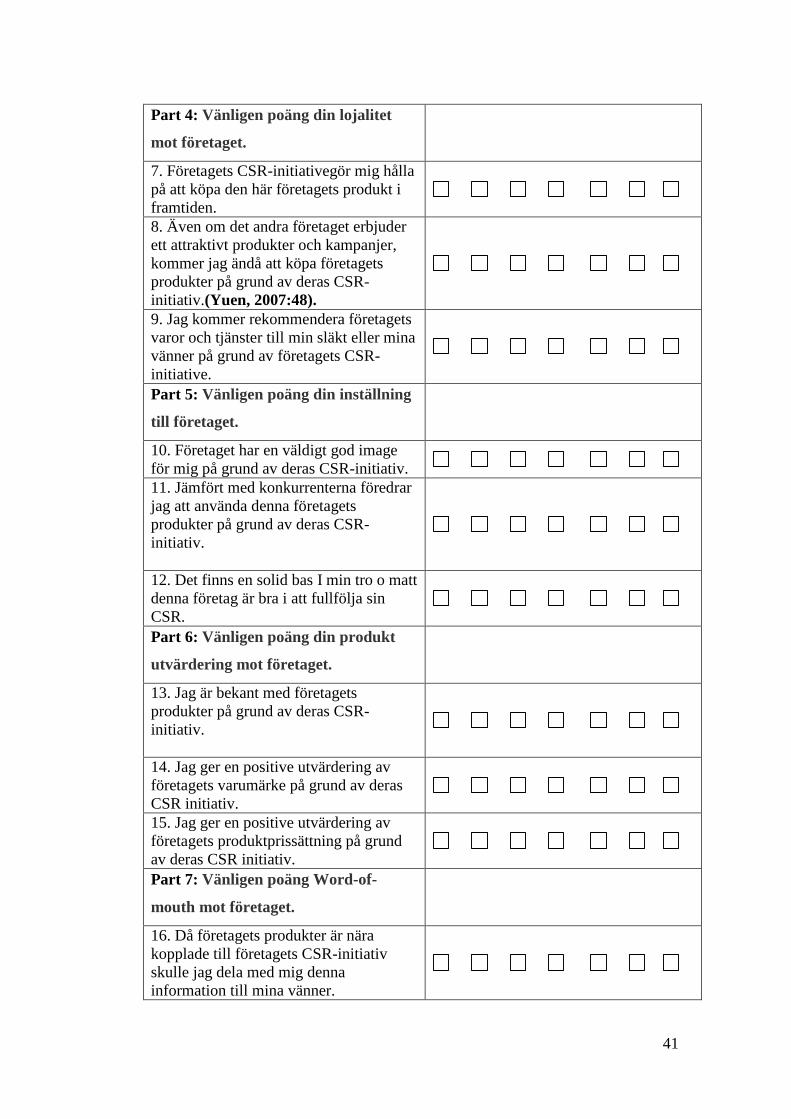
Part 4: Vänligen poäng din lojalitet
mot företaget.
7. Företagets CSR-initiativegör mig hålla
på att köpa den här företagets produkt i
framtiden.
8. Även om det andra företaget erbjuder
ett attraktivt produkter och kampanjer,
kommer jag ändå att köpa företagets
produkter på grund av deras CSR-
initiativ.(Yuen, 2007:48).
9. Jag kommer rekommendera företagets
varor och tjänster till min släkt eller mina
vänner på grund av företagets CSR-
initiative.
Part 5: Vänligen poäng din inställning
till företaget.
10. Företaget har en väldigt god image
för mig på grund av deras CSR-initiativ.
11. Jämfört med konkurrenterna föredrar
jag att använda denna företagets
produkter på grund av deras CSR-
initiativ.
12. Det finns en solid bas I min tro o matt
denna företag är bra i att fullfölja sin
CSR.
Part 6: Vänligen poäng din produkt
utvärdering mot företaget.
13. Jag är bekant med företagets
produkter på grund av deras CSR-
initiativ.
14. Jag ger en positive utvärdering av
företagets varumärke på grund av deras
CSR initiativ.
15. Jag ger en positive utvärdering av
företagets produktprissättning på grund
av deras CSR initiativ.
Part 7: Vänligen poäng Word-of-
mouth mot företaget.
16. Då företagets produkter är nära
kopplade till företagets CSR-initiativ
skulle jag dela med mig denna
information till mina vänner.
42
17. Då företaget gör väldigt bra i att
svara och agera på CSR-relaterade
problem skulle jag dela med mig denna
information till mina vänner.
18. Då företagets anställda uppför sig
väldigt bra i CSR-initiativer skulle jag
dela med mig denna information till mina
vänner.
![[Shiseido’s Corporate Social Responsibility] · Shiseido's Corporate Social Responsibility Back Issues 2010 [Shiseido’s Corporate Social Responsibility] "Beautiful Society, Bright](https://static.fdocuments.us/doc/165x107/5f170ccfbe73e76f437bb14c/shiseidoas-corporate-social-responsibility-shiseidos-corporate-social-responsibility.jpg)