The inertance function in dynamic diagnosis of undamaged ...
10
* M.Sc. Jarosław Chełmecki, Ph.D. Arkadiusz Kwiecień, Ph.D. Bogusław Zając, Institute of Structural Mechanics, Faculty of Civil Engineering, Cracow University of Technology. TECHNICAL TRANSACTIONS ENVIRONMENT ENGINEERING 1-Ś/2013 CZASOPISMO TECHNICZNE ŚRODOWISKO JAROSŁAW CHEŁMECKI, ARKADIUSZ KWIECIEŃ, BOGUSŁAW ZAJĄC * THE INERTANCE FUNCTION IN DYNAMIC DIAGNOSIS OF UNDAMAGED AND DAMAGED STRUCTURES FUNKCJA INERTANCJI W DIAGNOSTYCE KONSTRUKCJI NIEUSZKODZONYCH I USZKODZONYCH Abstract The paper introduces basics of a dynamic diagnostic method using the inertance function, in which analysis results are derived from acquisition data obtained from a modal hammer and accelerometers during dynamic testing. The presented examples show the applicability of the method for obtaining conclusions from diagnostic analysis. The proposed method can be used for the analysis of the dynamic response of civil engineering structures and soil. Keywords: dynamic testing, non-destructive testing, inertance function Streszczenie W artykule przedstawione zostało zastosowanie funkcji inetrancji, jako metody analizy wy- ników pomiarów dynamicznych uzyskanych z młotka modalnego oraz akcelerometrów. Pre- zentowane przykłady pokazują możliwość zastosowania metody w celu uzyskania wniosków z analizy diagnostycznej. Proponowana metoda może być użyteczna do określania odpowiedzi dynamicznej konstrukcji budowlanych i gruntów. Słowa kluczowe: badania dynamiczne, badania nieniszczące, funkcja inertancji
Transcript of The inertance function in dynamic diagnosis of undamaged ...
* M.Sc. Jarosław Chełmecki, Ph.D. Arkadiusz Kwiecień, Ph.D. Bogusław Zając, Institute of Structural Mechanics, Faculty of Civil Engineering, Cracow University of Technology.
TECHNICAL TRANSACTIONSENVIRONMENT ENGINEERING
1-Ś/2013
CZASOPISMO TECHNICZNEŚRODOWISKO
JAROSŁAW CHEŁMECKI, ARKADIUSZ KWIECIEŃ, BOGUSŁAW ZAJĄC *
THE INERTANCE FUNCTION IN DYNAMIC DIAGNOSIS OF UNDAMAGED AND DAMAGED STRUCTURES
FUNKCJA INERTANCJI W DIAGNOSTYCE KONSTRUKCJI NIEUSZKODZONYCH I USZKODZONYCH
A b s t r a c t
The paper introduces basics of a dynamic diagnostic method using the inertance function, in which analysis results are derived from acquisition data obtained from a modal hammer and accelerometers during dynamic testing. The presented examples show the applicability of the method for obtaining conclusions from diagnostic analysis. The proposed method can be used for the analysis of the dynamic response of civil engineering structures and soil.
Keywords: dynamic testing, non-destructive testing, inertance function
S t r e s z c z e n i e
W artykule przedstawione zostało zastosowanie funkcji inetrancji, jako metody analizy wy-ników pomiarów dynamicznych uzyskanych z młotka modalnego oraz akcelerometrów. Pre-zentowane przykłady pokazują możliwość zastosowania metody w celu uzyskania wniosków z analizy diagnostycznej. Proponowana metoda może być użyteczna do określania odpowiedzi dynamicznej konstrukcji budowlanych i gruntów.
Słowa kluczowe: badania dynamiczne, badania nieniszczące, funkcja inertancji

4
1. Introduction
Non-Destructive Testing (NDT) has become a widely developing branch of science in recent decades. These methods allow diagnosing structures and especially for the detection of structural damages. The development of NDT tests in engineering practice has been observed in recent years. The most popular methods are: Flat-Jack tests, Impact Echo, Tomography and methods based on modal analysis [1, 8, 9]. These methods are not fully compatible with each other [10]. These issues are the subject of intense study by the various international teams (e.g. RILEM Committees: TC 216-SAM, TC MCM), and they were presented in many publications [11, 12]. In addition to these methods, a method of dynamic analysis using the inertance function has been developed. It is based on recorded impulse signals of force and acceleration responses in the frequency domain.
2. Inertance function
An inertance function is a special case of a transfer function (1). It is defined in the frequency domain and is expressed by the ratio of the output signal (acceleration response of the structure) to the input signal (impulse excitation with modal hammer) and given by (2). The use of this function is convenient when an acceleration response of structure is measured. Structural response can be also expressed by the flexibility function (with displacement response of a structure) or by the admittance function (with velocity response of a structure).
AA
HOUT
IN
= ( )ω (1)
IXF M
( )( )( ) ( )
ωωω ω
= = 1
(2)
FXI
X M'( )( )( )
( ) ( )ωωω
ω ω= = ⋅
(3)
where:
H ( )ω − transfer function, ratio between output and input signals (frequency do-main),
X ( )ω − acceleration frequency characteristic (FFT) of the tested structure,F ( )ω − excitation force frequency characteristic (FFT) of the modal hammer,I ( )ω − real inertance frequency characteristic of the tested structure,F '( )ω − inertial force frequency characteristic,
ω − frequency in [Hz].In the analysis process, recorded signals in the time domain of the impulse excitation and
the acceleration response (Fig. 1) are transformed to the frequency domain by the Fast Fourier Transform (FFT). The force frequency characteristics F ( )ω and the acceleration frequency characteristics X ( )ω are presented in Fig. 2a and 2b respectively. These characteristics allow determining the inertance function module, which determines the apparent mass conversion –

5
from equation (2). The apparent mass M ( )ω indicates the value of the structural mass, which is activated during vibrations. This indicator shows the consistency of the tested structure – the higher the value of M ( )ω (lower values of I ( )ω ), the higher is consistency, indicating a high level of the elastic (dynamic) response of a structure.
Fig. 1. Impulse force in time domain (a) and acceleration response in time domain (b)
Fig. 2. Impulse force in frequency domain (a) and acceleration response in frequency domain (b)
3. Test on masonry columns
Dynamic tests using the inertance function were performed on masonry columns made of different materials (Fig. 3). One of the tested columns was cut from an existing structure originating from the 20th century (F-9A-2 specimen with cement-lime mortar of low stiffness) and the second one was made in a laboratory (Z-1 specimen with cement mortar of high stiffness). The column with cement-lime mortar was cut from building walls during repair and dismantles. The column with cement mortar was of dimension 250 × 250 × 500 mm3 and consisted of 7 brick layers of the thickness 65 mm, made of the Polish Bonarka bricks (dimension of 65 × 120 × 250 mm3). The columns were tested in a compression and the dynamic response was measured at different load levels.
The considered masonry specimens (fixed between compression plates of an universal testing machine) were excited using a modal hammer. Impulse excitations were generated horizontally in the middle of the tested columns. Dynamic responses of specimens were

6
measured in the same direction using two accelerometers. The first one was fixed to the column in the middle of the surface, opposite to the surface excited by the hammer – A1. The second one was used for an additional signal control – A2 (Fig. 4). Compression force was executed on the columns using the monotonic static load generated by the universal testing machine.
The excitation force was realized using the PCB 086D50 modal hammer and the acceleration response was measured using the 356B18 PCB accelerometers during the tests described below. All signals were recorded using the LMS SCADAS MOBILE system with the sample rate of 4096 samples/sec.
It can be observed at least two main resonant frequency bands (lower and higher), visible during analysis of the dynamic response of the samples F9A-2 and Z-1 before the destruction (Fig. 5). The lower frequency band was located in the frequency range of 700–850 Hz. The comparison of this band for both masonry columns indicates that the lower mortar strength, the lower is the response frequency.
It can be concluded from the relationships for the specimen F9A-2 (of lower stiffness) presented in Fig. 5, that the increase of the load level results in the change of the inertance, (manifested by the shift of the frequency to the higher values) and in the slight decrease of the inertance value (indicating the increase of the column consistency). Simultaneously for the Z-1 (of higher stiffness), the increase of the load does not affect significantly on the increase of the frequency, but results in the higher inertance value (Fig. 5). This may indicate on the change of the vibrating masses and on the cracks develop in the tested masonry structure.
Fig. 3. Tested brick columns
Fig. 4. Location of the impulse force excitation and of accelerometers
7
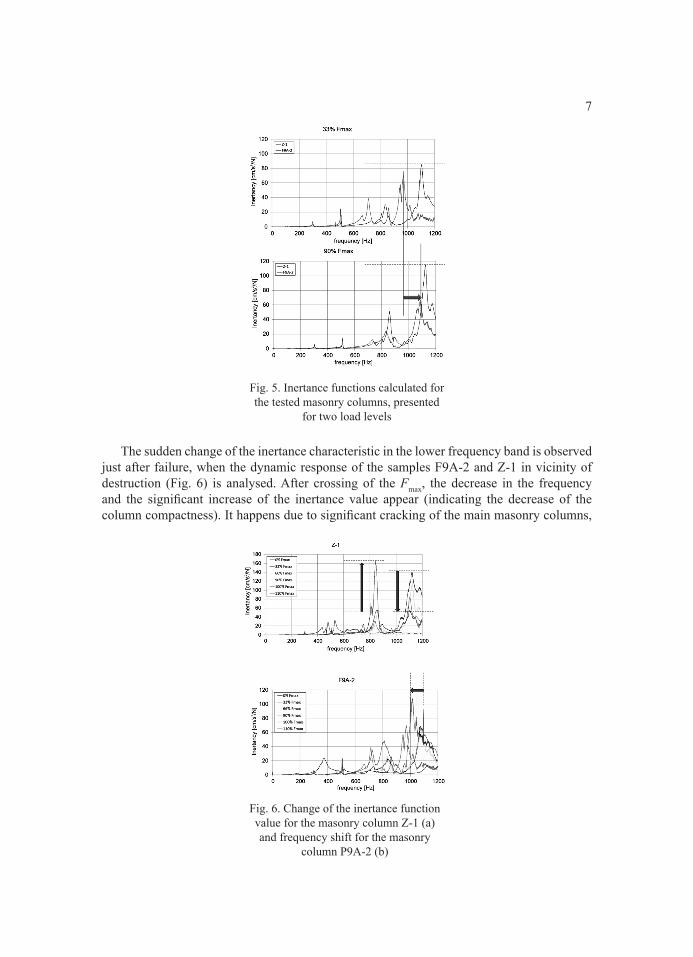
Fig. 5. Inertance functions calculated for the tested masonry columns, presented
for two load levels
Fig. 6. Change of the inertance function value for the masonry column Z-1 (a) and frequency shift for the masonry
column P9A-2 (b)
The sudden change of the inertance characteristic in the lower frequency band is observed just after failure, when the dynamic response of the samples F9A-2 and Z-1 in vicinity of destruction (Fig. 6) is analysed. After crossing of the Fmax, the decrease in the frequency and the significant increase of the inertance value appear (indicating the decrease of the column compactness). It happens due to significant cracking of the main masonry columns,

8
dividing the specimens into smaller sub-columns (reducing the compactness of the wall). The process of the masonry columns cracking is also visible as the inertance changes in the higher frequency band (Fig. 6), located in the range of 950–1100 Hz. The ongoing process of the structure loosening causes the decrease in the frequency response, but simultaneously brick and mortar particles are again compacted after crushing. It causes the effect of the stress redistribution and the local return to the more consistency of the column materials, visible in the decrease of the inertance value.
The presented results show that failure modes depend on types of the structural materials of the columns. The changes in the destruction process can be observed using the inertance function, but a lot of tests have to be done to validate the presented conclusions.
4. Test of masonry building
Another example of the use of the inertance function in dynamic testing is research on a masonry building. Dynamic tests on the real object destined for demolishing were carried out in Balice. The building made of solid bricks was tested in three phases [5]. Firstly, the undamaged object was investigated (Fig. 7a), next damaged one (Fig. 7b) and finally, repaired one using polymer flexible joints (Fig. 7c).
a) b) c)
Fig. 7. Tested building in three phases: undamaged (a), damaged (b), repaired (c)
There were installed 17 sensors on the building (Fig. 8), mounted in three directions X, Y and Z. The force was excited using a modal hammer, treated as an input parameter.
During the tests on the building, the excitation force was realized using the PCB 086D50 modal hammer and the acceleration response was measured using the 393B12 PCB accelerometers. All signals were recorded using the ESAM TRAVELLER PLUS system with the sample rate of 4096 samples/sec.
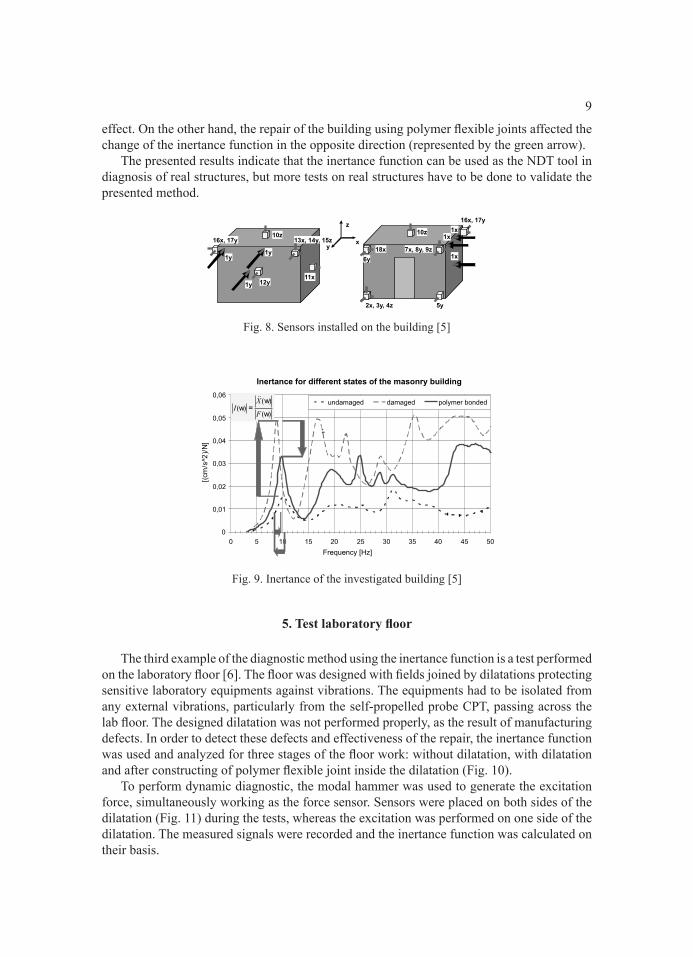
The excitation was generated at the upper corner of the building in three phases. There were determined the inertance functions on the basis of the recorded signals: the force excitation (1y) and the acceleration response (8y). Looking at the obtained results (Fig. 9), it can be seen that the damage to the structure caused the significant increase of the inertance value with the minimal decrease of the frequency. An analogy to the previously discussed masonry columns can be observed. Similarly in both cases, the deterioration of the objects affected the inertance values and the characteristic frequencies. In Fig. 9, the red arrow indicates this
9
effect. On the other hand, the repair of the building using polymer flexible joints affected the change of the inertance function in the opposite direction (represented by the green arrow).
The presented results indicate that the inertance function can be used as the NDT tool in diagnosis of real structures, but more tests on real structures have to be done to validate the presented method.
Fig. 8. Sensors installed on the building [5]
Fig. 9. Inertance of the investigated building [5]
5. Test laboratory floor
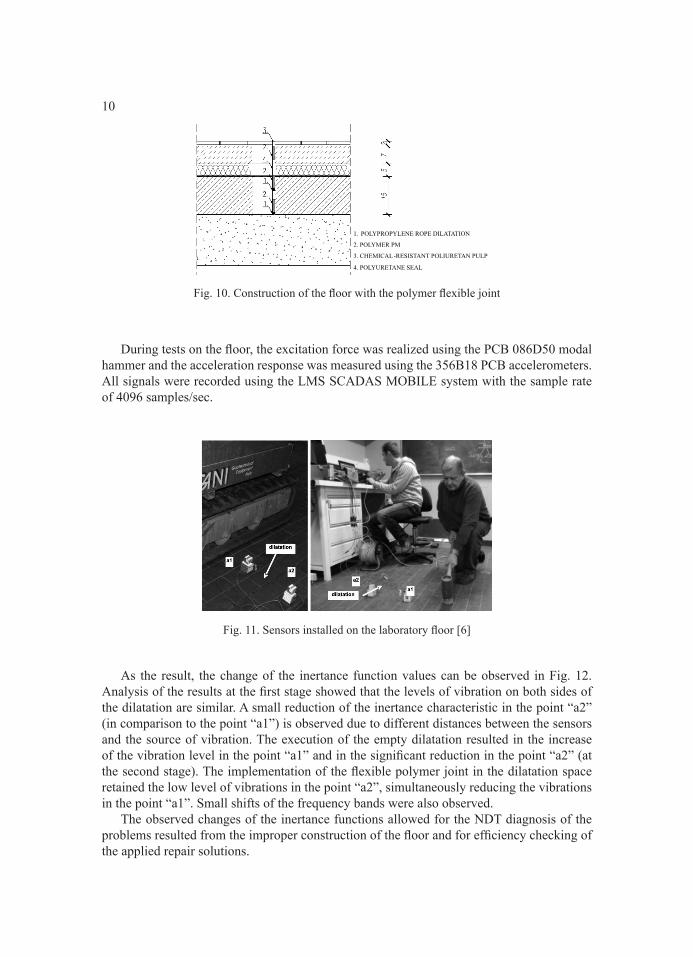
The third example of the diagnostic method using the inertance function is a test performed on the laboratory floor [6]. The floor was designed with fields joined by dilatations protecting sensitive laboratory equipments against vibrations. The equipments had to be isolated from any external vibrations, particularly from the self-propelled probe CPT, passing across the lab floor. The designed dilatation was not performed properly, as the result of manufacturing defects. In order to detect these defects and effectiveness of the repair, the inertance function was used and analyzed for three stages of the floor work: without dilatation, with dilatation and after constructing of polymer flexible joint inside the dilatation (Fig. 10).
To perform dynamic diagnostic, the modal hammer was used to generate the excitation force, simultaneously working as the force sensor. Sensors were placed on both sides of the dilatation (Fig. 11) during the tests, whereas the excitation was performed on one side of the dilatation. The measured signals were recorded and the inertance function was calculated on their basis.
10
Fig. 10. Construction of the floor with the polymer flexible joint
During tests on the floor, the excitation force was realized using the PCB 086D50 modal hammer and the acceleration response was measured using the 356B18 PCB accelerometers. All signals were recorded using the LMS SCADAS MOBILE system with the sample rate of 4096 samples/sec.
Fig. 11. Sensors installed on the laboratory floor [6]
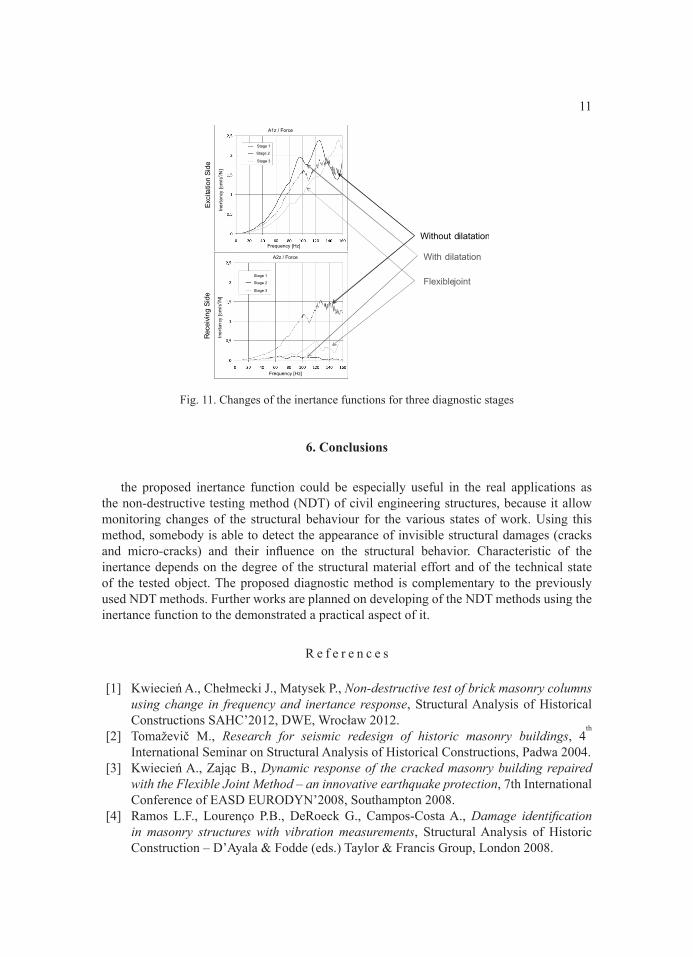
As the result, the change of the inertance function values can be observed in Fig. 12. Analysis of the results at the first stage showed that the levels of vibration on both sides of the dilatation are similar. A small reduction of the inertance characteristic in the point “a2” (in comparison to the point “a1”) is observed due to different distances between the sensors and the source of vibration. The execution of the empty dilatation resulted in the increase of the vibration level in the point “a1” and in the significant reduction in the point “a2” (at the second stage). The implementation of the flexible polymer joint in the dilatation space retained the low level of vibrations in the point “a2”, simultaneously reducing the vibrations in the point “a1”. Small shifts of the frequency bands were also observed.
The observed changes of the inertance functions allowed for the NDT diagnosis of the problems resulted from the improper construction of the floor and for efficiency checking of the applied repair solutions.
11
Fig. 11. Changes of the inertance functions for three diagnostic stages
6. Conclusions
the proposed inertance function could be especially useful in the real applications as the non-destructive testing method (NDT) of civil engineering structures, because it allow monitoring changes of the structural behaviour for the various states of work. Using this method, somebody is able to detect the appearance of invisible structural damages (cracks and micro-cracks) and their influence on the structural behavior. Characteristic of the inertance depends on the degree of the structural material effort and of the technical state of the tested object. The proposed diagnostic method is complementary to the previously used NDT methods. Further works are planned on developing of the NDT methods using the inertance function to the demonstrated a practical aspect of it.
R e f e r e n c e s
[1] Kwiecień A., Chełmecki J., Matysek P., Non-destructive test of brick masonry columns using change in frequency and inertance response, Structural Analysis of Historical Constructions SAHC’2012, DWE, Wrocław 2012.
[2] Tomaževič M., Research for seismic redesign of historic masonry buildings, 4th
International Seminar on Structural Analysis of Historical Constructions, Padwa 2004.[3] Kwiecień A., Zając B., Dynamic response of the cracked masonry building repaired
with the Flexible Joint Method – an innovative earthquake protection, 7th International Conference of EASD EURODYN’2008, Southampton 2008.
[4] Ramos L.F., Lourenço P.B., DeRoeck G., Campos-Costa A., Damage identification in masonry structures with vibration measurements, Structural Analysis of Historic Construction – D’Ayala & Fodde (eds.) Taylor & Francis Group, London 2008.

12
[5] Kwiecień A.. Flexible polymer adhesives versus stiff mineral and epoxy adhesives tested dynamically on masonry columns strengthened using of bonded GFRP mesh, Proceedings of the 8th International Conference on Structural Dynamics, Eurodyn’2011, Leuven 2011.
[6] Kwiecień A., Zając B., Chełmecki J., Czado B., Zastosowanie złączy podatnych w dylatacjach posadzek betonowych, XXV Konferencja Naukowo-Techniczna Awarie Budowlane, Międzyzdroje 2013.
[7] PN-85/B-02170, Ocena szkodliwości drgań przekazywanych przez podłoże na budynki.[8] Sansalone M.J., Streett W.B., Impact-echo. Nondestructive evaluation of concrete and
masonry, Ithaca, NY: Bullbrier Press, 1997, 339.[9] Binda L., Tiraboschi C.: Flat-Jack Test: A slightly destructive technique for the
diagnosis of brick and stone masonry structures. International Journal for Restoration of Buildings and Monuments 5.5 (1999): 449-472.
[10] Maierhofer C., Ziebolz A., Köpp C., (Onsiteformasonry-a European Research Project: On-site investigation techniques for the structural evaluation of historic masonry, In Proc. Int. Symp. on Non-Destructive Testing in Civil Engineering. Berlin 2003.
[11] Binda L., Saisi A., Knowledge of the building, on site investigation and connected problems, Eurocode 2008 Perspectives from the Italian Standpoint, Workshop, © 2009 Doppiavoce, Napoli, Italy 213-224.
[12] Polyzos D., Dependence of AE parameters on the propagation distance, Progress in acoustic emission. Proceedings of the 20th international acoustic emission symposium, Japanese society for non-destructive inspection (JSNDI), Kumamoto, Japan. 2010.


![V2 L, LVstatic.tongtianta.site/paper_pdf/d82786be-81b7-11e9-8192...F bd(v2 v-) dt in which F, v and b represent the force, velocity and inertance ofthe systemrespectively [10]. henchanicalF.:](https://static.fdocuments.us/doc/165x107/5f7b56d2d1e17c7268721b43/v2-l-f-bdv2-v-dt-in-which-f-v-and-b-represent-the-force-velocity-and-inertance.jpg)