The Ineffectiveness of Inconspicuous Incentives: A … Ineffectiveness of Inconspicuous Incentives:...
36
The Ineffectiveness of Inconspicuous Incentives: A Field Experiment on Inattention Journal: Management Science Manuscript ID Draft Manuscript Type: Behavioral Economics Keywords: Economics: Behavior and Behavioral Decision Making, Incentives, Public Policy, Field Experiment, Inattention Abstract: Abstract: Policymakers in government and organizations regularly rely on incentive programs to encourage valued behaviors such as smoking cessation, educational achievement, home ownership, energy conservation, and savings. While often highly effective, there are also notable and surprising examples of their impotence. Why don’t incentives put in place by policy makers to change highly elastic decisions always produce the desired response? We demonstrate that even when incentives are transparently provided and easily trackable in real-time, a failure to make them conspicuous renders incentives ineffectual at shifting valuable behaviors. Specifically, we present evidence from a field experiment in which thousands of pedometer users were offered incentives for each step taken ($2 for every 10,000 steps) that could easily be tracked through a rewards application on their smart phones and an online portal, but only those users who received alerts highlighting these rewards increased their physical activity. We next present results from a nationally-representative survey study revealing that numerous incentive programs designed by the U.S. government to effect policy change are inconspicuous (namely, their intended beneficiaries are unaware of them) and thus likely far less effectual than they should be. Our findings lend support to recently- developed economic models proposing that inattention to incentives may be a common phenomenon with important consequences for policymakers, organizations and individual employees and citizens. ScholarOne, 375 Greenbrier Drive, Charlottesville, VA, 22901 Management Science
Transcript of The Ineffectiveness of Inconspicuous Incentives: A … Ineffectiveness of Inconspicuous Incentives:...
The Ineffectiveness of Inconspicuous Incentives: A Field
Experiment on Inattention
Journal: Management Science
Manuscript ID Draft
Manuscript Type: Behavioral Economics
Keywords: Economics: Behavior and Behavioral Decision Making, Incentives, Public Policy, Field Experiment, Inattention
Abstract:
Abstract: Policymakers in government and organizations regularly rely on incentive programs to encourage valued behaviors such as smoking cessation, educational achievement, home ownership, energy conservation, and savings. While often highly effective, there are also notable and surprising examples of their impotence. Why don’t incentives put in place
by policy makers to change highly elastic decisions always produce the desired response? We demonstrate that even when incentives are transparently provided and easily trackable in real-time, a failure to make them conspicuous renders incentives ineffectual at shifting valuable behaviors. Specifically, we present evidence from a field experiment in which thousands of pedometer users were offered incentives for each step taken ($2 for every 10,000 steps) that could easily be tracked through a rewards application on their smart phones and an online portal, but only those users who received alerts highlighting these rewards increased their physical activity. We next present results from a nationally-representative survey study revealing that numerous incentive programs designed by the U.S. government to effect policy change are inconspicuous (namely, their
intended beneficiaries are unaware of them) and thus likely far less effectual than they should be. Our findings lend support to recently-developed economic models proposing that inattention to incentives may be a common phenomenon with important consequences for policymakers, organizations and individual employees and citizens.
ScholarOne, 375 Greenbrier Drive, Charlottesville, VA, 22901
Management Science
The Ineffectiveness of Inconspicuous Incentives: A Field Experiment on Inattention
Leslie K. John
Harvard Business School
Katherine L. Milkman
The Wharton School
Francesca Gino
Harvard Business School
Bradford Tuckfield
Berkadia
Luca Foschini
Evidation Health
Abstract: Policymakers in government and organizations regularly rely on incentive programs to encourage valued behaviors such as smoking cessation, educational achievement, home ownership, energy conservation, and savings. While often highly effective, there are also notable and surprising examples of their impotence. Why don’t incentives put in place by policy makers to change highly elastic decisions always produce the desired response? We demonstrate that even when incentives are transparently provided and easily trackable in real-time, a failure to make them conspicuous renders incentives ineffectual at shifting valuable behaviors. Specifically, we present evidence from a field experiment in which thousands of pedometer users were offered incentives for each step taken ($2 for every 10,000 steps) that could easily be tracked through a rewards application on their smart phones and an online portal, but only those users who received alerts highlighting these rewards increased their physical activity. We next present results from a nationally-representative survey study revealing that numerous incentive programs designed by the U.S. government to effect policy change are inconspicuous (namely, their intended beneficiaries are unaware of them) and thus likely far less effectual than they should be. Our findings lend support to recently-developed economic models proposing that inattention to incentives may be a common phenomenon with important consequences for policymakers, organizations and individual employees and citizens. Acknowledgements: This research was supported by Humana, Harvard University’s Behavioral Insights Group, the Wharton Dean’s Research Fund, and Harvard University’s Foundations for Human Behavior. The authors gratefully acknowledge Kristine Mullen, Vice President of Wellness at Humana and Glenn Morell at Evidation Health for helping deploy the experiment and providing us with the anonymized data; Judd Kessler and Alex Rees-Jones for helpful feedback; and Holly Howe, David Mao, Andrew Marder, Tom Quisel and Andrew Young for statistical consulting and research assistance.
Page 1 of 35
ScholarOne, 375 Greenbrier Drive, Charlottesville, VA, 22901
Management Science
123456789101112131415161718192021222324252627282930313233343536373839404142434445464748495051525354555657585960
INTRODUCTION
Policymakers in government and organizations regularly rely on incentive programs to encourage
valued behaviors such as smoking cessation, educational achievement, home ownership, energy
conservation, charitable donations, and savings. While often effective (Charness & Gneezy, 2009; Imas,
2014; Royer, Stehr, & Sydnor, 2015; Sindelar, 2008; Volpp et al., 2008; Volpp et al., 2009), there are also
notable and surprising examples of their impotence (see Gneezy, Meier, & Rey-Biel, 2011 for some
examples). For instance, the Federal government offered the Hope, Lifetime Learning, and American
Opportunity Tax Credits to subsidize spending on higher education, and these incentive programs had a
negligible effect on college enrollments (Long, 2004; Bulman & Hoxby, 2015). One explanation could be
that the college enrollment decision is highly inelastic, but this decision has been shown to respond
dramatically when tax professionals simply help families fill out financial aid forms (Bettinger et al.,
2012). Another puzzling failure of incentives can be seen in a California program that offered discounts
on electricity if consumers cut back energy use by 20%. This program produced no measurable response
among coastal residents (Ito, 2015), but mailings merely letting people know how their energy usage
compares to that of their neighbors reliably and meaningfully reduce energy consumption (Allcott, 2011)
as do messages associating pollution due to energy usage with health and environmental problems
(Asensio & Delmas, 2015). These examples and many others present a puzzle: why don’t incentives put
in place by policy makers to change highly elastic decisions always produce the desired response? After
all, standard economic theory assumes that if you change incentives, rational agents’ utility maximization
calculations will respond by increasing the expected utility of engaging in any positively incentivized
behavior (Mas-Colell, Whinston, & Green, 2012). In this paper, we call this assumption into question,
demonstrating through a field experiment that even when incentives are transparently provided and easily
trackable in real-time, failing to make them conspicuous renders them completely and totally ineffectual.
Our findings lend support to recently-developed economic models proposing that inattention to
incentives may be a common phenomenon with important consequences (Grubb, 2014; Chetty, Looney,
& Kroft, 2009). Grubb (2014) proposes inattention as an explanation for actions taken recently by the
Federal Communications Commission (FCC) to reduce “bill shock,” or unexpected overage fees, in the
cell phone market. Even though cell phone usage data is freely available to customers at any time,
concerns that consumers frequently faced bill shock caused the FCC to compel U.S. carriers in 2011 to
begin sending usage alerts to customers when they had exceeded data limits and were thus at risk of
experiencing bill shock (FCC, 2015). Conversely, people’s judgments and decisions can be affected by
Page 2 of 35
ScholarOne, 375 Greenbrier Drive, Charlottesville, VA, 22901
Management Science
123456789101112131415161718192021222324252627282930313233343536373839404142434445464748495051525354555657585960
irrelevant but salient information (Dohmen, Falk, Huffman, & Sunde, 2006). Inattention of the type we
document here may not only lead to bill shock but to dramatic reductions in the efficacy of many
incentive policies, meanwhile leading numerous individuals to leave significant surplus on the table (de
Clippel et al., 2014; Dellavigna, 2009; Stango & Zinman, 2009, 2014; Armstrong & Vickers, 2012).
Following this past research, we test the hypothesis that the effectiveness of incentive programs
depends not simply on incentives’ presence or size, but, sometimes more crucially on their
conspicuousness. Consistent with this notion, past research has shown that the salience of information
influences individuals’ responses to taxation (Chetty et al., 2009; Finkelstein, 2009), car purchasing
decisions (Busse et al., 2013), water usage (Tiefenbeck et al., forthcoming), reactions to college rankings
(Luca & Smith, 2013). Moreover, accounting for individual differences in attentiveness can profoundly
change social welfare calculations, as has been shown in applications to energy nudges (Alcott &
Taubinsky, 2015) and sales tax inattention (Taubinsky & Rees-Jones, 2016). Past research on the efficacy
of reminders also points to the important challenge of inattention (Ericson, forthcoming; Karlan, Ratan, &
Zinman, 2014; Rogers & Milkman, forthcoming; Shea, DuMouchel, & Bahamonde, 1996). In this paper,
we first present evidence that offering easily trackable but inconspicuous incentives renders such
incentives completely ineffective (but costs nearly the same amount as offering conspicuous incentives).
Next, we show that the problem of deploying inconspicuous incentives is rampant in public incentive
programs offered in the United States, almost certainly dramatically limiting the impact of incentives as a
policy tool.
Study 1 is a large-scale field experiment that examines the effect of incentive conspicuousness on
behavior change. For two weeks, all participants were offered monetary incentives intended to increase
their physical activity levels and provided with constant, real-time access to the rewards they were
accruing. For half of participants, we implemented a shoestring marketing campaign intended to increase
the conspicuousness of the incentives. We find that incentives alone are insufficient to change behavior.
Physical activity levels were no higher among participants who were offered inconspicuous incentives
than among participants in a holdout comparison group that received no incentives. By contrast, the low-
touch marketing campaign was sufficient to unlock the power of incentives to meaningfully boost
exercise (increasing daily step counts by 200 to 400 steps depending on the estimation model for every
day of the two week program and the two weeks that followed). Simply put, study 1 shows that the
conspicuousness of incentives is absolutely critical to their impact (far more critical than their presence, in
fact).
Page 3 of 35
ScholarOne, 375 Greenbrier Drive, Charlottesville, VA, 22901
Management Science
123456789101112131415161718192021222324252627282930313233343536373839404142434445464748495051525354555657585960
Study 2 speaks to the implications of the problem identified by study 1: without making incentive
programs conspicuous, even the most well-intended and well-structured incentive programs can be for
naught. Study 2 polls a representative sample of United States citizens, probing them for their knowledge
—or more aptly, lack thereof—of a wide variety of federal subsidy programs. Specifically, respondents
were presented with a list of subsidy programs and tasked with identifying which were actual incentives
offered by the US government (versus distractor incentive programs, which were programs offered in
other countries but not in the U.S.). We find that, on average, participants correctly categorize only 63%
of the subsidies. If this were a test, our respondents would get a D. Moreover, among the subsidies for
which respondents believed themselves to be eligible, the uptake rate was only 55%. Given that
inconspicuous incentives are ineffective, as shown in study 1, study 2 suggests that the U.S. government
is likely influencing dramatically fewer behaviors through incentives than it could be if many of its
inconspicuous incentive programs were more aggressively marketed.
The remainder of this paper is organized as follows. First, we present results from our field
experiment demonstrating that only conspicuous incentives promote behavior change (increased physical
activity) in a highly policy-relevant setting (425,000 Americans die prematurely each year due to physical
inactivity and diet; Mokdad et al., 2000). We next present results from our survey study highlighting that
numerous incentive programs designed by the U.S. government to effect policy change are inconspicuous
and thus likely far less effectual than they should be. Finally, we conclude with a discussion of our
findings, their implications for research and policy, and directions for future research.
STUDY 1: FIELD EXPERIMENT
Our field experiment examines the impact of conspicuous versus inconspicuous incentives on
physical activity.
Methods
We randomly assigned 2,055 pedometer users to one of two experimental conditions. All users
received incentives for walking and had access to information about incentives, which could easily be
tracked through a rewards application available on their smart phones and an online portal. All users also
received weekly emails updating them on their total earnings. Users in the conspicuous incentives
condition received eight extra emails containing information about offered incentives. Users in the
inconspicuous incentives condition did not receive these extra emails. As expected, we found no
significant differences in the observable pre-treatment characteristics of the two experimental groups
(Table 1).
Page 4 of 35
ScholarOne, 375 Greenbrier Drive, Charlottesville, VA, 22901
Management Science
123456789101112131415161718192021222324252627282930313233343536373839404142434445464748495051525354555657585960
Participants
Our study population was composed of users of an online platform called Achievemint, a reward
platform for healthy activities powered by Evidation Health. Achievemint users can link their Fitbit
pedometers with the Achievemint platform by authorizing their recorded step counts to be automatically
transferred to their Achievemint account.
Every time an Achievemint user takes 200 steps, he or she earns one point from the platform.
Points are redeemable for cash rewards: after a user has taken 200,000 steps, he or she earns $1.00. Users
receive a check for every $25 earned. Achievemint sends all users a weekly update email that contains
information on a user’s current number of unredeemed points.
Of the Achievemint users who had linked Fitbit devices, we selected 2,055 for our study based on
three eligibility criteria. First, users who had been part of a previous study of incentives for exercise were
excluded. Second, users whose historical usage data indicated that they opened fewer than one email per
month from Achievemint were excluded. Third, users whose historical usage data indicated that they were
above the 70th percentile for mean daily steps were excluded. These exclusions were based on calculations
that indicated that a test with this sub-population would yield about 90% statistical power to detect a 15%
difference between conditions in step counts over a two week period using two-sided t-tests. Our
experimental protocol was approved by the Institutional Review Board of the University of Pennsylvania.
A waiver of informed consent was approved per Federal regulations (45 CFR 46.116(d)) in light of the
fact that the study was minimum risk, did not adversely affect the rights and welfare of participants, and
could not be practicably carried out without the waiver.
Procedures
Achievemint users meeting eligibility requirements were randomly assigned to one of two
experimental conditions: a conspicuous incentives condition or an inconspicuous incentives condition. All
study participants received the same incentive to walk in the form of a “point multiplier,” such that the
Achievemint points that they earned were multiplied by 40 for two weeks (that is, for every 200,000
steps, they earned $40.00 instead of the usual $1). Participants in the conspicuous incentives condition (n
= 1,027) received emails (in addition to Achievemint’s standard weekly update emails) detailing the
duration and magnitude of these point multipliers. Participants in the inconspicuous incentive condition (n
= 1,028) did receive point multipliers, but did not receive extra emails about the point multipliers. All
participants were able to track their Achievemint points through the Achievemint app, website, and
through standard weekly update emails.
Page 5 of 35
ScholarOne, 375 Greenbrier Drive, Charlottesville, VA, 22901
Management Science
123456789101112131415161718192021222324252627282930313233343536373839404142434445464748495051525354555657585960
Participants received point multipliers for two weeks from Jan. 27, 2015 through Feb. 9, 2015.
Participants in the conspicuous incentives condition received a kickoff email on Jan. 26, 2015: the day
before the start of the point multiplier incentives. This email featured the subject line: “New Program to
Encourage You to Walk (earn Bonus Points).” The contents of this email (depicted in Supporting
Information, Figure S1) explained to participants that they had been enrolled in a program to increase
their walking. It showed a calendar with point multipliers highlighted on each day when they would be
rewarded (every day for the next two weeks). Conspicuous incentive condition participants also received
email reminders about the program every other day for its duration (seven additional emails on days 1, 3,
5, 7, 9, 11, and 13 of the experiment), which contained all of the same information including the schedule
of incentives depicted on a calendar. A reminder email is depicted in Supporting Information, Figure S2.
No participants opted out of the incentive program. However, as we discuss further in the results
section, some participants did not record daily steps on some days, either because they failed to wear
Fitbits, or because they did not sync their Fitbit data with Achievemint. Other participants may have worn
Fitbits only for a brief portion of a given day.
Statistical Analyses
Our outcome variable of interest was daily steps walked. Participants’ daily steps were tracked for
two weeks before the intervention and during the intervention, and for four weeks after the intervention.
We tested for evidence of differential responses to incentives by condition by comparing mean daily steps
in each group during and after the end of the intervention period.
Our statistical analysis strategy was a difference-in-differences approach. Like other standard
difference-in-differences analyses (e.g., Pope & Pope, 2015), our analyses include covariates for
experimental condition, temporal indicators (during-, and post-intervention), and the interaction of
experimental condition and temporal indicators. We chose difference-in-differences analysis rather than
simple comparison of groups because it is effective at “comparing the time changes in the means for the
treatment and control groups” so that “both group-specific and time-specific effects are allowed for”
(Wooldridge, 2010, p. 148). It therefore enables comparisons between experimental groups (conspicuous
and control) at different times (during and after the intervention). The coefficients of interest in
regressions of this form are the interactions of experimental condition and temporal indicators. These
coefficients measure the effect of the treatment at a given time period (Wooldridge, 2010, p. 148).
Importantly, our study uses random assignment to experimental condition, so experimental groups are the
same in expectation. This enables our analysis to avoid many potential methodological issues that come
Page 6 of 35
ScholarOne, 375 Greenbrier Drive, Charlottesville, VA, 22901
Management Science
123456789101112131415161718192021222324252627282930313233343536373839404142434445464748495051525354555657585960

from using difference-in-differences methods to compare groups that have significant underlying
differences (Athey & Imbens, 2002).
We use ordinary least squares regressions with fixed effects for all of our analyses. To account
for different walking levels on different days (due to weather, day of week, and seasonality), we include
fixed effects for each day observed in the dataset. It would be natural to include user fixed effects in an
analysis such as this one to account for different individual activity levels. However, in addition to
varying in overall activity levels, individuals likely vary on their patterns of activity throughout a given
week. For example, some individuals may take a recreational Sunday walk, while others walk more
during the week as part of a commute. Individuals work on different days and have different exercise and
gym attendance habits. To account for these detailed individual differences, we employ fixed effects that
are more specific than user fixed effects. Specifically, we include fixed effects for an interaction of user
with day of the week (Monday, Tuesday, etc.): seven fixed effects per individual. We also cluster
standard errors at the user level, to account for possible serial correlation within a user’s daily steps over
time. This analysis increases our ability to identify experimental treatment effects.
The following is the ordinary least squares (OLS) regression equation used to estimate the
coefficients shown in Table 2 as part of our difference-in-differences strategy.
Equation 1.
���������� =�� + ��������������� + ������
+������������_��������� × ����� ����!���
+������������_��������� × ����ℎ��15������������!���
+�%����������_�������� × &���15���21������������!���
+(��
In this equation, conspicuous_incentivesi is an indicator variable taking on a value of one if an
individual, i, was in the conspicuous condition and zero otherwise; dayt is a fixed effect for each day
included in the data; userxdayofweekit is a fixed effect for user-day-of-week, and the other variables
represent 0-1 indicators for whether an observation occurred during, within the first two weeks after, or
during the third week after the intervention. The ��, ��, and �% coefficients therefore measure the
differences between conspicuous incentive condition participants and inconspicuous incentive condition
participants during, shortly after, and long after the experimental intervention.
In addition to our primary analyses, which measure the difference between our experimental
groups, we conducted supplemental analyses to compare incentivized participants with participants in a
Page 7 of 35
ScholarOne, 375 Greenbrier Drive, Charlottesville, VA, 22901
Management Science
123456789101112131415161718192021222324252627282930313233343536373839404142434445464748495051525354555657585960
matched holdout group. We selected the matched holdout group from the same pool of app users from
which the experimental participants were selected (Achievemint users with linked Fitbit accounts). To
select a holdout group that closely matched the experimental group in observable, including demographic,
characteristics, we selected Achievemint users who were excluded only because they had been
participants in a previous experiment, but who would not have been excluded otherwise (because they
met all other inclusion criteria as experimental participants).
The following is the OLS regression equation used to estimate the effect of receiving incentives
in the inconspicuous incentives group in our experiment versus receiving no incentives, and coefficients
from this regression analysis are shown in Table 3 as part of our secondary difference-in-differences
analysis. This regression’s standard errors were also clustered by user.
Equation 2.
���������� =�� + ��������������� + ������
+�������!��� × ����� ����!���
+�������!��� × ����ℎ��15������������!���
+�%�����!��� × &���15���21������������!���
+�)����������_��������� × ����� ����!���
+�*����������_��������� × ����ℎ��15������������!���
+�+����������_��������� × &���15���21������������!���
+(��
In this equation, inexperimenti is an indicator variable taking on a value of one if an individual, i, was in
the experiment and zero otherwise, conspicuous_incentivesi is an indicator variable taking on a value of
one if an individual, i, was in the conspicuous condition and zero otherwise, dayt is a fixed effect for each
day included in the data, userxdayofweekit is a fixed effect for user-day-of-week, and the other variables
represent 0-1 indicators for whether an observation occurred during, within two weeks after, or in the
third week after the intervention. Like Equation 1, Equation 2 represents a difference-in-differences
analysis strategy. The matched holdout group was carefully selected so that it would not differ in
expectation from the experimental group.1
RESULTS
1 Since difference-in-differences analyses can encounter problems when comparing groups with underlying
differences, it is possible that our analyses using Equation 2 (found in Table 3) are biased. However, our matched holdout group was selected specifically to be similar to the experimental group in observable characteristics.
Page 8 of 35
ScholarOne, 375 Greenbrier Drive, Charlottesville, VA, 22901
Management Science
123456789101112131415161718192021222324252627282930313233343536373839404142434445464748495051525354555657585960

Figure 1 shows the differences in mean daily steps taken by participants in the conspicuous and
inconspicuous incentives conditions before, during, and after our intervention. As predicted, Figure 1
shows that users in the conspicuous incentives condition had a higher mean daily step-count both during
and after the intervention relative to the inconspicuous incentives group. To test the significance of these
differences, we turn to regression analyses. We are able to identify the effects of our intervention with
considerable precision by controlling for individual differences in pre-intervention propensity to walk
while identifying differences between our experimental groups in during- and post-intervention behavior.
As described previously, our analysis uses a difference-in-differences regression strategy, which in
general enables comparisons between groups and over time. For our research, the difference-in-
differences strategy enables us to compare the mean daily steps of the participants in the conspicuous
incentives group with the mean daily steps of participants in the inconspicuous incentives group during,
shortly after, and long after our experimental intervention.
Table 2 shows the results of OLS regressions predicting daily steps with fixed effects for each
participant on each day of the week as well as date fixed effects. The primary predictor variables of
interest are interactions between an indicator for our conspicuous incentives condition and indicators for
each of the time periods studied during and post-intervention (two weeks during the intervention, two-
weeks immediately post-intervention, and three weeks post-intervention). Standard errors are clustered by
participant and reported in parentheses. The primary coefficients of interest in these regressions estimate
the difference between conspicuous and inconspicuous incentives groups’ mean daily steps during each
time period of interest during and post-intervention after absorbing: (a) average individual differences in
exercise as a function of day of week, (b) average pre-treatment differences in participants across
condition (since the same participant is always in the same experimental condition), and (c) average
differences in participant exercise by date.
Table 2, Model 1 reports the results of this regression estimated on an intent-to-treat basis. As we
predicted, conspicuous incentive condition participants took significantly more daily steps during the
intervention than inconspicuous incentive participants (an estimated 367 extra daily steps, p < 0.01).
Further, our regression estimates indicate that participants in the conspicuous incentives condition took
more daily steps than those in the inconspicuous condition for the two weeks after our intervention (an
estimated 332 extra daily steps, p < 0.01), although the regression estimated effect dissipated three weeks
after our intervention (an estimated 146 extra daily steps, NS).
Page 9 of 35
ScholarOne, 375 Greenbrier Drive, Charlottesville, VA, 22901
Management Science
123456789101112131415161718192021222324252627282930313233343536373839404142434445464748495051525354555657585960
One concern about the above results is that they could be driven by differential use of Fitbits
rather than differential exercise if conspicuous incentives prompted participants to wear their Fitbits more
often than participants in our inconspicuous incentives condition without actually changing their walking
habits. One way of addressing this concern is to examine differences in attrition by condition. One
measure of attrition in Fitbit usage could be indicated by a user recording zero steps for a given day.
Attrition could also be indicated by a user recording a small, nonzero number of steps, for example if he
or she only wore a Fitbit for a brief part of a day. A previous study of walking with an adult participant
pool consisting of several thousand people with no attrition found that participants never took fewer than
2,000 steps per day (Hivensalo et al., 2011). We therefore used a very conservative 2,000 steps as a cutoff
for defining a participant an “attriter”: days on which a given user recorded fewer than 2,000 steps were
regarded as a failure to properly wear and sync Fitbits (note that all reported results are stronger if we
instead define attrition as 0 steps per day). Table 1 shows the numbers of attriters in each experimental
condition, during each time period. We performed two-sample proportion tests to determine whether the
conspicuous and inconspicuous incentives groups had different attrition rates during, shortly after, and
long after our intervention. We see (in Table 1) no significant differences at the 0.05 significance level
between the attrition rates in the experimental conditions during, shortly after, or long after our
experimental intervention.
However, to ensure the robustness of our regression results to attrition, we replace our intent-to-
treat analysis with an even more conservative test of our hypothesis by deleting all person-day
observations from both experimental conditions that show fewer than 2,000 daily steps logged. Table 2,
Model 2 shows our primary regression estimated only on the subset of data containing observations of
daily steps that are greater than 2,000.
The coefficient estimates reported in Table 2, Model 2 provide more evidence that conspicuous
incentives boost step counts significantly and that the observed effects reported in Model 1 are not
artifacts of differential attrition. According to the estimates from Model 2, which again control for
participant-day-of-the-week fixed effects and date fixed effects, non-attriting participants in the
conspicuous incentives condition took more steps than participants in the inconspicuous incentives
condition during the intervention (an estimated 229 extra daily steps, p < 0.05) and up to two weeks after
the intervention (an estimated 211 extra daily steps, p < 0.10), but not 3 weeks after the intervention (an
estimated 96 extra daily steps, NS). Although the coefficient estimates in this model are slightly smaller
than those in Model 1, the effects of the intervention during the intervention period and for the two weeks
Page 10 of 35
ScholarOne, 375 Greenbrier Drive, Charlottesville, VA, 22901
Management Science
123456789101112131415161718192021222324252627282930313233343536373839404142434445464748495051525354555657585960
post-intervention remain large, positive and significant, indicating that differences between experimental
groups cannot be explained by differential attrition.
All results reported thus far have compared users across our two experimental conditions
(conspicuous incentives and inconspicuous incentives). Both experimental groups however, received the
same inflated incentives during our two week intervention period. Thus, while we have measured the
effect of incentive conspicuousness on behavior, we have not measured the effect of the incentives
themselves. Of course, this was not the goal of our research, but it is useful to understand how magnifying
the conspicuousness of incentives compares with providing incentives in the first place. We use a
difference-in-differences regression estimation strategy to compare the change in pre- versus during- and
post-intervention behavior of participants in our inconspicuous incentives group versus participants in a
holdout group who were excluded from our experiment only because they had previously participated in
another, unrelated experiment, but who otherwise would have been eligible for participation. Because this
group met the study’s eligibility criteria based on observable characteristics, it provides an ideal control
group for comparisons with experimental participants in a difference-in-differences analysis.
Table 3 shows results of ordinary least squares regressions predicting daily steps with fixed
effects for user-day-of-week and the calendar date. The predictor variables are interactions of
experimental status (in experiment, in conspicuous incentives condition) and different time periods
during- and post-intervention. Standard errors are clustered by participant and reported in parentheses. As
in Table 2, the results from two models are included: Model 1 includes all users, whereas Model 2
accounts for possible differential attrition between groups. The first three coefficients in these regressions
estimate the difference between inconspicuous incentive participants’ and holdout users’ mean daily steps
at each time period—that is, they estimate the effects of the incentives themselves after controlling for
user-day-of-week and calendar date fixed effects. The second three coefficients estimate the difference
between conspicuous incentive participants’ and inconspicuous incentive participants’ mean daily steps at
each time period—that is, they estimate the marginal effect of conspicuousness on responses to
incentives, again after controlling for user-day-of-week and calendar date fixed effects.
The results in Table 3 indicate that inconspicuous incentive group participants’ behavior did not
differ from the behavior of holdout group participants during the intervention, though they may have
differed after the intervention in the opposite of the intended direction (at 0–2 weeks post intervention one
of the models oddly shows a statistically significant difference such that inconspicuous incentive group
members exercised less than members of the holdout group). The size and significance of the coefficients
Page 11 of 35
ScholarOne, 375 Greenbrier Drive, Charlottesville, VA, 22901
Management Science
123456789101112131415161718192021222324252627282930313233343536373839404142434445464748495051525354555657585960
estimated in Table 3, in both models, indicates that although making incentives conspicuous was effective
in changing behavior as shown in Table 3, incentives alone without any emphasis did not meaningfully
alter exercise.
Robustness Tests
In addition to the analyses reported here, we conducted a variety of robustness checks on our results
(see Supporting Information). Specifically, we performed robustness checks with the following
specification details:
• We clustered data by user-day-of-week, using data only on experimental participants (Table S1)
• We clustered data by user-day-of week, using data on experimental participants together with the
matched holdout group (Table S2)
• We clustered data by user, winsorizing step counts at the 99% level, using data only on
experimental participants (Table S3)
• We clustered data by user-day-of-week, winsorizing step counts at the 99% level, using data only
on experimental participants (Table S4)
• We clustered data by user, winsorizing step counts at the 99% level, using data on experimental
participants together with the matched holdout group (Table S5)
• We clustered data by user-day-of-week, winsorizing step counts at the 99% level, using data on
experimental participants together with the matched holdout group (Table S6)
In each of these models, users in the conspicuous incentives condition take more daily steps than users in
the inconspicuous incentives condition both during and up to two weeks after the experimental
intervention, with p < 0.05 for both of these coefficients in each model.
STUDY 2: NATIONALLY REPRESENTATIVE SURVEY
Study 1 demonstrates that incentives alone are insufficient to change behavior. Specifically,
physical activity levels were no higher among participants who were offered inconspicuous incentives
than among those in a holdout comparison group who received no incentives. By contrast, a simple and
inexpensive marketing campaign designed to make these incentives more conspicuous was sufficient to
unlock the power of incentives to meaningfully change behavior for the better. Study 2 extends this
finding by exploring its broader implication: without making incentive programs conspicuous, even the
most well-intended and well-structured of incentive programs can be for naught. In study 2, we polled a
representative sample of United States residents, assessing their awareness of a wide variety of federal
Page 12 of 35
ScholarOne, 375 Greenbrier Drive, Charlottesville, VA, 22901
Management Science
123456789101112131415161718192021222324252627282930313233343536373839404142434445464748495051525354555657585960
subsidy programs to assess the extent to which inconspicuous incentives may be limiting the policy
impact of U.S. rewards programs.
Methods
A nationally representative sample of United States citizens (N = 106, 48.1% male, M(SD)age =
48.07(16.45)) completed this survey in exchange for $0.75. Participants were presented with a
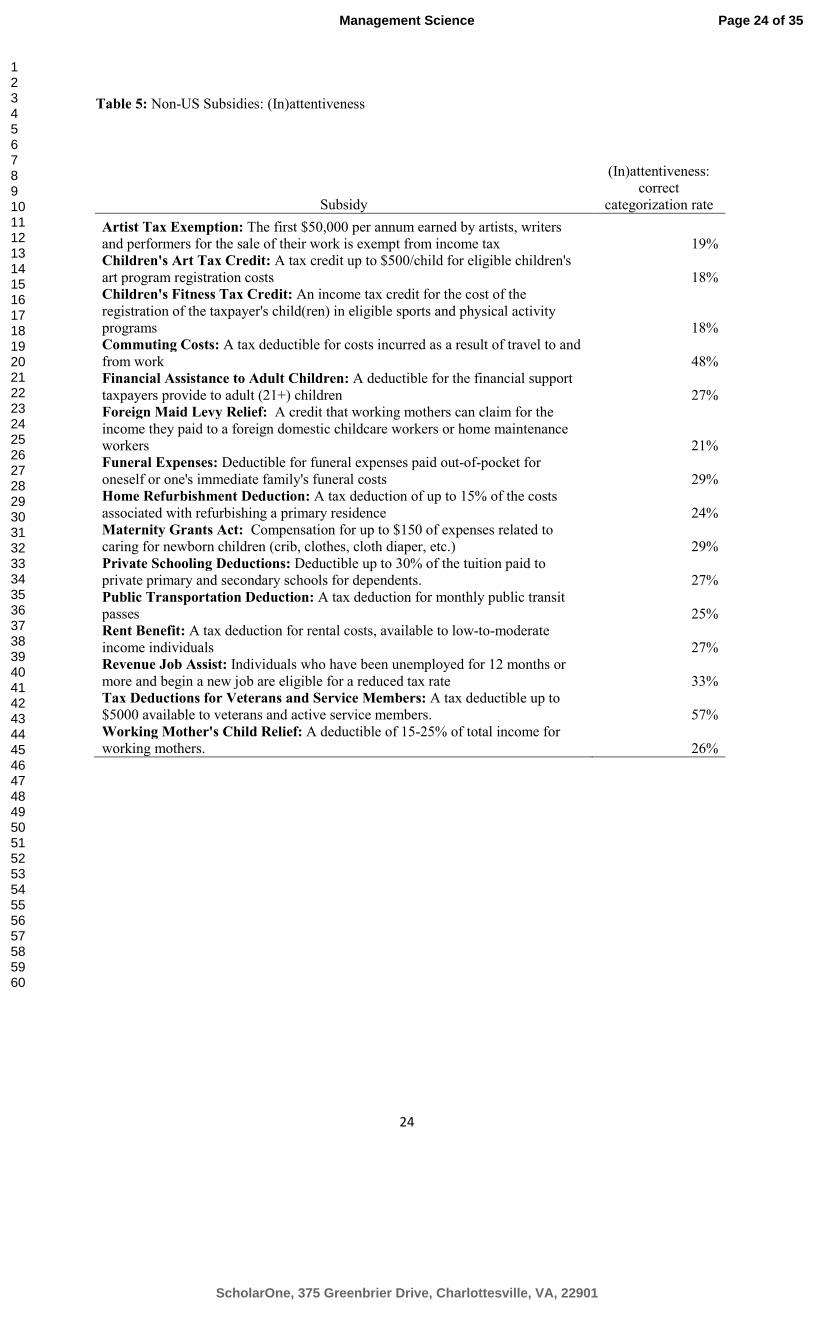
randomized list of 35 subsidies, 20 of which were real incentives offered to U.S. citizens (e.g., childcare
savings accounts, charitable donations deductions, and health savings accounts; Table 4); the other 15,
distractor subsidies, were real incentives offered in other countries, and not available to U.S. citizens (e.g.,
public transportation deduction, and working mothers’ child relief; Table 5).
To assess U.S. citizens’ attentiveness to government subsidies for which they may be eligible, we
asked participants to indicate, for each subsidy, whether it was “available to US citizens (i.e., a real IRS
tax incentive)” versus “not available to US citizens (i.e., not a real IRS tax incentive).” U.S. tax subsidies
were pulled from the first fifty posts on TurboTax’s “Tax Deductions and Credits” website section in July
2016. Posts were not included if they had not been updated for the 2015 tax season. The subsidies that
were not US subsidies were in fact legitimate subsidies in other countries. To ensure that the subsidies
we chose for this survey were neither particularly well-known nor obscure, we conducted a pilot test in
which we asked participants (N = 106) to perform the same categorization task as that eventually used in
the main study, but for a larger list of 44 subsidies. We used this pilot test to generate a more manageable
list of 35 subsidies that were representative with respect to the extent to which they were known, for use
in the main study.
After having completed the categorization task, the rest of the survey focused exclusively on the
20 real US subsidies. Specifically, we assessed uptake and perceived eligibility: for each of the 20
subsidies, participants were asked: “Have you ever claimed this incentive?” (Yes / No / I don’t know) and
“Do you believe you are eligible for this incentive? (e.g., if you tried to claim it this year, would your
claim be accepted?” (Yes / No). The survey concluded with demographic questions including age, gender,
education, annual household income.
Results
(In)attentiveness. On average, participants correctly categorized only 63% of the subsidies.
Although this rate is significantly better than chance (z = 2.71, p = .0068), it clearly leaves room for
improvement. In fact, if this were a test, the average grade would be a D. Performance was no different
for the U.S. versus non-U.S. subsidies (z = 0.95, p = .34).
Page 13 of 35
ScholarOne, 375 Greenbrier Drive, Charlottesville, VA, 22901
Management Science
123456789101112131415161718192021222324252627282930313233343536373839404142434445464748495051525354555657585960
Perceived Eligibility. On average, participants believed they were eligible for 23% of the U.S.
subsidies, with perceived eligibility for individual subsidies ranging from 10% of the sample (for the
Alternative Fuel Vehicle Refueling Property Credit) to 52% (for the charitable donations subsidy).
Uptake. We assessed, among respondents believing they were eligible for a given subsidy, the
percent that had actually redeemed it. For example, 19% of respondents believed they were eligible for
the American Opportunity Tax Credit, which offers up to $2500 for tuition expenses and course materials;
of these respondents, only 40% said that they had claimed it. On average, participants perceived
themselves to be eligible for 23% of the subsidies. Among the subsidies for which respondents believed
themselves to be eligible, the uptake rate was only 55%.
In sum, study 2 shows that participants claim government subsidies in roughly half of the
instances when they are eligible to do so. We suggest that inattentiveness—the fact that participants could
correctly identify the US subsidies only 63% of the time—is likely a major culprit of these low
redemption rates. Taken together, the results of study 1 and study 2 suggest that if inattentiveness could
be addressed, uptake and efficacy of well-intended US incentive programs could be greatly enhanced,
with even the most modest of marketing campaigns.
DISCUSSION
Both policy makers and scholars have long relied on incentives as a key lever for changing
behavior. But even in contexts where preferences have been proven elastic, the benefits of incentivizing
desirable behaviors have often proven surprisingly small or nonexistent, contrary to the predictions of
standard economic theory (Mas-Colell et al., 2012). In this paper, we provide an explanation for the
apparent inconsistency between theory and observed behavior by showing that even when incentives are
transparent and can be easily tracked in real-time, they do not change behavior unless they are made
conspicuous. Based on evidence from a randomized field experiment aimed at increasing healthy habits
(walking more steps per day) and a survey we conducted on a representative sample of United States
citizens, we show the critical role of attention to incentives in driving behavioral change. Our research
contributes to an emerging body of evidence suggesting that neither incentives alone nor the mere
awareness of a problem (Bronchetti, Huffman, & Magenheim, 2015) is insufficient to change behavior
(Tiefenbeck et al., forthcoming) and helps to explain why so many Americans fail to take advantage of
incentive programs for which they are eligible.
In the last several years we have witnessed increased interest from academics and policy makers
in the use of behavioral insights to drive behavioral change (Chapman, Colby, & Yoon, 2010;
Page 14 of 35
ScholarOne, 375 Greenbrier Drive, Charlottesville, VA, 22901
Management Science
123456789101112131415161718192021222324252627282930313233343536373839404142434445464748495051525354555657585960
Loewenstein, Asch, & Volpp, 2013; Shafir, 2012). From the 2015 Obama directive to use such insights to
inform U.S. policy making to the creation of dozens of Behavioral Insights Units across the globe,
understanding human behavior appears to have become a must for policy makers seeking to devise
policies that can effectively address important societal problems ranging from eliminating cheating on
taxes to increasing school attendance, reducing smoking, fighting obesity, to increasing civic engagement.
Importantly, standard randomized, controlled trials conducted to evaluate the efficacy of incentives with
the goal of proving their policy efficacy certainly overestimate their impact in natural environments
because such trials focus attention on making their participants fully aware of all incentives on offer,
which does not mirror natural contexts. Our research contributes to a growing literature suggesting how
behavioral science can inform policy.
In Study 1, we conducted a field experiment and showed that physical activity levels did not
differ among participants who were offered inconspicuous incentives and those in a comparison holdout
group that received no incentives. What made a difference in increasing physical activity in this context
was a simple marketing campaign that made incentives more conspicuous. And consistent with studies
that have provided (salient) incentives for people to exercise (Charness & Gneezy, 2009; Acland & Levy,
2010), our treatment effect persists; it does not extinguish until well after incentives are removed. In study
2, we build on these findings by exploring their broader implications: without making incentive programs
conspicuous, even the most well-structured incentive programs do not produce the intended and expected
changes in behavior. Specifically, using a representative sample of United States citizens, we find that a
large percentage of them are unaware of many federal subsidy programs from which they could benefit—
essentially free money.
Our findings provide empirical evidence consistent with recently-developed economic models
suggesting that inattention to incentives is common and has important consequences (Grubb, 2014).
Inattention of the type we document here is likely the root cause of failures in the efficacy of many
incentive policies, preventing many people from accruing the benefits they deserve (and/or qualify to
receive). We hope our work will inspire further research on inattention and how to best reduce it, ensuring
that valuable policies achieve their well-intended goal of changing behavior for the better.
Page 15 of 35
ScholarOne, 375 Greenbrier Drive, Charlottesville, VA, 22901
Management Science
123456789101112131415161718192021222324252627282930313233343536373839404142434445464748495051525354555657585960
REFERENCES
Acland D, Levy, M (2015) Naiveté, projection bias, and habit formation in gym attendance. Manage. Sci.
61(1): 146–160
Allcott H (2011). Social norms and energy conservation. J. Public Econ. 95(9–10):1082–1095.
Allcott H, Taubinsky, D (2015). Evaluating behaviorally motivated policy: Experimental evidence from
the lightbulb market. American Economic Review 105(8): 2501-2538.
Armstrong M, Vickers J (2012) Consumer protection and contingent charges. J
Econ. Lit. 50(2): 477–493.
Asensio OI, Delmas, MA (2015) Nonprice incentives and energy consumption. PNAS 112(6):E510–E515
Athey S, Imbens GW (2002) Identification and in nonlinear difference-in-differences models. SIEPR
Discussion Paper No. 01-25.
Bettinger EP, Long BT, Oreopoulos P, Sanbonmatsu, L (2012) The role of application assistance and
information in college decisions: Results from the H&R Block FAFSA experiment." Q. J.
Econ.127(3): 1205–1242.
Bronchetti ET, Huffman D, Magenheim E (2015) Attention, intentions and follow-through in preventative
health behavior: Field experimental evidence on flu vaccination. J. Econ. Behav. Organ.
116:270–291
Bulman GB, Hoxby CM (2015) The returns to the federal tax credits for higher education. Working Paper
20833, National Bureau of Economic Research, Cambridge, MA.
Busse MR, Lacetera N, Pope DG, Silva-Risso J, Sydnor J (2013) Estimating the effect of salience in
wholesale and retail car markets. Am. Econ. Rev: Pap. P. 103(3):575–579.
Centers for Disease Control and Prevention (2014) State indicator report on physical activity. Accessed
May 26, 2015.
http://www.cdc.gov/physicalactivity/downloads/pa_state_indicator_report_2014.pdf
Chandon P, Hutchinson JW, Bradlow ET, Young SH (2009). Does in-store marketing work? Effects of
the number and position of shelf facings on brand attention and evaluation at the point of
purchase. J. Marketing 73(6):1–17.
Chapman G, Li M, Colby H, Yoon H (2010) Opting In vs Opting Out of Influenza Vaccination. Journal
of the American Medical Association 304(1):43-44.
Charness G, Gneezy U (2009) Incentives to exercise. Econometrica 77(3):909–931.
Page 16 of 35
ScholarOne, 375 Greenbrier Drive, Charlottesville, VA, 22901
Management Science
123456789101112131415161718192021222324252627282930313233343536373839404142434445464748495051525354555657585960
Chetty R, Looney A, Kroft K (2009) Salience and Taxation: Theory and Evidence. American Economic
Review. 99(4): 1145-1177.
de Clippel G, Eliaz K, Rozen K (2014) Competing for consumer inattention. J. Polit. Econ. 122(6):1203–
1234.
Dellavigna S (2009) Psychology and economics: Evidence from the field. J. Econ. Lit. 47(2):315–372.
Dohmen T, Falk A, Huffman D, Sunde U (2006) Seemingly irrelevant events affect economic perceptions
and expectations: The FIFA World Cup 2006 as a natural experiment. Working Paper 2275,
Institute for the Study of Labor, Bonn, Germany.
Ericson, Keith M. (forthcoming) On the Interaction of Memory and Procrastination: Implications for
Reminders, Deadlines, and Empirical Estimation. Journal of the European Economic Association
Federal Communications Commission (2015) Bill shock. Accessed September 29, 2016,
https://www.fcc.gov/general/bill-shock
Finkelstein, Amy (2009). E-ZTAX: Tax Salience and Tax Rates. The Quarterly Journal of Economics,
124 (3), 969–1010.
Flegal KM, Carroll MD, Ogden CL, Curtin LR (2010) Prevalence and trends in obesity among U.S.
adults, 1999-2008. J. Am. Med. Assoc. 303(3):235–241.
Gneezy U, Meier S, Rey-Biel P (2011) When and why incentives (don’t) work to modify behavior. J.
Econ. Perspect. 25(4):191–209.
Grubb MD (2014) Consumer inattention and bill-shock regulation. Rev. Econ. Stud. 82(1):219–257.
Hivensalo M, Telama R, Schmidt MD, Tammelin TH, Yang X, Magnussen CG, Viikari JSA, Raitakari
OT (2011) Daily steps among Finnish adults: Variation by age, sex, and socioeconomic position.
Scand. J. Public Healt. 39(7):669–677.
Imas, A (2014) Working for ’Warm Glow’: On the Benefits and Limits of Prosocial Incentives,
Journal of Public Economics, 114: 14-18.
Ito K (2015). Asymmetric incentives in subsidies: Evidence from a large-scale electricity rebate
program. American Economic Journal: Economic Policy, 7, 209-237.
Karlan, D., Ratan, A. L., & Zinman, J. (2014) Savings by and for the poor: A research review and agenda.
Review of Income and Wealth, 60, 36–78.
Loewenstein G, Asch DA, Volpp KG (2013) Behavioral economics holds potential to deliver better
results for patients, insurers, and employers. Health Affairs, 32(7): 1244-250.
Page 17 of 35
ScholarOne, 375 Greenbrier Drive, Charlottesville, VA, 22901
Management Science
123456789101112131415161718192021222324252627282930313233343536373839404142434445464748495051525354555657585960
Long M (2004) The impact of asset-tested college financial aid on household savings. J. Pub. Econ.
88(1):63–88.
Luca M, Smith J (2013) Salience in quality disclosure: Evidence from the US News college rankings. J.
Econ. Manage. Strat. 22(1):58–77.
Mas-Colell A, Whinston M, Green J (1995). Microeconomic Theory (Oxford University Press, Oxford
U.K.)
Mokdad AH, Marks JS, Stroup DF, Gerberding JL (2004). Actual causes of death in the United States,
2000. J. Am. Med. Assoc. 291(10):1238–1245.
Pope D, Pope JC (2015) When Walmart comes to town: Always low housing prices? Always? J. Urban
Econ. 87:1–13
Rogers, T., and K.L. Milkman (forthcoming) Reminders through Association. Psychological Science.
Royer H, Stehr M, Sydnor J (2015). Incentives, commitments, and habit formation in exercise: Evidence
from a field experiment with workers at a Fortune 500 company. Am. Econ. J: Appl. Econ.
7(3):51–84.
Shafir, E. (2012) The Behavioral Foundations of Public Policy. Princeton, NJ: Princeton
University Press.
Shea, S., DuMouchel, W., & Bahamonde, L. (1996) A metaanalysis of 16 randomized controlled trials to
evaluate computer-based clinical reminder systems for preventive care in the ambulatory setting.
Journal of the American Medical Informatics Association, 3, 399–409.
Sindelar JL (2008) Paying for performance: The power of incentives over habits. Healt. Econ. 17(4):449–
451
Stango V, Zinman J (2011) Fuzzy math, disclosure regulation, and market outcomes: Evidence from
truth-in-lending reform. Rev. Financ. Stud. 24(2):506–534.
Stango V, Zinman J (2014) Limited and varying consumer attention: Evidence from shocks to the
salience of bank overdraft fees. Rev. Financ. Stud. 27(4):990–1030.
Taubinsky D, Rees-Jones A (2016) Attention variation and welfare: theory and evidence from a tax
salience experiment. Working Paper 22545, National Bureau of Economic Research, Cambridge,
MA.
Tiefenback V, Goette L, Degen K, Tasic V, Fleisch E, Lalive R, Staake T (forthcoming) Overcoming
salience bias: How real-time feedback fosters resource conservation. Manage. Sci.
Page 18 of 35
ScholarOne, 375 Greenbrier Drive, Charlottesville, VA, 22901
Management Science
123456789101112131415161718192021222324252627282930313233343536373839404142434445464748495051525354555657585960

Volpp KG, John LK, Troxel AB, Norton L, Fassbender J, Loewenstein G (2008) Financial incentive–
based approaches for weight loss: A randomized trial. J. Am. Med. Assoc. 300(22):2631–2637.
Volpp KG, Troxel AB, Pauly MV, Glick HA, Puig A, Asch D, Galvin R, Zhu J, Wan F, DeGuzman J, et
al. (2009) A randomized, controlled trial of financial incentives for smoking cessation. New Engl.
J. Med. 360(7):699–709.
Wooldridge JM (2010) Econometric Analysis of Cross Section and Panel Data, Second Edition (The MIT
Press, Cambridge, MA).
Page 19 of 35
ScholarOne, 375 Greenbrier Drive, Charlottesville, VA, 22901
Management Science
123456789101112131415161718192021222324252627282930313233343536373839404142434445464748495051525354555657585960
Tables and Figures
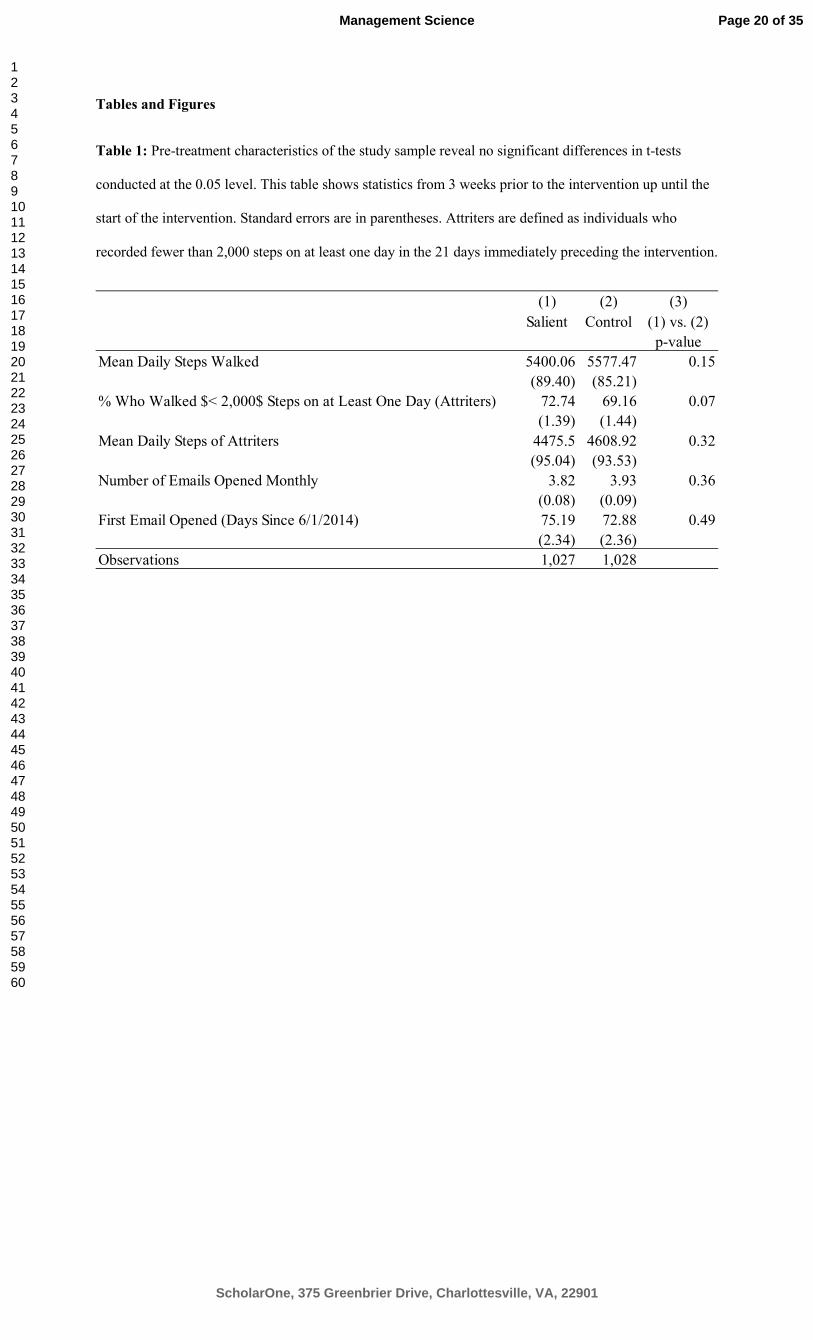
Table 1: Pre-treatment characteristics of the study sample reveal no significant differences in t-tests
conducted at the 0.05 level. This table shows statistics from 3 weeks prior to the intervention up until the
start of the intervention. Standard errors are in parentheses. Attriters are defined as individuals who
recorded fewer than 2,000 steps on at least one day in the 21 days immediately preceding the intervention.
(1) (2) (3)
Salient Control (1) vs. (2)
p-value
Mean Daily Steps Walked 5400.06 5577.47 0.15
(89.40) (85.21)
% Who Walked $< 2,000$ Steps on at Least One Day (Attriters) 72.74 69.16 0.07
(1.39) (1.44)
Mean Daily Steps of Attriters 4475.5 4608.92 0.32
(95.04) (93.53)
Number of Emails Opened Monthly 3.82 3.93 0.36
(0.08) (0.09)
First Email Opened (Days Since 6/1/2014) 75.19 72.88 0.49
(2.34) (2.36)
Observations 1,027 1,028
Page 20 of 35
ScholarOne, 375 Greenbrier Drive, Charlottesville, VA, 22901
Management Science
123456789101112131415161718192021222324252627282930313233343536373839404142434445464748495051525354555657585960
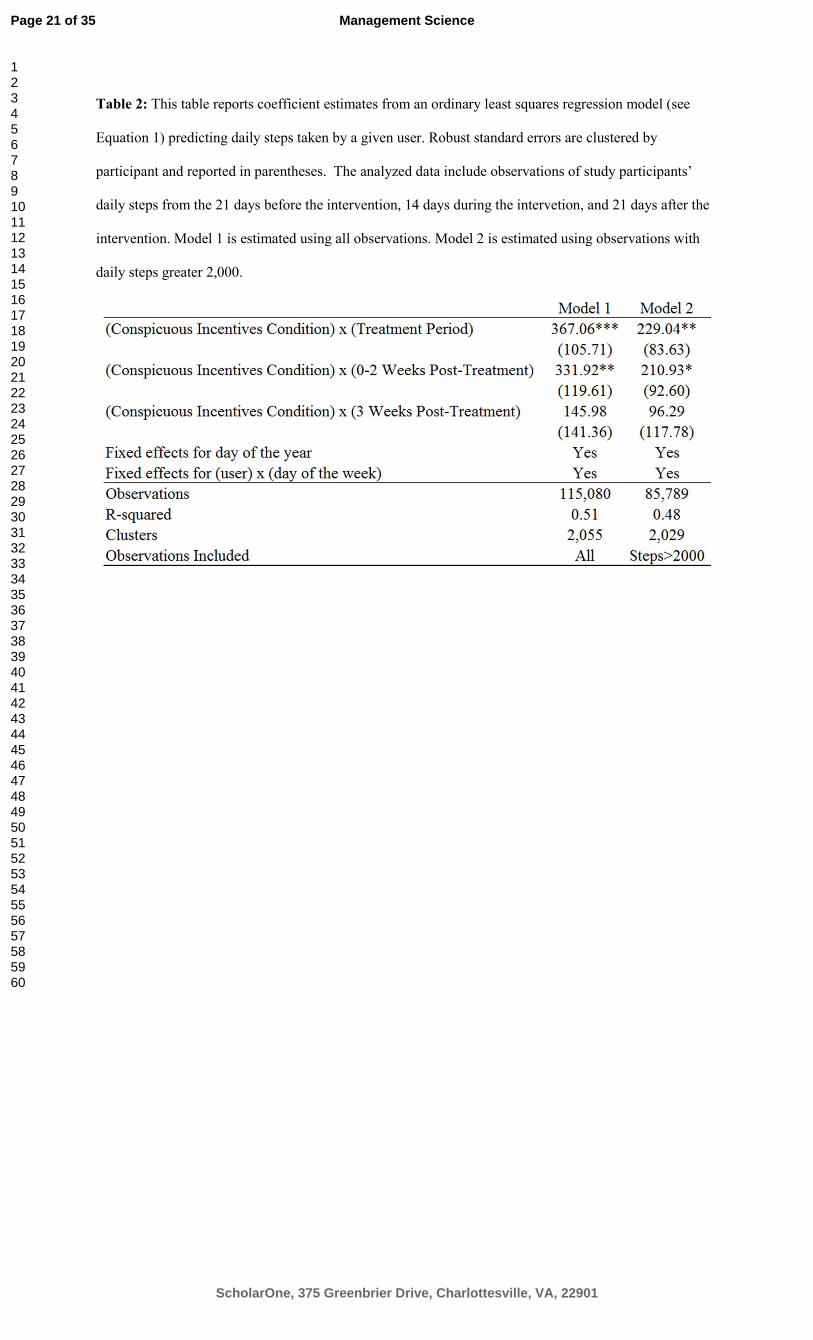
Table 2: This table reports coefficient estimates from an ordinary least squares regression model (see
Equation 1) predicting daily steps taken by a given user. Robust standard errors are clustered by
participant and reported in parentheses. The analyzed data include observations of study participants’
daily steps from the 21 days before the intervention, 14 days during the intervetion, and 21 days after the
intervention. Model 1 is estimated using all observations. Model 2 is estimated using observations with
daily steps greater 2,000.
Page 21 of 35
ScholarOne, 375 Greenbrier Drive, Charlottesville, VA, 22901
Management Science
123456789101112131415161718192021222324252627282930313233343536373839404142434445464748495051525354555657585960
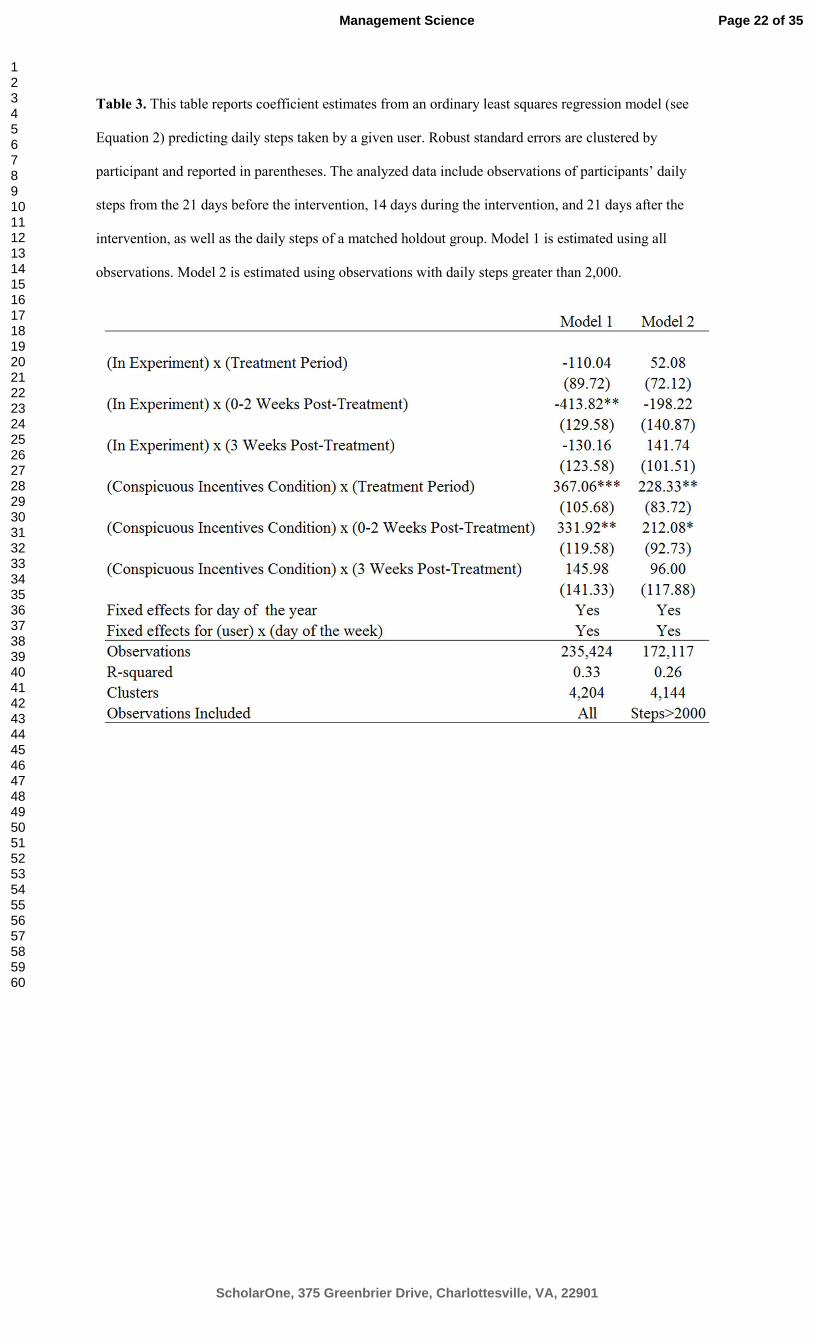
Table 3. This table reports coefficient estimates from an ordinary least squares regression model (see
Equation 2) predicting daily steps taken by a given user. Robust standard errors are clustered by
participant and reported in parentheses. The analyzed data include observations of participants’ daily
steps from the 21 days before the intervention, 14 days during the intervention, and 21 days after the
intervention, as well as the daily steps of a matched holdout group. Model 1 is estimated using all
observations. Model 2 is estimated using observations with daily steps greater than 2,000.
Page 22 of 35
ScholarOne, 375 Greenbrier Drive, Charlottesville, VA, 22901
Management Science
123456789101112131415161718192021222324252627282930313233343536373839404142434445464748495051525354555657585960

Table 4: US Subsidies: (In)attentiveness, Perceived eligibility, and Uptake rates by individual subsidy.
Subsidy (In)
attentiveness Perceived Eligibility
Uptake
Adoption credit: A tax credit of up to $13400 for adopting a child 58% 12% 23%
Alternative Fuel Vehicle Refueling Property Credit: Tax credit up to $1000 for installing equipment to refuel an electric car 59% 10% 45%
American Opportunity Tax Credit: Tax credit up to $2500 for tuition expenses and course materials 48% 19% 40%
Charitable Donations: Tax deductions for charitable donations as well as transportation costs to and from volunteering 82% 52% 82%
Child Care Reimbursement Account: A tax-advantaged savings account that parents can direct up to $5000/year into. This account can be used for childcare expenses
71% 14% 60%
Child Tax Credit: A $1000 tax credit for parents with dependents under 17 82% 28% 73%
Earned Income Tax Credits: A tax credit available to working citizens with household incomes below $53267 82% 31% 82%
Expenses for Business Use of Your Home: Deductions for electricity, rent, water and other miscellaneous costs (e.g., landscaping) for individuals who use their home as an office
80% 16% 82%
Health Savings Accounts: A non-taxable savings account for funds used to pay healthcare expenses 69% 29% 55%
Homeowner Tax Deductions: An income tax deduction for property taxes and mortgage interest on a taxpayer's primary residence. Primary residences are not limited to houses and apartments and may also include boats, RVs, or house trailers if they meet qualifications
75% 44% 91%
Investment Costs: Tax deductible for costs incurred by investment or tax planning costs, so long as they exceed 2% of the taxpayer's annual income.
50% 13% 36%
Lifetime Learning Tax Credit: Up to $2000 in tax credits to offset the cost of tuition 50% 18% 37%
Medical Expenses: An income tax deduction for medical expenses (including hormone therapy, doctor recommended physical activity, psychiatrist services and bariatric surgery) up to 7.5% of one's income
69% 32% 65%
Moving Expense Deductions: Tax credits for moving expenses incurred when taking a new job 63% 15% 63%
Nonbusiness Energy Property Tax Credit: Tax credits for "green" home improvements including insulation, doors, windows, roofing, and natural gas burning appliances
65% 25% 27%
Publication 535: Tax deductible for fees paid to professionals (e.g., attorneys, accountants) when they relate to an ongoing business. 53% 15% 69% Residential Energy Efficiency Property Tax Credit: Tax credits for installing solar, geothermal, or wind power in one's home 78% 19% 35% Sales and Other Dispositions of Capital Assets: A deductible whereby individuals and businesses may write-off bad debts (i.e., lending money to someone who does not pay them back).
54% 13% 21%
Savers Tax Credit: Tax credits up to $1000 for contributions to a retirement savings plan (401k and certain other plans) 50% 31% 55%
Travel, Entertainment, Gift, and Car Expenses: Tax deductions for any mileage individuals accrue travelling between job sites, or travelling for health-related reasons. Individuals who drive for work can also claim vehicle repair and maintenance
63% 23% 54%
Notes. (In)attentiveness: Correct categorization rate; Perceived Eligibility: Percent believing they are eligible; Uptake: Among the perceived eligible, % claiming
Page 23 of 35
ScholarOne, 375 Greenbrier Drive, Charlottesville, VA, 22901
Management Science
123456789101112131415161718192021222324252627282930313233343536373839404142434445464748495051525354555657585960
24
Table 5: Non-US Subsidies: (In)attentiveness
Subsidy
(In)attentiveness: correct
categorization rate
Artist Tax Exemption: The first $50,000 per annum earned by artists, writers and performers for the sale of their work is exempt from income tax 19% Children's Art Tax Credit: A tax credit up to $500/child for eligible children's art program registration costs 18% Children's Fitness Tax Credit: An income tax credit for the cost of the registration of the taxpayer's child(ren) in eligible sports and physical activity programs 18% Commuting Costs: A tax deductible for costs incurred as a result of travel to and from work 48% Financial Assistance to Adult Children: A deductible for the financial support taxpayers provide to adult (21+) children 27% Foreign Maid Levy Relief: A credit that working mothers can claim for the income they paid to a foreign domestic childcare workers or home maintenance workers 21% Funeral Expenses: Deductible for funeral expenses paid out-of-pocket for oneself or one's immediate family's funeral costs 29% Home Refurbishment Deduction: A tax deduction of up to 15% of the costs associated with refurbishing a primary residence 24% Maternity Grants Act: Compensation for up to $150 of expenses related to caring for newborn children (crib, clothes, cloth diaper, etc.) 29% Private Schooling Deductions: Deductible up to 30% of the tuition paid to private primary and secondary schools for dependents. 27% Public Transportation Deduction: A tax deduction for monthly public transit passes 25% Rent Benefit: A tax deduction for rental costs, available to low-to-moderate income individuals 27% Revenue Job Assist: Individuals who have been unemployed for 12 months or more and begin a new job are eligible for a reduced tax rate 33% Tax Deductions for Veterans and Service Members: A tax deductible up to $5000 available to veterans and active service members. 57% Working Mother's Child Relief: A deductible of 15-25% of total income for working mothers. 26%
Page 24 of 35
ScholarOne, 375 Greenbrier Drive, Charlottesville, VA, 22901
Management Science
123456789101112131415161718192021222324252627282930313233343536373839404142434445464748495051525354555657585960
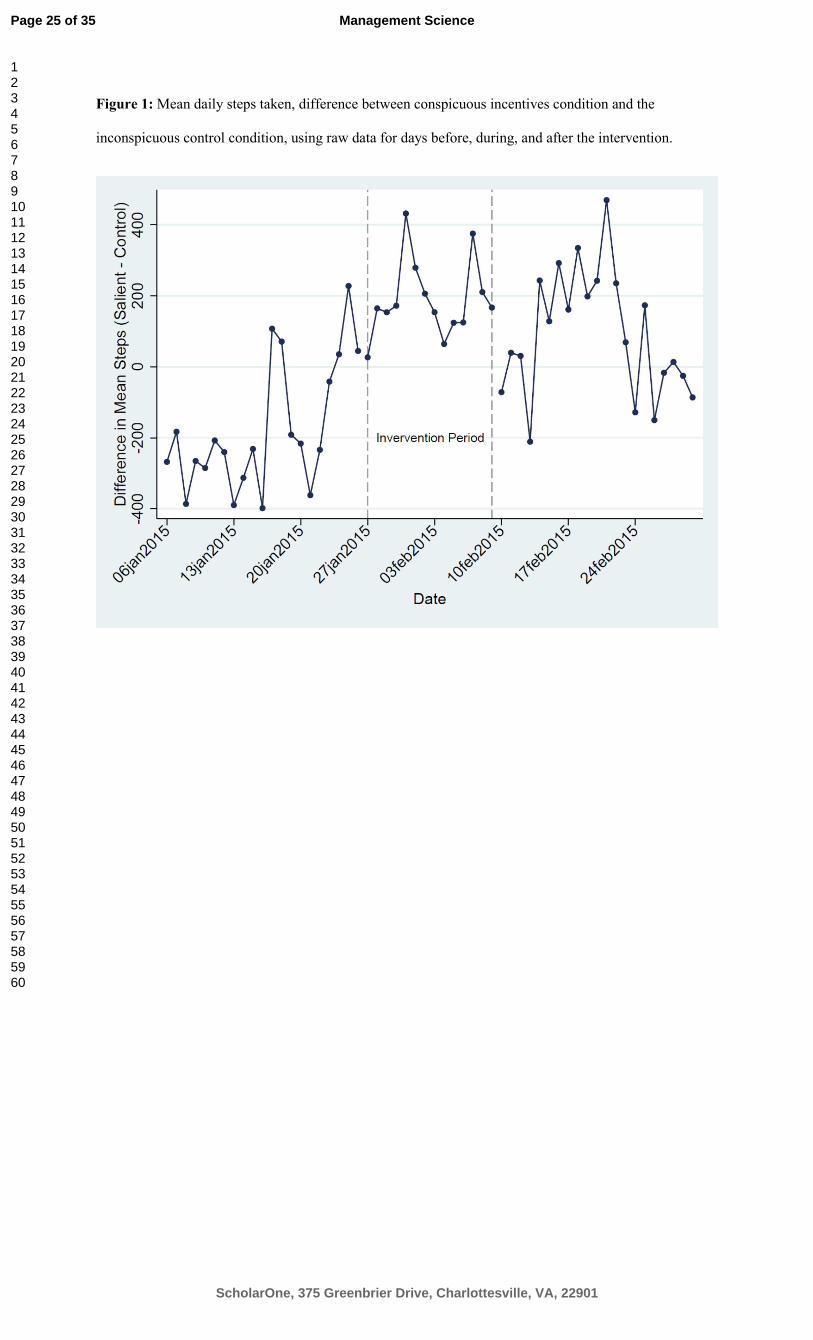
Figure 1: Mean daily steps taken, difference between conspicuous incentives condition and the
inconspicuous control condition, using raw data for days before, during, and after the intervention.
Page 25 of 35
ScholarOne, 375 Greenbrier Drive, Charlottesville, VA, 22901
Management Science
123456789101112131415161718192021222324252627282930313233343536373839404142434445464748495051525354555657585960

Table S1: This table reports coefficient estimates from an ordinary least squares regression model (see
Equation 1) predicting daily steps taken by a given user. Robust standard errors are clustered by
participant-day-of-week and reported in parentheses. The analyzed data include observations of
participants’ daily steps from the 21 days before the intervention, 14 days during the intervention, and 21
days after the intervention. Model 1 is estimated using all observations. Model 2 is estimated using
observations with daily steps greater than 2,000.
Page 26 of 35
ScholarOne, 375 Greenbrier Drive, Charlottesville, VA, 22901
Management Science
123456789101112131415161718192021222324252627282930313233343536373839404142434445464748495051525354555657585960
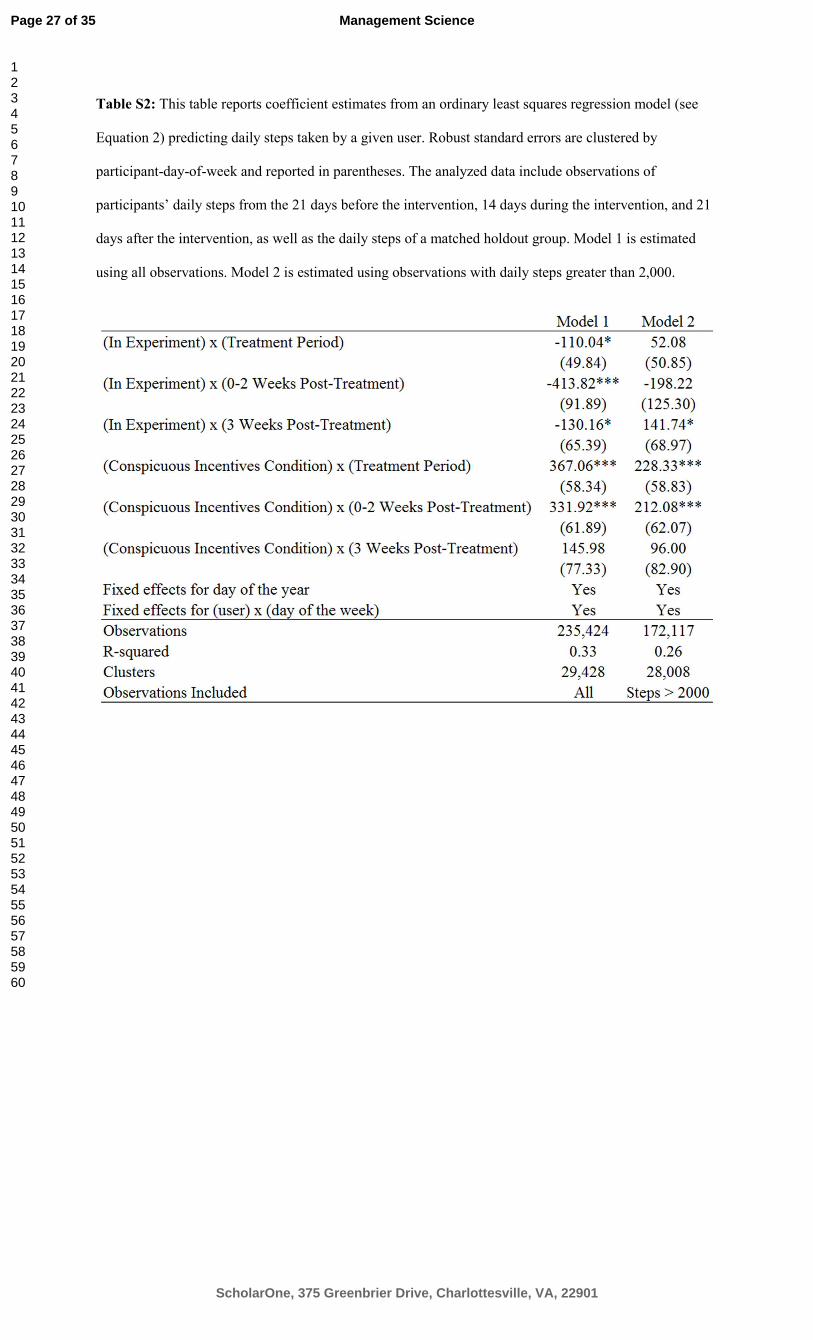
Table S2: This table reports coefficient estimates from an ordinary least squares regression model (see
Equation 2) predicting daily steps taken by a given user. Robust standard errors are clustered by
participant-day-of-week and reported in parentheses. The analyzed data include observations of
participants’ daily steps from the 21 days before the intervention, 14 days during the intervention, and 21
days after the intervention, as well as the daily steps of a matched holdout group. Model 1 is estimated
using all observations. Model 2 is estimated using observations with daily steps greater than 2,000.
Page 27 of 35
ScholarOne, 375 Greenbrier Drive, Charlottesville, VA, 22901
Management Science
123456789101112131415161718192021222324252627282930313233343536373839404142434445464748495051525354555657585960
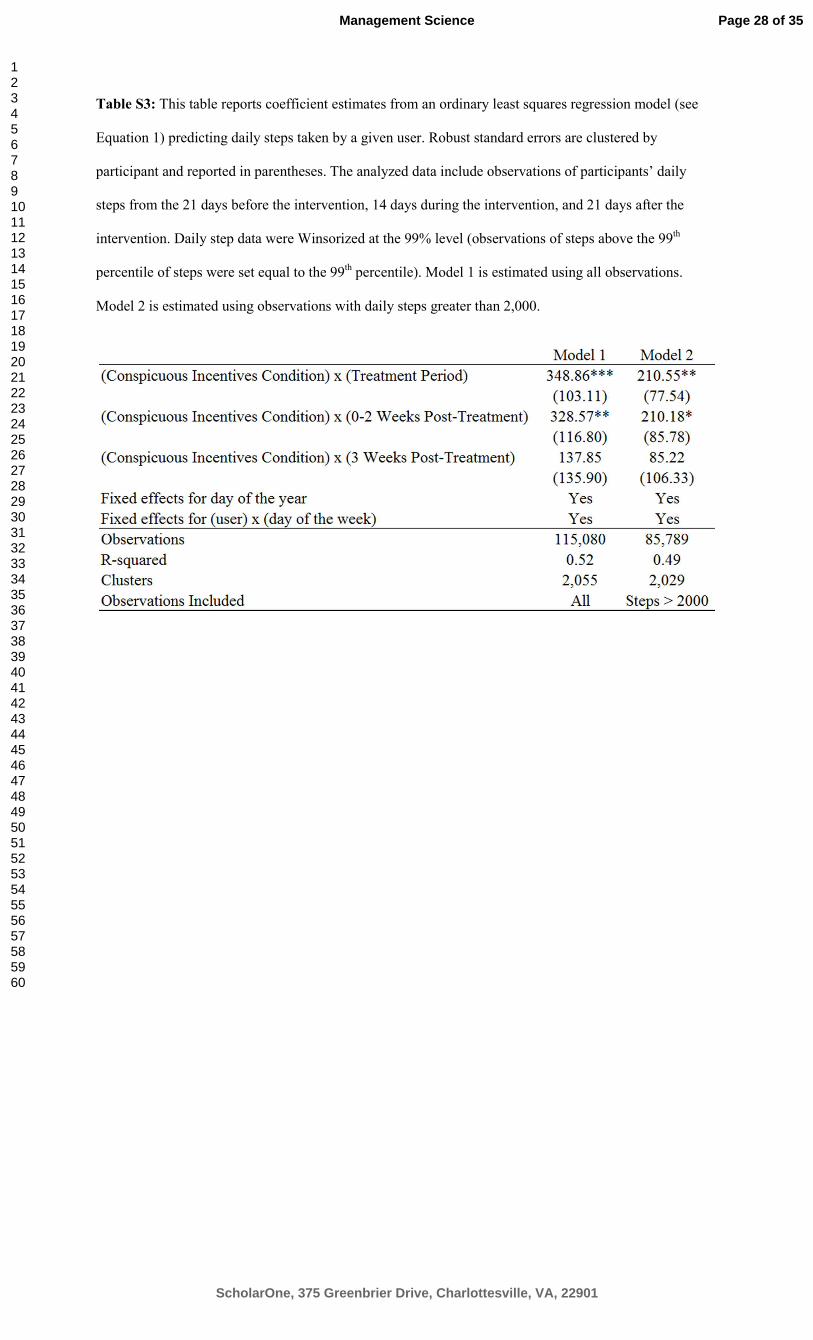
Table S3: This table reports coefficient estimates from an ordinary least squares regression model (see
Equation 1) predicting daily steps taken by a given user. Robust standard errors are clustered by
participant and reported in parentheses. The analyzed data include observations of participants’ daily
steps from the 21 days before the intervention, 14 days during the intervention, and 21 days after the
intervention. Daily step data were Winsorized at the 99% level (observations of steps above the 99th
percentile of steps were set equal to the 99th percentile). Model 1 is estimated using all observations.
Model 2 is estimated using observations with daily steps greater than 2,000.
Page 28 of 35
ScholarOne, 375 Greenbrier Drive, Charlottesville, VA, 22901
Management Science
123456789101112131415161718192021222324252627282930313233343536373839404142434445464748495051525354555657585960
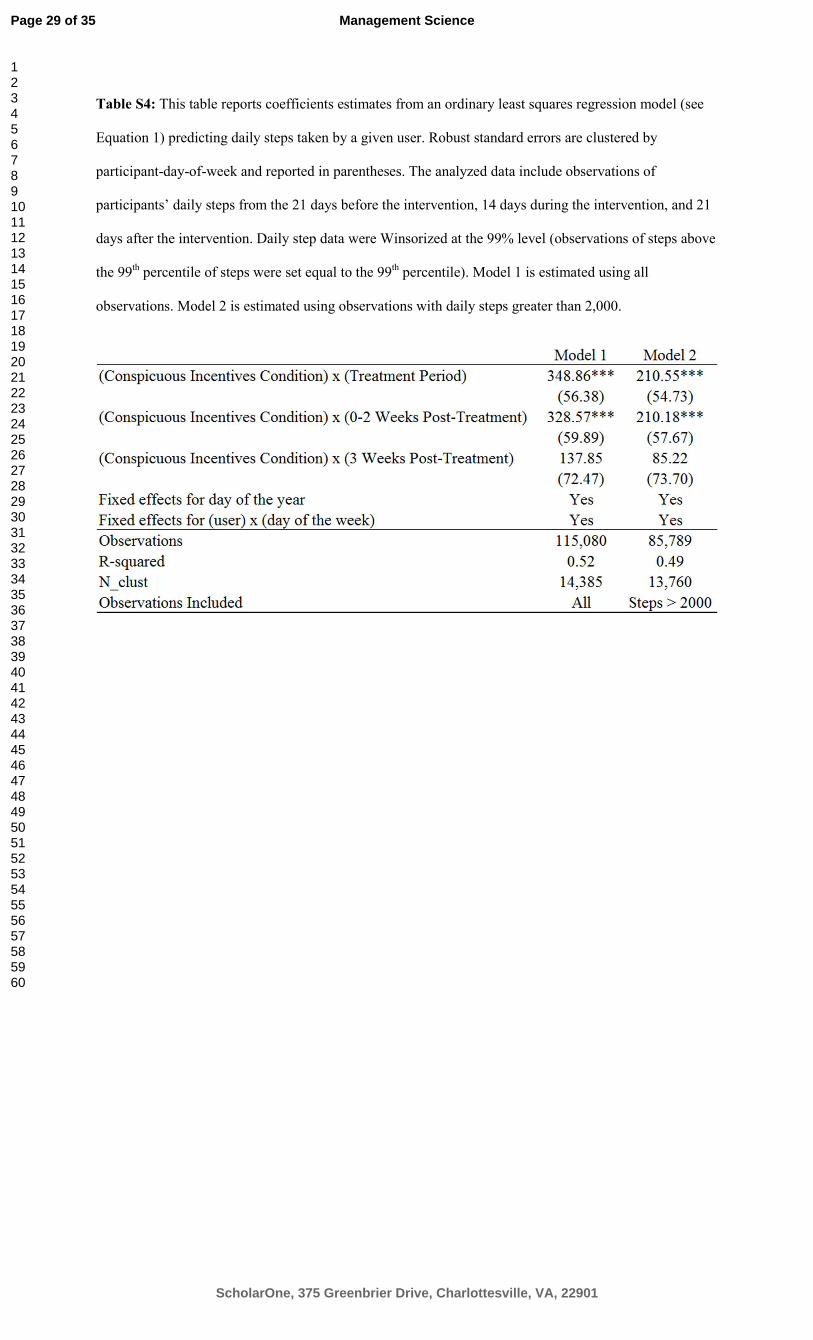
Table S4: This table reports coefficients estimates from an ordinary least squares regression model (see
Equation 1) predicting daily steps taken by a given user. Robust standard errors are clustered by
participant-day-of-week and reported in parentheses. The analyzed data include observations of
participants’ daily steps from the 21 days before the intervention, 14 days during the intervention, and 21
days after the intervention. Daily step data were Winsorized at the 99% level (observations of steps above
the 99th percentile of steps were set equal to the 99th percentile). Model 1 is estimated using all
observations. Model 2 is estimated using observations with daily steps greater than 2,000.
Page 29 of 35
ScholarOne, 375 Greenbrier Drive, Charlottesville, VA, 22901
Management Science
123456789101112131415161718192021222324252627282930313233343536373839404142434445464748495051525354555657585960
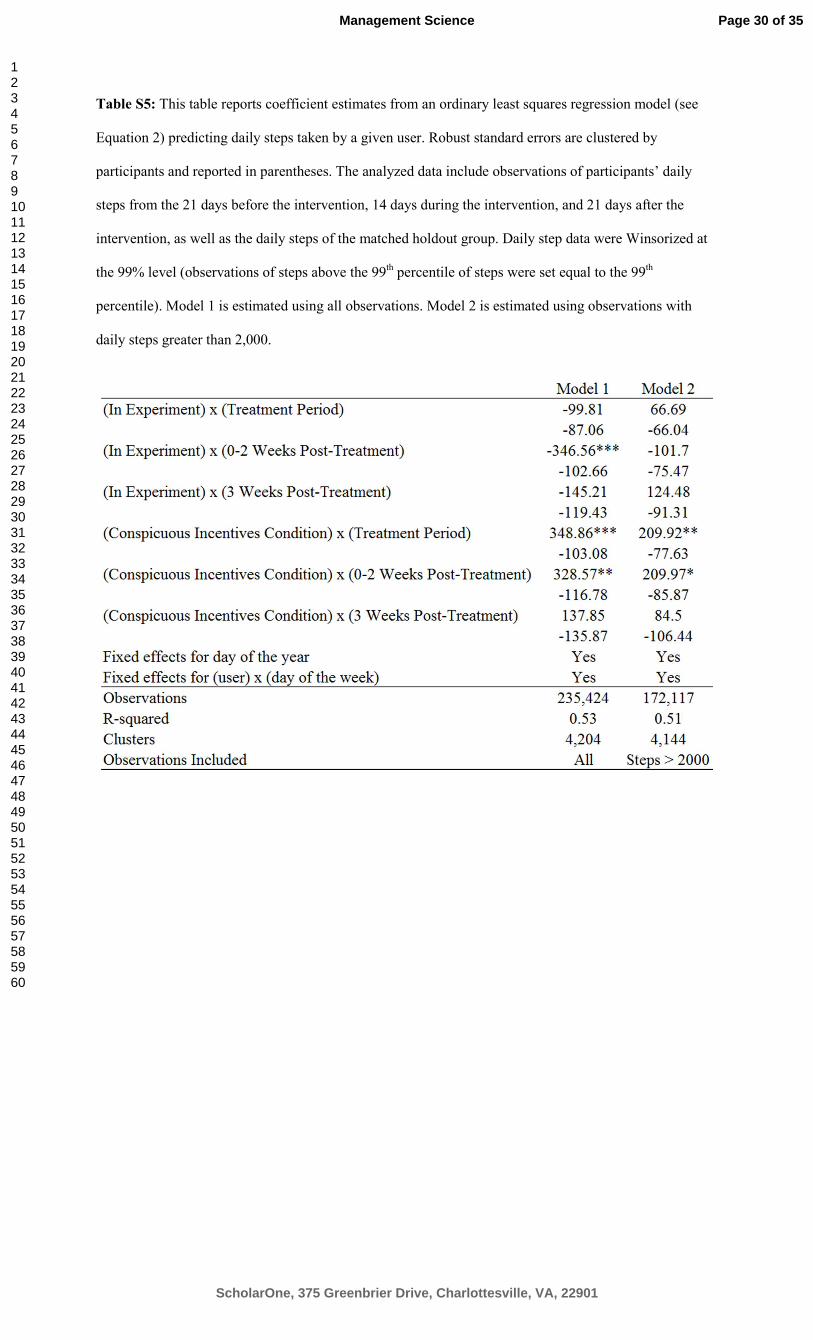
Table S5: This table reports coefficient estimates from an ordinary least squares regression model (see
Equation 2) predicting daily steps taken by a given user. Robust standard errors are clustered by
participants and reported in parentheses. The analyzed data include observations of participants’ daily
steps from the 21 days before the intervention, 14 days during the intervention, and 21 days after the
intervention, as well as the daily steps of the matched holdout group. Daily step data were Winsorized at
the 99% level (observations of steps above the 99th percentile of steps were set equal to the 99th
percentile). Model 1 is estimated using all observations. Model 2 is estimated using observations with
daily steps greater than 2,000.
Page 30 of 35
ScholarOne, 375 Greenbrier Drive, Charlottesville, VA, 22901
Management Science
123456789101112131415161718192021222324252627282930313233343536373839404142434445464748495051525354555657585960
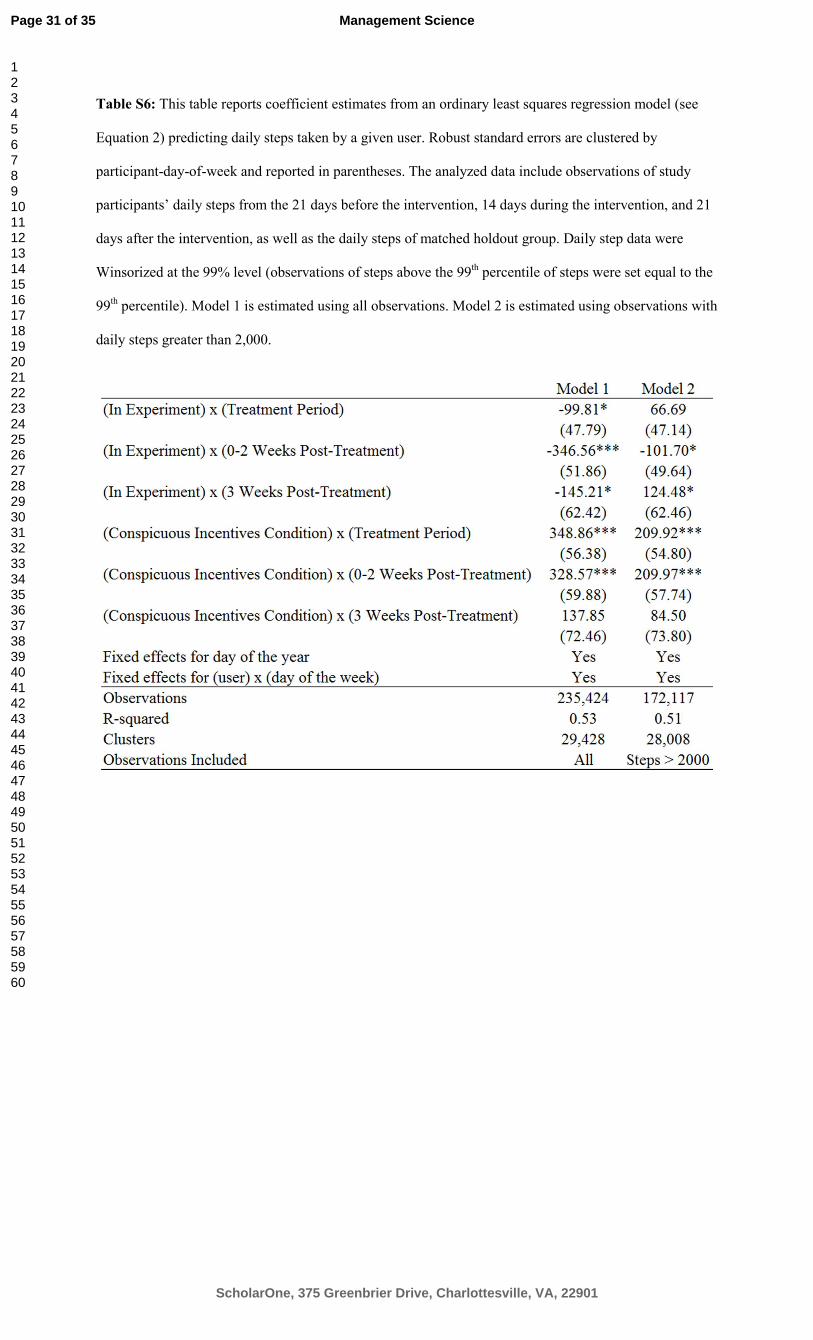
Table S6: This table reports coefficient estimates from an ordinary least squares regression model (see
Equation 2) predicting daily steps taken by a given user. Robust standard errors are clustered by
participant-day-of-week and reported in parentheses. The analyzed data include observations of study
participants’ daily steps from the 21 days before the intervention, 14 days during the intervention, and 21
days after the intervention, as well as the daily steps of matched holdout group. Daily step data were
Winsorized at the 99% level (observations of steps above the 99th percentile of steps were set equal to the
99th percentile). Model 1 is estimated using all observations. Model 2 is estimated using observations with
daily steps greater than 2,000.
Page 31 of 35
ScholarOne, 375 Greenbrier Drive, Charlottesville, VA, 22901
Management Science
123456789101112131415161718192021222324252627282930313233343536373839404142434445464748495051525354555657585960

32
Figure S1. Kickoff email.
Users in the conspicuous incentives condition received the following email on Jan. 26, 2015 (the day
before incentives began):
Subject Line: New Program to Encourage You to Walk (earn Bonus Points)
Message:
Bonus Points Opportunity
New Program to Encourage You to Walk (earn Bonus Points)
Tomorrow is the first day of a two week walking program designed in partnership with
experts at Harvard and the University of Pennsylvania to get you moving. Tomorrow and
every day after that for the next two weeks, we'll encourage you to walk by multiplying the
points you earn for walking by 40.
To push you to walk more, your bonuses from Achievemint over the next two weeks will
follow this schedule:
Page 32 of 35
ScholarOne, 375 Greenbrier Drive, Charlottesville, VA, 22901
Management Science
123456789101112131415161718192021222324252627282930313233343536373839404142434445464748495051525354555657585960

We will be sending you reminders every two days about upcoming bonuses.
We hope that this program will help you improve your walking habits!
For the next two weeks, we'll be emailing you every other day about these bonuses. If you
don't want to receive these emails, please click here.
You're receiving this email because you signed up for email reminders.
Not interested anymore? You can easily change your subscription prefrences by clicking this link.
Copyright 2015 Achievemint. All Rights Reserved.
Page 33 of 35
ScholarOne, 375 Greenbrier Drive, Charlottesville, VA, 22901
Management Science
123456789101112131415161718192021222324252627282930313233343536373839404142434445464748495051525354555657585960

Figure S2. Reminder emails.
Users in the conspicuous incentives condition received the following reminder email every other day (day
1, day 3,…, day 13) during the 14-day incentive program.
Subject Line: Program to Increase Walking (Earn Bonus Points Today and Tomorrow)
Message:
Bonus Points Opportunity
Program to Increase Walking (Earn Bonus Points Today and Tomorrow)
You are in the middle of a two week walking program designed in partnership with experts
at Harvard and the University of Pennsylvania to get you moving. Today and tomorrow,
we'll encourage you to walk: all points you earn for walking will be multiplied by 40.
To push you to walk more, your bonuses from Achievemint over the next two weeks will
follow this schedule:
Page 34 of 35
ScholarOne, 375 Greenbrier Drive, Charlottesville, VA, 22901
Management Science
123456789101112131415161718192021222324252627282930313233343536373839404142434445464748495051525354555657585960

For the duration of this two week period, we'll be emailing you every other day about these
bonuses. If you don't want to receive these emails, please clickhere.
You're receiving this email because you signed up for email reminders.
Not interested anymore? You can easily change your subscription prefrences by clicking this link.
Copyright 2015 Achievemint. All Rights Reserved.
Page 35 of 35
ScholarOne, 375 Greenbrier Drive, Charlottesville, VA, 22901
Management Science
123456789101112131415161718192021222324252627282930313233343536373839404142434445464748495051525354555657585960