THE INDIAN CEMENT INDUSTRY MYTHS VS. FACTS · THE INDIAN CEMENT INDUSTRY MYTHS VS. FACTS...
15
THE INDIAN CEMENT INDUSTRY MYTHS VS. FACTS Jagdeep Verma Holtec Consulting Pvt. Ltd., India
Transcript of THE INDIAN CEMENT INDUSTRY MYTHS VS. FACTS · THE INDIAN CEMENT INDUSTRY MYTHS VS. FACTS...

THE INDIAN CEMENT INDUSTRYMYTHS VS. FACTS
Jagdeep Verma
Holtec Consulting Pvt. Ltd., India
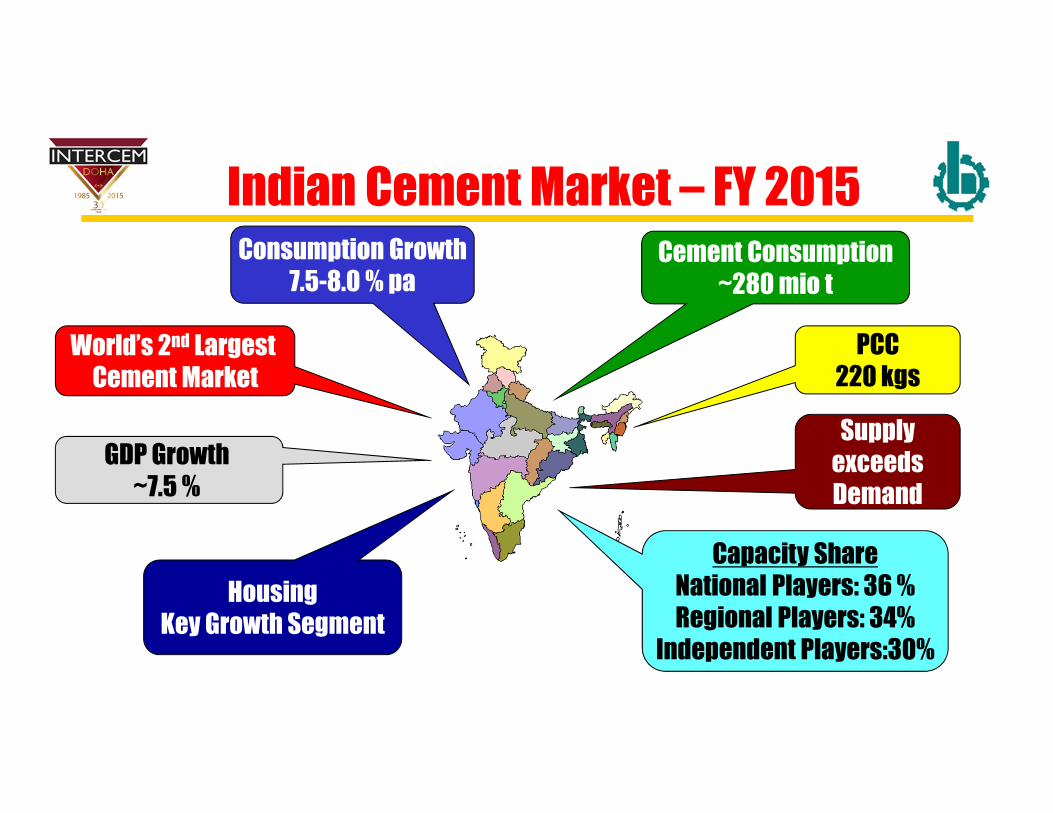
Indian Cement Market – FY 2015
World’s 2nd Largest Cement Market
Consumption Growth7.5-8.0 % pa
PCC220 kgs
Supply exceeds Demand
GDP Growth ~7.5 %
Housing Key Growth Segment
Capacity ShareNational Players: 36 %Regional Players: 34%
Independent Players:30%
Cement Consumption~280 mio t

200
250
300
350
400
450
500
FY14 FY15 FY16 FY17 FY18 FY19 FY20 FY21
Most Likely Pessimistic Optimistic
262
350
370
435 -485
208PCC 220 237 254 273 293 313 334
282
Demand
Over the period, we expect the CAGR of Demand to vary between 7.5 to 9.5 % between thePessimistic and Optimistic forecasts.
In theMost Likely case it is expected to be ~9%whichwould result in a PCC growth of 7 % pa.
mio t

262 282 307 335
365 398 432
468
337 358402
444 459 463 463 463
-
100
200
300
400
500
FY14 FY15 FY16 FY17 FY18 FY19 FY20 FY21
Demand Supply Capability
Demand & Supply Projectionsmio t Supply Capability assumed static at FY 19 level of 463 mio t
After trailing potential supply between FY 13-FY 20, demand could exceed supplybeyond FY 20, if fresh capacity expansion is not planned earlier.
*Refers to domestic supply (net of exports), assuming supply for any capacity added as 50% in Yr 1 & 100% from Yr2 onwards & 90% Cap. Util.Supply capability also accounts for possible plants’ closure – those that are very old, are not strategically located and have paucity of limestone.
*

0.077
0.072 0.070
0.063 0.063 0.063 0.062
0.050
0.055
0.060
0.065
0.070
0.075
0.080
FY 12 FY 13 FY 14 FY 15 FY 16 FY 17 FY 18
Myth 1: Industry Consolidation Herfindahl Index (HI) is a preferred metric to measure industry consolidation whenstudyingmarket price implications.
Herfindahl
Index
Our analysis shows, that if either of these three players desire to arrest the Index atits FY12 level, they would need to attain a capacity of ~ 245mio t by FY 18 (instead ofthe current estimated ~180mio t).
The index is seen to be fallingimplying a negative impact onprices.
To arrest this fall, the 3 largestplayers, singly or in tandem, haveto create/ acquiremore capacity.

6874
91111 108 101 106 116 111 104 113 121 130 139 150
106
109 113 115 117 119
-
2,500
5,000
7,500
10,000
0
50
100
150
200
FY05
FY06
FY07
FY08
FY09
FY10
FY11
FY12
FY13
FY14
FY15
FY16
FY17
FY18
FY19
FY20
Prices in INR Past Price Optimistic Pessimistic Most Likely
US$/ t
Future Projections
9,000
7,000
INR/ t
� Fear that pricesmay fall due to prevalent demand-supply gap.
� Hypothesis tested by modeling and simulating the combined impact ofvarious variables on retail price. Over 40 variables evaluated.
� Prices in past have grown at 5-8% pa.
� Future prices likely to increase by around 6% pa.
Myth 2: Prices to Fall Sharply
After Demand -Supply, rising input materials’ prices have the most significant impact.

Myth 3: High Breakeven PointHypothesis tested by considering:
� Price points: US$ 106/ t (FY 2015 levels), US$ 112/ t (FY 2016 levels) & US$ 141 / t (FY 2020 levels).
� Specific Investing Cost/ t of OPC: US$ 130-135.
� Operational breakeven in 4th year of operations.
Price Breakeven
US$ 106/ t 48-50 %
US$ 112/ t 46-48 %
US$ 141/ t 43-45 %
In Case 3, after considering loan repayment, breakeven
seen to be ~ 70 %
Lower variable cost of production effected through improved,technologically-driven, energy efficiencies, falling cost of fuel and amuch higher volume of blended cement.

Myth 4: Imports to Reduce Prices
Cost of Production US$ 30-34 per t
900-1,300 NM
Cost of Production US$ 36-38 per t
2,000-4,000 NM
Landed Cost US$ 46-49/ t
Landed Cost US$ 59 -74/ t
Cost of Production in India US$ 35-37 per t
Bottlenecks hindering imports include ports infrastructure, domesticdistribution, market reach, competitiveness with domestic players, etc.
Low threat of imports and its impact on prices.

Myth 5: Blending Material ShortageFly ash
� Current flyash generation is around 100mio tpa.
� 45mio tpa of flyash is currently utilized by the cement industry.
� An additional 80 mio tpa could be available by FY 2016/2017 as against an
incremental requirement of 25mio tpa in next 4-5 years.
Slag
� Current slag generation is around 13mio tpa.
� 8-9mio tpa of slag is utilized by the cement industry.
� An additional 12 mio tpa could be available by FY 2016/ 2017 as against an
incremental requirement of 6-7 mio tpa in next 4-5 years.
Availability appears assured. Yet, advance booking of future strategically located sources being increasingly adopted.

-
10
20
30
40
2011
2016
2021
2026
2031
2033
2035
2036
2038
2041
2043
2045
2047
2049
Current product mix with current limestone
reserves
Increased exploitable limestone, 100 % blended
cement, lower growth rate
Myth 6: Limestone No Constraint
Need to secure deposits well in advance
Individual Deposit > 50 mio t
CaO > 42%45 bio t
Exploitable Reserves = 22 bio t
In Forest Land4 bio t
Statutorily Blocked19 bio t
Total Deposits = 50 bio t
Bn t
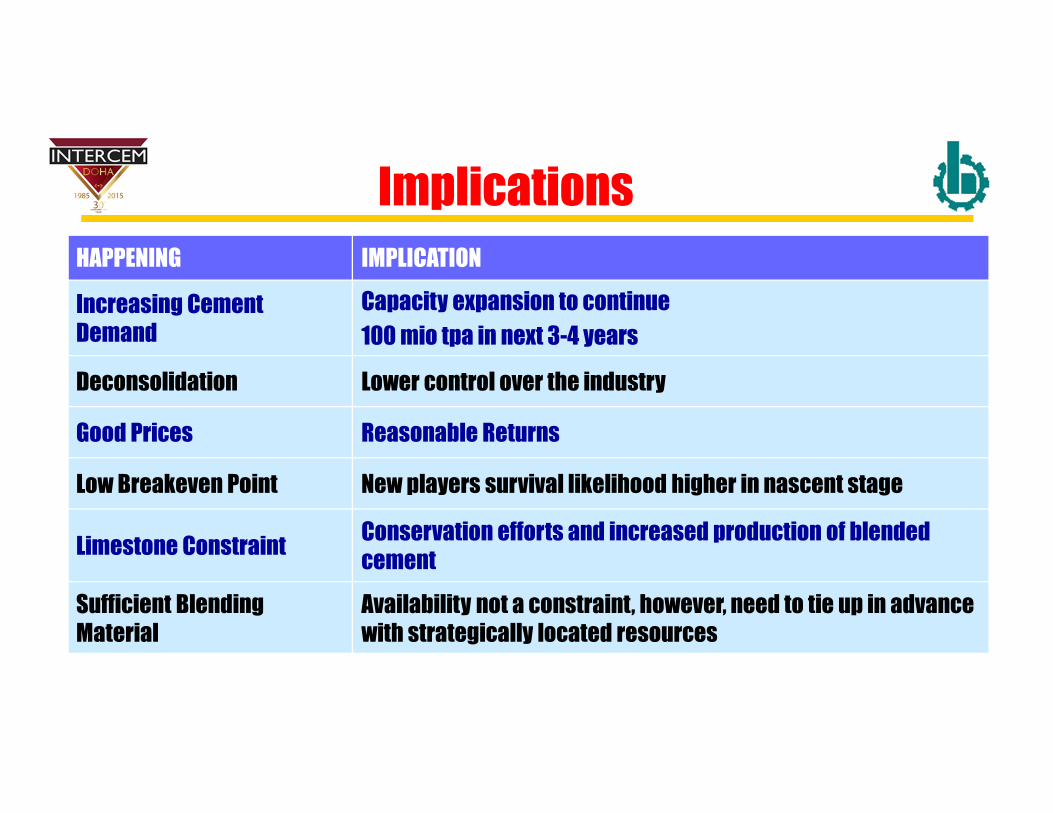
Implications
HAPPENING IMPLICATION
Increasing Cement Demand
Capacity expansion to continue
100 mio tpa in next 3-4 years
Deconsolidation Lower control over the industry
Good Prices Reasonable Returns
Low Breakeven Point New players survival likelihood higher in nascent stage
Limestone ConstraintConservation efforts and increased production of blended cement
Sufficient Blending Material
Availability not a constraint, however, need to tie up in advance with strategically located resources
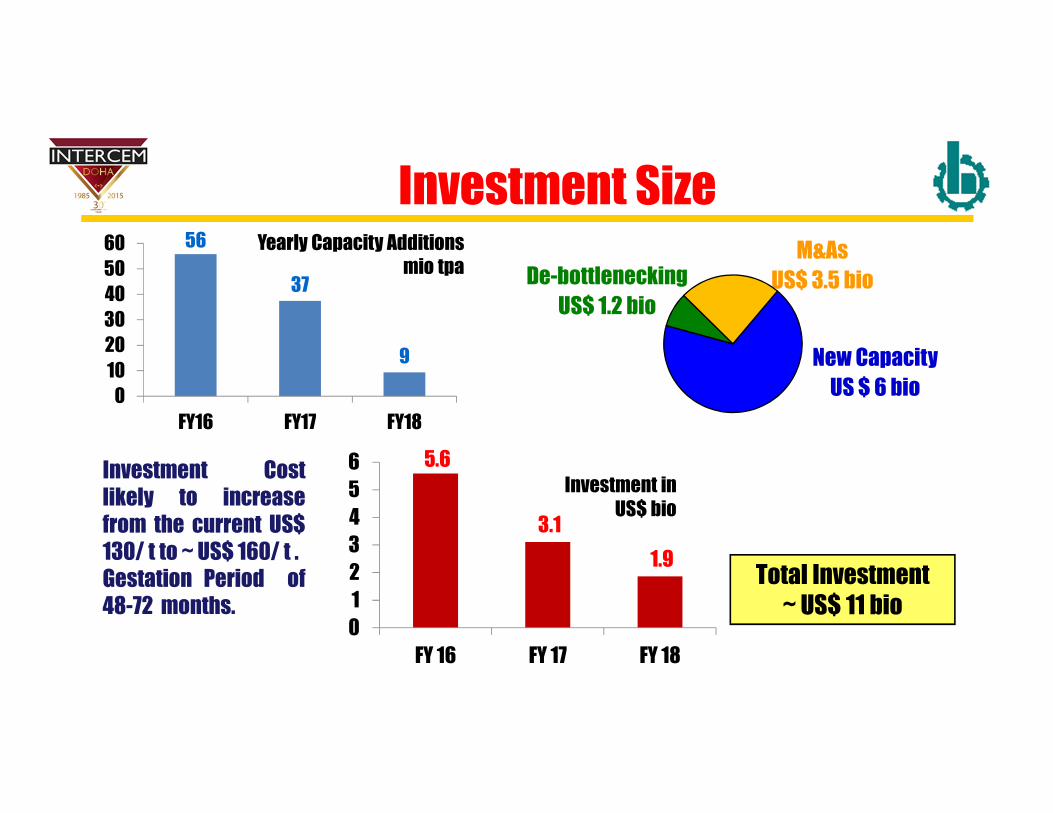
56
37
9
0
10
20
30
40
50
60
FY16 FY17 FY18
5.6
3.1
1.9
0
1
2
3
4
5
6
FY 16 FY 17 FY 18
Investment Size
Investment Costlikely to increasefrom the current US$130/ t to ~ US$ 160/ t .Gestation Period of48-72 months.
Total Investment ~ US$ 11 bio
De-bottlenecking
US$ 1.2 bio
M&As
US$ 3.5 bio
New Capacity
US $ 6 bio
Investment in US$ bio
Yearly Capacity Additions mio tpa

262 282 307 335
365 398 432
468
337 358402
444 459 463 463 463
-
100
200
300
400
500
FY14 FY15 FY16 FY17 FY18 FY19 FY20 FY21
Demand Supply Capability
Investment Timing
Demand exceeds Supply.
New expansion plans should be underway by FY 2016/ 17.
Substantial surplus capacity seen in FY 2016 - FY 2018… Valuation could be lower!
M&A could see 15-25 mio tpa exchanging hands.
Mio t Supply-Demand Comparison

Indian Cement Market – FY 2021
World’s 2nd Largest Cement Market
Consumption Growth7-10 % pa
PCC334 kgs
Supply ≈ Demand35-45 mio tpa
required annually FY22 onwards
GDP to remain robust
M&A 15-25 mio tpaUS$ 3.5 bio CAPEX Investment
~ US$ 7 bio
Cement Consumption468 mio t

Web : www.holtecnet.com
E-Mail : [email protected]
Address : Holtec Centre, A Block, Sushant Lok,
Gurgaon 122001 – India
Telephone : +91 - 124 - 238 5095, 404 7900
Facsimile : +91 - 124 - 238 5114, 238 5116
Thank youThank youThank youThank you