The India Private Equity Report 2009 - Bain & …...The India Private Equity Report 2009: An...
32
The India Private Equity Report 2009 An inflection point for PE in India
Transcript of The India Private Equity Report 2009 - Bain & …...The India Private Equity Report 2009: An...
The India Private Equity Report 2009An inflection point for PE in India

The India Private Equity Report 2009: An inflection point for private equity in India
October 2009 | Page 1
Table of contents
I. Executive summary a. The background b. Looking ahead
II. The global picture: Fewer M&A deals and possible restructuring
III. Asia: A bigger role for private equity a. Growth vs. buyouts across Asia b. Asia exits: An equal split between trade sales and IPOs c. Top 10 deals in Asia d. Top 10 trade exits in Asia e. Top 10 IPO exists in Asia
IV. Where India stands: Fundamentals for a strong private equity industry a. Indian companies are growing with venture capital and private equity b. India: Economic indicators show promise c. India’s biggest deals in 2009 d. Top 25 deals by size e. India companies prefer to retain control f. Delaying exits until the right time g. A preference for strategic investors
V. Global outlook: The recovery begins a. The short- and medium-term view
VI. Asia outlook a. China and India remain focus for PE investors
VII. A closer look at China, Southeast Asia and India
a. Greater China: Making the most of government stimulus b. Southeast Asia: Stable deal sizes c. India: An emphasis on later-stage investments
VIII. About Indian Venture Capital Association IX. About Bain & Company’s private equity business

The India Private Equity Report 2009: An inflection point for private equity in India
October 2009 | Page 2
I. Executive summary The global financial crisis hurt the private equity industry in India, as it has everywhere else in the world. But a number of fundamentals shifting direction in the past six to nine months now point to positive news for investors and companies seeking growth capital. The country has not been as hard hit as many others in the downturn. India grew 6.7 per cent in the 2008–2009 fiscal year, slowing from rates of 9 per cent or higher in the previous three years. The predicted rate of 6 per cent for 2009–2010 for it is still higher than that of any other Asian country except China, and higher than GDP growth projections for North America and Europe. Signs of improvement are everywhere. India’s manufacturing output increased for three consecutive months until June 2009, reflected in a 4.3 per cent increase for the April–July 2009 period over the previous year. Both debt and equity markets are rising. Corporations have issued more than 1 trillion rupees ($21 billion) in bonds in the first three quarters of 2009, compared with less than 700 billion rupees ($14 billion) for the same period in 2008. And most stock market indices, including NIFTY, have returned to their pre-September 2008 levels. This is positive news for private equity in India. It means companies will feel more optimistic about their opportunities for growth—and will be looking for sources of funding, including private equity, to fuel that growth. While valuation expectations have also risen in tandem, investments are expected to increase across all sectors, with some of the biggest growth rates expected in real estate, infrastructure, healthcare and industrials. Even throughout the downturn, executives in India exuded optimism about managing the impact of the global slowdown—and emerging stronger from the storm. For example, a Bain & Company global survey conducted in January 2009 found that a large majority of Indian executives believe their companies responded proactively to the downturn: Only two out of 10 felt their firms waited too long to act. In China, 40 per cent of managers felt their firms’ response was slow, while the figure for the rest of Asia Pacific was 34 per cent. The following report, prepared by the Indian Venture Capital Association and Bain & Company, will examine the private equity landscape—globally, in Asia and in India—both looking backward and into the coming 12-18 months. a) The background The past year and a half has been a dramatic and disappointing one for the private equity industry as investment value has dwindled. India has seen a drop-off in both the number of deals and in investment size—although not as significant as the drop globally or in most Asian countries. Globally, the total investments made by private equity funds shrank from $761 billion in 2007 to $232 billion in 2008, a decrease of 70 per cent. The first half of 2009 saw only $34 billion in activity. Asia’s private equity market declined, but not nearly as much, from $76 billion in 2007 to $48 billion in 2008—a decline of 37 per cent—and $22 billion in the first half of 2009. Despite the

The India Private Equity Report 2009: An inflection point for private equity in India
October 2009 | Page 3
slowdown, deals in Asia took place across a wide range of sectors. The largest markets were China (including Hong Kong) and Australia/New Zealand, with a mix of buyout and growth deals—although China’s deals were almost all for growth. Financial services is an area of growth in Asia. The year 2008 saw a 67 per cent decline in funding for financial services companies. But that drop was more than recovered in the first half of 2009, which witnessed $11 billion in deals—more than any other industry. Consumer products managed to hold its own in 2008, when deal value jumped 24 per cent, to $1.5 billion. In the first half of 2009, the consumer products industry saw deal value increase to $2.5 billion. In India, the six years preceding the global financial crisis witnessed a flourishing private equity industry. It’s to the point where private equity, including venture capital investments, now represents a significant percentage of all direct foreign investment in the country. A relatively small portion of private equity investments are from domestic funds. India’s private equity industry investments shrank from $17.1 billion in 2007 to $14.1 billion in 2008 and to $2 billion in the first half of 2009. The number of companies in India receiving funding was basically flat—392 companies in 2007 and 346 in 2008—and has dropped to 80 companies for the first half of 2009. There are two fundamental reasons why private equity in India has remained low. First, promoters’ expectations on valuations have remained high despite the economic slowdown. Meanwhile, entrepreneurs have had adequate access to capital beyond private equity. For those taking private equity investments, average deal size for the first half of 2009 dipped to $21 million from a peak of $35 million in 2007. About two-thirds of the deals involved a minority stake (less than 25 per cent), with no deals exceeding $500 million. Generally speaking, India’s business owners aren’t as eager as their counterparts elsewhere in the world to turn over majority ownership. The bulk of deals are Private Investment in Public Equity (PIPE) or late-stage investments. While returns have been attractive, driven by strong market growth over the last six years, exits have almost dried up in the past year. India witnessed only $200 million in exits in the first six months of 2009 as compared with $1.2 billion in 2007 and $1.1 billion in 2008. The typical exit routes—mergers and acquisitions (M&As) and initial public offerings (IPOs)—have generally been unavailable. The economic slowdown and tightening of credit affected M&A activity. Wary investor sentiment and a weak stock market, until recently, discouraged companies from launching IPOs. Before these challenges emerged, India’s private equity industry flourished. More than 1,300 Indian companies across a broad spectrum of industries have received private equity. Among the biggest successes: Growth capital from Warburg Pincus, CVC International and Temasek Holdings fueled Bharti Airtel’s rise to become a $33 billion market cap telecom leader within a decade. Akhil Gupta, the company’s JMD and CFO, credited Warburg Pincus with helping the company “scale up significantly”. In 1999, when the international private equity firm first invested in the telecom, Bharti had 104,000 subscribers. It now has more than 100 million. Warburg Pincus created a sensation in March 2005 when it sold its $560 million Bharti stake; the Bombay Stock Exchange transaction was the largest block trade ever on the Indian market.

The India Private Equity Report 2009: An inflection point for private equity in India
October 2009 | Page 4
Like Bharti, investments in India’s top 500 firms represent 30 per cent of the country’s private equity investments. b) Looking ahead Over the next 18 months, global private equity funds with considerable investment capital can be an important source of funding to Indian firms as the economy continues to improve. The level of “dry powder” available to invest has topped the $1 trillion mark since late 2007. Not only is there already a significant amount of money available to invest in India but the country’s projected growth is expected to attract even more private equity in the years ahead. In its transition from an agrarian society, India already has established itself as a global player in the services industry and now is becoming more competitive in manufacturing. Driving the economic expansion will be a critical mass of young, educated workers. A full 60 per cent of India’s population is under 30 years of age. Middle-class consumption has given rise to a booming domestic market. Retail consumption in four areas alone—apparel; footwear; jewelry and watches; and furniture and furnishing—is expected to skyrocket, from $4 billion in 2006 to $29 billion in 2011. In India, 8 million mobile phones are bought every month. Multinational companies are increasing their investments in India’s growing economy. For example, the Italian carmaker Fiat will source more than $1 billion worth of components for its global businesses in 2010 in India. In 2007 Cisco opened its Globalisation Centre East (GCE) in Bangalore, which serves as the company’s second headquarters. And PepsiCo is doubling its investment in its Indian beverage business for 2009, to more than $220 million. Among the substantial areas for growth aided by private equity investments: Infrastructure, including power plants, ports and airports, and manufacturing. Private equity will be a major enabler of India’s push to build infrastructure in the decades ahead. “The country needs tremendous capital in this area”, said Ashish Dhawan, a Senior Managing Director of ChrysCapital, who pointed out that a lot of infrastructure investing is driven now by government policy that is much more aggressive in terms of encouraging private-public partnership. “There is a fundamental game change that has taken place in this sector”, he said. Such advances are likely to continue as the economy picks up steam. The report that follows will offer glimpses into the future. Based on research conducted by the India Venture Capital Association and Bain & Company, it also provides important details and critical insights into private equity’s recent achievements in India, Asia and throughout the world.
The India Private Equity Report 2009: An inflection point for private equity in India
October 2009 | Page 5
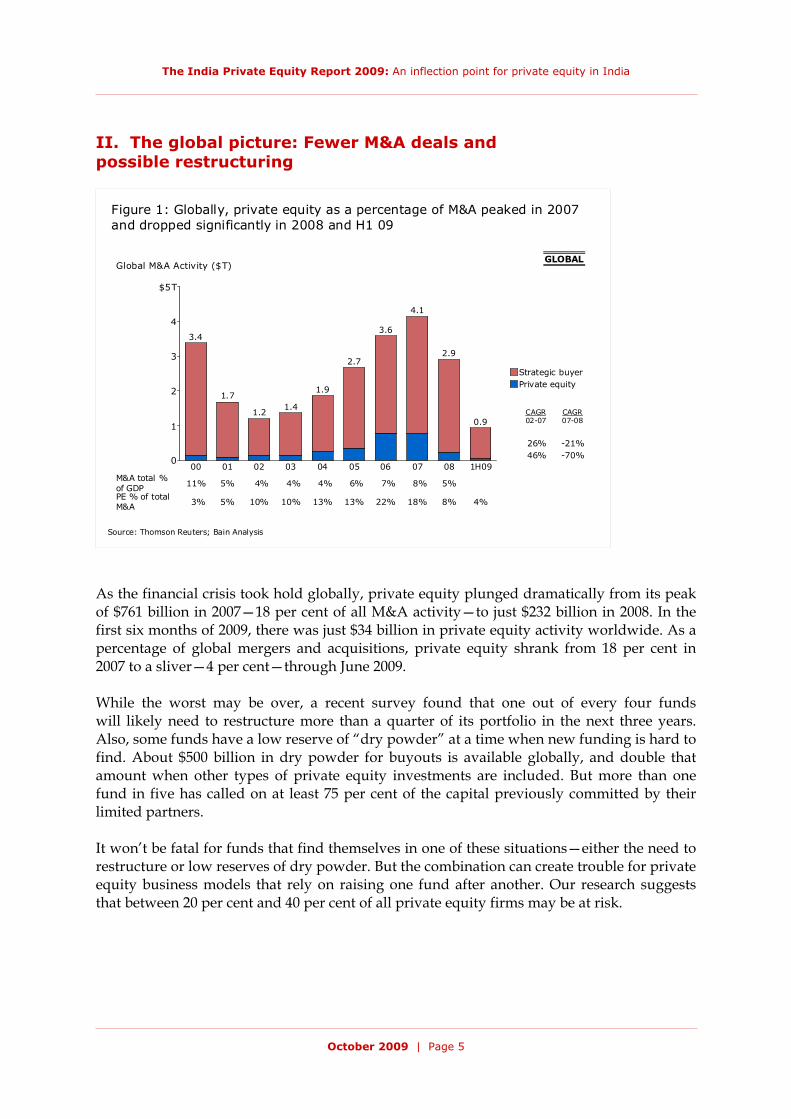
II. The global picture: Fewer M&A deals and possible restructuring
Figure 1: Globally, private equity as a percentage of M&A peaked in 2007 and dropped significantly in 2008 and H1 09
0
1
2
3
4
$5T
Global M&A Activity ($T)
00
3.4
01
1.7
02
1.2
03
1.4
04
1.9
05
2.7
06
3.6
07
4.1
08
2.9
1H09
0.9
46%26%
-70%-21%
4% 6% 7% 8% 5%11% 5% 4% 4%M&A total %of GDP
13% 13% 22% 18% 8% 4%3% 5% 10% 10%PE % of totalM&A
02-07CAGR
07-08CAGR
Private equityStrategic buyer
Source: Thomson Reuters; Bain Analysis
GLOBAL
As the financial crisis took hold globally, private equity plunged dramatically from its peak of $761 billion in 2007—18 per cent of all M&A activity—to just $232 billion in 2008. In the first six months of 2009, there was just $34 billion in private equity activity worldwide. As a percentage of global mergers and acquisitions, private equity shrank from 18 per cent in 2007 to a sliver—4 per cent—through June 2009. While the worst may be over, a recent survey found that one out of every four funds will likely need to restructure more than a quarter of its portfolio in the next three years. Also, some funds have a low reserve of “dry powder” at a time when new funding is hard to find. About $500 billion in dry powder for buyouts is available globally, and double that amount when other types of private equity investments are included. But more than one fund in five has called on at least 75 per cent of the capital previously committed by their limited partners. It won’t be fatal for funds that find themselves in one of these situations—either the need to restructure or low reserves of dry powder. But the combination can create trouble for private equity business models that rely on raising one fund after another. Our research suggests that between 20 per cent and 40 per cent of all private equity firms may be at risk.
The India Private Equity Report 2009: An inflection point for private equity in India
October 2009 | Page 6
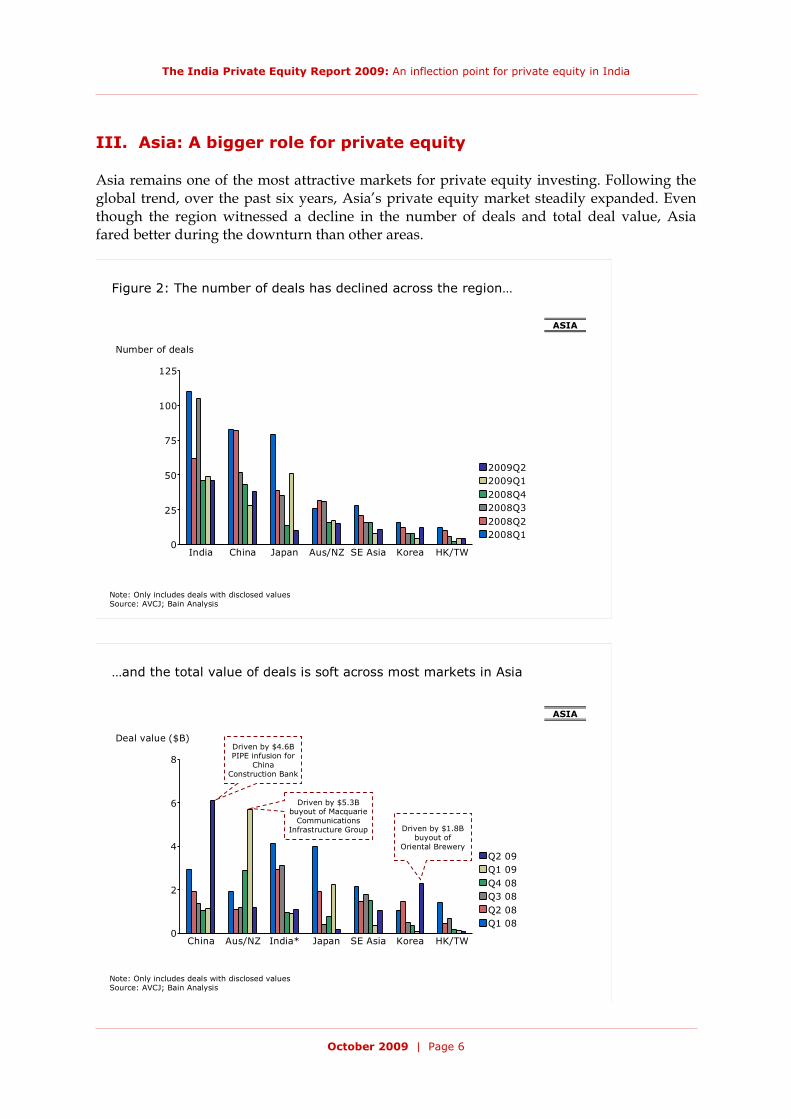
Figure 2: The number of deals has declined across the region…
0
25
50
75
100
125
Number of deals
India China Japan Aus/NZ SE Asia Korea HK/TW
2008Q12008Q22008Q32008Q42009Q12009Q2
Note: Only includes deals with disclosed valuesSource: AVCJ; Bain Analysis
ASIA
…and the total value of deals is soft across most markets in Asia
0
2
4
6
8
Deal value ($B)
China Aus/NZ India* Japan SE Asia Korea HK/TW
Q1 08Q2 08Q3 08Q4 08Q1 09Q2 09
Note: Only includes deals with disclosed valuesSource: AVCJ; Bain Analysis
Driven by $4.6B PIPE infusion for
China Construction Bank
Driven by $1.8B buyout of
Oriental Brewery
Driven by $5.3B buyout of Macquarie
Communications Infrastructure Group
ASIA
III. Asia: A bigger role for private equity Asia remains one of the most attractive markets for private equity investing. Following the global trend, over the past six years, Asia’s private equity market steadily expanded. Even though the region witnessed a decline in the number of deals and total deal value, Asia fared better during the downturn than other areas.
The India Private Equity Report 2009: An inflection point for private equity in India
October 2009 | Page 7
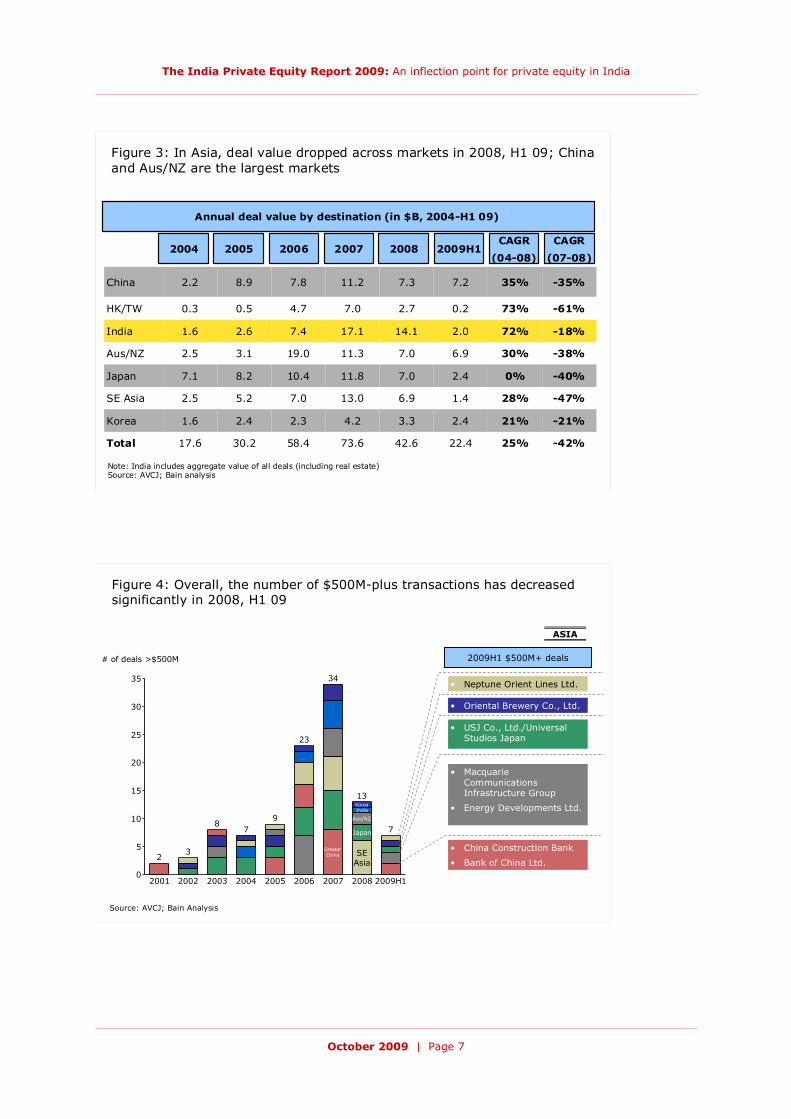
Figure 4: Overall, the number of $500M-plus transactions has decreased significantly in 2008, H1 09
0
5
10
15
20
25
30
35
# of deals >$500M
2001
2
2002
3
2003
8
2004
7
2005
9
2006
23
2007
GreaterChina
34
2008
KoreaIndia
Aus/NZ
Japan
SEAsia
13
2009H1
7
Source: AVCJ; Bain Analysis
• Macquarie Communications Infrastructure Group
• Energy Developments Ltd.
• USJ Co., Ltd./Universal Studios Japan
• China Construction Bank
• Bank of China Ltd.
• Oriental Brewery Co., Ltd.
2009H1 $500M+ deals
ASIA
• Neptune Orient Lines Ltd.
Figure 3: In Asia, deal value dropped across markets in 2008, H1 09; China and Aus/NZ are the largest markets
-42%
-21%
-47%
-40%
-38%
-18%
-61%
-35%
22.4
2.4
1.4
2.4
6.9
2.0
0.2
7.2
25%42.673.658.430.217.6Total
21%3.34.22.32.41.6Korea
28%6.913.07.05.22.5SE Asia
0%7.011.810.48.27.1Japan
30%7.011.319.03.12.5Aus/NZ
72%14.117.17.42.61.6India
73%2.77.04.70.50.3HK/TW
35%7.311.27.88.92.2China
Annual deal value by destination (in $B, 2004-H1 09)
Note: India includes aggregate value of all deals (including real estate)Source: AVCJ; Bain analysis
2004 2005 2006 2007 2008 2009H1CAGR
(04-08)
CAGR
(07-08)

The India Private Equity Report 2009: An inflection point for private equity in India
October 2009 | Page 8
Figure 5: Despite slow take-off in H1 09, financial services, consumer productsand leisure saw a significant uptick in deal value
-60%-60%1.89.022.5Other
493%-76%1.70.62.5Leisure/entertainment
239%24%2.51.51.2Consumer products/services
-40%-77%0.61.88.0Telecommunications
-45%94%0.72.51.3Utilities
-84%-32%0.22.63.7Services (Non-financial)
-91%17%0.12.92.5Travel/Hospitality
-81%29%0.33.02.3Medical
-26%8%1.54.13.8Transportation/distribution
-82%-23%0.44.25.4Manufacturing (Heavy)
-91%91%0.24.42.3Mining and metals
263%-67%11.06.018.1Financial services
Sector 2007 2008 H1 09 CAGR(07-08)
AnnualisedCAGR
(08-09)
Deal value by industry - Asia ($B)
Although the region was not as hard hit, it still was shaken by the turbulence. Shock waves are reflected in sharply declining deal values. By the end of 2008, China gave up all of the value growth gained over the past four years. Japan, which saw no growth since 2004, saw deal values sink by 40 per cent. India had the least impact, with just an 18 per cent drop. Deal making in the region plummeted from a peak of $76 billion in 2007 to $22 billion in the first half of 2009. While the region saw a drop in value overall, China, Australia, New Zealand and Korea saw their average deal value increase. In the first half of 2009, the average deal size ranged from a high of $215 million in Australia/New Zealand to $110 million in China to $39 million in Japan and $21 million in India. The number of transactions of more than $500 million in size decreased significantly, from a high of 34 deals in 2007 to just seven in the first half of 2009. Still, there were a few huge deals. A $4.6 billion infusion in China Construction Bank by Beijing-based Hopu Investment Management and Temasek and a $5.3 billion buyout of Australia’s Macquarie Communications Infrastructure Group by the Canada Pension Plan Investment Board (CPPIB) helped to make China and Australia the largest Asian private equity markets, with a mix of buyout and growth deals. Despite the drop, deals continue across a wide range of sectors. The start of 2009 saw deal values increase significantly in three sectors. The annualised growth in value for leisure and entertainment deals shot up 493 per cent; financial services grew by 263 per cent; and consumer products deals experienced a 239 per cent surge in value.
The India Private Equity Report 2009: An inflection point for private equity in India
October 2009 | Page 9
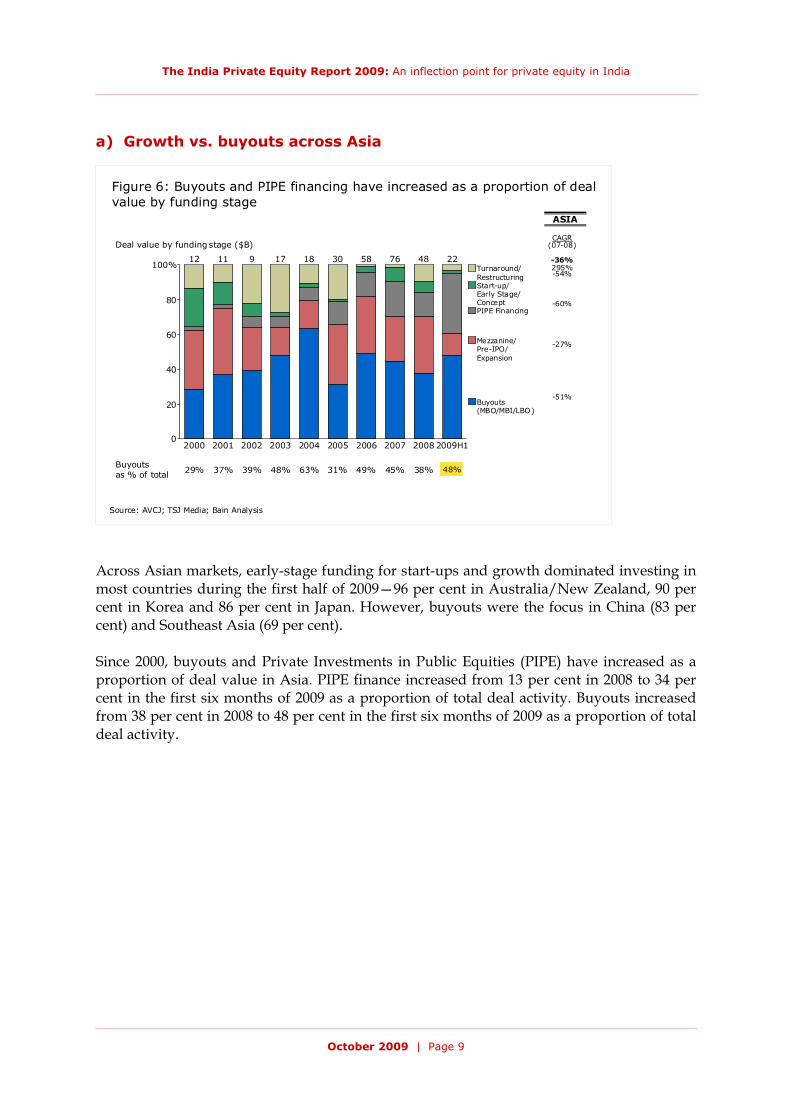
a) Growth vs. buyouts across Asia
Figure 6: Buyouts and PIPE financing have increased as a proportion of deal value by funding stage
0
20
40
60
80
100%
Deal value by funding stage ($B)
2000
12
2001
11
2002
9
2003
17
2004
18
2005
30
2006
58
2007
76
2008
48
2009H1
22
-51%
-27%
-60%
29% 48%37% 39% 48% 63% 31% 49% 45% 38%Buyoutsas % of total
-54%295%
(07-08)
-36%
CAGR
Buyouts(MBO/MBI/LBO)
Mezzanine/Pre-IPO/Expansion
PIPE Financing
Start-up/Early Stage/Concept
Turnaround/Restructuring
Source: AVCJ; TSJ Media; Bain Analysis
ASIA
Across Asian markets, early-stage funding for start-ups and growth dominated investing in most countries during the first half of 2009—96 per cent in Australia/New Zealand, 90 per cent in Korea and 86 per cent in Japan. However, buyouts were the focus in China (83 per cent) and Southeast Asia (69 per cent). Since 2000, buyouts and Private Investments in Public Equities (PIPE) have increased as a proportion of deal value in Asia. PIPE finance increased from 13 per cent in 2008 to 34 per cent in the first six months of 2009 as a proportion of total deal activity. Buyouts increased from 38 per cent in 2008 to 48 per cent in the first six months of 2009 as a proportion of total deal activity.

The India Private Equity Report 2009: An inflection point for private equity in India
October 2009 | Page 10
b) Asia exits: An equal split between trade sales and IPOs
Figure 7: In H1 09, divestments in Asia were equally split through trade sales and IPOs
0
20
40
60
80
100%
# of deal exits (H1 09)
Asia average
Greater China
Trade sales
IPOs
41
Korea
38
India
24
SE Asia
12
Japan
8 5 Total = 128
Aus/NZ
Note: For India, total value of public market sale exits was $149M; value for three trade sales exits was $52M;Greater China includes PRC, HK and Taiwan.
Source: AVCJ; TSJ Media; Bain analysis
ASIA
When it comes to exiting deals, investors split the activity equally between trade sales within the investment industry and IPOs. In China, the majority were trade sales during the first six months of the year, while in India, IPOs dominated. c) Top 10 deals in Asia
Figure 8: Top 10 deals in Asia in H1 09
PIPE Financing0.4Bain Capital Asia, LLCRetail/Wholesale
ChinaGome Electrical Appliances Holding Ltd.
Expansion/ Growth Capital
0.4BOCI Private Equity; Bohai Industrial Investment Fund Management Co., Ltd.; CDH China Management Co., Ltd.; China Huarong Asset Management Corp. and others
Transportation/ Distribution
ChinaChery Automobile Co., Ltd.
Expansion/ Growth Capital
0.3Temasek Holdings Pte. Ltd. Consumer products
SingaporeOlam International Ltd.
Buyout0.6Archer Capital Pty Ltd.UtilitiesAustraliaEnergy Developments Ltd.
PIPE Financing0.7Temasek Holdings Pte. Ltd. Transportation/ Distribution
SingaporeNeptune Orient Lines Ltd.
PIPE Financing0.7Hopu Investment Management Co., Ltd.Financial services
ChinaBank of China Ltd.
Buyout1.7Glenn Gumpel; Goldman Sachs (Japan) Ltd.; MBK Partners K.K.; Owl Creek Asset Management, L.P.
Leisure/Entertainment
JapanUSJ Co., Ltd./Universal Studios Japan
Buyout1.8Affinity Equity Partners (S) Pte Ltd.; KKR Asia Ltd. Consumer products
South KoreaOriental Brewery Co., Ltd.
PIPE Financing4.6Hopu Investment Management Co., Ltd.; TemasekHoldings Pte. Ltd.
Financial services
ChinaChina Construction Bank
Buyout5.3Canada Pension Plan Investment BoardFinancial services
AustraliaMacquarie Communications Infrastructure Group
Source: AVCJ; Bain Analysis
1
2
3
4
5
6
7
8
9
10
Target Market Industry Investor Value ($B)
Financial Stage

The India Private Equity Report 2009: An inflection point for private equity in India
October 2009 | Page 11
At the top of the list is the $5.3 billion takeover of Macquarie Communications Infrastructure Group (MCG) by CPPIB, one of Canada’s largest institutional investors. MCG owns and operates the radio and TV broadcast infrastructure in Australia and the UK, including a 48 per cent stake in Argiva, the leading transmission provider in Britain and a 50 per cent stake in Airwave, Britain’s emergency and public services communication network. CPPIB praised the acquisition as providing a diversified portfolio of infrastructure assets with stable cash flows at an attractive valuation. d) Top 10 trade exits in Asia
Figure 9: Top 10 trade exits in Asia in H1 09
• 2.8x return• 4 year holding
• Pfizer Animal Health
• $0.1B• ICICI Venture Funds Management Company Ltd.
• India: Medical• Vetnex Animal Health Ltd.
• Unknown• 4 year holding
• Undisclosed Investor(s)
• $0.1B• CDH China Management Co., Ltd.; Morgan Stanley Private Equity Advisory (Beijing) Ltd.
• China: Manufacturing -heavy
• China Shanshui Cement Group Ltd. (Sunnsy Group)
• 3x return• 2 year holding
• American Tower Corp.
• $0.1B• Q Investments, L.P.• India: Telecom• XCEL Telecom Pvt. Ltd.
• Unknown• 4 year holding
• Pearson PLC• $0.1B• The Carlyle Group; Wall Street Institute
• China: Services -non-financial
• Wall Street English
• Unknown return
• 3 year holding
• Hoyu Co., Ltd.• $0.3B• Advantage Partners, Inc.; MKS Partners Ltd.; Unison Capital
• Japan: Consumer products
• Kracie Holdings, Ltd.
• Unknown return
• Unknown holding period
• United Microelectronics Corp.
• $0.3B• AIG Global Investment (Asia); Daiwa SMBC Capital Asia; He JianTechnology; Kawasaki Microelectronics; SAIF Partners
• China: Computer related
• He Jian Technology (Suzhou) Co., Ltd.
• 11x return• 5 year holding
• Ping An Insurance (Group) Company of China, Ltd.
• $1.7B• TPG Capital, L.P.• China: Financial services
• Shenzhen Development Bank Co., Ltd.
• 4x return• 3 year holding
• Undisclosed Investor(s)
• $1.9B• Goldman Sachs (Asia) Ltd.• China: Financial services
• Industrial and Commercial Bank of China Ltd.
• 10x return• 1 year holding
• Undisclosed Investor(s)
• $0.1B• Morgan Stanley Private Equity Advisory (Beijing) Ltd.
• China: Retail/wholesale
• China Dongxiang (Group) Co., Ltd.
• 1.4x return• 3 year holding
• GS Holdings• $0.1B• Morgan Stanley Private Equity Asia Ltd.
• South Korea: Retail/wholesale
• SSangyong Corp.
Note: Exit multiple measures cash return on initial investment; Holding period rounded to the nearest year.Source: AVCJ; Literature Review; Bain Analysis
Target Country/ industry Exiting investor Exit
value Acquirer Estimated return
1
2
3
4
5
6
7
8
9
10
Goldman Sachs’s sale of 3.03 billion shares of the Industrial and Commercial Bank of China (ICBC) to undisclosed investors was the largest trade exit in Asia in the first half of 2009, giving Goldman a return of $1.9 billion. Earlier in the year, ICBC’s two other foreign strategic investors, Allianz Group and American Express, each sold shares.
The India Private Equity Report 2009: An inflection point for private equity in India
October 2009 | Page 12
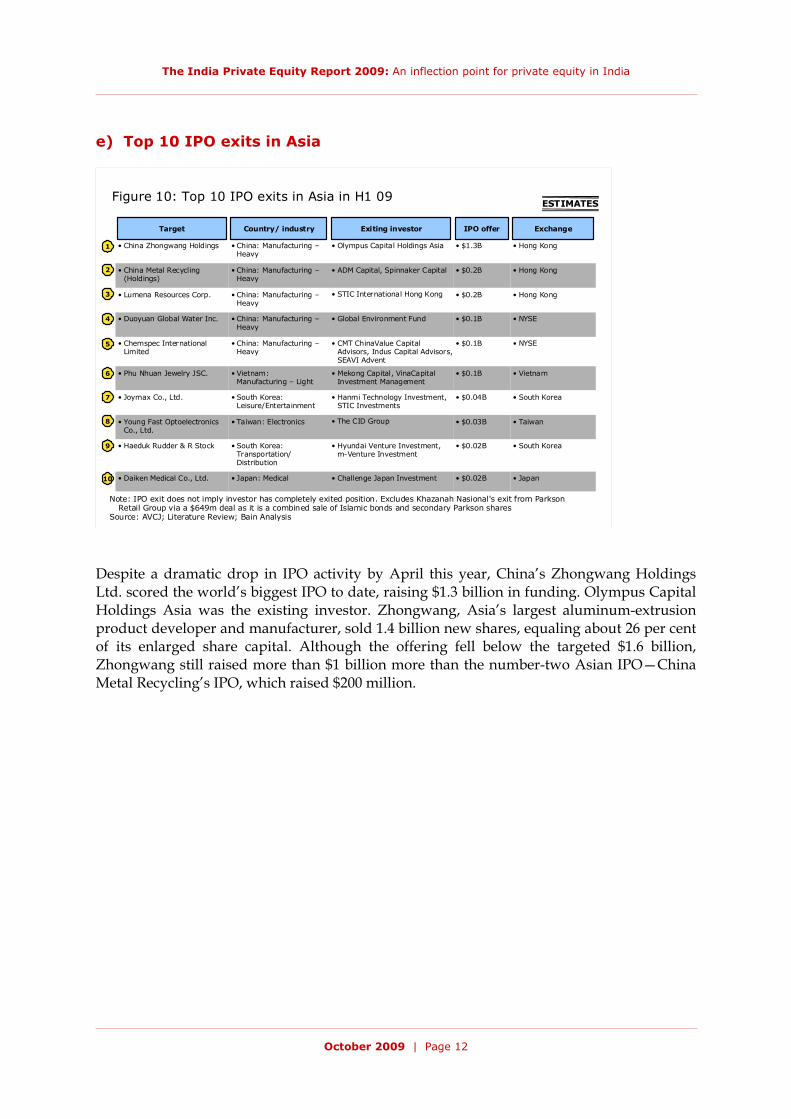
e) Top 10 IPO exits in Asia
Figure 10: Top 10 IPO exits in Asia in H1 09
• Taiwan• $0.03B• The CID Group• Taiwan: Electronics• Young Fast Optoelectronics Co., Ltd.
• South Korea• $0.02B• Hyundai Venture Investment, m-Venture Investment
• South Korea: Transportation/ Distribution
• Haeduk Rudder & R Stock
• Japan• $0.02B• Challenge Japan Investment• Japan: Medical• Daiken Medical Co., Ltd.
• South Korea• $0.04B• Hanmi Technology Investment, STIC Investments
• South Korea: Leisure/Entertainment
• Joymax Co., Ltd.
• NYSE• $0.1B• CMT ChinaValue Capital Advisors, Indus Capital Advisors, SEAVI Advent
• China: Manufacturing –Heavy
• Chemspec International Limited
• NYSE• $0.1B• Global Environment Fund• China: Manufacturing –Heavy
• Duoyuan Global Water Inc.
• Vietnam• $0.1B• Mekong Capital, VinaCapitalInvestment Management
• Vietnam: Manufacturing – Light
• Phu Nhuan Jewelry JSC.
• Hong Kong• $0.2B• STIC International Hong Kong• China: Manufacturing –Heavy
• Lumena Resources Corp.
• Hong Kong• $0.2B• ADM Capital, Spinnaker Capital• China: Manufacturing –Heavy
• China Metal Recycling (Holdings)
• Hong Kong• $1.3B• Olympus Capital Holdings Asia• China: Manufacturing –Heavy
• China Zhongwang Holdings
ESTIMATES
Note: IPO exit does not imply investor has completely exited position. Excludes Khazanah Nasional's exit from ParksonRetail Group via a $649m deal as it is a combined sale of Islamic bonds and secondary Parkson shares
Source: AVCJ; Literature Review; Bain Analysis
Target Country/ industry Exiting investor IPO offer Exchange
1
2
3
4
5
6
7
8
9
10
Despite a dramatic drop in IPO activity by April this year, China’s Zhongwang Holdings Ltd. scored the world’s biggest IPO to date, raising $1.3 billion in funding. Olympus Capital Holdings Asia was the existing investor. Zhongwang, Asia’s largest aluminum-extrusion product developer and manufacturer, sold 1.4 billion new shares, equaling about 26 per cent of its enlarged share capital. Although the offering fell below the targeted $1.6 billion, Zhongwang still raised more than $1 billion more than the number-two Asian IPO—China Metal Recycling’s IPO, which raised $200 million.
The India Private Equity Report 2009: An inflection point for private equity in India
October 2009 | Page 13
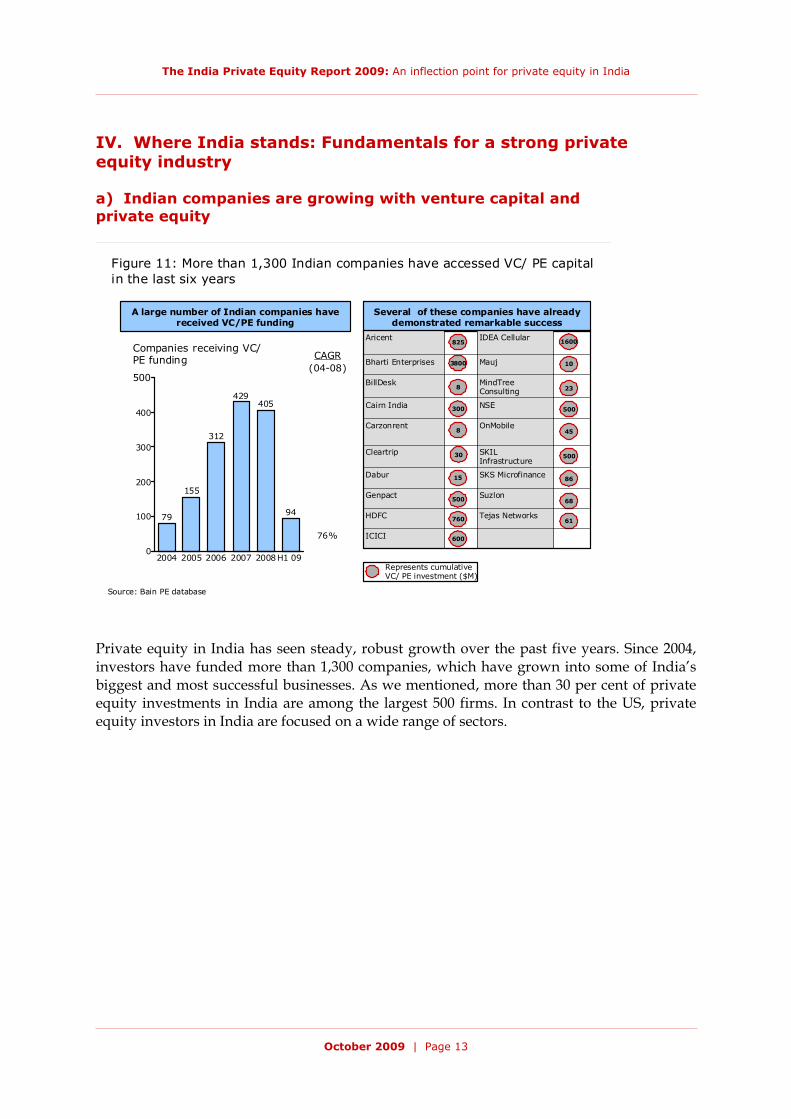
IV. Where India stands: Fundamentals for a strong private equity industry a) Indian companies are growing with venture capital and private equity
Figure 11: More than 1,300 Indian companies have accessed VC/ PE capital in the last six years
0
100
200
300
400
500
2004
79
2005
155
2006
312
2007
429
2008
405
94
76%
Companies receiving VC/PE funding
H1 09
(04-08)CAGR
Source: Bain PE database
A large number of Indian companies have received VC/PE funding
Several of these companies have already demonstrated remarkable success
Represents cumulative VC/ PE investment ($M)
1600
500
500
86
23
45
68
10
61
3800
825
760
30
600
500
300
15
8
8
ICICI
Tejas NetworksHDFC
SuzlonGenpact
SKS MicrofinanceDabur
SKIL Infrastructure
Cleartrip
OnMobileCarzonrent
NSECairn India
MindTreeConsulting
BillDesk
MaujBharti Enterprises
IDEA CellularAricent
Private equity in India has seen steady, robust growth over the past five years. Since 2004, investors have funded more than 1,300 companies, which have grown into some of India’s biggest and most successful businesses. As we mentioned, more than 30 per cent of private equity investments in India are among the largest 500 firms. In contrast to the US, private equity investors in India are focused on a wide range of sectors.
The India Private Equity Report 2009: An inflection point for private equity in India
October 2009 | Page 14
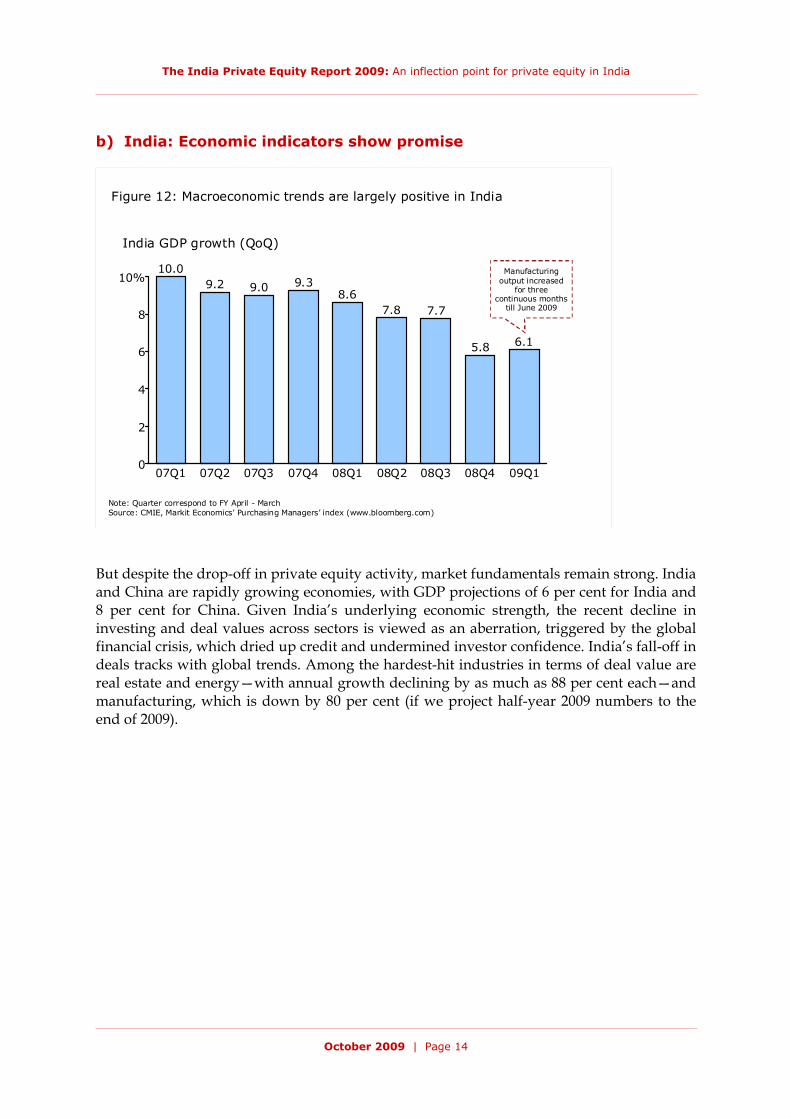
b) India: Economic indicators show promise
Figure 12: Macroeconomic trends are largely positive in India
0
2
4
6
8
10%
07Q1
10.0
07Q2
9.2
07Q3
9.0
07Q4
9.3
08Q1
8.6
08Q2
7.8
08Q3
7.7
08Q4
5.8
09Q1
6.1
India GDP growth (QoQ)
Manufacturing output increased
for three continuous months
till June 2009
Note: Quarter correspond to FY April - MarchSource: CMIE, Markit Economics’ Purchasing Managers’ index (www.bloomberg.com)
But despite the drop-off in private equity activity, market fundamentals remain strong. India and China are rapidly growing economies, with GDP projections of 6 per cent for India and 8 per cent for China. Given India’s underlying economic strength, the recent decline in investing and deal values across sectors is viewed as an aberration, triggered by the global financial crisis, which dried up credit and undermined investor confidence. India’s fall-off in deals tracks with global trends. Among the hardest-hit industries in terms of deal value are real estate and energy—with annual growth declining by as much as 88 per cent each—and manufacturing, which is down by 80 per cent (if we project half-year 2009 numbers to the end of 2009).

The India Private Equity Report 2009: An inflection point for private equity in India
October 2009 | Page 15
c) India’s biggest deals in 2009
Figure 13: Top 25 private equity deals in India for H1 09
2524232221201918171615141312
11
1098765
4321
4%$30MMay-09Healthcare & Life Sciences Max IndiaIFCNA$27MApr-09ManufacturingSBQ SteelsADG Fund4%$26MMar-09IT & ITESMphasiSBaring IndiaNA$25MJun-09Media & EntertainmentNetwork18 Media & Investm’tsSAIF
10%$20MApr-09Healthcare & Life Sciences Vasan Health Care GroupSequoia Capital India
70%$48MMar-09TelecomTikona Digital NetworksGoldman Sachs, Indivision, Oak Investment Partners
51%$40MApr-09Transport & LogisticsInlogisticsIndia Value Fund5%$40MJun-09Other Services Ramky Enviro EngineersStanChart-IL&FSNA$40MFeb-09Real EstateInfrastructure Ventures IndiaIL&FS Realty Fund8%$37MMay-09Food & Beverages KS OilsCiti, New Silk Route, Baring Asia18%$36MJan-09Transport & LogisticsCoastal ProjectsCitigroup Venture Capital Int’lNA$30MFeb-09Retail Home Solutions RetailKotak PE, ICICI VentureNA$30MMay-09EnergyCobol TechnologiesPangea CapitalNA$30MMay-09EnergyDeeya EnergyNEA, BlueRun Ventures, DFJ, OthersNA$30MApr-09Education EdutechNavis Capital
Transport & LogisticsBFSI BFSI Engg. & Construction Media & EntertainmentReal Estate
Textiles & Garments Real EstateTelecomTransport & Logistics
NA$50MMay-09Share MicrofinIFC, Others
49%$50MApr-09Ashoka BuildConIDFC Project Equity
15%$60MMay-09Keystone RealtorsSun Apollo
NA$150MJun-09Quippo Telecom InfrastructureIDFC PE, Oman Investment FundNA$161MFeb-09Krishnapatanam Port Company3i India Infrastructure Fund
10%$48MMar-09Allcargo GlobalBlackstone Advisors India
2%$50MJun-09National Stock ExchangeNorwest
8%$50MFeb-09Nimbus Communications3i, Cisco, Oman Investment Fund
21%$67MMar-09Bombay Rayon FashionsAAA United8%$114MMay-09Indiabulls Real EstateMorgan Stanley & Co International
Note: Bain PE database captures ~80% of total deal value since 2000Source: Bain PE database
PE firm Target Sector Purchase date
Purchase price Stake
Historically, funds in India haven’t shown much interest in infrastructure, construction, engineering, manufacturing and energy. But a shift is taking place. An infrastructure deal was No. 1 in the top 25 list for the first half of 2009, reflecting investors’ interest in the promise of India’s continued growth. 3i Group took a $161 million minority stake in the Krishnapatnam Port Company Ltd. (KPCL), which won the concession to develop the new Krishnapatnam port on the east coast of India. Because of limited port capacity and rapid growth in international trade, India’s Planning Commission estimates that the port sector will require about $20 billion in investments over the next five years. Other top deals include IDFC Project Equity’s minority stake for $50 million in Ashoka Buildcon, an engineering and construction company, and a $30 million injection by Pangea Capital into Cobol Technologies, an energy firm. The recent decrease in both the size and number of deals stems from two factors: initially, it was the impact of the downturn and subsequently, as the economy came back, the fact that Indian companies have had access to other funding sources, especially debt.

The India Private Equity Report 2009: An inflection point for private equity in India
October 2009 | Page 16
d) Top 25 deals by size
Figure 14: Top 25 deals by size of deal in India
16<50M
3
6
192326154446Average deal size ($M)
1427>500M
1317300-500M
62011200-300M
17165100-200M
1750-100M
Note: Top 25 deals are from Bain deal databaseSource: INDATA (India Advisory Partners); TSJ Media; Bain deal database
2000-08 2006 2007 2008 H1 09
e) India companies prefer to retain control
Figure 15: While $48B has been invested in India since 2000, few deals exceeded $500M
0
20
40
60
80
100%
No of PE deals
~1,900+ deals
PE deal value
All otherdeals
Top 25deals
~$48B
PE deals in India (2000 - H1 09)
Note: Top 25 deals are from Bain deal database; Top 25 deals for H1 ‘09Source: INDATA (India Advisory Partners); TSJ Media; Bain deal database
Top 25 deals represent ~25% of total deal value Deal sizes in H1 09 significantly lower
0
20
40
60
80
100%
2000-H109
200-300M
300-500M
>500M
25
2006
100-200M
50-100M
>500M300-500M
25
2007
200-300M
100-200M
>500M
300-500M
25
2008
200-300M
100-200M
>500M300-500M
25
H1 09
<50
50-100M
100-200M
25
446 154 326 192
Top 25 deals by size of deal(2000 - H1 09, 2006 - H1 09)
Averagedeal size($M)
INDIA
The India Private Equity Report 2009: An inflection point for private equity in India
October 2009 | Page 17
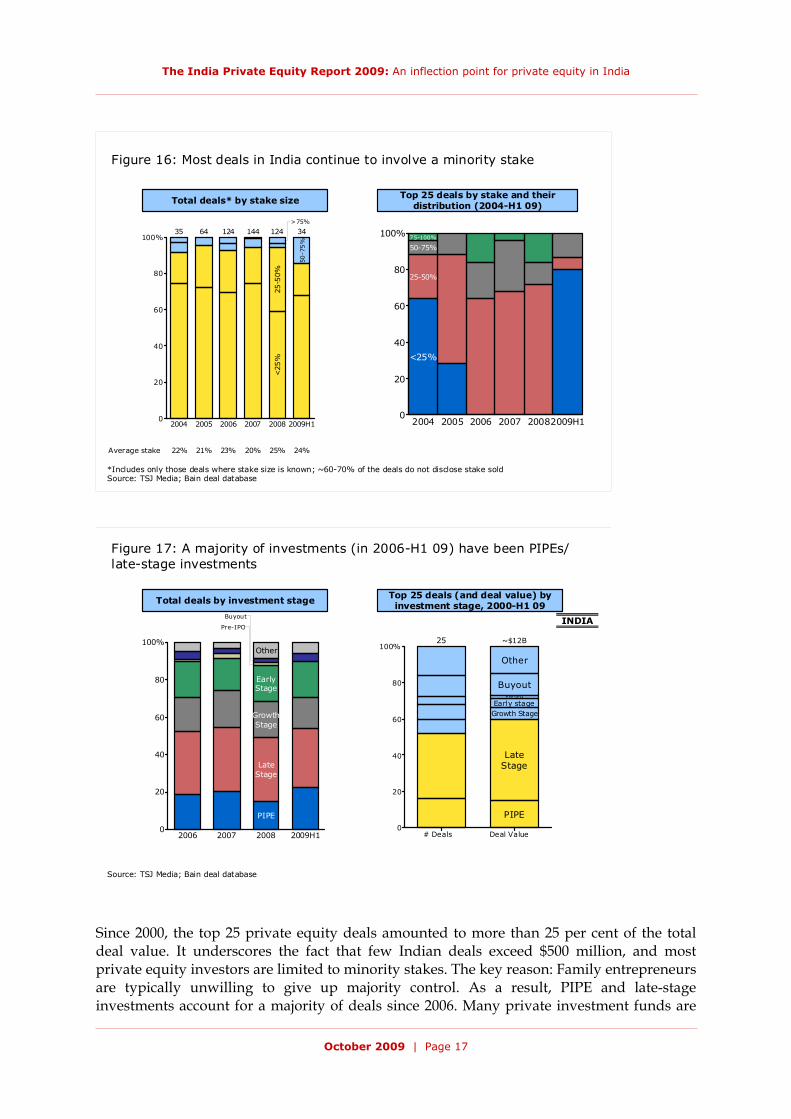
Figure 16: Most deals in India continue to involve a minority stake
*Includes only those deals where stake size is known; ~60-70% of the deals do not disclose stake soldSource: TSJ Media; Bain deal database
0
20
40
60
80
100%
2004
35
2005
64
2006
124
2007 2008
<25
%25
-50%
124
2009H1
50-7
5%
34144>75%
22% 21% 23% 20% 25% 24%Average stake
Total deals* by stake size
0
20
40
60
80
100%
2004
25-50%
<25%
75-100%
50-75%
2005 2006 2007 20082009H1
Top 25 deals by stake and their distribution (2004-H1 09)
Figure 17: A majority of investments (in 2006-H1 09) have been PIPEs/late-stage investments
Source: TSJ Media; Bain deal database
Total deals by investment stage
0
20
40
60
80
100%25
Growth Stage
LateStage
PIPE
Early stage
Other
BuyoutPre-IPO
~$12B
# Deals Deal Value
Top 25 deals (and deal value) by investment stage, 2000-H1 09
0
20
40
60
80
100%
2006 2007 2008
GrowthStage
LateStage
PIPE
EarlyStage
Other
2009H1
Buyout
Pre-IPOINDIA
Since 2000, the top 25 private equity deals amounted to more than 25 per cent of the total deal value. It underscores the fact that few Indian deals exceed $500 million, and most private equity investors are limited to minority stakes. The key reason: Family entrepreneurs are typically unwilling to give up majority control. As a result, PIPE and late-stage investments account for a majority of deals since 2006. Many private investment funds are

The India Private Equity Report 2009: An inflection point for private equity in India
October 2009 | Page 18
Figure 18: Overall, exit volumes have remained low relative to deals
Source: Venture Intelligence
0.0
1.0
2.0
3.0
$4.0B
Transaction value of PE exits in India
2004Telecom
0.5
2005
IT &ITES
Telecom
3.7
2006
Energy
Healthcare& Life
Sciences
IT &ITES
2.2
2007
IT & ITES
1.2
2008
Others
BFSI
1.1
H1 09
0.2
Shipping & Logistics
Manufacturing
Peak in 2005 due to large exits by
Warburg Pincus and CVC
INDIA
Top five exits in H1 09
• Shriram Transport Finance ($60M)
• Mundra Port & SEZ ($33M)
• Delhi International Airport ($30M)
• Lupin ($19M)
• Telsima ($12M)
willing to take minority stakes in businesses through private placements, allowing them to participate in market growth. Companies preparing to go public are more willing to accept PIPE funding to strengthen their market position. f) Delaying exits until the right time
Figure 19: 40%-60% of exits are historically made through strategic sales
0
20
40
60
80
100%
2005
Buyback
Public marketsale (incl. IPOs)
Secondary sale
Strategicsale
33
2006
28
2007
53
2008
25
2009H1
25
No. of exits by PE firms
$3.7B $2.2B $1.2B $1.1B $0.2B
Transaction valueof PE exits
18 10 25 8 7No. ofM&A exits
Source: Venture Intelligence
INDIA
Public market sales
dominate in H1 09, though total value of exits has only been $0.2B
The India Private Equity Report 2009: An inflection point for private equity in India
October 2009 | Page 19
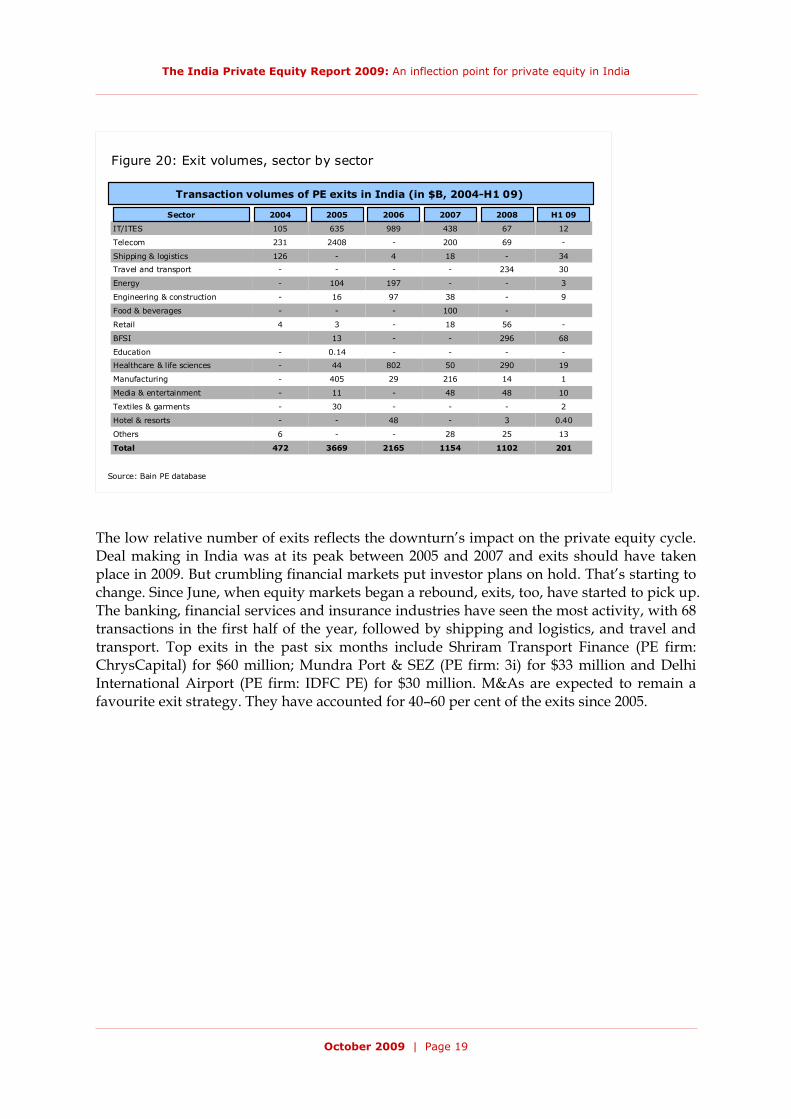
Figure 20: Exit volumes, sector by sector
201
13
0.40
2
10
1
19
-
68
-
9
3
30
34
-
12
1102115421653669472Total
2528--6Others
3-48--Hotel & resorts
---30-Textiles & garments
4848-11-Media & entertainment
1421629405-Manufacturing
2905080244-Healthcare & life sciences
---0.14-Education
296--13BFSI
5618-34Retail
-100---Food & beverages
-389716-Engineering & construction
--197104-Energy
234----Travel and transport
-184-126Shipping & logistics
69200-2408231Telecom
67438989635105IT/ITES
Transaction volumes of PE exits in India (in $B, 2004-H1 09)
Source: Bain PE database
Sector 2004 2005 2006 2007 2008 H1 09
The low relative number of exits reflects the downturn’s impact on the private equity cycle. Deal making in India was at its peak between 2005 and 2007 and exits should have taken place in 2009. But crumbling financial markets put investor plans on hold. That’s starting to change. Since June, when equity markets began a rebound, exits, too, have started to pick up. The banking, financial services and insurance industries have seen the most activity, with 68 transactions in the first half of the year, followed by shipping and logistics, and travel and transport. Top exits in the past six months include Shriram Transport Finance (PE firm: ChrysCapital) for $60 million; Mundra Port & SEZ (PE firm: 3i) for $33 million and Delhi International Airport (PE firm: IDFC PE) for $30 million. M&As are expected to remain a favourite exit strategy. They have accounted for 40–60 per cent of the exits since 2005.

The India Private Equity Report 2009: An inflection point for private equity in India
October 2009 | Page 20
g) A preference for strategic investors
Figure 21: The deal size of secondary sales to other PE firms is low
Uma Precision
Sula Vineyards
Skygourmet
RSB Group
Ocean Sparkle
Mars Restaurants
Edelweiss Capital
Updater Services
Subhiksha Trading Services
Sharekhan
Paras Pharmaceuticals
Ortel Communications
Karrox
Excelsoft
2007-ManufacturingGlobal Investment HouseJina Ventures, Others
2007-Agri-businessIndivisionGem India Advisors, Others
2007-Food & BeveragesIndia Hospitality CorpNavis Capital, Others
2007-ManufacturingIIML, EvolvenceIFC, Others
200718Shipping & LogisticsIndia Equity PartnersAPIDC VC, Others
2007-Food & BeveragesIndia Hospitality CorpNavis Capital, Others
2007-BFSI
Lehman Brothers , Thomas Schmidheiny , Galleon Partners, Shuaa Capital , Sequoia Capital
Connect Capital, Greater Pacific Capital, Others
25
56
-
-
-
-
31
2008Other ServicesICICI VentureNew Vernon, Others
2008RetailPremjiInvestICICI Venture, Others
2008BFSIBaring AsiaCiti, Others
2008Healthcare & Life SciencesActisAureos, Others
2008Media & EntertainmentNew Silk RouteActis, Others
2008IT & ITESLumis PartnersSIDBI VC, Others
2008IT & ITESDE ShawUTI Ventures, Others
Secondary sales to other PE firms (2007 and 2008*)
*No secondary sales in 2009H1Source: Bain PE database
PE Firm Acquirer Target IndustryDeal
size-$MYear
Figure 22: Major Exits in 2007, 2008 and H1 09
Source: Industry reports
2009
2008
2007
2007
2007
2007
2007
2008
2008
2008
5%8.5x-60Shriram Transport FinanceChrysCapital
-13x2003135MarketRxSequoia Capital India, AndwelPartners, Others
26%5x2002100MTR FoodsJP Morgan, Aquarius
2006
-
2001
2003
2005
2005
2004
1.6x
-
-
2.4x
1.42x
1.7x
8.8x
69
180
200
211
218
234
261
Idea Cellular
Zavata
Cibernet
Punjab Tractors
Dabur Pharma
Thomas Cook India
IL&FS Investsmart
Sequoia Capital India
Sequoia Capital India, Others
iLabs
Actis, Others
IFC
Dubai Investment Group, Others
SAIF
1.5%
-
-
28.4
7.75
68
73
Selling PE firm Target Exit Year Deal value ($M)
Purchase year
ROI % stake sold
Investors are relying less on secondary sales to other private equity investors and instead opting to sell stakes to strategic investors, including companies looking to enter the Indian market or domestic firms that want to consolidate their market position in core or adjacent
The India Private Equity Report 2009: An inflection point for private equity in India
October 2009 | Page 21
businesses. A prime example is ChrysCapital’s sale of Shriram Transport Finance to ICICI Prudential Life Insurance, India’s largest private insurer, for $60 million. New Delhi-based ChrysCapital won a return of over eight times on its initial investment in Shriram, a commercial vehicle financier. V. Global outlook: The recovery begins
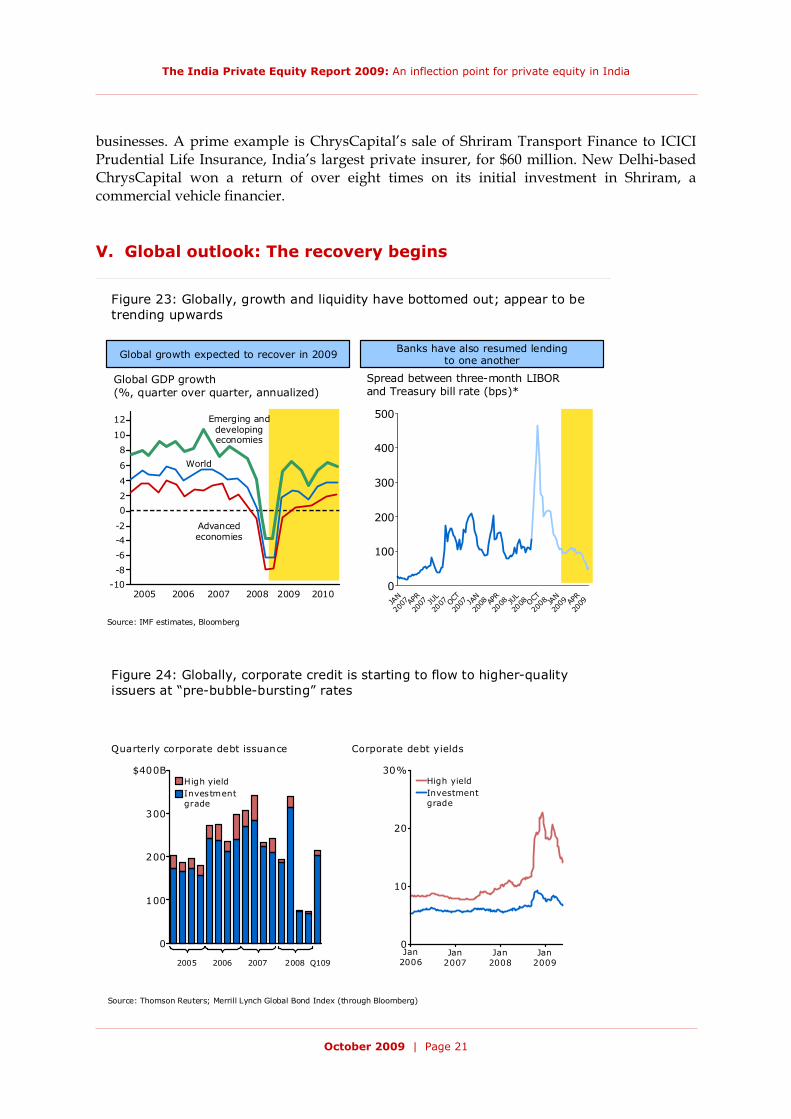
Figure 23: Globally, growth and liquidity have bottomed out; appear to be trending upwards
0
100
200
300
400
500
Spread between three-month LIBORand Treasury bill rate (bps)*
JAN
2007 AP
R
2007 JU
L
2007 OC
T
2007 JA
N
2008 AP
R
2008 JU
L
2008 OCT
2008 JA
N
2009 AP
R
2009
Global growth expected to recover in 2009 Banks have also resumed lending to one another
Source: IMF estimates, Bloomberg
Global GDP growth(%, quarter over quarter, annualized)
2005 2006 2007 2008 2009 2010-10
-8
-6
-4
-2
0
2
4
6
8
10
12 Emerging anddevelopingeconomies
World
Advancedeconomies
0
100
200
300
$400B
Quarterly corporate debt issuance
Investmentgrade
High yield
Figure 24: Globally, corporate credit is starting to flow to higher-quality issuers at “pre-bubble-bursting” rates
Source: Thomson Reuters; Merrill Lynch Global Bond Index (through Bloomberg)
0
10
20
30%
Corporate debt yields
Jan2007
Jan2008
Jan2009
Jan2006
High yieldInvestmentgrade
2005 2006 2007 2008 Q109

The India Private Equity Report 2009: An inflection point for private equity in India
October 2009 | Page 22
Figure 25: Globally, equity markets appear to be on the road to recovery as well
0
50
100
150
200
Stock indices(indexed to 100 as of Jan 31, 2007)
Jan-
07
May-0
7
Sep-
07
Jan-
08
May-0
8
Sep-
08
Jan-
09
May-0
9
Aug-
09
NYSEFTSEDAX
HangSeng
NIFTY
Source: Bloomberg
As global growth began recovering in 2009 and banks resumed lending to one another, PE investors are returning to the marketplace. Several key indicators are restoring confidence, along with easing credit and dropping interest rates. World-wide, GDP growth started rebounding in 2009, with emerging markets continuing to outpace advanced economies. As an indication of banks’ willingness to lend to one another, the spread between the three-month London Interbank Offered Rate (LIBOR) and Treasury bill rates has dropped from its high of 463 basis points in October 2008 to 52 basis points in May 2009. At the same time, corporate debt lending increased to higher quality issuers in the first quarter of 2009.

The India Private Equity Report 2009: An inflection point for private equity in India
October 2009 | Page 23
Figure 26: Globally, PE firms have a significant amount of “dry powder”available
Source: Preqin June 2009 Spotlight newsletter
0
250
500
750
1,000
$1,250B
Committed, uncalled PE capital
Dec2003
406
Dec2004
410
Dec2005
564
Dec2006
806
Dec2007
1,005
Sep2008
1,093
Jun2009
Venture
Realestate
Buyout
Othertypes
1,079
527 578 685 872 1,176 1,478Unrealizedportfolio value($B at midyear)
Mezzanine
Distressed
By early 2009, stock exchanges around the world also started recovering, showing a steady climb back from historic lows. India and China’s equity markets showed the strongest gains, reinforcing their position as highly attractive markets for investors. By September 2009, the Dow Jones Industrial Average had regained its losses for the year and approached 9,800. After sitting on sidelines through the global credit crunch, private equity firms have stockpiled a significant amount of dry powder. As investing picks up, pent-up investor demand is expected to intensify competition for the best deals. a) The short- and medium-term view Despite reassuring signs that global markets are on the road to recovery, the financial meltdown has altered the private equity landscape. In the short term, private equity investors may face a very challenging marketplace. Leveraged deals, the industry’s bread and butter, are unlikely to return soon in any significant numbers or size. Many have been surprised by the lack of deals emanating from corporations seeking urgent cash and banks looking for new owners for repossessed companies. The equity markets’ appetite for rights issues coupled with banks’ reluctance to take the keys explain much of the shortfall. The short supply of larger deals is driving some funds to drift away from their original strategy and focus instead on debt deals, distressed deals and private investment in public equity. Some are in intense discussions with their limited partners about retiring funds and re-cutting incentives. The delays in fundraising are causing some firms to trim staff to match reduced-fee income. The medium-term outlook is much brighter. Credit will return eventually, and there will likely be a period of auspicious deals as the market recovers. What will emerge is a more sophisticated and mature private equity industry. Expect limited partners to demand tighter fund documentation and even greater alignment on economics. Most limited partners will
The India Private Equity Report 2009: An inflection point for private equity in India
October 2009 | Page 24
be much more sophisticated in the way they scrutinise firms’ capabilities when it comes to the trinity of educated risk taking, adding value after the deal and retooling executive engagement. In response, private equity firms are investing in their teams, strategies, networks and skills. The larger private equity firms will likely create more (smaller) funds so that investors can select among asset classes, sectors and regions. With maturity, the global industry’s returns will likely narrow. Stiff competition and a reduction in froth will take out the high notes. But a more experienced industry will make fewer mistakes, weaker players will go away and the barriers to entry will grow. Unless there is a sudden rush of new money into private equity, the future holds a period of more consistent returns for more demanding investors. VI. Asia outlook
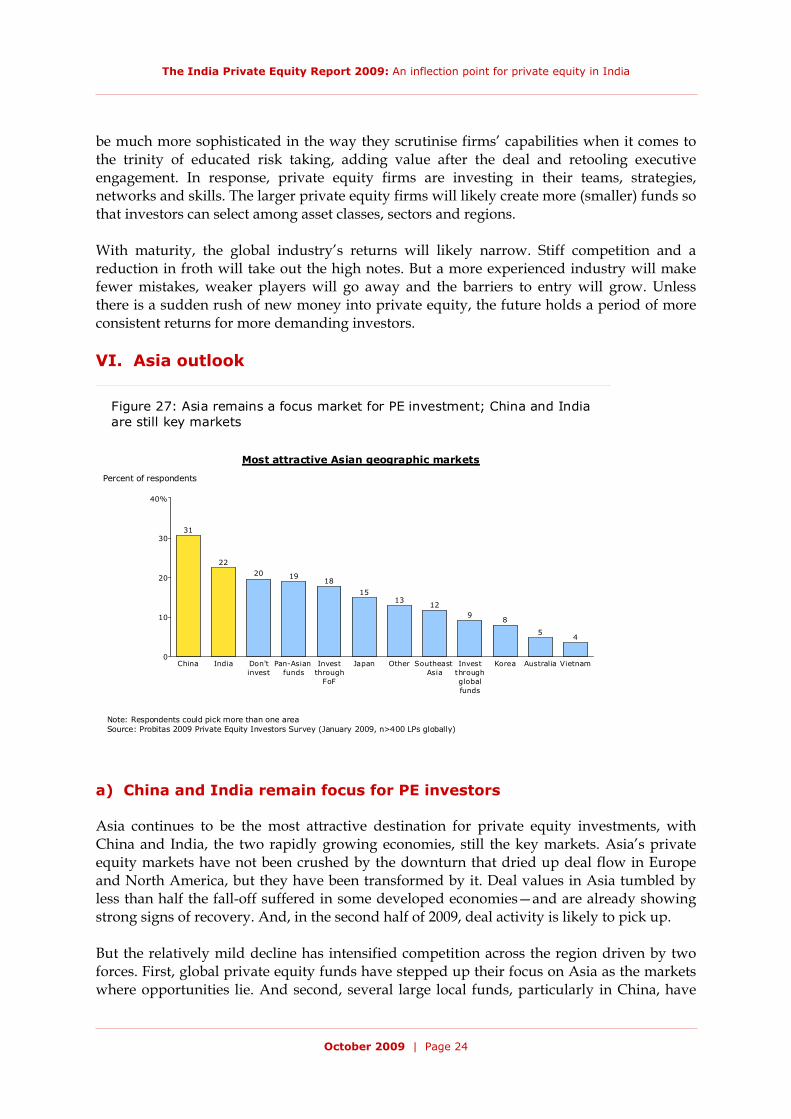
Figure 27: Asia remains a focus market for PE investment; China and India are still key markets
0
10
20
30
40%
Percent of respondents
China
31
India
22
Don'tinvest
20
Pan-Asianfunds
19
Investthrough
FoF
18
Japan
15
Other
13
SoutheastAsia
12
Investthroughglobalfunds
9
Korea
8
Australia
5
Vietnam
4
Most attractive Asian geographic markets
Note: Respondents could pick more than one areaSource: Probitas 2009 Private Equity Investors Survey (January 2009, n>400 LPs globally)
a) China and India remain focus for PE investors Asia continues to be the most attractive destination for private equity investments, with China and India, the two rapidly growing economies, still the key markets. Asia’s private equity markets have not been crushed by the downturn that dried up deal flow in Europe and North America, but they have been transformed by it. Deal values in Asia tumbled by less than half the fall-off suffered in some developed economies—and are already showing strong signs of recovery. And, in the second half of 2009, deal activity is likely to pick up. But the relatively mild decline has intensified competition across the region driven by two forces. First, global private equity funds have stepped up their focus on Asia as the markets where opportunities lie. And second, several large local funds, particularly in China, have

The India Private Equity Report 2009: An inflection point for private equity in India
October 2009 | Page 25
joined the competitive fray. Over the past year, 189 new funds emerged wielding $40 billion in capital to invest. VII. A closer look at China, Southeast Asia and India a) Greater China: Making the most of government stimulus
Figure 28: Market outlook for Greater China
Greater China
• Will see slower deal activity in immediate term- Buy-sell price gap still exists but closing- General uncertainty of earning outlook and economic environment- Stronger focus on portfolios
• Second half of 2009 and 2010 likely to be good periods for new investment- Growth capital still needed in the economy- Lots of PE capital available- Alternate sources of capital are scarce- Public-to-privates- Cross border- Debt crisis less of an issue for China given most deals are growth capital
• Exits will be difficult for next 12 months but hopefully coming back after 2010
• Portfolio activity increasing- “New” way of thinking about portfolio involvement
China’s rapid economic rebound is credited with helping to pull the rest of the world out of the global recession. But private equity investing in China (including Hong Kong) may take longer to recover. In the short term, deal making will remain slow due to several factors. A price gap between buyers and sellers still makes it harder to close deals, although the gap is shrinking. And investors are uncertain if China’s economic rebound will hold up. Huge infusions of government stimulus funding spurred a return to spending, but it’s unclear how rapidly the economy will continue growing once government stimulus is reduced. Some of these concerns already are easing. New investing in the latter half of 2009 is picking up and should continue into 2010, spurred by a pressing need for growth capital to keep pace with China’s aggressive expansion strategy. There’s no shortage of private equity funds and companies have few other options. As the government privatises more public entities, these new companies need new funding sources. The Chinese government also is encouraging companies to aggressively expand beyond China’s borders. Since most deals involve growth capital, the debt crisis is less of an impediment for investors. While exits will remain difficult over the next 12 months, there should be a rebound by 2011. In the wake of turbulence, investors are adapting to the new private equity landscape by rethinking how they can best support portfolio companies to ensure that they accelerate out of the downturn, stronger than before.

The India Private Equity Report 2009: An inflection point for private equity in India
October 2009 | Page 26
b) Southeast Asia: Stable deal sizes
SE Asia
Figure 29: Market outlook for SE Asia
• PE investments in SE Asia saw a decline in both value and volumein 2008; however, no major impact on average deal size now or going forward
• Marked shift in industry focus from “new economy” to “old economy” industries in 2008, and this is likely to continue- Increase in investments in mining, infrastructure,
manufacturing
• Buyouts will remain dominant in SEA but 2009 - 2010 likely to see increase in PIPE financing
• SWFs and local funds to continue being active in PE space in coming years
• While new fund-raising saw a sharp decline in 2008, capital overhang from prior years will be main source of transactions in2009 - 2010
Like the rest of the world, private equity investments in Southeast Asia—encompassing Singapore, Malaysia, Indonesia, Thailand and Vietnam—declined in 2008, both in value and volume. But the region has bucked the global trend and experienced no major impact on average deal size and none is expected going forward. Amid the downturn in 2008, Southeast Asian investors started shifting their focus from “new economy” to more stable “old economy” industries, such as mining, infrastructure and manufacturing, and this marked shift is likely to continue. Buyouts will continue to dominate deals; however, over the next 18 months, PIPE financing is likely to increase. In coming years, sovereign wealth funds and local funds will remain active in the private equity space. While new fundraising saw a sharp decline in 2008, capital overhang from prior years will be the main source of transactions in 2009–2010.

The India Private Equity Report 2009: An inflection point for private equity in India
October 2009 | Page 27
c) India: An emphasis on later-stage investments
Figure 30: Market outlook for India
India• Market could pick up in the second half of ’09 given demand for PE and greater
optimism about growth
- Indian companies will require external funding to finance projects and growth plans
- Lending from banks is tight due to lender reluctance; borrowers are wary of leverage
• Attractive investment opportunities exist as valuations lower
- Anecdotally, private company valuation expectations are coming down, but there is still a gap between promoter and PE valuations
- Indian companies have committed to expansion projects. Sectors most in need of funds are real estate, infrastructure, healthcare and industrials
- Relatively positive outlook for domestic consumption has led to investment for growth particularly for FMCG companies
• PE funds are focused on the portfolio but given minority stakes, the ability to influence the portfolio is lower than in other markets
India’s private equity industry is rebounding as the impact of global turbulence recedes. As investors become more confident about the country’s future growth, demand for PE funding will increase. Key economic indicators are largely positive, pointing everywhere to signs of recovery. The predicted GDP growth rate of 6 per cent is ahead of every Asian country except China and is higher than growth projections for North America and Europe.
Figure 31: In India, corporate debt and equity off-take is beginning to pick up
0
2
4
6
8
Draft filings with SEBI
Apr-0
8
6
May-0
8
4
Jun-
08
5
Jul-0
8
3
Aug-0
8
7
Sep-08
4
Oct-0
8
7
Nov-0
8
1
Dec-0
8
2
Jan-09
2
Feb-
09
Mar-0
9
1
Apr-0
9
2
May-09
Jun-
09
Jul-0
9
3
Aug-
09
5
Corporate credit starting to rise again
Source: CMIE, Bloomberg, SEBI
Filings with SEBI could indicate a more positive outlook towards equity off-take
0 0 0
0
100
200
300
400
500
Corporate bond issuance(Rs. B)
07Q1
193
07Q2
181
07Q3
220
07Q4
176
08Q1
275
08Q2
143
08Q3
279
08Q4
321
09Q1
402
09Q2
315
09Q3
(YTD
)
292
The India Private Equity Report 2009: An inflection point for private equity in India
October 2009 | Page 28
Manufacturing output increased for the third consecutive month until June—contributing to a 4.3 per cent increase for April–July period over the same period in 2008. Advance tax collections for the second quarter of the 2009–2010 fiscal year have shown robust growth of 35–40 per cent across industries, reinforcing hopes of a sooner-than-expected recovery. Corporate credit is flowing again and most stock indices have returned to pre-September 2008 levels. An increase in companies filing to go public is another sign that they are more optimistic about their growth opportunities. To finance that growth, India’s companies will need private equity partners, which are sitting on considerable reserves of dry powder. Growth capital will continue to dominate deals across all sectors. However, in a country that’s racing to modernise and expand its ports, highways, trains, airports and high-tech networks to keep pace with its aggressive expansion, certain sectors are poised for significant growth. As we mentioned, the biggest investment opportunities are in infrastructure, real estate, healthcare and industrials. India’s rising middle class and critical mass of young, educated workers are giving birth to a new age of consumerism. While access to global markets and funding for acquisitions will drive some deals, corporate governance still is a major reason that companies seek private equity partnerships; companies preparing for listing recognise the need to team with expert managers. Going forward, expect a continuing emphasis on later-stage deals and perhaps bigger deals. The challenge for well-financed funds boils down to this simple, but often difficult equation: Finding the right companies at the right valuations that recognise the value of private equity partnerships. But funds that succeed in identifying and funding those promising companies will be positioned to make the most of the future. They’ll be the private equity firms that both nurture and profit from India’s rising fortunes.
This report was prepared by Srivatsan Rajan, a Partner in Bain & Company’s New Delhi office, and Prashant Sarin, a Manager in the same office, in association with the Indian Venture Capital Association (IVCA). The authors would like to especially thank Saurabh Srivastava, Chairman of IVCA, and Mahendra Swarup, President of IVCA, for their continuous support and advice. A special thanks to Bain India’s Suraj Saharan, Prateek Majumdar, Arvind Chandrasekhar, Rachana Kedilaya, Akash Bhargava, Ramit Kakkar and Surobhi Das for their work on the report. The authors would like to acknowledge the help of Ashley Menezes, CFO and Managing Director of ChrysCapital, who conducted a peer review of the report.

The India Private Equity Report 2009: An inflection point for private equity in India
October 2009 | Page 29
VIII. About Indian Venture Capital Association Indian Venture Capital and Private Equity Association (IVCA) is the oldest, most influential and largest member-based national organisation of its kind. It represents venture capital and private equity firms, promotes the industry within India and throughout the world and encourages investment in high-growth companies. It seeks to create a more favourable environment for equity investment and entrepreneurship, representing the industry to governmental bodies and public authorities. IVCA members include leading venture capital and private equity firms, institutional investors, banks, incubators, angel groups, corporate advisers, accountants, lawyers, government bodies, academic institutions and other service providers to the venture capital and private equity industry. These firms provide capital for seed ventures, early-stage companies, later-stage expansion and growth finance for management buyouts/buy-ins of established companies. IVCA’s purpose is to support the examination and discussion of management and investment issues in private equity and venture capital in India. It aims to support entrepreneurial activity and innovation as well as the development and maintenance of a private equity and venture capital industry that provides equity finance. It helps establish high standards of ethics, business conduct and professional competence. IVCA also serves as a powerful platform for investment funds to interact with each other. The Association stimulates the promotion, research and analysis of private equity and venture capital in India, and facilitates contact with policy-makers, research institutions, universities, trade associations and other relevant organisations. IVCA collects, circulates and disseminates commercial statistics and information related to the venture capital industry. It also encourages the formation, development and use of equity markets and funding structures appropriate to the needs of private equity and venture capital investors and investees. IVCA organises symposia and seminars directly related to its purpose as well as training seminars and courses for private equity and venture capital industry practitioners. It publishes newspapers, periodicals, books and leaflets to promote its objects. IVCA has established a partnership with the European Venture Capital Association (EVCA), founded in 1987 and focused exclusively on the professional development of investment professionals. Indian Venture Capital Association 301-302, Delhi Blue Apartments Main Ring Road, Near Safdarjung Hospital New Delhi - 110 029 INDIA Tel: + 91 11 41628566, Email: [email protected]

The India Private Equity Report 2009: An inflection point for private equity in India
October 2009 | Page 30
IX. About Bain & Company’s private equity business Bain & Company has emerged as a leader committed to helping private equity firms grow. At Bain & Company, private equity consulting has grown twelve-fold since 1997 and now represents 25 per cent of the firm’s global business. Our partners include a global network of more than 400 experienced professionals serving private equity clients in due diligence and post-acquisition performance improvement. In the past decade, Bain & Company has advised on more than half of all transactions valued at more than $500 million. Our work with LBO funds represents 70 per cent of equity capital—we are three times larger than the next largest firm serving LBO funds. We have deep experience working with private equity clients in Asia across all major sectors—everything from consumer products and financial services to automotive and telecom. We support a range of objectives for our private equity clients: Deal generation—We help private equity funds develop the right investment thesis and augment deal flow, profiling industries, screening targets and devising a plan to approach targets. Due diligence—We help funds make better deal decisions by performing diligence, assessing performance improvement opportunities and providing post-acquisition agenda. Immediate post-acquisition—We support the drive for rapid returns by developing a strategic blueprint for the acquired company, leading workshops aimed at aligning management with strategic priorities and directing focused initiatives. Ongoing value addition—We help increase company value by supporting most leveraged efforts in such areas as revenue enhancement and cost reduction, and by refreshing strategy. Exit—We help ensure funds exit deals with a maximum return by preparing for exits, identifying the optimal exit strategy, preparing the selling documents and pre-qualifying buyers. Bain & Company India, Inc. 5th Floor, Building 8, Tower A DLF Cyber City, Phase II Gurgaon, Haryana, 122 002 India Tel: 91 124 454 1800