The India Internet Trading Weekly with independent · PDF filenotes for either the Sensex or...
23
November 12, 2008 1 A publication of Guppytraders.com Pty Ltd since 1996 ACN 089941560 Offices and staff in Darwin, Singapore, Beijing, Kuala Lumpur. Ph +61 8 89270061 Fax + 61 8 89270125 Box 40043 Casuarina NT Australia 0811 www.guppytraders.com. Email [email protected] The India Internet Trading Weekly with independent analysis Weekly for Wednesday November 12, 2008 Based on Monday’s Close 23 pages Edited by Daryl Guppy Guppy Trading Essentials Chart pak, Metastock ,. Data from JustData, Almax & theNextView. CONTENTS India Index Briefs – SENSEX pg1 India Chart Briefs pg3 Depression Triggers pg7 Volume Manipulation pg11 Market Exam 6 pg14 Metal Briefs – Copper, Shanghai pg22 INDIA INDEX BRIEFS – SENSEX By Daryl Guppy The rebound from the target levels set by the head and shoulder pattern target support near 7700 has consolidated near the historical support level of 10000. Head and shoulder patterns set minimum downside targets. Downside targets in world markets have been exceeded dramatically. The fall to 770 is not a dramatic fall below the head and shoulder pattern target so this suggests there is room for further downside. There is a high probability of continued consolidation within the trading band located between 7700 and 8600. Historically both of these levels are relatively weak. They did not provide strong support or resistance when the market rose in 2005. However, their location near the downside targets for the head and shoulder patterns suggests they can provide a stronger support band in the current market fall. Failure to hold support at 7500 sets a downside target near 6000. It should be noted that this is a relatively weak support level. Any rebound and rally activity will be limited by the upper level of the current trading band near 8600. Resistance near 10000 will provide a major future barrier resistance level. Rebounds above 10000 are unreliable. SUBJECT SUMMARY INDEX NOTES Each week we carry index analysis notes for either the Sensex or the Nifty 50. The objective of the notes is to provide an analytical technical background to assist readers in making better trading and investment decisions.
Transcript of The India Internet Trading Weekly with independent · PDF filenotes for either the Sensex or...

November 12, 2008 1
A publication of Guppytraders.com Pty Ltd since 1996 ACN 089941560
Offices and staff in Darwin, Singapore, Beijing, Kuala Lumpur. Ph +61 8 89270061 Fax + 61 8 89270125 Box 40043 Casuarina NT Australia 0811 www.guppytraders.com. Email [email protected]
The India Internet Trading Weekly with independent analysis
Weekly for Wednesday November 12, 2008 Based on Monday’s Close 23 pages Edited by Daryl Guppy
Guppy Trading Essentials Chart pak, Metastock ,. Data from JustData, Almax & theNextView.
CONTENTS • India Index Briefs – SENSEX pg1• India Chart Briefs pg3• Depression Triggers pg7• Volume Manipulation pg11• Market Exam 6 pg14• Metal Briefs – Copper, Shanghai pg22
INDIA INDEX BRIEFS – SENSEX By Daryl Guppy
The rebound from the target levels set by the
head and shoulder pattern target support near 7700 has consolidated near the historical support level of 10000. Head and shoulder patterns set minimum downside targets. Downside targets in world markets have been exceeded dramatically. The fall to 770 is not a dramatic fall below the head and shoulder pattern target so this suggests there is
room for further downside. There is a high probability of continued consolidation within the trading band located between
7700 and 8600. Historically both of these levels are relatively weak. They did not provide strong support or
resistance when the market rose in 2005. However, their location near the downside targets for the head and shoulder patterns suggests they can provide a stronger support band in the current market fall.
Failure to hold support at 7500 sets a downside target near 6000. It should be noted that this
is a relatively weak support level. Any rebound and rally activity will be limited by the upper level of the current trading band near 8600. Resistance near 10000 will provide a major future barrier resistance level. Rebounds above 10000 are unreliable.
SUBJECT SUMMARYINDEX NOTES
Each week we carry index analysis notes for either the Sensex or the Nifty 50. The objective of the notes is to provide an analytical technical background to assist readers in making better trading and investment decisions.

November 12, 2008 2
NEW GUPPY TRADING DVD Thieves, highwaymen, robbers, bandits, pickpockets.
Throughout history there have always been people willing to take what someone else’s hard work has earned. As long as there have been thieves there have been ways to defend against them. The market is no different. Volatility is the new thief, and Daryl Guppy’s new GMMA Trend Volatility Management DVD is the security system breakthrough.
By using trend volatility instead of price volatility to determine stop loss levels, traders are able to avoid falling victim to the volatility sleight of hand and being shaken out of the market, losing hard earned profits.
Learn how to apply the Trend Volatility Line (GMMA TVL) and the Hope, Confidence Certainty (HCC) method to manage trend risk. Learn how to improve entry techniques and develop profitable multi-day trades in volatile markets.
With over two hours running time complete with animations and graphics, this sets a new standard for trading DVD’s. You won’t fall asleep watching this one.
BUY NOW AT http://www.guppytraders.com/gup350.htm
November 12, 2008 3
INDIA CHART BRIEFSBy Daryl Guppy
BHEL
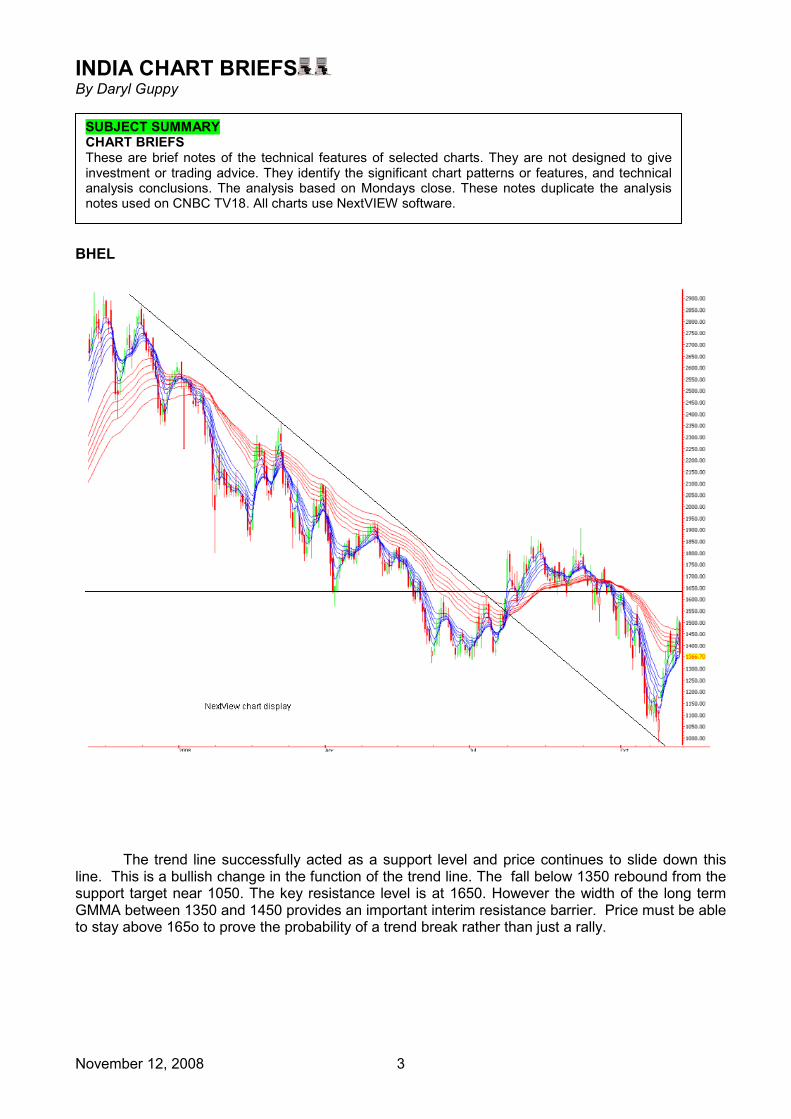
The trend line successfully acted as a support level and price continues to slide down this line. This is a bullish change in the function of the trend line. The fall below 1350 rebound from the support target near 1050. The key resistance level is at 1650. However the width of the long term GMMA between 1350 and 1450 provides an important interim resistance barrier. Price must be able to stay above 165o to prove the probability of a trend break rather than just a rally.
SUBJECT SUMMARYCHART BRIEFS These are brief notes of the technical features of selected charts. They are not designed to give investment or trading advice. They identify the significant chart patterns or features, and technical analysis conclusions. The analysis based on Mondays close. These notes duplicate the analysis notes used on CNBC TV18. All charts use NextVIEW software.
November 12, 2008 4
ACC
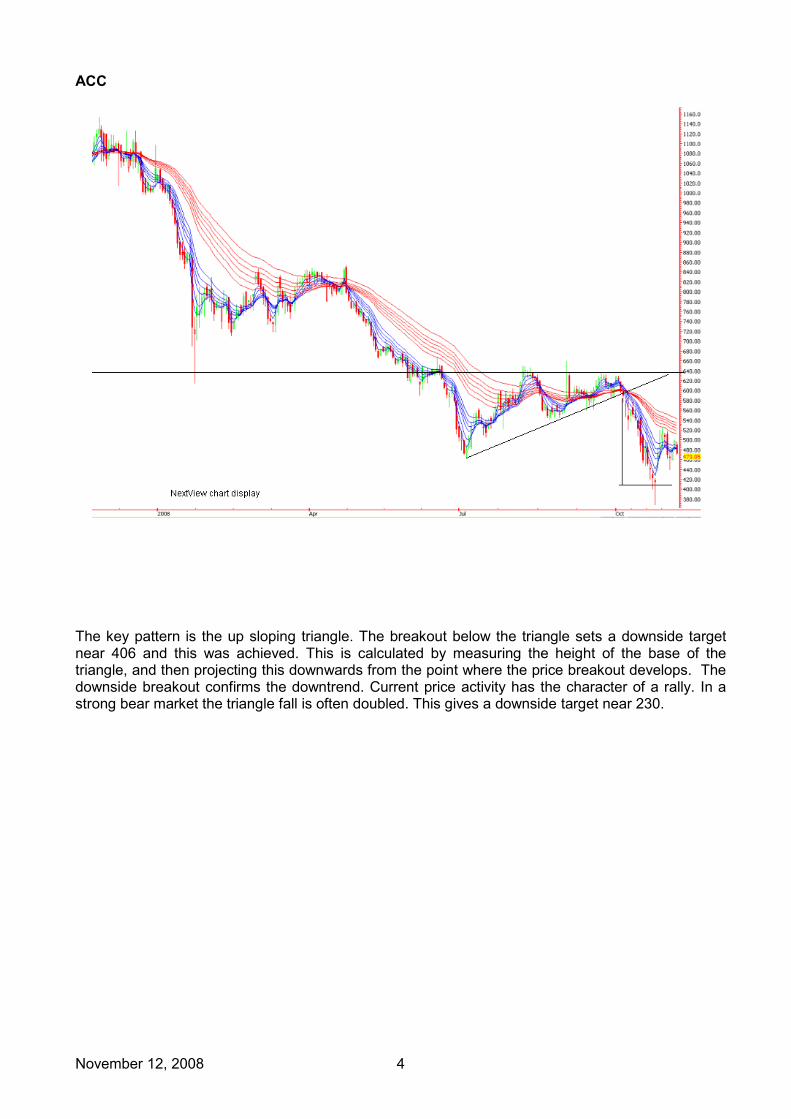
The key pattern is the up sloping triangle. The breakout below the triangle sets a downside target near 406 and this was achieved. This is calculated by measuring the height of the base of the triangle, and then projecting this downwards from the point where the price breakout develops. The downside breakout confirms the downtrend. Current price activity has the character of a rally. In a strong bear market the triangle fall is often doubled. This gives a downside target near 230.

November 12, 2008 5
INFOSYS
The failure of support at 1300 support set a downside target near 1100 which was achieved. Upside is limited by resistance near 1500 and this is above the upper level of the width of the long term GMMA. Support at 1300 is a mid-point consolidation area. It has not offered effective support. Price must move above and stay above the upper edge of the long term GMMA before a genuine trend change is established. Spike retests of support at 1100 remain a good probability.

November 12, 2008 6
RELIANCE
The retreat from resistance near 2100 and 1800 was expected and the next downside target support near 1300 was achieved. The drop to 950 is a move towards technical support near 800. The retreat from the long term GMMA suggests the 800 support target will be tested. The rally resistance from current levels is near 1600 and set by the value of the long term GMMA. This is a strong downtrend with a low probability of a trend recovery. The resistance features are substantial. Look for consolidation between 800 and 1300. If consolidation fails to develop it signals significant downside risk.

November 12, 2008 7
DEPRESSION TRIGGERS By Daryl Guppy
The key question facing markets is the difference between recession and depression. The market is hovering near significant support levels. The closest of these we have called recession support targets. The lowest of these we have called depression targets. Many analysts have compared this situation to the market collapse in 1929. This week we look at the charts from the 1929 period. In particular we look at the similarity of behaviour.
The first chart shows how we anticipate this market may develop a recovery and failure pattern that leads in to a depression scenario.
SUBJECT SUMMARYRECESSION AND DEPRESSION A recession as an economic slowdown that may last for 6 to 18 months. A depression is an economic pullback that may last from 2 to 4 years. In both cases the market moves in anticipation of the event. The market fall develops before the fundamental signs of a recession or depression become evident. The market leads the confirmation of conditions. The market also leads the recovery. In a recession the market will develop strong trending behaviour many months prior to the official confirmation of the end of a recession. This recovery provides trend trading opportunities. In a depression the market will develop a long term consolidation pattern. This is an investment period and lays the foundations for generational fortunes. Trend trading opportunities do not develop for several years. This consolidation and accumulation phase concentrates on creating income flow from dividends. The fundamental end of a depression is not recognised until many months after the market has already reacted.

November 12, 2008 8
The second chart is the weekly DOW for 1929 through to 1930. The significant features are these:
• The rapid fall is followed by a rebound and rebound failure. • The primary rebound failure occurs rapidly with another market collapse. • The pile driver low is retested with 12 months • Support, defined by the pile driver low, is not successful
The pink circle shows the comparable position of today’s market. This remains a period of high volatility but the market reduces volatility and moves into a more clearly defined trending behaviour. This pattern of behaviour suggests that a rebound from the current support levels may persist for around 20 weeks. The important feature is the rapid failure of the trend line followed by a rapid failure of the pile driver low support level. This failure is made more severe because the pile drover low support does not equal any previous historical support level.
November 12, 2008 9
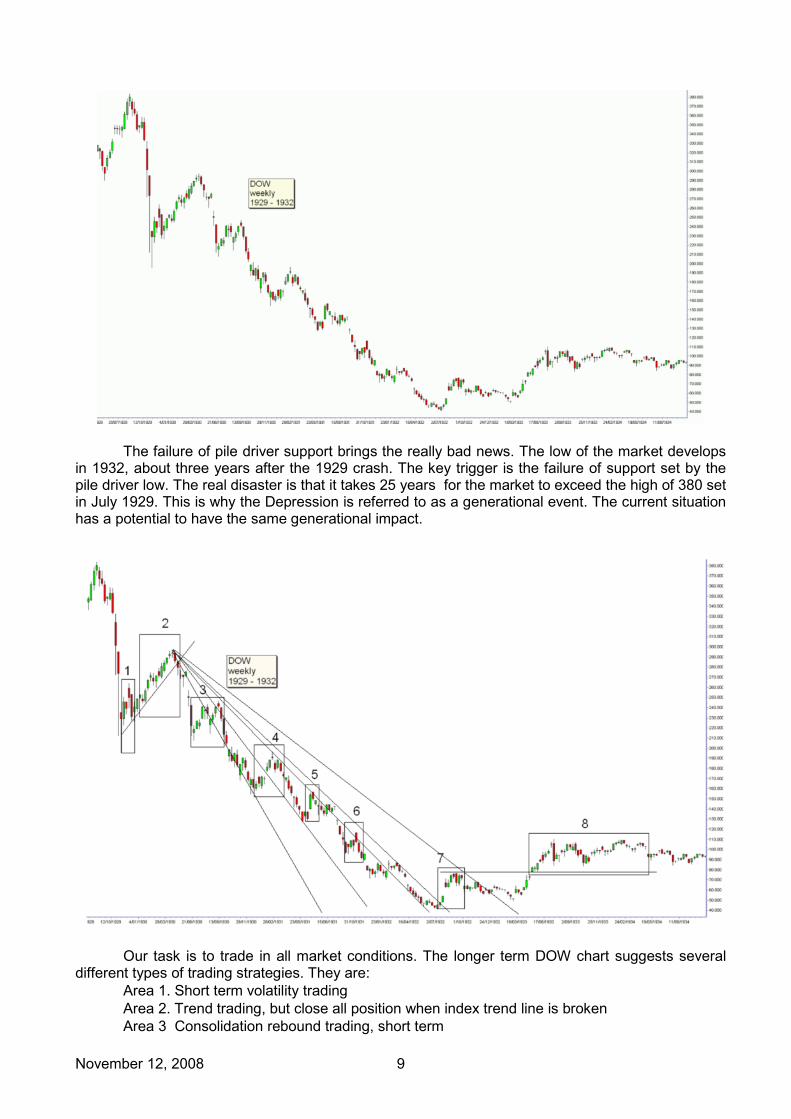
The failure of pile driver support brings the really bad news. The low of the market develops in 1932, about three years after the 1929 crash. The key trigger is the failure of support set by the pile driver low. The real disaster is that it takes 25 years for the market to exceed the high of 380 set in July 1929. This is why the Depression is referred to as a generational event. The current situation has a potential to have the same generational impact.
Our task is to trade in all market conditions. The longer term DOW chart suggests several different types of trading strategies. They are:
• Area 1. Short term volatility trading • Area 2. Trend trading, but close all position when index trend line is broken • Area 3 Consolidation rebound trading, short term
November 12, 2008 10
• Area 4, 5, 6, 7 Rally trading within the context of the developing fan trend line pattern. • Area 8 Investment for long term recovery. The trigger is when the market moves higher than
the previous rally peak in area 7. This is the most important trend reversal signal. Of course the market can be successfully traded from the short side throughout this period. It can also be traded from the long side. American master trader Jessie Livermore developed his trading skills through this long term Depression period. Note that the fan trend line is a long term reversal pattern. It is not a Gann fan line. The fan trend line captures the way resistance levels become support levels. This fan line pattern and rebound support behaviour is developing in the Shanghai market.
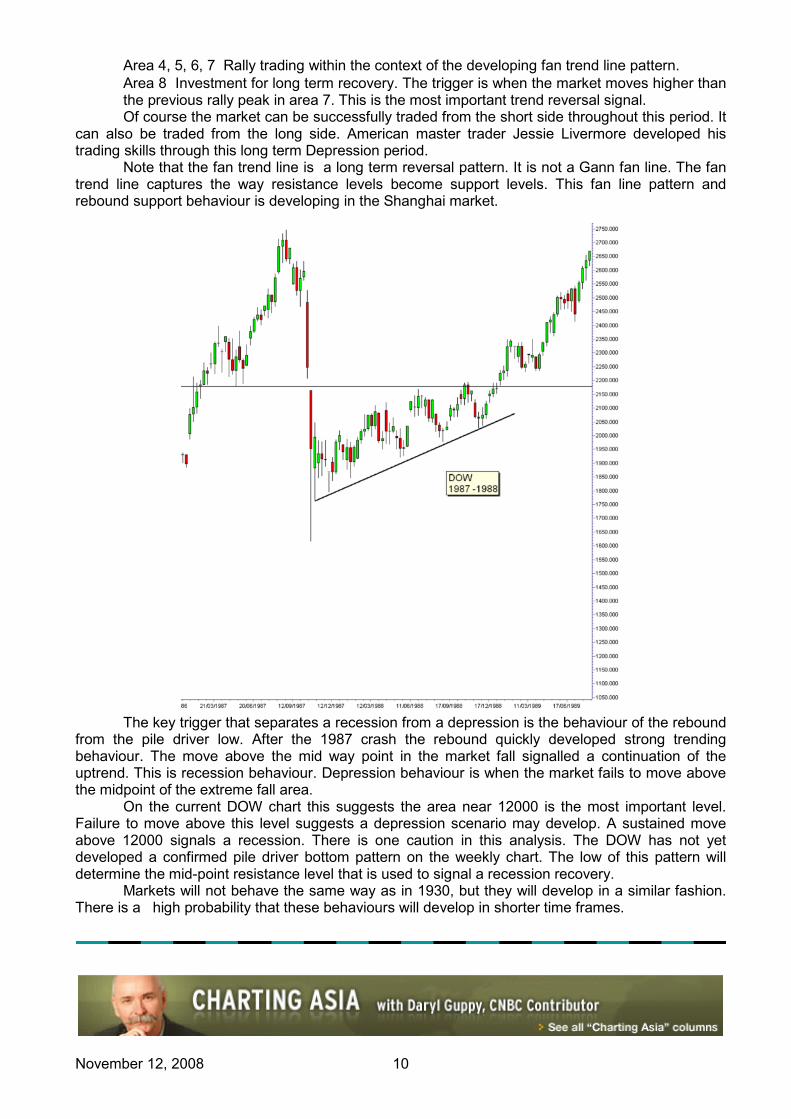
The key trigger that separates a recession from a depression is the behaviour of the rebound from the pile driver low. After the 1987 crash the rebound quickly developed strong trending behaviour. The move above the mid way point in the market fall signalled a continuation of the uptrend. This is recession behaviour. Depression behaviour is when the market fails to move above the midpoint of the extreme fall area. On the current DOW chart this suggests the area near 12000 is the most important level. Failure to move above this level suggests a depression scenario may develop. A sustained move above 12000 signals a recession. There is one caution in this analysis. The DOW has not yet developed a confirmed pile driver bottom pattern on the weekly chart. The low of this pattern will determine the mid-point resistance level that is used to signal a recession recovery. Markets will not behave the same way as in 1930, but they will develop in a similar fashion. There is a high probability that these behaviours will develop in shorter time frames.

November 12, 2008 11
VOLUME MANIPULATION By Daryl Guppy
Volume is particularly significant in short term
trading. The price and volume relationships provide a guide to the type of buying or selling activity that is developing. There are four types of activity.
The first is a type of share manipulation. This is often called a pump and dump scheme in American markets. The manipulator buys a significant volume of shares. Others see the price movement and join the rally. The manipulator then sells to these new buyers and captures a quick profit. The price is ‘pumped up’ and then the shares are ‘dumped’ or sold to unsuspecting buyers.
The second is the volume activity associated with the development of a genuine rally that may last for 5 to 10 days.
The third type of activity is genuine accumulation. This is an investment trend. This occurs when buyers come into the market with the intention of building an investment position. Their buying leads to the development of a steady uptrend.
The fourth type is a news event rally. A leading indication of this is a rise in volume that does not show a
rise in price. This suggests people are buying in a anticipation of the news. There may be rumours in the market. When the news is released the price and volume rise very quickly. This is a short term trade opportunity, so the trade is closed as soon as momentum declines. This may be 1 or 2 days after the news announcement.
PRICE MANIPULATION
SUBJECT SUMMARYVOLUME Volume is the fuel driving the market. It is usually shown as a histogram, with solid bars. Volume charts yield clues when volume is out of character. Unusually high, or unusually low. High volume on a lower close indicates selling pressure - people want to get out and nobody is eager to buy so the price falls. High volume on a higher close indicates buying pressure - people want to get in, but nobody will sell so they have to bid higher. Volume becomes erratic as the liquidity of the stock falls. Large blue chips have high liquidity - there are large scale trades every day. A small speculative stock has low liquidity - there are sometimes no trades for days on end. Volume significance depends on the normal liquidity of the stock.

November 12, 2008 12
Recognition rules • Stock has a history of very low trading volume • Volume suddenly increases dramatically and is often associated with just a few
trades during the day. • Price increases by 10% or more • Very fast price rise is associated with very high volume • There is no news event that might explain the price rise • Gap up activity is often followed the next day by a fall in price.
Trading rules • Buy when the price begins to increase on day 1. Use intraday charts to identify
opportunity. • Sell on day 2 or day 3 of the price move.
RALLY
Recognition rules
• Stock has a history of good trading volume with well defined rises and falls • Volume increases for several days • Price moves slowly, and then accelerates. This is defined with a parabolic trend, or a
trend line • Volume increases as the price begins to move more quickly
Trading rules • Enter when price rebounds from the trend line • Use resistance targets as exit points • Watch momentum and volume decline
INVESTMENT
Recognition rules • Volume increases slowly. This is steady, consistent buying • Buying volume is larger than selling volume • Price moves in a consolidation band • Price rise is slow. • The new trend is defined with a trend line and there are many successful tests of the
trend line • Volume remains steady when the price falls. This shows investors are buyers.
Confirm this with the GMMA indicator.

November 12, 2008 13
Trading rules • Buy as price rebounds from the lower edge of the consolidation area • When trend is defined with a trend line, buy when price rebounds from the trend line • Use the lower edge of the long term GMMA as a stop loss • Enter when price moves above the downtrend line • Add to position when GMMA crossover develops • Add to position after the first successful test of the long term GMMA support after the
GMMA crossover.
NEWS EVENT RALLY

November 12, 2008 14
Recognition rules • Volume increases before the news announcement, but price does not rise • Volume increases on the day of the news event • Price accelerates quickly. This is a momentum rise
Trading rules • Enter when price reacts to the news release • Use resistance targets as exit points • Sell 1 or 2 days after the news announcement when momentum declines
Recognising the correct price and volume relationship allows traders to make a better decision about the best trading or investment approach to use for the trade.
Be on the look out for Daryl Guppy on CNBC Squawk Box Wednesday Nov 19 from 7-10am and CNBC TV18 at 1pm Mumbai.
MARKET EXAM 6 By Daryl Guppy
In challenging markets it is a good
time to think about the foundations of our trading approaches. This is the sixth instalment of ‘revision’ questions to help this process of rebuilding trading plans and approaches. Each week we will provide a list of 10 new multiple choice questions. We will also provide the answers to the previous weeks questions. There are 100 questions. We will not be providing an introduction lesson for the questions. The questions based on moving average analysis will not follow an article on moving averages. The intention is to test your existing knowledge of ideas, concepts and methods relevant to trading. You may find some gaps caused by forgetfulness, or by simple lack of knowledge. This discovery is
useful because it provides a focus for areas of additional research. Answers to last weeks questions are below. Answers to this weeks questions, and a new set of questions, appear next week. REVISION QUESTIONS 51-60 51) Which is the correctly plotted upside target for the triangle?
1. Line 1 2. Line 2
52) Which is the correctly plotted down side target for the triangle? 1. Line 3
SUBJECT SUMMARYMARKET EXAM Every day and in every trade, the market gives us an examination. The results are unforgiving. Get the examination question correct and the market gives you money. Het the examination question incorrect and the market takes money from you. Every trading decision to buy, or sell, or just observe is a test of all the skills and knowledge and experience you have accumulated. Unlike on-the-job training, the market gives you no latitude for error, for past successes, or experience. Every test is for real, and every test pass or fail carries the same consequences. It is a demanding task. Over ten weeks we give you a less demanding test – at least in terms of consequences. These questions are designed to help you to evaluate your knowledge about trading and help to identify areas where you may needs to do some more homework.

November 12, 2008 15
2. Line 4
53) Select the IPO chart with the correct entry signal. Use a volatility indicator calculation.
1. Chart 1 2. Chart 2 3. Chart 3
November 12, 2008 16
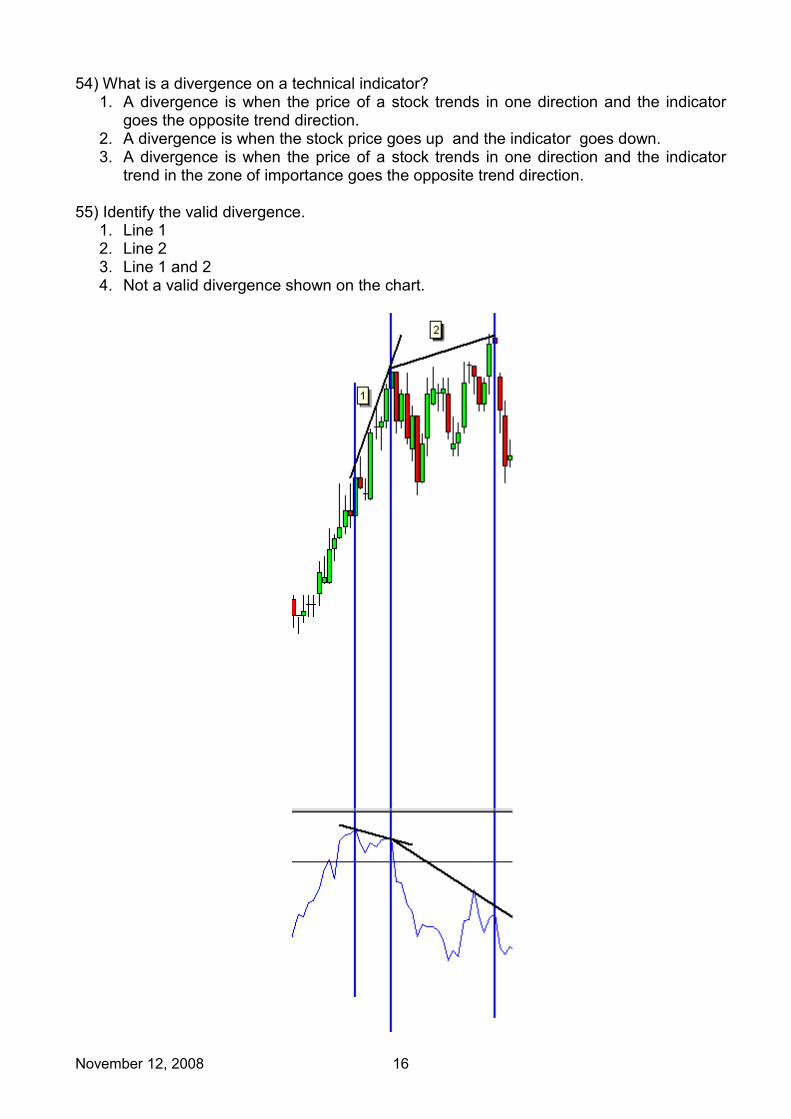
54) What is a divergence on a technical indicator? 1. A divergence is when the price of a stock trends in one direction and the indicator
goes the opposite trend direction. 2. A divergence is when the stock price goes up and the indicator goes down. 3. A divergence is when the price of a stock trends in one direction and the indicator
trend in the zone of importance goes the opposite trend direction. 55) Identify the valid divergence.
1. Line 1 2. Line 2 3. Line 1 and 2 4. Not a valid divergence shown on the chart.

November 12, 2008 17
56) Where is the pivot point low? 1. Point 1 2. Point 2 3. Point 3 4. Point 4
November 12, 2008 18
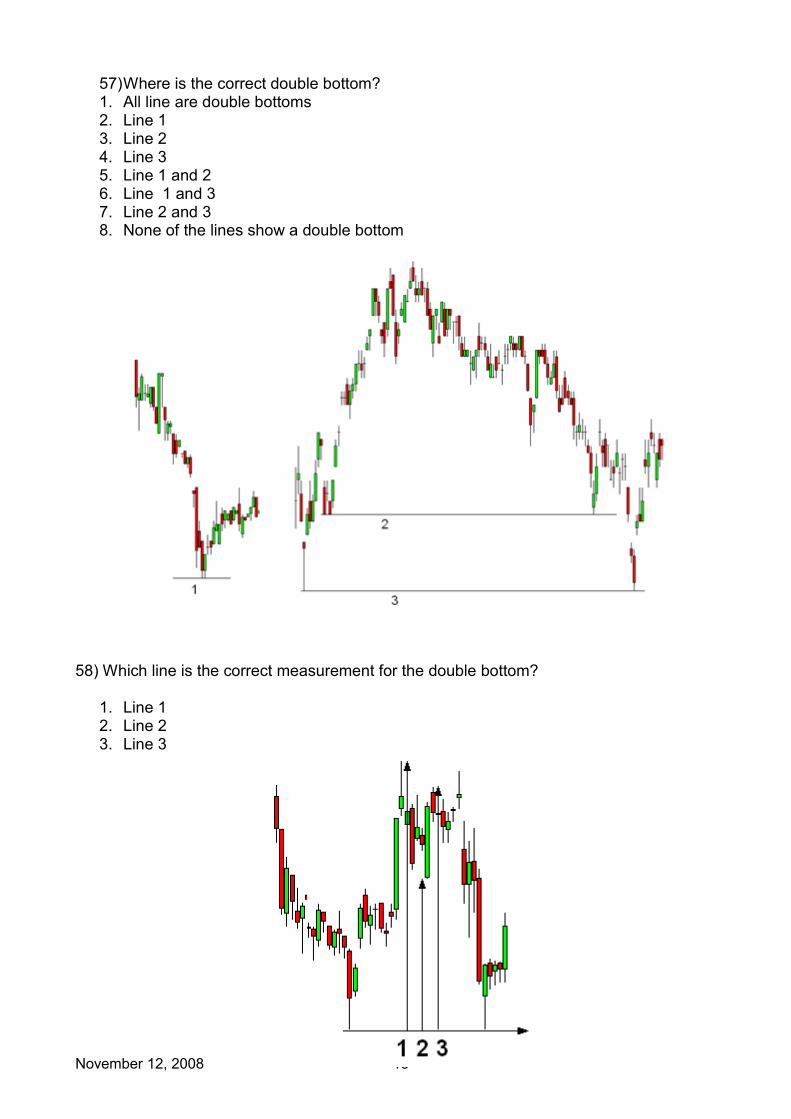
57) Where is the correct double bottom? 1. All line are double bottoms 2. Line 1 3. Line 2 4. Line 3 5. Line 1 and 2 6. Line 1 and 3 7. Line 2 and 3 8. None of the lines show a double bottom
58) Which line is the correct measurement for the double bottom?
1. Line 1 2. Line 2 3. Line 3
November 12, 2008 19
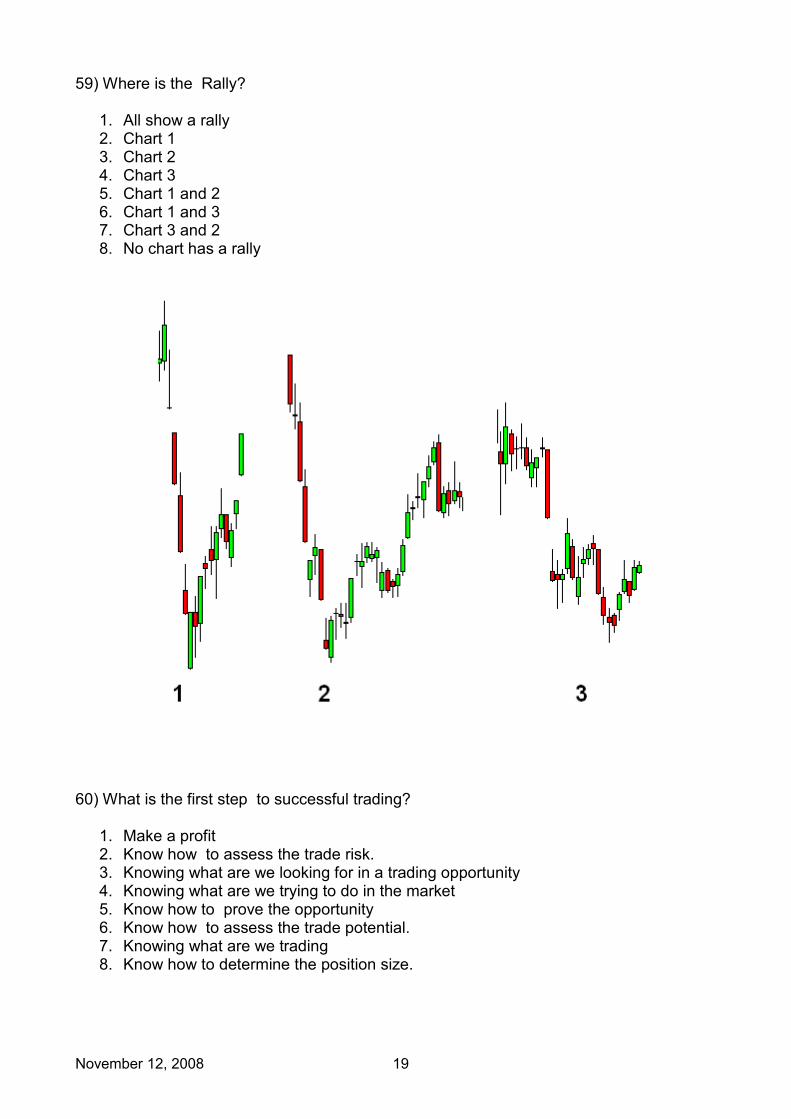
59) Where is the Rally?
1. All show a rally 2. Chart 1 3. Chart 2 4. Chart 3 5. Chart 1 and 2 6. Chart 1 and 3 7. Chart 3 and 2 8. No chart has a rally
60) What is the first step to successful trading?
1. Make a profit 2. Know how to assess the trade risk. 3. Knowing what are we looking for in a trading opportunity 4. Knowing what are we trying to do in the market 5. Know how to prove the opportunity 6. Know how to assess the trade potential. 7. Knowing what are we trading 8. Know how to determine the position size.
November 12, 2008 20
ANSWERS FROM LAST WEEK 41-50 41) What is the theoretical benefit of having stock in different sectors?
1) This gives portfolio diversity and reduces risk. 42) What is the benefit of trading the strongest stock in the strongest sector?
3) There will be a lot of volume, and the stock will move rapidly.
43) What is Systemic Risk? 2) Systemic Risk is the risk the entire market may fall.
44) What is cumulative Risk?
1) Cumulative Risk is where we have more than one open trade, and applying the 2% rule to all our open trades the actual risk to our portfolio increases. If the entire market were to fall this is how much we lose.
45) What is our preferred spread of Portfolio Capital across the three stock types; blue chip, mid cap and volatile?
3) 4/7 blue chip, 2/7 mid cap and 1/7 volatile 46) We should only use money we are prepared to lose when we invest in speculative stocks.
3) No. Every trade should be given close attention and traded as though it’s the only open position we have. We trade to make money.
47) Should we sell better performing stocks to make up for poorer performing stocks?
2) No. We should sell the losing stocks and follow the better performing stocks to their full profit potential.
48) What is the difference between a moving average line and a Linear Regression Line? 3) The Linear Regression Indicator plots a line that is statistically fitted to the price data, one data point at a time, rather than being an average of that set of data.
49) This is a chart of an important bank stock. The fundamental analysis said this bank had a very good future. All the brokerages said this bank had a very good future. Analyze the chart and select the best action.
4) Wait for a clear end to the downtrend and then buy.

November 12, 2008 21
50) Select the chart with cup chart pattern 4) Chart 4
Next week we bring you the answers and a new set of 10 questions. YOUR SCORE CARD Keep this scorecard updated and calculate your performance percentage. Quest
Ans Quest Ans Quest Ans Quest Ans Quest Ans %
1 2 3 4 56 7 8 9 10 11 12 13 14 15 16 17 18 19 20 21 22 23 24 25 26 27 28 29 30 31 32 33 34 35 36 37 38 39 40 41 42 43 44 45 46 47 48 49 50 51 52 53 54 55 56 57 58 59 60 61 62 63 64 65 66 67 68 69 70 71 72 73 74 75 76 77 78 79 80 81 82 83 84 85 86 87 88 89 90 91 92 93 94 95

November 12, 2008 22
96 97 98 99 100 METAL BRIEFS –COPPER, SHANGHAI By Daryl Guppy
Weak support near 31,000. Strong
resistance near 34,000. Significant resistance near 40,000. Look for short term rallies within the context of a well established downtrend. Long term support projection target near 25,000.
SUBJECT SUMMARYMETAL NOTES
Each week we provide Reuters newswires with analysis of metal trading on the London Metals Exchange. Metal price behaviour is a guide to economic strength based on commodity demand. We reprint this analysis for newsletter readers.

November 12, 2008 23
DISCLAIMER AND COPYRIGHT Guppytraders.com (ACN 089 941 560) Pty Ltd is not a licensed investment advisor. This publication, which is generally available to the public, falls under the Financial Media Advice provisions. The information provided is for educational purposes only and does not constitute financial product advice. These analysis notes are based on our experience of applying technical analysis to the market and are designed to be used as a tutorial showing how technical analysis can be applied to a chart example based on recent trading data. This newsletter is a tool to assist you in your personal judgment. It is not designed to replace your Licensed Financial Consultant or your Stockbroker. It has been prepared without regard to any particular person's investment objectives, financial situation and particular needs because readers come from diverse backgrounds, with diverse objectives and financial situations. This information is of a general nature only so you should seek independent advice from your broker or other investment advisors as appropriate before taking any action. The decision to trade and the method of trading is for the reader alone to decide. The author and publisher expressly disclaim all and any liability to any person, whether the purchase of this publication or not, in respect of anything and of the consequences of any thing done or omitted to be done by any such person in reliance, whether whole or partial, upon the whole or any part of the contents of this publication. Neither Guppytraders.com Pty Limited nor its officers, employees and agents, will be liable for any loss or damage incurred by any person directly or indirectly as a result of reliance on the information contained in this publication. The information contained in this newsletter is copyright and for the sole use of trial and prepaid readers. It cannot be circulated to other readers without the permission of the publisher. Each issue now incorporates fingerprint protection that enables us to track the original source of pirate copies. If we find the that you are redistributing the newsletter then, at our discretion, we will reduce the length of your paid subscription by the value of the multiple copies we believe you are circulating. Share with nine friends, and we cut your subscription period by 90%. Contributed material reflects the personal opinion of the authors and are not necessarily those of the publisher. Articles accurately reflect the personal views of the authors. Stocks held by the authors are marked* and are not to be taken as a trading recommendation. This is not a newsletter of stock tips. Case study trades are notional and analysed in real time on a weekly basis. Guppytraders.com does not receive any commission or benefit from the trading activities undertaken by readers, or any benefit or fee from any of the stocks reviewed in the newsletter. Guppytraders.com is an independent international financial education organization and research is supported by subscription fees. Please note that In the interest of timely publication of newsletter, this document may be incompletely proofed. OFFICES; Head Office, 22 Hibernia Crescent, Brinkin, Darwin, Australia, Penthouse Level, Suntec Tower Three, 8 Temasek Boulevard, Singapore, Room B105-A17, No.14, Chaoyangmen Nandajie, Chaoyang District, Beijing, China,Level 36, Menara Citibank, 165 Jalan Ampang, Kuala Lumpur, Malaysia.


![[Trading eBook] Gann, W.D. - New Stock Trend Detector](https://static.fdocuments.us/doc/165x107/55cf9854550346d0339703d6/trading-ebook-gann-wd-new-stock-trend-detector.jpg)