
The Income Situation of Gypsy Families - tarki.hu · 386 Béla Janky Introduction In the current...
20
TÁRKI Social Report Reprint Series No 22. Béla Janky The Income Situation of Gypsy Families Abstract In this study we analyze the income situation of Hungarian Roma (Gypsy) households. Our investigation is based on the third national representative Gypsy Survey and the TÁRKI Household Monitor Survey, both of which carried out in 2003. We want to examine the relative income distribution of Roma families with respect to non-minority Hungarian households living in the same region, or in a similar settlement type. Data from the Gypsy Survey suggest that 65 per cent of the Hungarian Roma people belong to the lowest decile of the Hungarian population, and 80 per cent belong to the lowest quintile. According to our results, two-thirds or four-fifths of the poorest 300 thousand people are Gypsies. We found a positive relationship between the prevalence of absolute and regional level relative poverty among Gypsies. That is, Roma living in the poorer regions of Hungary usually stand lower on the social ladder of their own regions. Keywords: Roma population, Hungary, household income, absolute and relative poverty JEL Classification: Author: BÉLA JANKY is an economist/sociologist, Lecturer at the Department of Sociology and Communication, Budapest University of Technology and Economics. Research interests: living standards of the Roma population, behaviour of economic organizations, preferences in relation to welfare institutions, theory of collective actions. TÁRKI Budapest, 2005
Transcript of The Income Situation of Gypsy Families - tarki.hu · 386 Béla Janky Introduction In the current...

TÁRKI Social Report Reprint Series No 22.
Béla Janky The Income Situation of Gypsy Families
Abstract In this study we analyze the income situation of Hungarian Roma (Gypsy) households. Our investigation is based on the third national representative Gypsy Survey and the TÁRKI Household Monitor Survey, both of which carried out in 2003. We want to examine the relative income distribution of Roma families with respect to non-minority Hungarian households living in the same region, or in a similar settlement type. Data from the Gypsy Survey suggest that 65 per cent of the Hungarian Roma people belong to the lowest decile of the Hungarian population, and 80 per cent belong to the lowest quintile. According to our results, two-thirds or four-fifths of the poorest 300 thousand people are Gypsies. We found a positive relationship between the prevalence of absolute and regional level relative poverty among Gypsies. That is, Roma living in the poorer regions of Hungary usually stand lower on the social ladder of their own regions. Keywords: Roma population, Hungary, household income, absolute and relative poverty JEL Classification: Author:
BÉLA JANKY is an economist/sociologist, Lecturer at the Department of Sociology and Communication, Budapest University of Technology and Economics. Research interests: living standards of the Roma population, behaviour of economic organizations, preferences in relation to welfare institutions, theory of collective actions.
TÁRKI Budapest, 2005

Reprint from Tamás Kolosi, György Vukovich, István György Tóth eds.: Social Report 2004, Budapest: TÁRKI, 2004
pp. 386–399. Please use the book reference for citation.
English translation: Eszter Berán
Published by: TÁRKI Social Research Centre Inc.
P.O. Box 71, H-1518 Budapest, Hungary Tel: +361 309-7676, http://www.tarki.hu
Coordinator: Ildikó Nagy
Language Editor: Clive Liddiard-Maár
All rights reserved, including the right of reproduction in whole or in part in any form.
© TÁRKI, Béla Janky, 2004
The Social Report 2004 was published with the support of the Hungarian Ministry of Health
and the Hungarian Ministry of Youth, Family, Social Affairs and Equal
Opportunities.

386 Béla Janky
Introduction In the current study we would like to discuss the income situation of Hungarian Gypsy households, based on the third national representative Gypsy Survey conducted in 2003, and the Household Monitor Survey carried out by TÁRKI in 2003.1 Our analysis focuses on relative distribution of various income ranges among the Gypsy minority in Hungary. We are not only curious about the distribution of income ranges, however, but also want to examine the relative income situation of Gypsy families with respect to non-minority Hungarian families living in the same region, or in a similar settlement type. Before describing the data on income, we would like to give a short introduction to those processes that have had a formative role in influencing the income situation of Hungarian Gypsies over the past few decades.
The source of data regarding the Roma minority is the third representative Hungarian Gypsy Survey (hereafter just Gypsy Survey). In the past 33 years there have been three representative studies on the Hungarian Gypsy population: in 1971, at the end of 1993, and in the first quarter of 2003. All three surveys included the total Gypsy population of Hungary. Data were collected from the Gypsy minority, including native speakers of the Hungarian, Gypsy or Romanian languages, those living in Budapest, large towns and small villages, and those Gypsies with the highest level of income and with the lowest level as well.2 The observation unit for the survey was the household, the community of people living together in one house or flat. Both of the earlier studies examined two per cent of
1 The analysis in this study is a continuation (complementation) of István Kemény’s research programme on the situation of the Hungarian Gypsy minority (see below). The author has built his study on the database of that research, as well as on his knowledge of the Gypsy minority accumulated during that programme. The author is grateful to István Kemény for sharing his data and the results of his analysis, and for his invaluable advice in the preparation of this study. Further acknowledgment goes to Márton Medgyesi and to TÁRKI for allowing the use of data from the Household Monitor in this research. This study has been supported by the Ferenc Deák Fellowship of the Ministry of Education. The author is grateful for this support. 2 The 1971 study was coordinated by István Kemény; the 1993 one by István Kemény and Gábor Kertesi; and the 2003 one by István Kemény and Béla Janky. The 2003 sample selection plan and the questionnaire were prepared by István Kemény. The 1971 study and the 1993 study were carried out by the Institute of Sociology of the Hungarian Academy of Sciences; the 2003 study was part of the research programme entitled The situation of the Hungarian Gypsy Minority at the beginning of the 21st century (segregation, income, education, and self government, within the framework of the National Research and Developmental Projects (NKFP), at the Institute for the Study of Ethnic-National Minorities of the Hungarian Academy of Sciences. For the most important findings of the project, see: Kemény (1976), Kemény and Havas (1996), and Kemény and Janky (2003a, 2003b, 2003c, 2004).

The Income Situation of Gypsy Families 387
Gypsies using a representative sample. In the 2003 study we had to restrict our sample size to one per cent of the Roma minority population. Not all people living in Gypsy households were Gypsies. Whereas in 2003 5.9 per cent of the recorded adults were not Gypsy, in the 1993 study the figure was seven per cent.
In the survey carried out in 1971 we placed in the category of Gypsy those respondents who were considered to belong to the Gypsy minority by their non-Gypsy neighbours. The same principle was followed in the 1993 and 2003 surveys.3 Only this procedure ensured the unambiguous selection of respondents. There is no record of where the Gypsy minority live, and therefore the selection of any sample could only be made on this basis.4
In the sample of the 2003 survey we included 1,165 homes. Data collection failed in 105 homes, but of these there were only 19 where the inhabitants did not consider themselves to be part of the Gypsy minority.5
The source of national data is the TÁRKI Household Monitor Survey 2003 (hereafter Household Monitor). This data collection took place half a year after the Gypsy Survey.
The household was used as the basic unit in the samples of both studies. All household members were registered, and they were asked to fill out individual questionnaires. A detailed exploration of the income situation of families was an important factor in both studies.
3 For a discussion of the methodology, see: Havas, Kemény and Kertesi (1998), Kertesi (1998), Ladányi and Szelényi (1997, 1998a, 1998b). For the problem of ethnic selection, see: Kemény and Janky (2003a), Ladányi and Szelényi (2001a, 2001b). 4 A sample cannot, of course, be drawn based on respondents’ own claims of belonging to a minority. There is no record of the status of such people, just as there is none about the rest of the Gypsies. 5 In 1993 data collection failed in 405 of 2,222 households, but in only 21 cases because the respondents did not consider themselves Gypsy. The high rate of refusal demands an explanation in any case. The highest rate of refusal in the case of questionnaire-based studies is usually experienced in Budapest. In the 1993 and 2003 studies the especially problematic tasks of organizing data collection in Budapest—starting with sample selection to monitoring of data collectors—were carried out by Gabriella Lengyel, who has great experience of studying Roma households both as a researcher and as a social worker. In the capital, interviewers are selected from social workers who work with Gypsy families, and are therefore well prepared for the task of questioning. In small towns and villages the preparation of a list of Gypsy households did not prove to be a difficult task for professional data collectors. The experience of interviewers in 1993 and in 2003 has been that Gypsy respondents had a much more positive attitude towards the research than the national average (data gathering in the countryside was carried out by Ipsos–Szonda Research Institute 1993 and by the Centre of Regional Studies of the Hungarian Academy of Sciences in 2003).

388 Béla Janky
The Hungarian Gypsy minority at the turn of the millennium6 In 1893 the Hungarian Royal National Statistical Office carried out a survey of the Hungarian Gypsy population. In the areas that map onto today’s Hungary they registered a Gypsy minority of 65 thousand. In 1971 the equivalent body recorded between 270 thousand and 370 thousand Gypsies, while in 1993 there were between 420 and 520 thousand, and in 2003 between 520 and 650 thousand members of the Gypsy population.
Hungarian Gypsies belong in three large groups, according to their native tongue: there are the Hungarian-speaking Hungarian Gypsies, the Hungarian- and Gypsy-speaking (bilingual) Olah Gypsies, and the Hungarian- and Romanian-speaking (bilingual) Beas Gypsies. Based on the studies of the Gypsy Survey, the proportion of Hungarian-speaking Gypsies is today 87 per cent, those of the Gypsy tongue make up eight per cent, and five per cent are Romanian native speakers.
In the 2003 survey, 37.8 per cent of respondents considered themselves Hungarian, 29.8 per cent Hungarian Gypsy, 26.8 per cent Gypsy, 4.5 per cent Beas, and one per cent regarded themselves as having some other national identity.
The settlement segregation of Romas is significant and it has shown an increasing tendency in the past few decades. In 2003 six per cent of registered Gypsy homes were situated in a Gypsy colony, two per cent of them were far from a settlement, 42 per cent were on the edge of a settlement, and 22 per cent were inside a settlement, but exclusively, or overwhelmingly in a Gypsy environment. Thus, 72 per cent of Gypsy families live in a segregated living environment.
In the past decades differences regarding education have grown between Gypsies and non-Gypsies in Hungary. On average 88 per cent of the Hungarian non-Gypsy population aged 3–5 go to kindergarten, whereas this figure is 42 per cent among Gypsies. Some 82 per cent of Gypsy youths aged 20–24 have completed primary school, but the majority of them completed it later then is usual. On average, in 2000 five per cent of the population aged 16 had not completed primary school (Halász and Lannert eds. 2003), whereas in February 2003 36 per cent of the Gypsy population aged 17 years had not completed it. Between 1993 and 2003 the number of children consi-dered backward and sent to special schools or remedial classes increased: 20 per cent of primary school-aged Gypsy children go to such schools.
6 The summary below is largely based on the analysis of Kemény and Janky (2004) (see also Kemény and Janky 2003a, 2003b, 2003c).

The Income Situation of Gypsy Families 389
In 2001, on average, 73 per cent of children went to secondary school, whereas only a fifth of Gypsy children do. On average, in 2001 54 per cent of 18 year olds had a General Maturity Certificate (Halász and Lannert eds. 2003: 439), whereas in 2002 only five per cent of Gypsy youths aged between 20 and 24 had completed secondary school.
The proportion of Gypsies who go to university or college is even smaller. On average, 40 per cent of youths aged 18 to 20 are in higher education in Hungary, whereas this figure is only one per cent for Gypsies aged 20 to 24.
In the 1970s the proportion of Gypsy men capable of work and holding a job was the same as among non-Gypsy men.7 At the same time, the proportion of employed Gypsy women was lower than the national average.
In the second half of the 1980s, following the change in the socio-economic system, the transformation of the Hungarian job market speeded up. There was a larger jump in unemployment among the Gypsy population at this time than among the non-Gypsy population. In addition, the large-scale job losses began earlier among Gypsies than in other groups. According to the retrospective analysis of the 1993 Gypsy Survey, the number of Gypsies employed was 125 thousand in 1985, 109 thousand in 1989, and 56 thousand at the end of 1993. The proportion of job losses nationwide was 30 per cent on average, but among the Gypsy population the figure was 55 per cent.
The main reason for this was the low educational level of the Gypsy minority. Some 43 per cent of the Gypsy population aged above 20 have only completed up to seven years of education, and 41 per cent have eight years, whereas 19 per cent of non-Gypsies have only up to seven years of schooling, and 25 per cent have eight. The second reason for Gypsies losing their jobs was the geographic location of their homes. Very few Gypsies live in Fejér, Komárom-Esztergom, Vas and Veszprém counties, and there are even fewer in Győr-Moson-Sopron County. And these were the counties that were least affected by unemployment. By contrast, the highest numbers of Gypsies live in Borsod-Abaúj-Zemplén County, followed by Szabolcs, Nógrád, Heves, Jász-Nagykun-Szolnok, Hajdú, and then Baranya and Somogy counties, where unemployment reached a much higher proportion. The third reason for the low rate of employment in the Gypsy population
7 For an earlier, more sketchy review of labour market and income relations see Kemény and Janky (2003c). The alteration in the labour market situation of the Gypsy minority after the socio-economic changes of 1989 is analysed in detail by Kertesi (2000a), making comparisons with the 1993 data. An analysis of the situation following the socio-economic changes of 1989, based on the Hungarian Central Statistical Office data was carried out by Kertesi (1994). Another article relating to this topic is Kertesi (2000b). For an analysis of the process in the 1990s, see Kemény (2000a, 2000b, 2000c, 2003a, 2003b).

390 Béla Janky
was that they used to work in economic sectors that declined during the crisis. In the building industry, for instance, the rate of unemployment was almost double the national average. In 1971, 26 per cent of the Gypsy population had been working in that sector; with 25 thousand Gypsies that made up 10 per cent of all workers in the building industry. The fourth reason is discrimination, the effect of which, unfortunately, we were not able to measure in the 1993 and 2003 Gypsy Surveys.
According to our data, the situation of the Gypsy minority on the job market is unchanged. At the beginning of 2003, 21 per cent of the Gypsy population aged 15–74 was employed, whereas in 1993 it was 22 per cent. The proportion of male employed was 28 per cent in 2003, whereas in 1993 it was 28.5 per cent. Among women aged between 15 and 74 the employment figure was 15 per cent in both 2003 and 1993.
Within the employment rate there are large differences with respect to region and settlement type. In Budapest, 64 per cent of Gypsy men aged between 15 and 74 are employed, whereas in provincial towns this figure is 27 per cent, and in small villages it was only 20 per cent in the spring of 2003. Some 36 per cent of Gypsy women of the same age were employed in Budapest, 15 per cent in provincial towns, and 10 per cent in small villages.
In 2003, 71 per cent of the Gypsy minority held a regular job throughout the year. Another 19 per cent held a job for only a few months or weeks. Ten per cent of those who held a job were employed as seasonal or casual workers. Some 70 per cent of employed Gypsies were unskilled workers, 22 per cent were skilled workers, and eight per cent were white-collar or uniformed workers.
The income situation of Gypsy families In the 2003 study we examined the income situation of the respondents. Naturally, a questionnaire-based research can merely provide approximate data. According to our estimation, on average the monthly income per person in Gypsy families was 20,900 forints in February 2003, and the median was 16,800 forints. This includes all monetary income, pensions and welfare support. On average, less than half of all income results from employment. According to our estimations, employment income amounts to 8,800 forints per household. The remaining 12,100 forints consists of pension payments, child support and other types of assistance (Table 1).

The Income Situation of Gypsy Families 391 Table 1: The distribution of Gypsy households based on the average monthly income per
person, 2003 Income categories (HUF)
Valid number of cases (N)
Percentage (%)
Cumulative percentage (%)
0–14,999 477 41.5 41.5 15,000–19,999 232 20.2 61.7 20,000–29,999 225 19.6 81.2 Above 30,000 216 18.8 100.0 Total 1150 100.0
Source: Third National Representative Gypsy Survey, 2003. Besides the average income per person, it is worth looking at the income per consumption unit. Due to the large number of children, this is especially true in the case of Gypsy households. To calculate income per consumption unit we used the OECD-II scale, which means that the first adult receives a value of 1, the second 0.5 and all children receive an equivalence value of 0.38 (Éltető and Havasi 2002). Calculated this way, the monthly income per consumption unit is 36,200 forints on average. Within this, the income from employment is 20,200 forints, state assistance and other types of support make up 15,900 forints.
Behind the median values mentioned there are significant differences in income: 56 per cent of households did not at the time of interviewing have a member who had income from employment (even in such households, however, it is possible that a casual or seasonal job, carried out by all members of the family (e.g. collecting herbs) would generate an income). In 12 per cent of households those who have an income from employment are in a minority; in 18 per cent of households the rate is 50:50; in five per cent most members have an income from employment; and in eight per cent all members do. Households without an employed member constitute 56 per cent. This proportion is particularly high, considering that a household consisting of only retired people is very rare among the Gypsy minority.
In households without an employed member the average income per person per month is 14,900 forints (median value 12,800 forints). In the eight per cent of households in which all adults have an income, the average income per person per month is near 40,000 forints (median 36,000 forints). With an increase in the proportion of employed members in a household, it is not only the proportion of pensions and state assistance that decreases, but also the amount. In a household, for instance, in which all adults hold a job, the value of pensions and support per person is only 6,500 forints per month.
8 In calculating equivalence value and consumption units, other scales are also used in the study of poverty, e.g. Spéder (2002), and Kapitány and Spéder (2004).

392 Béla Janky
Regional differences of income only partly reflect the differences in the economic development of a region. Although in eastern counties (Szabolcs-Szatmár-Bereg, Hajdú-Bihar, Békés) there is not even one employed member in 73 per cent of households, west of the Danube this ratio is hardly higher than 56 per cent. Nevertheless, the average income per person in the latter region is only 22 per cent higher than in the eastern counties. Incomes in the Great Plain region and in the north are somewhat higher than in the eastern counties, but lower than in the Transdanubian regions. Although in Transdanubian counties the proportion of work-related income per person is 2.9 times higher than in the region containing the three eastern counties, the high proportion of pensions and welfare transfers, and their small variance decreases regional differences. Comparing the populations of small villages and large towns and cities may lead to similar conclusions. On average, there is hardly any income difference between small villages and larger county towns, despite the fact that incomes from employment per person are 40 per cent higher in towns than in small villages.
Households in Budapest and in areas around the capital are an exception to this. Here the proportion of Gypsy households with employed members, as well as their average household income, is much higher than among Gypsy families living in the countryside. In Budapest, 17 per cent of households do not have an employed member, but in 30 per cent of them each adult member has a job. The average income per person in the household is 32,900 forints, which is 90 per cent higher than in the poorest region of the three eastern counties. With respect to employment-based income, the difference is much larger: almost 6.5 times higher in Budapest and environs. At the same time, state assistance and pensions are no higher here than anywhere else in the country.
Our survey data do not contradict the assumption that there could be Gypsy ghettoes within larger settlements, which better-off Gypsy families would try to leave. At the same time, the results of the survey suggest that in the case of the Hungarian Gypsy population, the borderlines run between settlements and regions rather than within them. The employment-based income of Hungarian Gypsy families living in segregated areas of Budapest is 2.5 times higher than the income of those living in small villages surrounded by non-Gypsy neighbours. It is obvious, furthermore, that although regional differences are much larger in terms of income, state assistance and support are distributed in roughly the same way in the various groups of the Gypsy population, and make a substantial contribution to the income of most households.

The Income Situation of Gypsy Families 393
The relative income situation of the Hungarian Gypsy population In this section we are going to examine the place of the Gypsy minority in the Hungarian income range.9 On the one hand, we would like to use the available income data to answer the question of how closely the problem of poverty is intertwined with the situation of the Gypsy minority. On the other hand, we would like to analyse the differences in income among various regions and settlement types, and how these follow the differences in the non-Gypsy segments of the population. We would like to analyse how the employment situation of the more restricted and the broader environment can explain their income situation. Our analysis might help to answer the question of whether the different regions of the country differ with respect to the conditions they offer for further integration of the Roma minority.
This part of the study uses the 2003 Gypsy Survey data, as well as the TÁRKI Household Monitor 2003 data.10 Both surveys emphasize exploration of the income situation of households. At the same time, they differ, for instance in their use of imputation and in the way they questioning certain incomes more than once. These differences may, in some respects, restrict the validity of any comparison of income distribution based on the two studies. However, they have little effect on such comparisons as the relative situation of Gypsy families in different regions.
The demographic composition of Gypsy families, which is rather different from the rest of the population, indicates that, instead of income per person we should use income per consumption unit11 as a measure. Although we do use consumption units, our analysis is carried out on the sample of individuals.12 This way we gain a more exact picture of the relative positions.
According to the Household Monitor the average monthly income per consumption unit is 81,800 forints. This significantly exceeds the 35,600 forints measured in the Gypsy Survey’s sample of individuals.13 Based on the two datasets, if we wanted to compare the average income situation of Gypsy minorities and the non-Gypsy population, we would need to correct the average measured in the Household Monitor upwards (to about 84,500
9 Ladányi and Szelényi (2002) give a detailed analysis of the absolute and relative income positions of the Hungarian Gypsy minority, based on international studies. We are going to give a descriptive overview of the topic based on data sources and measures differing from theirs. 10 For the recent and most important results of the Household Monitor Survey, see: Szivós and Tóth (2004). 11 In the analysis of consumption units below we have used the OECD-II scale mentioned earlier in the chapter. 12 All members of the households are included in both databases, including infants. 13 Naturally, these data differ from those mentioned in the previous section, based on calculations at the level of households.

394 Béla Janky
forints). Such a comparison, however, could be made within the sample of the Household Monitor, since, during data collection, the data collectors had to state whether or not they considered the respondent to be a member of the Gypsy community.14 In the sample of the Monitor, among the respondents considered to be Gypsy, the average income per consumption unit was 42,200 forints, whereas for non-Gypsies it was 84,500 forints.
In the following we discuss where individual groups of Gypsies are placed, based on their income among the income deciles of the total population. In comparing the total Gypsy and non-Gypsy population we use the data of the small subsample of the Gypsy minority gathered by the Household Monitor, but in our comparison of various subgroups we can only rely on the data from the Gypsy Survey.
According to the data collection of the Monitor, in 2003 families with an income per consumption unit of less than 37,600 forints fell into the lowest decile. The border of the second and third lowest deciles is 47,800 forints. Based on the Gypsy Survey, members of Gypsy families with an average income fall into the lowest income decile for the total population. Based on data from the Gypsy subsample of the Household Monitor, however, Gypsies with average income belong in the second decile (Table 2). Data from the Gypsy Survey suggest that 65 per cent of Gypsies belong in the lowest decile of the population, and 80 per cent belong in the lowest quintile. According to the Monitor subsample, 43 per cent of Gypsies belong in the lowest decile, and 71 per cent in the lowest quintile. Table 2. Distribution of the Gypsy population among income deciles (%)* Number of decile
Income ceiling (per consumption unit,
HUF)**
Household Monitor, Gypsy subsample 2003
(N=386)
Gypsy Survey 2003
(N=5279) Lowest 37 600 43.4 65.1 2nd 47 800 28.1 15.3 3rd 54 600 11.2 6.8 4th 61 900 4.4 3.3 5–6th 78 600 9.1 5.3 7–10th – 3.9 4.1
Note: * Distribution of individuals by the income per consumption unit (OECD-II scale). ** The data source serving as the basis of the deciles is: TÁRKI Household Monitor, 2003.
According to these data, of the one million people on the lowest level of income, 280 thousand (i.e. 28 per cent) probably belong to the Gypsy
14 According to interviewers, members of a household could be defined based on the position of the head of the household. The proportion of members of the Roma minority in the Household Monitor (6.5 per cent) is close to the upper estimation of the size of the minority based on the Gypsy Survey.

The Income Situation of Gypsy Families 395
minority. Among the poorest 300 thousand people the proportion of Gypsies is already 40 per cent. According to the Gypsy Survey, probably 370 thousand (between 340 and 420 thousand) Gypsies belong to the poorest one million people. According to the latest data, two-thirds or four-fifths of the poorest 300 thousand people are Gypsies. That means 37 per cent of Gypsies belong in the lowest income stratum.
Both the Gypsy Survey and the subsample of the Household Monitor suggest that Gypsies represent a substantial proportion of the poorest section of the population. One cannot rule out the possibility that they also provide the majority of the poorest few thousand people. As we mentioned earlier, there are significant differences between the two data sources we have used. In our opinion, these are due to differences in sample selection and data-gathering methods.15 In our view, the data collection of the Gypsy Survey has revealed income with an exactitude similar to that of the Household Monitor. Thus, there is a high probability that the distribution of the Gypsy minority among the individual deciles based on the Gypsy Survey is close to the real proportion. If we are just a little lax in this respect, then, we can assume that the distribution of income among various regions and settlements is well represented in both samples. In other words, we are able to say where in the country the relative position of the Gypsy minority is worse or better than the national average.
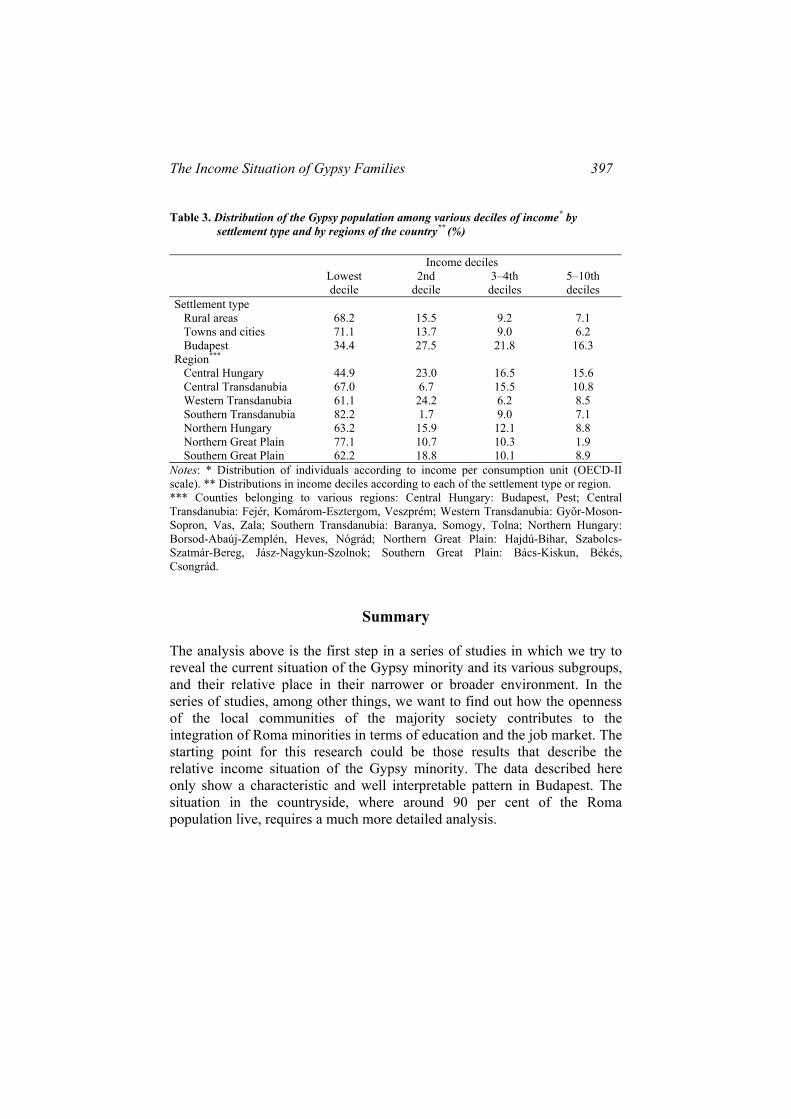
Based on the previous section we can say that the income situation of those Gypsies living in small towns is hardly better than that of Gypsies living in villages. Our data show that the relative income situation of Gypsy minorities living in those two settlement types is also similar: 68 per cent of Gypsies living in small villages belong in the lower tenth of the village population, while in small towns the figure is 71 per cent. We saw earlier that the Gypsy population in the capital (10 per cent) has a much better income situation than those living in the countryside. It becomes clear from a comparison with data from the Household Monitor that in itself this is a result of the better income situation of the Budapest population as a whole. Only 34 per cent of the Gypsy minority belong in the lowest tenth of the
15 Both studies examined in detail the possible income sources, both individual and at the level of households. The Gypsy Survey especially emphasized the sources of income specific to the Roma minority (e.g. seasonal gathering of herbs), or occurring more frequently in their communities. By contrast, the Monitor gathered information on certain variables more than once, and in certain subgroups used the methodology of replacing seemingly false or missing data with imputation. Such procedures were not applied in the Gypsy Survey. Furthermore, the data-gathering methods of the Monitor cannot take into consideration the specific geographical distribution of the Gypsy population. In a multi-step data collection method this will increase the size of error; in other words, the chance of under- or overrepresenting certain Roma subgroups in the Gypsy sample is not to be dismissed. A further source of uncertainty is the definition of members of the Gypsy minority based on the judgment of the data collectors, which again increases the size of error in the case of the Monitor subsample.

396 Béla Janky
Budapest population. It is true, however, that 78 per cent of them belong to one of the three lowest deciles. Among the relatively well-off Budapest population there are very few Gypsies (Table 3).
In the evaluation of Budapest data one must bear in mind that the relative income situation of people in the active age group is better there than the national average, since pensions and other benefits are not proportionately higher than in the countryside. Because of this, the income situation of the Gypsy population of Budapest might seem better than it really is, since its age composition differs from the average (it consists of fewer pension-aged people). In order to gain a more exact picture, we examined the income distribution of those who live in households where there are children below the age of 14 to be supported. In villages and small towns, the distribution of Gypsy families with children among the total number of families with children across the various income deciles is similar to the distribution of all Gypsies in villages or small towns with respect to the income categories of the overall population. Contrary to our expectations, in Budapest, there were not more, but fewer Gypsy families with children who fell into the lowest income decile for families with children, than the total Budapest Gypsy population with respect to the whole population of Budapest. In the capital, 26 per cent of Gypsy families with children belonged in the lowest tenth in terms of income, and 51 per cent in the lowest fifth.
Comparing the various regions in terms of the relative income situation of Gypsies we can still find differences (Table 3). In the region of Central Hungary, which takes in Budapest and Pest County, the ratio of the Gypsy minority belonging in the lowest level of income category is small. There are characteristic differences beyond these, as well, but the basic data do not give enough information to create a hypothesis to explain the reasons behind these differences. There are several other regions of the country with a relatively low Gypsy population, where fewer Gypsies than average for the countryside belong in the lowest income bracket for that region. This is the case in Western Transdanubia, and also in the Southern Great Plain. At the same time, in Northern Hungary, which is heavily populated by Gypsies, the proportion of Gypsies among the poor is similar to that found in the two regions just mentioned. Regions densely populated by the Gypsy minority differ from each other in terms of economic development and historical-cultural inheritance, as well.
At the same time, the data suggest that in the less well-developed region of the Northern Plain the proportion of Gypsies belonging in the lowest income decile is as high as in the Southern Transdanubian region, which is in a much better economic situation. It is true that in the aforementioned eastern region, the proportion of Gypsies who fall into the average income bracket of the region is much smaller than in Southern Transdanubia.
The Income Situation of Gypsy Families 397
Table 3. Distribution of the Gypsy population among various deciles of income* by
settlement type and by regions of the country** (%) Income deciles Lowest
decile 2nd
decile 3–4th deciles
5–10th deciles
Settlement type Rural areas 68.2 15.5 9.2 7.1 Towns and cities 71.1 13.7 9.0 6.2 Budapest 34.4 27.5 21.8 16.3
Region*** Central Hungary 44.9 23.0 16.5 15.6 Central Transdanubia 67.0 6.7 15.5 10.8 Western Transdanubia 61.1 24.2 6.2 8.5 Southern Transdanubia 82.2 1.7 9.0 7.1 Northern Hungary 63.2 15.9 12.1 8.8 Northern Great Plain 77.1 10.7 10.3 1.9 Southern Great Plain 62.2 18.8 10.1 8.9
Notes: * Distribution of individuals according to income per consumption unit (OECD-II scale). ** Distributions in income deciles according to each of the settlement type or region. *** Counties belonging to various regions: Central Hungary: Budapest, Pest; Central Transdanubia: Fejér, Komárom-Esztergom, Veszprém; Western Transdanubia: Győr-Moson-Sopron, Vas, Zala; Southern Transdanubia: Baranya, Somogy, Tolna; Northern Hungary: Borsod-Abaúj-Zemplén, Heves, Nógrád; Northern Great Plain: Hajdú-Bihar, Szabolcs-Szatmár-Bereg, Jász-Nagykun-Szolnok; Southern Great Plain: Bács-Kiskun, Békés, Csongrád.
Summary The analysis above is the first step in a series of studies in which we try to reveal the current situation of the Gypsy minority and its various subgroups, and their relative place in their narrower or broader environment. In the series of studies, among other things, we want to find out how the openness of the local communities of the majority society contributes to the integration of Roma minorities in terms of education and the job market. The starting point for this research could be those results that describe the relative income situation of the Gypsy minority. The data described here only show a characteristic and well interpretable pattern in Budapest. The situation in the countryside, where around 90 per cent of the Roma population live, requires a much more detailed analysis.

398 Béla Janky
REFERENCES Éltető, Ö. and E. Havasi 2002: ‘Az elemzési egység és az ekvivalencia-skála
megválasztásának hatása a jövedelmi egyenlőtlenségre és szegénységre. [Effects of observation unit and scale of equivalence on income inequality and poverty].’ Szociológiai Szemle, no. 4, pp.157–170.
Halász, G. and J. Lannert eds. 2003: Jelentés a magyar közoktatásról, 2003. [Report on the Hungarian Public Education 2003]. Budapest: Országos Közoktatási Intézet.
Havas, G., I. Kemény and G. Kertesi 1998: ‘A relatív cigány a klasszifikációs küzdőtéren. [Relative Roma in the battle-field of classification]’. Kritika, March.
Kapitány, B. and Zs. Spéder 2004: Szegénység és depriváció. [Poverty and Deprivation]. Budapest: KSH Népességtudományi Kutatóintézet [Demographic Research Institute, Hungarian Central Statistical Office].
Kemény, I. ed. 1976: Beszámoló a magyarországi cigányok helyzetével foglalkozó, 1971-ben végzett kutatásról. [Report on the Study about the Situation of Hungarian Gypsies in 1971]. Budapest: MTA Szociológiai Kutató Intézet. [Institute of Sociology, Hungarian Academy of Sciences].
Kemény, I. ed. 2000a: Romák/cigányok és a láthatatlan gazdaság. [Romas/Gypsies and the Invisible Economy] Budapest: Osiris.
Kemény, I. 2000b: ‘Foglalkoztatás, munka, munkanélküliség. [Employment, job, unemployment]’. In: Kállai, E. and E. Törzsök eds. Cigánynak lenni Magyarországon. [Being a Gypsy in Hungary]. Budapest: EÖKP, pp. 25–31.
Kemény, I. 2000c: ‘A teljes foglalkoztatottságtól a munkanélküliségig és a láthatatlan gazdaságig. [From full employment to unemployment and to invisible economy].’ Kisebbségkutatás, no. 4, pp. 599–608.
Kemény, I. 2003a: ‘A munkaerő-piaci és a jövedelmi helyzet változásai. A települési és a lakásviszonyok változásai. [Trends of labour market and income situation. Settlement and housing].’ In: Kállai, E. and E. Törzsök eds. Cigánynak lenni Magyarországon. [Being a Gypsy in Hungary]. 2002 edition. Budapest: EÖKK. pp. 35–43.
Kemény, I. 2003b: ‘Válság után. Szegények, munkanélküliek, cigányok, versenyképtelenek. After crisis. Poor, unemployed, Gypsy, uncompetitive]’. Esély, no. 2, pp. 66–74.
Kemény, I. and G. Havas 1996: ‘Cigánynak lenni. [Being a Gypsy]’ In: Andorka, R., T. Kolosi T. and Gy. Vukovich eds. Társadalmi riport 1996. [Social Report 1996] Budapest: TÁRKI. pp. 352–380.
Kemény, I. and B. Janky 2003a: ‘A cigány nemzetiségi adatokról. [About Gypsy ethnic data]’ Kisebbségkutatás, no. 2, pp. 309–315.
Kemény, I. And B. Janky 2003b: ‘A 2003. évi cigány felmérésről – Népesedési, nyelvhasználati és nemzetiségi adatok. [About the Gypsy Survey from 2003—demographical, language usage and ethnic data]’. Beszélő, October, pp. 64–76.
Kemény, I. and B. Janky 2003c: ‘A cigányok foglalkoztatottságáról és jövedelmi viszonyairól. [About the employement and income situation of Gypsies].’ Esély, no. 6, pp. 58–73.
Kemény, I. and B. Janky 2004: A magyarországi cigány népesség a 21. század elején. [Hungarian Gypsy Population at the Begining of the 21st Century]. Budapest: Gondolat. (In preparation).
Kertesi, G. 1994: ‘Cigányok a munkaerőpiacon. [Gypsies on the labour market]’ Közgazdasági Szemle, vol. 41, pp. 991–1023.
Kertesi, G. 1998: ‘Az empirikus cigánykutatások lehetőségéről. [Possibilities of empirical research on Gypsies].’ Replika, 29.

The Income Situation of Gypsy Families 399 Kertesi, G. 2000a: ‘A cigány foglalkoztatás leépülése és szerkezeti átalakulása 1984 és 1994
között. [Reduction of workforce and structural change of Gypsy employment between 1984 and 1994].’ Közgazdasági Szemle, vol. 47, pp. 406–443.
Kertesi, G. 2000b: ‘Ingázás a falusi Magyarországon. [Commuting on rural Hungary].’ Közgazdasági Szemle, vol. 47, pp. 775–798.
Ladányi, J. and I. Szelényi 1997: ‘Ki a cigány? [Who is Gypsy?]’ Kritika, December. Ladányi, J. and I. Szelényi 1998a: ‘Az etnikai besorolás objektivitásáról. [Objectivity of
ethnic classification].’ Kritika, March. Ladányi, J. and I. Szelényi 1998b: ‘Még egyszer az etnikai besorolás objektivitásáról. [Once
more about the objectivity of ethnic classification]’ Replika, 30. Ladányi, J. and I. Szelényi 2001a: ‘A roma etnicitás társadalmi konstrukciója Bulgáriában,
Magyarországon és Romániában a piaci átmenet korában. [Social construction of Roma ethnicity in Bulgaria, Hungary and Romania during transition to market economy].’ Szociológiai Szemle, no. 4, pp. 85–95.
Ladányi, J. and I. Szelényi 2001b: ‘Van-e értelme az underclass kategória használatának? [Does using the ‘underclass’ category make sense?].’ Beszélő, November, pp. 94–98.
Ladányi, J. and I. Szelényi 2002: ‘Cigányok és szegények Magyarországon, Romániában és Bulgáriában. [Gypsies and poors in Hungary, Romania and Bulgaria].’ Szociológiai Szemle, no. 4, pp. 72–94.
Spéder, Zs. ed. 2002: Demográfiai folyamatok és társadalmi környezet. Gyorsjelentés. [Demographic Trends and Social Environment. Fast Report]. Budapest: KSH Népességtudományi Kutatóintézet [Demographic Research Institute of the Hungarian Central Statistical Office]
Szivós, P. and I. Gy. Tóth eds. 2004: Stabilizálódó társadalomszerkezet. [Stabilizing of social structure] TÁRKI Monitor Jelentések 2003. [TÁRKI Monitor Reports, 2003] Budapest: TÁRKI.

Social Report 2004, Budapest: TÁRKI, 2004 Tamás Kolosi, György Vukovich, István György Tóth eds.
Table of Contents
Introduction
Tamás Kolosi, István György Tóth and György Vukovich PART I: SOCIAL INDICATORS, SOCIAL STRUCTURE 1 Hungarian Society Reflected in Indicators
(Erzsébet Bukodi, István Harcsa and György Vukovich) 2 Key Processes of Structural Transformation and Mobility
in Hungarian Society since the Fall of Communism (Tamás Kolosi and Péter Róbert)
3 Income Composition and Inequalities, 1987–2003 (István György Tóth)
4 Poverty in Hungary on the Eve of Entry to the EU (András Gábos and Péter Szivós)
PART II: DEMOGRAPHIC PROCESSES AND WELFARE SYSTEM 5 Hungarian Population Characteristics in the EU Context
(Gabriella Vukovich) 6 Fertility Decline, Changes in Partnership Formation and Their Linkages
(Zsolt Spéder) 7 Lifestyle and Well-being in the Elderly Population
(Edit S. Molnár) 8 Effects of Intergenerational Public Transfers on Fertility: Test on Hungarian Data
(Róbert Iván Gál and András Gábos) 9 Housing Conditions and State Assistance, 1999–2003
(János Farkas, József Hegedüs and Gáborné Székely) 10 Educational Performance and Social Background in International Comparison
(Péter Róbert) PART III: LABOUR MARKET AND HOUSEHOLD ECONOMICS 11 Labour Market Trends, 2000–2003
(Gábor Kézdi, Hedvig Horváth, and Péter Hudomiet) 12 Business Expectations of the Largest Exporters at the Beginning of 2004
(István János Tóth) 13 Low Participation among Older Men and the Disincentive Effects
of Social Transfers: The Case of Hungary (Orsolya Lelkes and Ágota Scharle)
14 Overeducation, Undereducation and Demand (Péter Galasi)
15 The Labour Market and Migration: Threat or Opportunity? (Ágnes Hárs, Bori Simonovits and Endre Sik)

16 General Characteristics of Household Consumption with Focus on Two Fields of Expenditure (Anikó Bernát and Péter Szivós)
PART IV: INFORMATION SOCIETY 17 Digital Inequality and Types of Info-communication Tool Use
(Róbert Angelusz, Zoltán Fábián and Róbert Tardos) 18 The Spread of Information Technology: Objective and Subjective Obstacles
(Tibor Dessewffy and Zsófia Rét) 19 The Development of Electronic Commerce in Hungary
and in Countries of the European Union (László Szabó)
20 E-government in Hungary Today (Teréz N. Vajdai)
PART V: MINORITY AND MAJORITY IN HUNGARY 21 Is Prejudice Growing in Hungary
(Zsolt Enyedi, Zoltán Fábián and Endre Sik) 22 The Income Situation of Gypsy Families
(Béla Janky) 23 Residential Segregation and Social Tensions in Hungarian Settlements
(Marianna Kopasz) 24 The Social Position of Immigrants
(Irén Gödri and Pál Péter Tóth) PART VI: POLITICAL BEHAVIOUR, SOCIAL ATTITUDES 25 Trends in Party Choice after the Change in Government
(István Stumpf) 26 Public Support for EU Accession in Hungary
(Gergely Karácsony) 27 National Identity in Hungary at the Turn of the Millennium
(György Csepeli, Antal Örkény, Mária Székelyi and János Poór) 28 The Individual and Social Components of Insecurity
(György Lengyel and Lilla Vicsek)

------------------------------------------------------------------------------ Cataloging in Publication Data
Social Report 2004 /ed. by Tamás Kolosi, István György Tóth,
György Vukovich—Budapest: TÁRKI, 2004 487 p.
Society—Hungary—Social structure—Social indicators—Welfare systems Labour market—Information society—Migration—Election.
-------------------------------------------------------------------------------
Hard copies of the book can be ordered directly from TÁRKI. Order form: www.tarki.hu/
Contact information: Ilona Pallagi
H-1518 Budapest, Pf. 71., Hungary E-mail: [email protected]

Research Areas: • social structure, labour market • income distribution, poverty, inequalities • social policy, welfare systems • boom study, economic attitudes • election research, market research • survey methodology, statistical analyses • microsimulation implementation References: • government agencies • international organizations • professional organizations • local councils • financial institutions • major companies Services: • non-profit public data archive with more than 650 databases • empirical surveys carried out with the help of highly qualified survey apparatus • acclaimed research results, wide-ranging training experience • revealing analyses, advance effect studies • occasional, half-yearly and yearly reports, Social Report,
TÁRKI Public Policy Discussion Papers Contact Information for TÁRKI Social Research Centre: Address: Budaörsi út 45, H-1112 Budapest, Hungary Postal address: P.O. Box 71, H-1518 Budapest, Hungary Phone: +36 1 309-7676 Fax: +36 1 309-7666 E-mail: [email protected] Internet: http://www.tarki.hu Useful Addresses: President: Tamás Kolosi, [email protected] General Director: István György Tóth, [email protected] Scientific Director: Tamás Rudas, [email protected] Survey Dept: Matild Sági, [email protected] Data Archive Dept: Zoltán Fábián, [email protected] Office Manager: Katalin Werner, [email protected]