The Inception of a Prediabetes Prevention Program in ...
40
Gardner-Webb University Digital Commons @ Gardner-Webb University Education Dissertations and Projects School of Education 2018 e Inception of a Prediabetes Prevention Program in County Government Gregory R. Grier Gardner-Webb University Follow this and additional works at: hps://digitalcommons.gardner-webb.edu/education_etd Part of the Community Health and Preventive Medicine Commons , Education Commons , and the Medical Education Commons is Project is brought to you for free and open access by the School of Education at Digital Commons @ Gardner-Webb University. It has been accepted for inclusion in Education Dissertations and Projects by an authorized administrator of Digital Commons @ Gardner-Webb University. For more information, please see Copyright and Publishing Info. Recommended Citation Grier, Gregory R., "e Inception of a Prediabetes Prevention Program in County Government" (2018). Education Dissertations and Projects. 214. hps://digitalcommons.gardner-webb.edu/education_etd/214
Transcript of The Inception of a Prediabetes Prevention Program in ...

Gardner-Webb UniversityDigital Commons @ Gardner-Webb University
Education Dissertations and Projects School of Education
2018
The Inception of a Prediabetes Prevention Programin County GovernmentGregory R. GrierGardner-Webb University
Follow this and additional works at: https://digitalcommons.gardner-webb.edu/education_etd
Part of the Community Health and Preventive Medicine Commons, Education Commons, andthe Medical Education Commons
This Project is brought to you for free and open access by the School of Education at Digital Commons @ Gardner-Webb University. It has beenaccepted for inclusion in Education Dissertations and Projects by an authorized administrator of Digital Commons @ Gardner-Webb University. Formore information, please see Copyright and Publishing Info.
Recommended CitationGrier, Gregory R., "The Inception of a Prediabetes Prevention Program in County Government" (2018). Education Dissertations andProjects. 214.https://digitalcommons.gardner-webb.edu/education_etd/214

Consultancy Project
Executive Summary
Organization: Gardner-Webb University School of Education
Project Title: The Inception of a Prediabetes Prevention Program in
County Government
Candidate: Gregory R. Grier, MBA
Consultancy Coach: Dr. Jeffrey Hamilton
Defense Date: July 12, 2017
Authorized by: Allison Mauney, Human Resource Director

Amendment History
Version Issue Date Changes
1 5/1/2018 Initial version.
2 5/30/2018 Additional information provided per Advisor.
3 6/18/2018 Revisions per editor.

Approval
This consultancy project was submitted by Gregory R. Grier under the direction of
Direction of the persons listed below. It was submitted to Gardner-Webb University
School of Education and approved in partial fulfillment of the requirement for the
degree of Doctor of Education at Gardner-Webb University.
______________________________________ _______________
Dr. Jeffrey Hamilton, Faculty Advisor Date
Gardner-Webb University
______________________________________ _______________
Allison Mauney, Site Advisor Date
Cleveland County Government
Human Resource Director

Acknowledgements
Romans 8:28 “And we know that God causes everything to work together for the good of
those who love God and are called according to his purpose.”
As I conclude this chapter in my life, I would like to recognize and thank those
who have prayed and supported me throughout this process. First and foremost, I would
like to thank God for his unfailing love and for being with me every step of the way. To
my wife, Danielle for her patience, support, and love! I love you baby. You have been my
encourager, supporter and partner in marriage for 10 years and I am grateful. I dedicate
this book to you and also my Nana (Frances Marie Mitchell). Nana thank you for your
constant support, for being my biggest cheerleader, and most importantly my prayer
warrior. I am also thankful for my son, mother, step-father, siblings, in laws, aunts and
uncles. You have each played a unique part in your own special way and I am eternally
grateful.
I would also like to thank my church family St. Peter Baptist Church and Pastor
Reverend William Thompson for being my spiritual leader for the past 12 years – you
have been a source of inspiration and a sounding board for both my personal and
professional life. Thank you, Pastor.
Lastly, I would like to thank my classmates, and staff/faculty of Gardner-Webb
University. Ten years and 3 degrees later I have learned much, grown significantly, and I
am very thankful specifically for the support of Dr. Cindy McKinney, Chief Barry
Johnson, Lou Ann Scates, and Susan Glascock.

Abstract
The Inception of a Prediabetes Prevention Program in County Government. Grier,
Gregory R., 2018: Consultancy Project, Gardner-Webb University, Digital
Commons/Prediabetes Prevention Program/Wellness/Health Indicators
With the increasing prevalence and high cost of treatment, diabetes places an enormous
demand on economic resources. To combat this issue and rising health care costs,
Cleveland County Government took a proactive approach and partnered with its local
YMCA. The YMCA was contracted to provide Prediabetes Prevention and Diabetes
Control program classes to County employees. The programs were designed to (a)
decrease the A1c level of program participants, (b) lower health care costs for the
County, and (c) provide education about prevention and maintenance.
The ultimate goal of the program was to assist county administration and staff in their
efforts to improve the quality and effectiveness of the program while also determining if
the County needed to renew the 3-year contract. This evaluation focuses on the benefits
of the program and the success of program participants based on biometric screening
results and includes a review and analysis of survey data collected from program
participants.
Results indicate that after the first year, the County saved approximately $550,000 in
health care costs by offering the program. Biometric screening results for program
participants significantly improved with 77 employees moving from a prediabetes range
glucose to a normal range glucose and with 246 employees improving A1c (blood
glucose) metrics from the previous year.

Table of Contents
1 Introduction ....................................................................................................................1
1.1 Project Purpose ........................................................................................................2
1.2 Associated Documents .............................................................................................2
1.3 Project Plan Maintenance ........................................................................................2
2 Project Scope .................................................................................................................3
2.1 Outline of Partnering Organization’s Objectives .....................................................3
2.1.1 Objectives
2.1.2 Success Criteria ...............................................................................................4
2.1.3 Risks ................................................................................................................4
2.2 Outline of Student’s Objectives ...............................................................................5
2.2.1 Objectives .......................................................................................................5
2.2.2 Success Criteria ...............................................................................................5
2.2.3 Risks ................................................................................................................6
2.3 Definitive Scope Statement......................................................................................6
3 Deliverables ...................................................................................................................6
3.1 To Partnering Organization......................................................................................7
3.2 From Student ............................................................................................................7
4 Project Approach ...........................................................................................................8
4.1 Project Lifecycle Processes......................................................................................8
4.2 Project Management Processes ................................................................................9
4.3 Project Support Processes ........................................................................................9
4.4 Organization .............................................................................................................9
4.4.1 Project Team ...................................................................................................9
4.4.2 Mapping Between Organization and Student .................................................9
5 Communications Plan ..................................................................................................10
6 Work Plan ....................................................................................................................11
6.1 Work Breakdown Structure ...................................................................................11
6.2 Resources ...............................................................................................................11
7 Milestones ....................................................................................................................12
8 Metrics and Results ......................................................................................................13
9 Risks, Constraints, Assumptions..................................................................................14
9.1 Risks .......................................................................................................................14
9.2 Constraints .............................................................................................................14
9.3 Assumptions ...........................................................................................................14
10 Financial Plan...............................................................................................................15
11 Quality Assurance Plan ................................................................................................16
References ..........................................................................................................................18
Appendix ............................................................................................................................19
1
1 Introduction
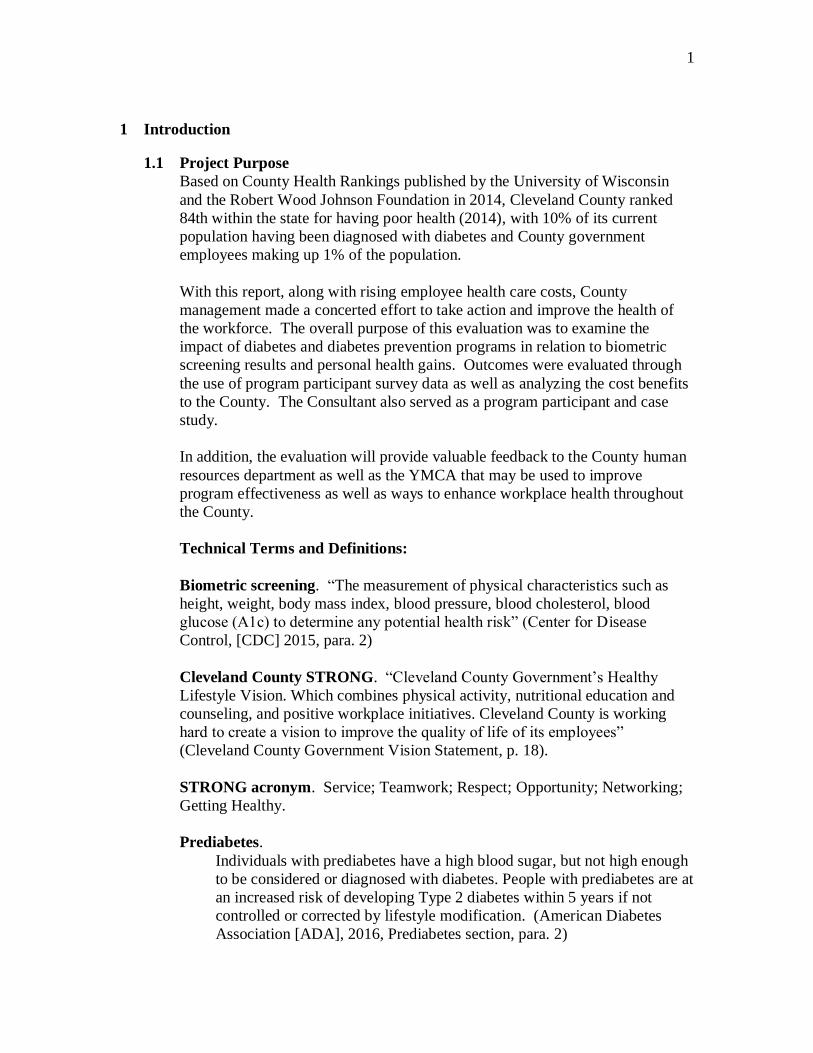
1.1 Project Purpose
Based on County Health Rankings published by the University of Wisconsin
and the Robert Wood Johnson Foundation in 2014, Cleveland County ranked
84th within the state for having poor health (2014), with 10% of its current
population having been diagnosed with diabetes and County government
employees making up 1% of the population.
With this report, along with rising employee health care costs, County
management made a concerted effort to take action and improve the health of
the workforce. The overall purpose of this evaluation was to examine the
impact of diabetes and diabetes prevention programs in relation to biometric
screening results and personal health gains. Outcomes were evaluated through
the use of program participant survey data as well as analyzing the cost benefits
to the County. The Consultant also served as a program participant and case
study.
In addition, the evaluation will provide valuable feedback to the County human
resources department as well as the YMCA that may be used to improve
program effectiveness as well as ways to enhance workplace health throughout
the County.
Technical Terms and Definitions:
Biometric screening. “The measurement of physical characteristics such as
height, weight, body mass index, blood pressure, blood cholesterol, blood
glucose (A1c) to determine any potential health risk” (Center for Disease
Control, [CDC] 2015, para. 2)
Cleveland County STRONG. “Cleveland County Government’s Healthy
Lifestyle Vision. Which combines physical activity, nutritional education and
counseling, and positive workplace initiatives. Cleveland County is working
hard to create a vision to improve the quality of life of its employees”
(Cleveland County Government Vision Statement, p. 18).
STRONG acronym. Service; Teamwork; Respect; Opportunity; Networking;
Getting Healthy.
Prediabetes.
Individuals with prediabetes have a high blood sugar, but not high enough
to be considered or diagnosed with diabetes. People with prediabetes are at
an increased risk of developing Type 2 diabetes within 5 years if not
controlled or corrected by lifestyle modification. (American Diabetes
Association [ADA], 2016, Prediabetes section, para. 2)
2
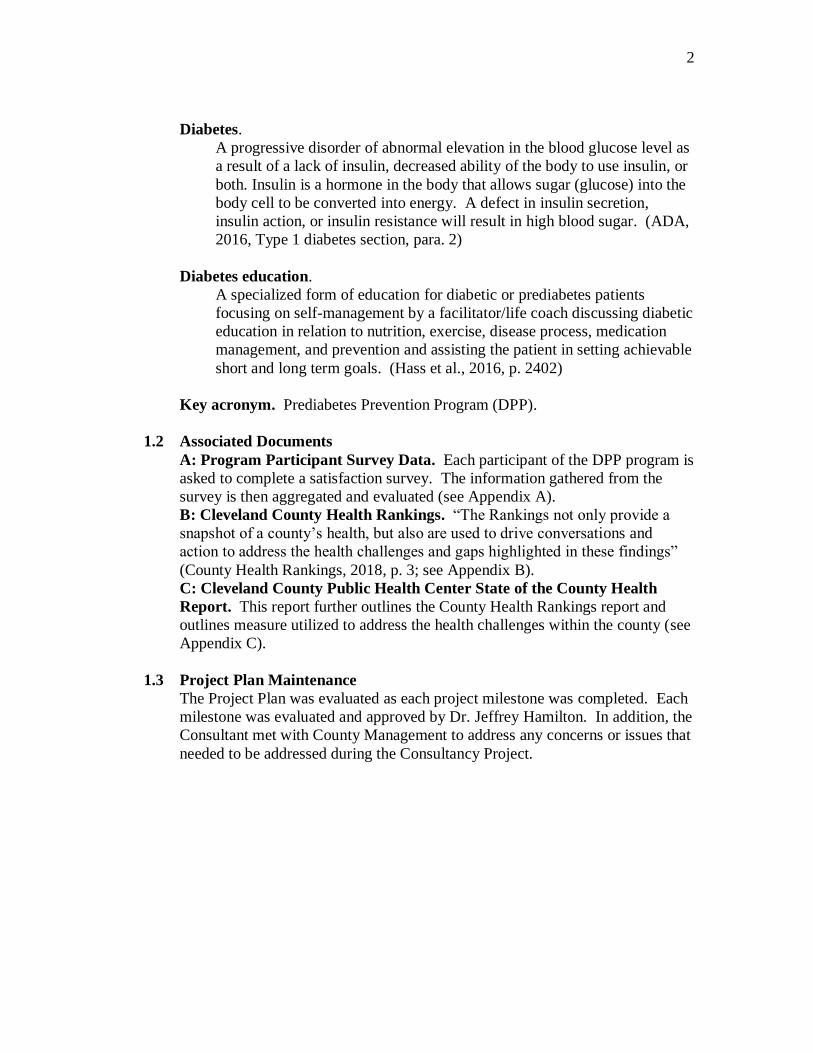
Diabetes.
A progressive disorder of abnormal elevation in the blood glucose level as
a result of a lack of insulin, decreased ability of the body to use insulin, or
both. Insulin is a hormone in the body that allows sugar (glucose) into the
body cell to be converted into energy. A defect in insulin secretion,
insulin action, or insulin resistance will result in high blood sugar. (ADA,
2016, Type 1 diabetes section, para. 2)
Diabetes education.
A specialized form of education for diabetic or prediabetes patients
focusing on self-management by a facilitator/life coach discussing diabetic
education in relation to nutrition, exercise, disease process, medication
management, and prevention and assisting the patient in setting achievable
short and long term goals. (Hass et al., 2016, p. 2402)
Key acronym. Prediabetes Prevention Program (DPP).
1.2 Associated Documents
A: Program Participant Survey Data. Each participant of the DPP program is
asked to complete a satisfaction survey. The information gathered from the
survey is then aggregated and evaluated (see Appendix A).
B: Cleveland County Health Rankings. “The Rankings not only provide a
snapshot of a county’s health, but also are used to drive conversations and
action to address the health challenges and gaps highlighted in these findings”
(County Health Rankings, 2018, p. 3; see Appendix B).
C: Cleveland County Public Health Center State of the County Health
Report. This report further outlines the County Health Rankings report and
outlines measure utilized to address the health challenges within the county (see
Appendix C).
1.3 Project Plan Maintenance
The Project Plan was evaluated as each project milestone was completed. Each
milestone was evaluated and approved by Dr. Jeffrey Hamilton. In addition, the
Consultant met with County Management to address any concerns or issues that
needed to be addressed during the Consultancy Project.

3
2 Project Scope Prior to the inception of the DPP, the Board of County Commissioners as well as the
County Manager’s Office was concerned with the County Health Rankings report as
well as rising employee health care costs. The decision was then made to partner
with the local YMCA to create and support a program that was evidence based to
help control costs. Through these cost savings, monies would be reinvested to
improve employee benefits and compensation. The scope of the study focused only
on participants in Cleveland County’s DPP program during the 2014-2015 fiscal year.
It was limited only to data and information obtained from the interview
questionnaires distributed at the end of the program. Personal experience was also
included as the Consultant was also a participant in the program.
The limitations of the study included participates answering all the questions on the
survey (preventing missing data) and honesty of participant responses due to self-
reporting.
The purpose of this study is to help Cleveland County Government ensure that it
supports the County’s mission to provide a quality wellness program for its
employees. This was measured through the following objectives:
2.1 Outline of Partnering Organization’s Objectives
2.1.1 Objectives
The purpose of this project was to evaluate the impact of the program in
relation to biometric screening results and personal health gains as well as
provide valuable feedback to the County’s Human Resources Department
as well as the YMCA that may be used to improve program effectiveness.
In addition, the following SMART objectives were utilized:

4
Objective Performance Indicators
1. Provide aggregate data of employee
participation in the Prediabetes and
Diabetes prevention classes.
Attendance of Participants? Frequency of
Classes? Mode of Delivery? Successful
completion? Personal Reflection.
2. Was the program beneficial? Did
the program help to improve the
knowledge of employees?
Survey results
3. Employee Satisfaction? Survey Results
4. Did the program improve the health,
habits, or conditions of employees and
for you personally?
Number of those making personal life
changes? Barriers to making changes?
Number achieving goals in regards to
biometric results? Personal health gains?
2.1.2 Success Criteria
The success of the project is measured through biometric screening results
and personal health gains for employees which include lowering blood
glucose, blood pressure, cholesterol, waist circumference, or increasing
physical fitness. In addition, aggregate data from program participant
surveys is used to address program effectiveness. Most importantly,
success is based on lowering bottom line health care costs for the County.
2.1.3 Risks
The main risk factor associated with the project is the implication that
biometric screening results the following year would improve and that
health care costs would decrease.
In addition, a SWOT analysis was also completed to show further risk
factors. A SWOT analysis “is a study undertaken by an organization to
identify its internal strengths and weaknesses, as well as its external
opportunities and threats” (Dubrin, 2013, p. 420).

5
Strengths
Peer Support
Long Term format (12-month
program)
Free YMCA membership
Lifestyle Coaches
Accredited Program
Weaknesses
Length of program
Follow up after graduation
Opportunities
Expansion of programming
Engage the entire family
Expand program curriculum
Threats
Lack of Family Support
Loss of Funding
Loss of motivation from staff
2.2 Outline of Student’s Objectives
2.2.1 Objectives
The Consultant’s main objective was to serve as a Champion for the
project. A Champion as defined by Business Dictionary
is a person who voluntarily takes extraordinary interest in the
adoption, implementation, and success of a cause, policy, program,
project, or product. He or she will typically try to force the idea
through entrenched internal resistance to change, and will evangelize it
throughout the organization. (Business Dictionary, 2018, Section
Champion, para. 1).
In addition, the following objectives were utilized for the Consultancy
Project:
1. This project will help County management gain a deeper
understanding of program effectiveness through quantitative analysis,
resulting in the production of a satisfaction survey.
2. This project will result in a qualitative analysis of the DPP based on
biometric screening results and personal experience.
3. This project will result in the production of a comprehensive report
of the research findings, along with at least two recommendations for
program effectiveness.
2.2.2 Success Criteria
1. This project will help County management gain a deeper understanding
of program effectiveness through quantitative analysis. This will be
obtained through evaluation of biometric screening results as well as the
production of a satisfaction survey.
2. This project will result in a qualitative analysis of the DPP based on
findings from the Consultant as a participant.

6
3. This project will result in the production of a comprehensive report of
the research findings, along with at least two recommended solutions for
program effectiveness identified by the end of July 2018.
2.2.3 Risks
Student risks were minimal as the project was supported by the County
Manager with approval from the Board of County Commissioners;
however, the following risks were considered in relation to program
participation: funding for continuation of the program; the hope for
positive results in biometric screening reports; and the resistance of
program participants to follow the program as outlined by the Coach. It is
assumed that participants in the program will accept the education and
training by the lifestyle coaches, while making positive lifestyle
modifications. There is also an assumption that the project will lower the
health care costs of the County.
Last, a risk that was not considered but became apparent is the lack of
interest in the program from County administration. Due to a change in
administration, other issues took precedent.
See Section 9.1 for Risk Table.
2.3 Definitive Scope Statement
The project evaluated the impact of the program in relation to biometric
screening results. The scope of this project was limited to survey data and
direct savings costs in relation to the program benefits, which led to the
question, should the County renew its contract with the YMCA as a provider of
the diabetes program?

7
3 Deliverables
3.1 To Partnering Organization
The outputs of the project were the cost savings the County would receive if
employees followed the program model.
Deliverables/Benefits/Outputs of the Project
The projected organizational deliverables or outputs of the project included
1. A decrease in overall employee health-related costs
2. To delay/reduce incidences of type II diabetes
3. To enhance the County employee wellness program
4. To inform, educate, and engage staff and stakeholders continually
about diabetes.
5. To improve the health and well-being of Cleveland County staff with
the goal of affecting the County as a whole, especially people most in
need of support and assistance, emphasizing education and prevention
and optimal human service delivery.
6. To identify, collaborate, and coordinate with existing community
resources.
7. To reduce the incidences of diabetes within County government and
improve the quality of life for people living with diabetes.
8. To seek new partnerships and/or leverage relationships to assess and
plan for new resources targeting unmet needs.
9. Seek more opportunities to involve and integrate County departments
in collaborative service delivery.
3.2 From Student
As a program participant, the Consultant is provided the health benefits of the
program.

8
4 Project Approach
4.1 Project Lifecycle Processes
Phase One -- 12-month period (Program Inception)
Project Lifecycle
Process
Outcome
Stage 1 Initial meeting County Management and CEO of YMCA
Stage 2 Follow up meetings County Management, HR Staff, and
YMCA (Several Occurrences)
Stage 3 Research/Benefits/ Cost Analysis
Stage 4 Incorporation into County Benefits program
Stage 5 Assess and Reassess
Stage 6 Analyze program participant survey data
Stage 7 Analyze biometric screening results and cost savings
Stage 8 Assess and Reassess
Phase 2 (Program Participants)
Stage 1 Biometric Screenings
Stage 2 Program Participants informed of screening results
Stage 3 Program begins (weekly sessions)
Stage 4 Introduction of modified eating
Stage 5 Introduction of physical fitness
Stage 6 Weekly to biweekly sessions
Stage 7 Biweekly to Monthly sessions
Stage 8 Program Ends

9
4.2 Project Management Processes
Meetings are held as needed with the County management leadership team
along with YMCA management for program updates and changes needed to
improve the program.
4.3 Project Support Processes
The County Manager, Human Resource Director, YMCA CEO, and wellness
director were all vital supports for the Consultant during the process.
The Consultant participated in a steering committee meeting, Channel 19 news
interview, YMCA Executive Board meeting and Board of County
Commissioners meeting to address the program benefits.
4.4 Organization
4.4.1 Project Team
Project Team consisted of
● County Manager
● Community Service Director/Assistant County Manager
● Human Resource Director
● CEO Cleveland County YMCA
● YMCA Wellness Director
● Consultant
4.4.2 Mapping Between <Organization> and Student
10
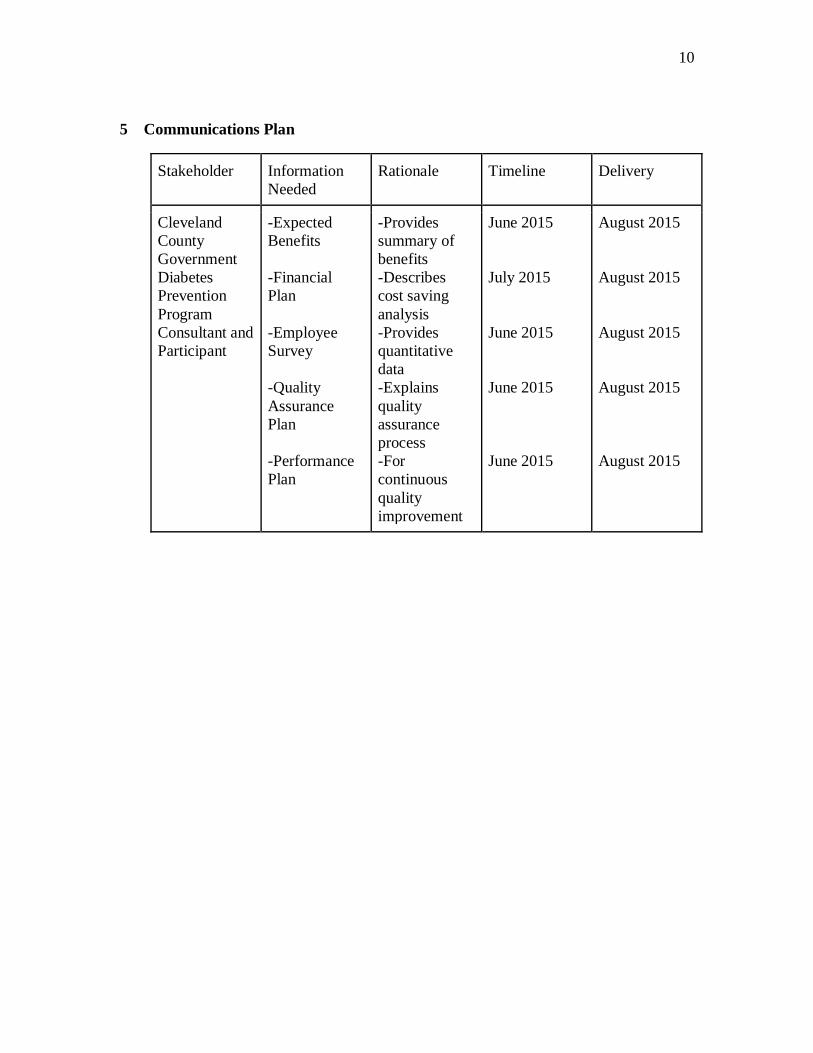
5 Communications Plan
Stakeholder Information
Needed
Rationale Timeline Delivery
Cleveland
County
Government
Diabetes
Prevention
Program
Consultant and
Participant
-Expected
Benefits
-Financial
Plan
-Employee
Survey
-Quality
Assurance
Plan
-Performance
Plan
-Provides
summary of
benefits
-Describes
cost saving
analysis
-Provides
quantitative
data
-Explains
quality
assurance
process
-For
continuous
quality
improvement
June 2015
July 2015
June 2015
June 2015
June 2015
August 2015
August 2015
August 2015
August 2015
August 2015

11
6 Work Plan
6.1 Work Breakdown Structure
Objective Task Sub-Task Begin Date End Date
1. Participation in the
DPP program
Begin Program First Class August 2014 May 2015
Modified Eating October 2014 May 2015
Physical
Activity
January 2015 May 2015
Biometric
Screening
results
April 2014 April 2015
2.Communications plan Create a
communication
plan for the
County
Appendix D August 2016 July 2018
3.Participant in benefit
meetings
Steering
committee
meeting
Speaker July 2015 July 2015
Channel 19 news Interview August 2015 September
2015
County
Commissioners meeting
Speaker September 2015 September
2015
YMCA Executive
Board meeting
speaker
Speaker January 2016 January 2016
5. Compile data Analyze Data
including personal
health gains
July 2015 July 2018
6.2 Resources
Reference Section 6.1.

12
7 Milestones
Milestone
Number
Title Forecast date
1 Develop a detailed statement of purpose of
the project including a clear and
comprehensive problem statement.
December 2015
2 Consultancy project objectives, expressed in
terms that are measurable (SMART
objectives)
May 2016
3 Develop the scope, boundaries, and
organizations, processes, and systems
impacted
May 2016
4 Develop a summary of the business benefits
that are expected
December 2016
5 Develop a Risk Assessment based in the
initial summary of the anticipates risks
associated with the consulting project.
May 2017
6 Develop a detailed summary of the key facts
upon which the consulting project will be
planned and executed
May 2017
7 Develop a detailed outline of a project plan
including specific strategies, activities,
timelines, responsibilities, expected
outcomes, and results (to date)
August 2017
8 Estimated Budget December 2017
9 Develop a quality assurance plan which
includes actions to measure the
effectiveness of project plan phases
May 2018
10 Track and document overall plan
performances
July 2018

13
8 Metrics and Results Cleveland County employs roughly 800 individuals. The annual biometric screening
event took place in April 2015, giving the following aggregate results:
● 77 employees moved from the prediabetes range glucose to normal range
glucose
● 246 employees improved the A1c metric (blood glucose)
The County is self-insured, and the number of health claims has stabilized since a
spike in the 2013-2014 fiscal year:
● In 2014, $950,000 was allocated to the health plan. In 2015, $400,000 was
allocated. This is a $550,000 reduction in costs.
● In 2014, $750,000 was allocated to employee compensation. In 2015,
$2,000,000 was allocated. This is a $1,250,000 increase that was utilized for
compensation.
See Appendix A.

14
9 Risks, Constraints, Assumptions
9.1 Risks and Constraints
During the risk assessment stage of the project, four possible risks became
evident. These included resistance of employees to engage in the program, poor
implementation, poor attendance, and loss of funding.
Risk Description Mitigation Plan Impact Likelihood of
occurrence
Resistance of
employee engagement
One on one meeting
with employers; Tailor
curriculum to meet the
needs of the group.
Increased health
care cost;
Discourage other
program
participants
High
Poor Implementation Peer Observations;
Quarterly training
meetings.
Loss of
engagement from
program
participants
Medium
Poor Attendance Create a required
attendance policy.
Stabilize
attendance
High
Loss of Funding Seek grant opportunities. Increased health
care cost.
Low
9.2 Assumptions
Several assumptions were considered.
1. The belief that participants will answer honestly on the satisfaction survey 2.
The belief that participants will work the program as outlined in the educational
curriculum.
3. The belief that participants will be motivated to utilize skills learned
postgraduation.
4. The belief that participants will make changes in their lifestyle and behavior
to avoid becoming diabetic.
5. Program would lower health care costs of the County.

15
10 Financial Plan Contractually, Cleveland County Commissioners committed to an investment in the
YMCA of $200,000 per year for 3 years. The cost per program participant was $429,
which included membership to the YMCA; however, it is important to note that the
cost of avoidance outweighs any cost that the County incurred during this contractual
agreement. Based on statistics from the Center for Disease Control, a person with
Type II Diabetes has an average health care cost of $17,200 a year with $9,200 of the
total utilized for diabetic needs (2014).
Refer to Appendix E.

16
11 Quality Assurance Plan Continuous progress has been made within the County to address diabetes prevention
and diabetes maintenance, due to the program being accredited through the Center for
Disease Control. The strategies to address quality assurance in this study were
developed in accordance with the Health Impact Pyramid (HIP), illustrated in Figure
1. The HIP “provides a framework for developing public health strategies set by the
(CDC) and focuses on the importance of interventions at multiple levels to achieve
the greatest impact for program participants” (Freiden, 2010, p. 593).
Figure 1. Center for Disease Control Health Impact Pyramid.
The Health Care continuum in Figure 2 looks at ways to improve overall health by
empowering the person to
Acquire knowledge (what to do); Acquire skills (how to do it), Develop
confidence and motivation to perform the appropriate self-care behaviors (want
to do it); Develop the problem-solving and coping skills to overcome any
barriers to self-care behavior (can do it). (Mulcahy, Peeples, & Tomy 2003, p.
795).

17
Figure 2. American Association of Diabetes Educators Health Care Outcomes
Continuum.
Formal quality improvement strategies can lead to improved diabetes outcomes.
By measuring and monitoring both process and outcome data on an ongoing
basis, we will be able to identify areas of improvement and adjust participant
engagement strategies and service offerings accordingly. Evaluation including
positive results can contribute to the sustainability of the program. The Institute
for Health Care Improvement suggests three fundamental questions that should be
answered by a quality improvement process: What are we trying to accomplish?
How will we know a change is an improvement? And what changes can we make
that will result in an improvement? This can be further illustrated through the
Deming Model, Plan, Do, Check, Act as an internal method to aid in the process
of quality improvement.
Plan: Establish objectives and processes necessary to deliver results.
Do: Execute the plan and implement the processes. Collect data for analysis.
Check: Analyze the actual results.
Act: Identify corrective actions

18
References
American Diabetes Association. (2016) Diabetes care. Retrieved from
http://care.diabetesjournals.org/content/39/Supplement_1/S13.full-text.pdf
American Diabetes Association. (2018). Diabetes basics. Retrieved from
www.diabetes.org
Centers for Disease Control and Prevention. (2015). Pre-diabetes. Diabetes.
Diabetes prevention programs. Retrieved from
https://www.cdc.gov/diabetes/basics/diabetes.html
Champion. BusinessDictionary.com. Retrieved from
http://www.businessdictionary.com/definition/champion.html
Cleveland County Government. (2018). Vision statement. Retrieved from
www.clevelandcounty.com
Dubrin, A. (2013). Leadership, research findings, practice, and skills. Mason, OH:
Cengage Learning.
Frieden, T. R. (2010). A framework for public health action: The health impact pyramid.
American Journal of Public Health, 100(4), 590-595. Retrieved from
http://doi.org/10.2105/AJPH.2009.185652
Haas, L. Maryniuk, M., Beck, J., Cox, C., Duker, P., Edwards, L., . . . Youssef, G.
(2012). National standards for diabetes self-management education and support.
Diabetes Care, 35(11), 2393-2401 doi:10.2337/dc12-1707
Institute for Healthcare Improvement. (2018). Diabetes care. Retrieved from
http://www.ihi.org/
Mulcahy, K., Peeples, M., & Tomy, D. (2003). Diabetes self-management education
core outcome measures. The Diabetes Education Journal, 29, 768-803.
19
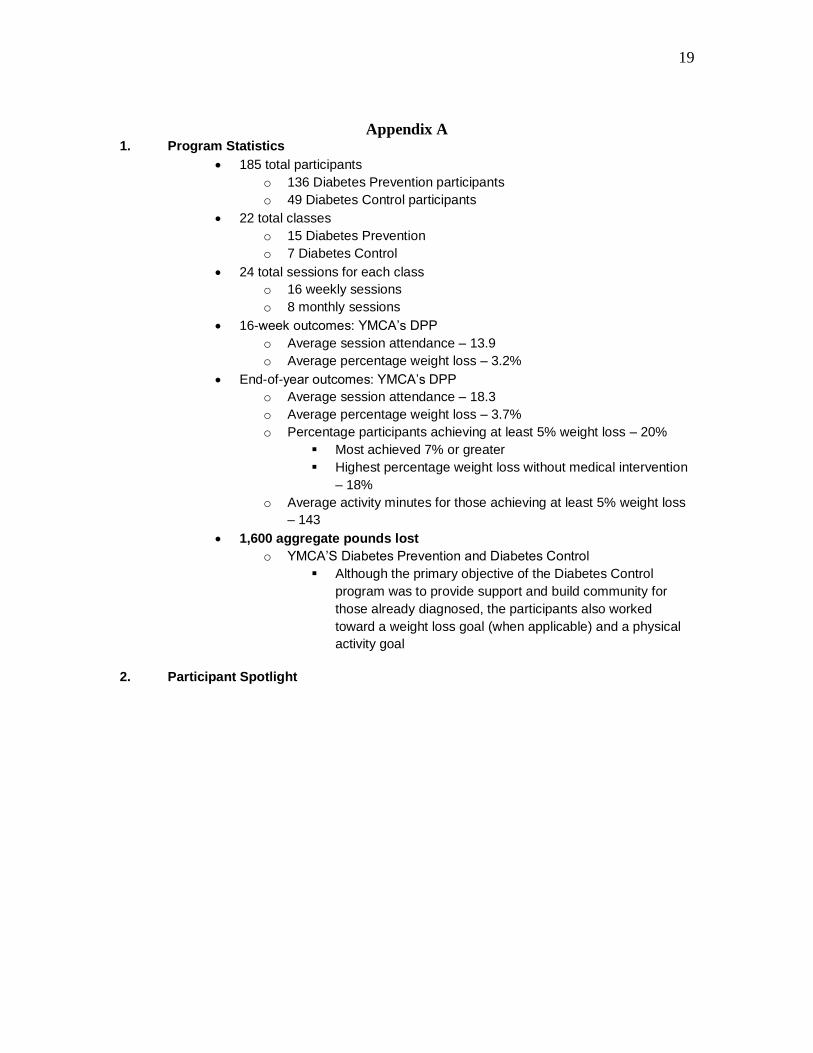
Appendix A 1. Program Statistics
• 185 total participants
o 136 Diabetes Prevention participants
o 49 Diabetes Control participants
• 22 total classes
o 15 Diabetes Prevention
o 7 Diabetes Control
• 24 total sessions for each class
o 16 weekly sessions
o 8 monthly sessions
• 16-week outcomes: YMCA’s DPP
o Average session attendance – 13.9
o Average percentage weight loss – 3.2%
• End-of-year outcomes: YMCA’s DPP
o Average session attendance – 18.3
o Average percentage weight loss – 3.7%
o Percentage participants achieving at least 5% weight loss – 20%
▪ Most achieved 7% or greater
▪ Highest percentage weight loss without medical intervention
– 18%
o Average activity minutes for those achieving at least 5% weight loss
– 143
• 1,600 aggregate pounds lost
o YMCA’S Diabetes Prevention and Diabetes Control
▪ Although the primary objective of the Diabetes Control
program was to provide support and build community for
those already diagnosed, the participants also worked
toward a weight loss goal (when applicable) and a physical
activity goal
2. Participant Spotlight

20
3. End-of-Program Survey Results
• 114 completed surveys received – some responses left blank
o 62 indicated interest in an ongoing monthly program to provide support
and continued resources
o Identified those willing to be group leaders
o Identified those willing to share experience with others
o Anecdotal evidence concerning positive changes in habits/health –
awareness, accountability, support
Please share how strongly you agree or disagree with the following statements about your Lifestyle Coach:
Strongly Agree
Agree Neutral Disagree Strongly Disagree
Delivers session content in a clear manner, ensuring comprehension
83% (95) 14% (16) 3% (3)
Collects all information necessary for the session in a way that protects the privacy of participants
83% (95) 15% (17) 2% (2)
Refrains from judgmental comments or responses
83% (94) 14% (16) 3% (3)
Consistently provides encouragement
88% (100) 11% (12) 2% (2)

21
Please share how strongly you agree or disagree with the following statements about this program:
Strongly Agree
Agree Neutral Disagree Strongly Disagree
I felt supported by all of the YMCA’s Diabetes Prevention staff.
61% (69) 26% (30) 5% (6) 1% (1)
Being part of a supportive group was very important to my success in this program.
44% (50) 42% (48) 7% (8) 1% (1) 1% (1)
I will continue to use the skills and tools I gained from this program in the future.
55% (63) 37% (42) 2% (2) 1% (1)
This program has positively impacted my health.
54% (61) 33% (38) 7% (8) 1% (1) 1% (1)
This program has positively affected the health of my family/loved ones.
31% (35) 31% (35) 31% (35) 1% (1) 2% (2)
I would recommend this program to a friend or family member.
55% (63) 30% (34) 6% (7) 3% (3) 1% (1)
I have developed lasting relationships as a result of participating in this program.
46% (53) 26% (30) 24% (27) 3% (3) 1% (1)
I plan to keep tracking what I eat and/or my physical activity now that the program has ended.
36% (41) 27% (31) 25% (28) 5% (6) 2% (2)

22
Since participating in the YMCA’s Diabetes Prevention and Control Program, I have…
Strongly Agree
Agree Neutral Disagree Strongly Disagree
Incorporated physical activity into my daily routine
44% (50) 39% (44) 14% (16) 3% (3)
Reduced my portion sizes 43% (49) 36% (41) 11% (12) 2% (2) Paid more attention to nutrition labels on food/drinks
63% (72) 28% (32) 7% (8) 1% (1)
Consistently tracked what I eat/drink
22% (25) 33% (38) 32% (36) 11% (13) 3% (3)
4. Areas of Opportunity
• Program structure changes (September 1, 2015) o Sessions 1-16 delivered weekly o Sessions 17-19 delivered every other week o Sessions 20-25 delivered monthly o Physical activity minutes captured at every session, not the first 16 o Standardized delivery of sessions 17-25
• Attendance record keeping o Revised attendance policy to reflect structural changes to program o Created Absence Request/Report form to increase employee
accountability for each absence o Implemented protocol for sharing information with County HR
• Monitor Lifestyle Coach performance o Observation Assessment Tool o Peer observation o Quarterly meetings o Continued education
▪ Annual HIPAA certification ▪ Orientation to Healthy Living at the Y ▪ Facilitating Change in Small Groups ▪ Lifestyle Coach Skills Refresh
o Annual performance reviews based on data
• Support physical activity program goal o Required visit to the YMCA branch with group o Wellness orientation o Mentor/”buddy” system o County employee appreciation day/week o Promote 5K opportunities
• Support specific departments under leadership of health coach o 911 communications
5. Next Steps – January 2016
• Ongoing support and resources as we recognize the need to continue to
focus on wellness initiatives & what happens after the year-long program
ends
o Foster the established group dynamic

23
o Hold bi-weekly “check-in” sessions lead by County employees who are
“champions” of the program
o Hold quarterly (or more frequent) seminars, utilizing County resources
Topics Desired (in order of most to least survey responses):
Dining out/convenience eating Small group personal training Stress management Cooking demonstrations Meal planning on a fixed income “Biggest Loser” contest Couch to 5K training Navigating the grocery store Reading food labels Dispelling health and wellness myths Using technology for wellness Health “buzz words”

24
Appendix B
County Health Rankings 2015: North Carolina
HOW DO COUNTIES RANK FOR HEALTH OUTCOMES?
The green map below shows the distribution of North Carolina’s health outcomes, based
on an equal weighting of length and quality of life. Lighter colors indicate better
performance in the respective summary rankings. Detailed information on the underlying
measures is available at countyhealthrankings.org.
County Rank Cleveland 84
The County Health Rankings & Roadmaps program helps communities identify and
implement solutions that make it easier for people to be healthy in their schools,
workplaces, and neighborhoods. Ranking the health of nearly every county in the nation,
the County Health Rankings illustrate what we know when it comes to what is making
people sick or healthy. The Roadmaps show what we can do to create healthier places to
live, learn, work, and play. The Robert Wood Johnson Foundation (RWJF) collaborates
with the University of Wisconsin Population Health Institute (UWPHI) to bring this
program to cities, counties, and states across the nation.

25
Appendix C
State of the County Health Report
Cleveland County, North Carolina
PRESS RELEASE FOR
IMMEDIATE RELEASE Contact:
DeShay Oliver, PIO Cleveland County Health Department 980-484-5199
Wednesday, March 23, 2016
County Health Rankings Show Where We Live Matters to Our Health (Shelby, NC)—
Each year, the University of Wisconsin Population Health Institute in partnership with
the Robert Wood Johnson Foundation release the County Health Rankings. These
rankings compare the overall health of nearly every county in the nation, with the goal of
showing that where you live influences how well and how long you live. With a ranking
of 1 indicating the healthiest county and a ranking of 100 indicating the least healthy
county in North Carolina, Cleveland County received a ranking of 80 according to the
2016 annual County Health Rankings. This is an improvement from the 2015 county
health ranking of 86. This improvement in overall county health ranking appears to be
primarily as a result of improvements in the measureable health outcome of
morbidity/quality of life and the health factor of clinical care. In the category of
morbidity/quality of life, we saw a decrease in reported poor physical health days from
2015 to 2016 as well as a decrease in reported poor mental health days. In the health
factor of clinical care, the percentage of uninsured adults in Cleveland County decreased
from 18% in 2015 to 16% in 2016. Furthermore, the rate of preventable hospital stays
among our Medicare population decreased, and the percentage of Medicare recipients
who participated in mammography screenings increased. Last, the ratio of both primary
care physicians and mental health providers to the number of residents in Cleveland
County improved from 2015 to 2016. Despite Cleveland County’s overall improvement

26
in the County Health Rankings and notable improvements in the areas of
morbidity/quality of life and clinical care, the rankings also help to identify areas that
need improvement. Perhaps most noticeable is the regression in Cleveland County’s
health behaviors ranking from 55 in 2015 to 59 in 2016. This regression is marked by an
increase in adult obesity from 29% in 2015 to 32% in 2016. Excessive drinking also
increased from 2015 to 2016, rising from 10% to 14%. Despite these regressions, there
were also some marked improvements in the category of health behaviors. Adult smoking
decreased from 24% in 2015 to 20% in 2016. Also, while the reported percentage of
excessive drinking increased, the percentage of alcohol-impaired driving deaths
decreased from 27% in 2015 to 24% in 2016. Last, both the rate of sexually transmitted
infections and rate of teen births in Cleveland County decreased significantly from 2015
to 2016. As stated by DeShay Oliver, Public Information Officer for the Cleveland
County Health Department, “The health factors category of Health Behaviors is an area
that the health department continues to work diligently to improve. We provide numerous
programs and information, run media campaigns, and even work to make individuals’
environments more conducive to making healthy choices. However, when it comes down
to it, the behaviors in this category are individual choices. Even if armed with the right
information, knowledge and resources, someone can still choose to participate in
unhealthy behaviors such as excessive drinking, unhealthy eating or failure to exercise.
We want to ensure individuals live in an environment that encourages healthy behaviors
and individuals have the information and resources to do so. Then, it is up to them to do
the right thing to take care of themselves.” Social and economic factors is a category that
is very difficult to change that can have a major impact on an individual’s overall health.
This is another category in which Cleveland County saw a regression, going from a
ranking of 59 in 2015 to 66 in 2016. This is marked by statistics such as 31% of our
children living in poverty, 40% of our children living in single-parent households, and
7.1% of our employable population being unemployed. “Social and economic factors can
impact individuals’ ability to choose and practice healthy behaviors,” says Oliver. “For
example, healthy foods such as fresh fruits, vegetables and meats are more expensive
than processed foods. Individuals may lack transportation, making it more difficult to
access grocery stores, healthcare, or physical activity opportunities. Individuals may live
in an area where they feel it is unsafe to allow their children to play outside, especially in
areas that are not well-lit or lack sidewalks, playgrounds, etc. There are numerous factors,
many of which are environmental, that can impact health behaviors and overall health
status. We must be mindful of this.” Despite regressions in the category of social and
economic factors, there are noteworthy improvements as well such as an increase in the
high school graduation rate and a decrease in the rate of injury deaths. Furthermore,
although our unemployment percentage is higher than we would like to see it at 7.1%,
this is a great improvement when compared to the 2015 percentage of 8.9. Improvements
in the social and economic factors category should be celebrated, as these indicators can
be the most difficult to target and change. This is the seventh year of the County Health
Rankings, the most comprehensive report of its kind to rank the overall health of nearly
every county in all 50 states by using a standard way to measure how healthy people are
and how long they live. The Rankings help everyone see how where people live, learn,
work and play influence their health and behaviors. The Rankings are available online at

27
www.countyhealthrankings.org. For additional information on Cleveland County’s health
ranking, or for assistance in interpreting the data available on the County Health
Rankings website, you may contact the Cleveland County Health Department at 980-484-
5199. ###

28
Appendix D
Introduction
Social Media Purpose for Cleveland County Government
To enhance service delivery for clients and staff through the efficient use of social media
technology.
Social Media Vision Statement
Our social media vision is to be better connected with employee and client needs, to
better inform and engage them in the process of benefits.
Description
• To inform, educate and engage staff and stakeholders continually about diabetes.
• To improve the health and well-being of Cleveland County staff with the goal of
affecting the County as a whole, especially people most in need of support and
assistance, emphasizing education and prevention and optimal human service
delivery.
• To identify, collaborate, and coordinate with existing community resources.
• To reduce the incidences of diabetes within County government and improve the
quality of life for people living with diabetes.
• To seek new partnerships and/or leverage relationships to assess and plan for new
resources targeting unmet needs.
• Seek more opportunities to involve and integrate County departments in
collaborative service delivery.
Elements of the plan
INTERNAL COMMUNICATIONS
Strategy: Provide important, timely and accurate information to all employees using a
variety of communication channels.
Rationale: Develop a communication strategy that instills better understanding, positive
reinforcement, and team work through better communication between departments,
management, staff, and the public.
Action Steps:

29
• Use Cleveland County Wiki (County intranet) as a main avenue to continually
communicate
information to employees.
• Send all County emails when needed to communicate urgent information to employees.
• Provide an Employee Newsletter to employees weekly to highlight events and feature
stories.
• Use digital and multimedia (video, streamed content, etc.) channels – video, streaming
content, etc. – to
create content about employees who have been successful in the program.
• Create and produce posters, bulletin boards, mailed letters, and other products as
needed.
• Utilize social media sites including Twitter, Facebook and Instagram.
________________________________________________________________________
WEB SERVICES
Strategy: Use the County’s external and internal web sites to communicate County
information to the public and employees. Proactively promote County information as
media stories and seek media coverage.
Rationale: To increase community outreach, strengthen relationships with community
leaders, and educate constituents about what’s going on in the County.
Action Steps:
• Post external information to ClevelandCounty.com.
• Post internal information to Cleveland County Wiki and share with employees.
• Utilize video, digital and multimedia content to support and enhance communication.
________________________________________________________________________
SOCIAL MEDIA
Strategy: Use the County’s social media to communicate County information to the
public and employees.
Rationale: Utilizing Social Media channels provide proactive communication of timely
and relevant information about the programs, services and results that Cleveland County
offers to the community. Centrally managing these sites decreases repetition and
increases the number of followers, likes and users for County social media accounts, as
well as the number of viewers reached by posting videos on those sites.
Action Steps:
• Share external information via the County’s social media sites (Facebook, Twitter,
Instagram, and
YouTube).
• Utilize video, digital and multimedia content to support and enhance communication.

30
• Create a Social Media Policy.
• Collect daily media inquiries from around the County.
_____________________________________________________________________
COMMUNITY RELATIONS
Strategy: Encourage proactive community engagement with County leadership,
Departments, and Stakeholders.
Rationale: Community engagement campaigns will encourage increased awareness
within the Community. Engagement activities will be focused around County
initiatives and delivered based on interest.
Action Steps:
• Implement strategic community relations plan to guide current and future efforts.
• Hold community meetings and meet with key stakeholders specifically related to
major County initiatives.
• Speak to groups and organizations proactively and regularly about County services.
Help plan and execute community meetings for Board of County Commissioners as
needed.
• Communicate using direct communication methods tailoring outreach to fit all
demographic groups.
• Help plan and execute special event planning and facilitation as needed.
DIRECT COMMUNICATIONS
Strategy: Provide important, timely and accurate information to residents and customers
using a variety of communication channels.
Rationale: Raising public awareness of current initiatives will increase program
participation.
Action Steps:
• Raise public awareness of the decisions made by the County Commission and the
County Manager using
multiple channels.
• Provide County information via the web, social media, and the news media.
• Develop County-wide branding and marketing strategy.
• Utilize video, digital and multimedia content to enhance communication.
• Design and produce printed materials.
• Manage events (Couch to 5k)
• Develop marketing and advertising campaigns for County departments.
• Create custom communication plans products to address client needs.

31
Completion Date
• July 1, 2018
Updates/project milestones
• Continue to raise awareness in the community and with employees about
major County initiatives and health care benefits changes.
• Meet with department directors and other leaders to learn about specific
communication needs and develop solutions to help them achieve their goals.
• Partner with departments to share information and resources, and maximize
the effectiveness of County marketing efforts that raise awareness and change
behavior with limited resources.
• Implement approved Social Media Strategy, including employee social media
guidelines.
• Track outputs and user data through Google Analytics
• Implement and improve employee social media use
• Implement Facebook advertising process for County-wide use
• Train and help administrators and content providers receive the most out of
their social media efforts.
• Continue to develop brochures, presentations, and handouts to inform external
stakeholders about the countywide revaluation and promote public awareness
about the assessment process.
Audience
Cleveland County Board of County Commissioners (BOCC)
Cleveland County Manager and staff
Cleveland County residents
Cleveland County employees and Sheriff’s Office
Local media outlets
Community partners – non-profit organizations
Local Municipalities
Businesses
Summary
Cleveland County is the gateway between Asheville and Charlotte and is centered
between two of the largest metropolitan areas of the Carolinas, Charlotte and
Greenville/Spartanburg. Information is fluid and must be constantly updated to be
effective. There is a need for the County to hire a Communications Director/Social Media
Specialist and/or Public Information Officer to aid in the process of distributing vital

32
information to the community and employees. In addition to annually updating this plan,
the PIO should meet with County departments each year to determine specific
communication needs. Those plans will be incorporated into this plan as they are
developed and implemented.
Program Costs
Adding the diabetes prevention lifestyle improvement program has been a cost-effective
use of resources: The cost of preventing diabetes is typically much smaller than the cost
of managing the complications of type 2 diabetes. The cost per person of offering the
lifestyle change program is about $500, depending on factors such as promotion,
recruitment, staff and logistics costs. The annual cost of an employee with diabetes is
$13,243; whereas the annual cost of an employee without diabetes is $2,560 (Diabetes
America). The CDC has determined that intensive lifestyle interventions to prevent type
2 diabetes among people with impaired glucose tolerance are “very cost-effective” and in
many cases, cost saving.

33
Appendix E
Annual out-
of-pocket medical cost
of someone without
diabetes:
$3,673
Annual out-
of-pocket medical cost
of someone with
diabetes:
$9,202
Annual out-
of-pocket medical cost
of someone with diabetes
and associated
conditions:
$17,762
Economic Costs of Diabetes in the U.S. in 2012.” Diabetes Care. March 6, 2013.
Centers for Disease Control and Prevention. National diabetes fact sheet: national estimates and general information on diabetes and prediabetes in the United States,
2011. Atlanta, GA: U.S. Department of Health and Human Services, Centers for Disease Control and Prevention, 2011.