The Importance of the COBIT Framework IT Processes For Effective Internal Control over the...
25
The Importance of the COBIT Framework IT Processes For Effective Internal Control over the Reliability of Financial Reporting: An International Survey UWCISA Symposium, October 11-13, 2007, Toronto, Canada Uday Murthy University of South Florida David S. Kerr University of North Carolina at Charlotte
-
Upload
victor-park -
Category
Documents
-
view
218 -
download
0
Transcript of The Importance of the COBIT Framework IT Processes For Effective Internal Control over the...

The Importance of the COBIT Framework IT Processes For Effective Internal Control over the Reliability of
Financial Reporting: An International Survey
UWCISA Symposium,
October 11-13, 2007, Toronto,
Canada
Uday MurthyUniversity of South Florida
David S. KerrUniversity of North Carolina at Charlotte

2
Introduction and Background
Publicly held companies must have a system of internal controls, per regulatory requirements
Internal controls are heavily “IT-dependent” Need for strong IT governance COBIT – a framework for IT governance
Specifies “best practices” for IT processes Conformance to COBIT IT processes should
result in better internal control

3
Motivation
To understand the extent to which the COBIT IT processes contribute to effective internal control over the reliability of financial reporting Given limited resources, are there certain “key”
processes that organizations should focus on from the viewpoint of reliability of financial reporting?
To determine whether demographic variations in IT auditors explain differences in perceptions regarding the value of COBIT

4
COBIT
Control OBjectives for Information and related Technology
Focus of COBIT is on the management and control of IT Comprises 34 IT processes organized into 4 domains
Plan and Organize (plan) Acquire and Implement (build) Deliver and Support (run) Monitor and Evaluate (monitor)

5
Figure 1: COBIT Framework

6
Prior Work
COBIT usage survey by Guldentops and De Haes (2002) Profile of COBIT adopters (n=182)
Almost half of the respondents were from the Americas Most over 1,000 employees with 1/3rd > 10,000 employees 90% of responding organizations used COBIT Uses: audit planning and audit program development, validate current
IT controls, to evaluate IT risks, to reduce IT risks, and as a framework for improving IT
~ 40% of respondents indicated that their control framework and audit process was partly COBIT-based; less than 5% of respondents indicated that COBIT had been formally adopted and was enforced as corporate policy

7
Research Questions
RQ1: In the context of the reliability of financial reporting, what is the relative importance of each of the 34 IT control and security processes?
RQ2: In the context of the reliability of financial reporting, to what extent does the relative importance of each of the 34 IT control and security processes vary as a function of characteristics of the IT professionals within the organization?
8
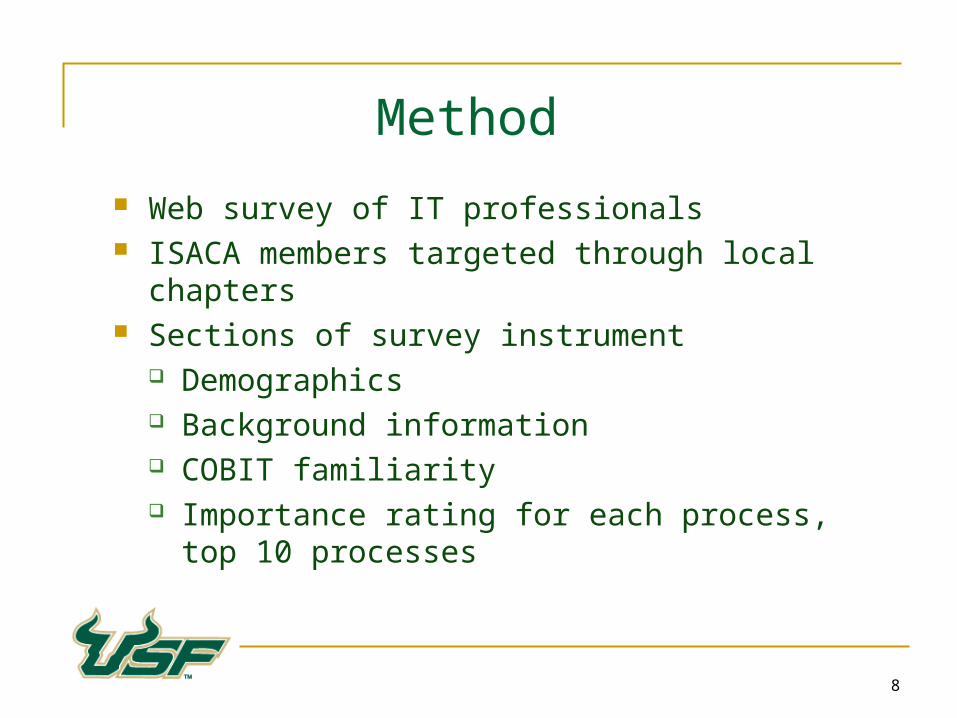
Method
Web survey of IT professionals ISACA members targeted through local chapters Sections of survey instrument
Demographics Background information COBIT familiarity Importance rating for each process, top 10 processes

9
Respondents 189 respondents from 21 countries Average age: 40.1 years Gender: 71% were male. Working in…
industry: 66% public accounting: 18% government: 16%
Average time with current employer: 5.8 years Degrees: 38% masters; 57% bachelors Certifications: 58% CISAs

10
Selected Demographics
TIME SPENT REVIEWING IT
CONTROLS Frequency Percent
Less than 10% 18 9.5 10% - 25% 39 20.6 26% - 50% 34 18.0 51% - 75% 33 17.5
Greater than 75% 65 34.4
Familiarity with COBIT*
Frequency Percent
1 2 1.1 2 11 5.8 3 60 31.7 4 55 29.1 5 61 32.3
* 1 = Not at all familiar; 3 = Somewhat familiar; 5 = Very familiar

11
Table 2COBIT Processes Sorted by Mean Importance Ratings
COBIT
Process* Description of process
Mean importance rating
DS5 Ensure System Security 4.661
AI6 Manage Changes 4.487
PO9 Assess Risk 4.413
DS11 Manage Data 4.333
M2 Assess Internal Control Adequacy 4.328
PO8 Ensure Compliance with External Requirements 4.222
DS10 Manage Problems and Incidents 4.101
AI4 Develop and Maintain Procedures 4.085
M1 Monitor the Process 4.079
PO11 Manage Quality 4.074
DS4 Ensure Continuous Service 4.048
M4 Provide for Independent Audit 4.021
DS7 Educate and Train Users 4.005
PO10 Manage Projects 3.952
M3 Obtain Independent Assurance 3.947
DS9 Manage the Configuration 3.931
PO2 Define the Information Architecture 3.884

12
Table 2 (contd.)COBIT Processes Sorted by Mean Importance Ratings
COBIT
Process* Description of process
Mean importance rating
DS13 Manage Operations 3.884
PO1 Define a strategic IT plan 3.878
AI5 Install and Accredit Systems 3.873
PO6 Communicate Management Aims and Directions 3.825
AI3 Acquire and Maintain Technology Infrastructure 3.815
AI2 Acquire and Maintain Application Software 3.799
DS2 Manage Third-party Services 3.783
PO4 Define the IT Organization and Relationship 3.746
DS12 Manage Facilities 3.730
DS1 Define and Manage Service Levels 3.714
DS3 Manage Performance and Capacity 3.714
PO5 Manage the Information Technology and Relationships 3.709
PO7 Manage Human Resources 3.640
AI1 Identify Automated Solutions 3.566
PO3 Determine the Technological Direction 3.545
DS6 Identify and Allocate Costs 3.407
DS8 Assist and Advise Consumers 3.238

13
Table 3Number of times each IT process was selected as a “Top 10” process
COBIT process Description of process Top 10 count
DS5 Ensure System Security 147
AI6 Manage Changes 133
PO9 Assess Risk 122
M2 Assess Internal Control Adequacy 98
DS11 Manage Data 97
PO1 Define a strategic IT plan 91
M1 Monitor the Process 81
AI4 Develop and Maintain Procedures 74
DS10 Manage Problems and Incidents 70
DS7 Educate and Train Users 66
PO8 Ensure Compliance with External Requirements 64
M4 Provide for Independent Audit 58
M3 Obtain Independent Assurance 55
DS4 Ensure Continuous Service 51
DS9 Manage the Configuration 50
PO10 Manage Projects 49
PO2 Define the Information Architecture 48

14
Table 3 (contd.)Number of times each IT process was selected as a “Top 10” process
COBIT process Description of process Top 10 count
AI2 Acquire and Maintain Application Software 46
PO11 Manage Quality 45
PO6 Communicate Management Aims and Directions 44
AI3 Acquire and Maintain Technology Infrastructure 39
PO4 Define the IT Organization and Relationship 38
DS1 Define and Manage Service Levels 38
DS13 Manage Operations 36
PO5 Manage the Information Technology and Relationships 35
AI5 Install and Accredit Systems 35
PO7 Manage Human Resources 34
DS2 Manage Third-party Services 31
DS3 Manage Performance and Capacity 29
PO3 Determine the Technological Direction 24
DS6 Identify and Allocate Costs 20
AI1 Identify Automated Solutions 19
DS12 Manage Facilities 17
DS8 Assist and Advise Consumers 6

15
Table 4Factor Analysis Results: Rotated Component Matrix
COBIT process
Factor 1 Factor 2 Factor 3 Factor 4 Factor 5 Factor 6
Key processes: General & application
controlsPlanning and IT mgmt processes
Organization and relationships
processesTechnology processes
Operations and facilities processes
Independent audit processes
AI6: Manage Changes .787 .121 .104 .120 .117 .098
DS5: Ensure System Security.755 .196 .145 .175 .130 .114
DS11: Manage Data .734 .197 -.050 .153 .294 .033
M2: Assess Internal Control Adequacy .673 .067 .239 -.011 .056 .390
AI4: Develop and Maintain Procedures .643 .041 .176 .348 .050 .143
PO9: Assess Risk .624 .092 .417 .093 .138 .221
DS10: Manage Problems and Incidents .584 .431 .166 .000 .354 .074
M1: Monitor the Process .551 .254 .244 -.056 .245 .318
DS7: Educate and Train Users.533 .326 .171 .274 .102 .081
AI5: Install and Accredit Systems.497 .083 .057 .458 .262 .165
DS4: Ensure Continuous Service.280 .764 -.002 .149 .178 -.023
DS3: Manage Performance and Capacity .186 .711 .249 .132 .269 .131
DS1: Define and Manage Service Levels .202 .693 .242 .066 .235 .197
PO3: Determine the Technological Direction -.011 .649 .511 .251 -.011 -.004
PO1: Define a strategic IT plan.158 .648 .428 -.011 .036 .040
DS8: Assist and Advise Consumers-.010 .616 .210 .177 .343 .263
DS6: Identify and Allocate Costs-.015 .590 .252 .148 .217 .478
PO10: Manage Projects .282 .543 .181 .300 .019 .039
PO11: Manage Quality .484 .485 .164 .159 -.064 .063

16
Table 4 (continued)Factor Analysis Results: Rotated Component Matrix
Factor 1 Factor 2 Factor 3 Factor 4 Factor 5 Factor 6
COBIT process
Key processes: General & application
controlsPlanning and IT mgmt processes
Organization and relationships
processesTechnology processes
Operations and facilities processes
Independent audit processes
PO4: Define the IT Organization and Relationship
.138 .285 .759 .063 .147 .131
PO5: Manage the Information Technology and Relationships
.148 .209 .711 .091 .171 .180
PO6: Communicate Management Aims and Directions
.133 .510 .587 .071 .083 .086
PO7: Manage Human Resources.167 .280 .572 .165 .245 .134
PO2: Define the Information Architecture .266 .454 .566 .148 -.095 -.067
PO8: Ensure Compliance with External Requirements .388 .032 .520 .179 .263 -.002
AI2: Acquire and Maintain Application Software .283 .126 .188 .800 .131 -.023
AI3: Acquire and Maintain Technology Infrastructure .140 .242 .256 .707 .306 -.012
AI1: Identify Automated Solutions.160 .408 -.008 .656 -.085 .285
DS13: Manage Operations.444 .185 .272 .185 .606 .252
DS2: Manage Third-party Services.247 .351 .223 .084 .577 -.043
DS12: Manage Facilities .293 .338 .109 .167 .570 .315
DS9: Manage the Configuration.409 .042 .393 .277 .546 .075
M3: Obtain Independent Assurance.441 .109 .158 .086 .048 .765
M4: Provide for Independent Audit.458 .156 .086 .086 .163 .672

17
Table 5Ratings of Technology Processes by Employment Type
Employment type Mean* Std. Deviation NPublic accounting 4.0505 .67762 33
Industry 3.6640 .83671 124
Government 3.6022 .65783 31
Total 3.7216 .79507 188
Panel A: Descriptive Statistics* 1=Not at all important; 5=Very important.
Source
Type III Sum of Squares df Mean Square F Sig.
Corrected Model 4.424(a) 2 2.212 3.596 .029
Intercept 1813.311 1 1813.311 2948.191 .000
Employment 4.424 2 2.212 3.596 .029
Error 113.786 185 .615
Total 2722.111 188
Corrected Total 118.210 187
Panel B: Tests of Between-Subjects Effects
a R Squared = .037 (Adjusted R Squared = .027)

18
Table 6Ratings of Technology Processes: North America vs. Rest of the World
Panel A: Descriptive Statistics* 1=Not at all important; 5=Very important.
Panel B: Tests of Between-Subjects Effects
a R Squared = .017 (Adjusted R Squared = .011)
Country Mean* Std. Deviation NUSA or Canada 3.8197 .80259 98
All other countries3.6148 .77719 90
Total 3.7216 .79507 188
Source
Type III Sum of Squares df Mean Square F Sig.
Corrected Model 1.970(a) 1 1.970 3.152 .077
Intercept 2593.100 1 2593.100 4149.321 .000
Country 1.970 1 1.970 3.152 .077
Error 116.240 186 .625
Total 2722.111 188
Corrected Total 118.210 187

19
Table 7Extent of COBIT familiarity by Audit Experience
Panel A: Descriptive Statistics* 1=Not at all familiar; 5=Very familiar.
Panel B: Tests of Between-Subjects Effects
a R Squared = .048 (Adjusted R Squared = .043)
Extent of audit experience Mean*
Std. Deviation N
Relatively less (four years or less)
3.65 .902 97
Relatively more (more than 4 years)
4.08 1.014 91
Total 3.86 .979 188
Source
Type III Sum of Squares df
Mean Square F Sig.
Corrected Model 8.578(a) 1 8.578 9.356 .003
Intercept 2802.919 1 2802.919 3056.940 .000
Audit Exp 8.578 1 8.578 9.356 .003
Error 170.544 186 .917
Total 2975.000 188
Corrected Total 179.122 187

20
Table 8Extent of work relating to task of reviewing/evaluating IT controls:
North America vs. Rest of the World
Panel A: Descriptive Statistics+Scale 1 = less than 10%; 2 = 10% - 25%; 3 = 26% - 50%; 4 = 51% - 75%; 5 = greater than 75%.
Panel B: Tests of Between-Subjects Effects
a R Squared = .028 (Adjusted R Squared = .022)
Country Mean+
Std. Deviation N
USA or Canada 3.69 1.380 98
All other countries 3.23 1.366 90
Total 3.47 1.389 188
SourceType III Sum
of Squares df Mean Square F Sig.Corrected Model 9.951(a) 1 9.951 5.274 .023
Intercept 2251.270 1 2251.270 1193.265 .000
Country 9.951 1 9.951 5.274 .023
Error 350.916 186 1.887
Total 2629.000 188
Corrected Total 360.867 187

21
Table 9Extent of Work Relating to Task of Reviewing/Evaluating IT Controls
by Employment Type
Panel A: Descriptive Statistics+Scale 1 = less than 10%; 2 = 10% - 25%; 3 = 26% - 50%; 4 = 51% - 75%; 5 = greater than 75%.
Panel B: Crosstabulation
Employment type Mean+
Std. Deviation N
Public accounting 3.94 1.345 33
Industry 3.46 1.428 124
Government 3.03 1.140 31
Total 3.47 1.390 188
Percentage of work relating to task of
reviewing/evaluating IT controls
Employment type
Less than 10%
10% - 25%
26% - 50%
51% - 75%
Greater than 75% Total
Public accounting Count 2 4 6 3 18 33
Expected Count 3.2 6.7 6.0 5.8 11.4 33.0
Industry Count 14 26 15 27 42 124
Expected Count 11.9 25.1 22.4 21.8 42.9 124.0
Government Count 2 8 13 3 5 31
Expected Count 3.0 6.3 5.6 5.4 10.7 31.0
Total Count 18 38 34 33 65 188 Expected Count 18.0 38.0 34.0 33.0 65.0 188.0

22
Figure 2: Dendrogram
Rescaled Distance Cluster Combine C A S E 0 5 10 15 20 25 Label Num +---------+---------+---------+---------+---------+ AI6_imp 17 DS5_Imp 22 PO9_imp 9 DS11_Imp 28 M2_imp 32 PO8_imp 8 AI4_imp 15 AI5_imp 16 DS12_Imp 29 DS13_Imp 30 DS9_Imp 26 DS10_Imp 27 M1_imp 31 DS7_Imp 24 M3_imp 33 M4_imp 34 AI2_imp 13 AI3_imp 14 AI1_imp 12 PO2_imp 2 PO3_imp 3 PO4_imp 4 PO5_imp 5 PO7_imp 7 PO6_imp 6 DS1_Imp 18 DS3_Imp 20 DS2_Imp 19 PO10_imp 10 PO11_imp 11 DS4_Imp 21 PO1_imp 1 DS6_Imp 23 DS8_Imp 25

23
Overview of Results Of the 34 IT processes, results reveal that some are more
important than others from the viewpoint of the reliability of financial reporting
In particular, five processes stood out as being critical: Ensure System Security (DS5); Manage Changes (AI6), Assess Risk (PO9), Assess Internal Control Adequacy (M2), and Manage Data (DS11)
Factor analysis results revealed six distinct factors, with the “general and application controls” factor being the most prominent

24
Limitations
True response rate and hence extent of non-response bias is unknown
Extent to which importance ratings were affected by the length of the instrument is unknown (the “fatigue factor”)
Order of 34 processes was not randomized Despite instructions, it is possible that respondents were not
attuned to the focus on the effect of the COBIT IT processes on the reliability of financial reporting
Lack of a “reference point” or context for assessing importance of IT processes

25
Conclusion and Future Research
Some COBIT IT processes are deemed more critical than others from the standpoint of the reliability of financial reporting
Internal and external auditors can focus their attention on the “Top 10” most critical COBIT processes
Future research could focus on the why question – why some IT processes are deemed more critical than others
Also worth investigating the extent to which COBIT processes contribute to other organizational objectives