The Importance of Price Beliefs in Consumer Search
58
The Importance of Price Beliefs in Consumer Search * Pranav Jindal Kenan-Flagler Business School University of North Carolina at Chapel Hill Anocha Aribarg Ross School of Business University of Michigan September 2018 * We are grateful to Elisabeth Honka, Nitin Mehta, Rajdeep Grewal, Sriraman Venkataraman, Carl Mela, Camelia Kuhnen and Stephan Seiler for helpful comments and suggestions. We also benefited from the comments of seminar participants at the 2018 Marketing Science Conference at Temple University, 2018 Marketing Dynamics Conference at Southern Methodist University, and the UNC-Duke brown bag. We thank Lillian Chen for providing excellent research assistance. The first author acknowledges the support of The M. W. “Dyke” Peebles, Jr. Faculty Develop- ment Fund. All errors and omissions are the responsibility of the authors. All correspondence may be addressed to [email protected] or [email protected].
Transcript of The Importance of Price Beliefs in Consumer Search

The Importance of Price Beliefs in Consumer Search∗
Pranav Jindal
Kenan-Flagler Business School
University of North Carolina at Chapel Hill
Anocha Aribarg
Ross School of Business
University of Michigan
September 2018
∗We are grateful to Elisabeth Honka, Nitin Mehta, Rajdeep Grewal, Sriraman Venkataraman, Carl Mela, CameliaKuhnen and Stephan Seiler for helpful comments and suggestions. We also benefited from the comments of seminarparticipants at the 2018 Marketing Science Conference at Temple University, 2018 Marketing Dynamics Conferenceat Southern Methodist University, and the UNC-Duke brown bag. We thank Lillian Chen for providing excellentresearch assistance. The first author acknowledges the support of The M. W. “Dyke” Peebles, Jr. Faculty Develop-ment Fund. All errors and omissions are the responsibility of the authors. All correspondence may be addressed [email protected] or [email protected].
Abstract
A consumer’s decision to engage in search depends on the beliefs the consumer has aboutan unknown product characteristic such as price. In this paper, we elicit the distribution ofprice beliefs and explicitly study their role in a consumer’s decision to search. We design anincentive-aligned online study where subjects search over the price of a homogeneous good,and provide prior price beliefs and updated beliefs after each search. Based on data collectedfrom a nationally representative panel, we find substantial heterogeneity in prior price beliefswhich is at odds with the rational expectations assumption. We explore the importance ofaccounting for price beliefs in two ways - first, we study the impact of assuming rationalexpectations on estimates of search costs. For both simultaneous and sequential search models,assuming rational expectations biases the search cost estimates; the direction of bias dependson the subject’s prior beliefs. Importantly, while accounting for expected price beliefs is crucialto consistently estimating search costs, assuming that the standard deviation of the subject’sbeliefs coincides with the true price distribution does not substantially bias the distribution ofsearch cost. Second, we explore the importance of price beliefs in inferring how consumerssearch. Assuming rational expectations, we find that subjects engage in simultaneous searchwhich is consistent with previous research. However, the decision to engage in an additionalsearch depends on the updated price beliefs pointing to sequential search. We discuss themanagerial relevance of these results and the implications for researchers.
Keywords: consumer search, price beliefs, rational expectations, search costs, simultaneoussearch, sequential search
JEL codes: D83, C11
2

1 Introduction
Both online and offline markets are characterized by the prevalence of sizable price dispersion
even for homogeneous products, which can be attributed to the presence of search frictions (Baye,
Morgan, and Scholten (2006), Stigler (1961)). Consumers search, online and offline, over prices
and other product characteristics in a large number of product markets such as hotels, grocery,
automobiles etc.; hence, it is imperative to understand the underlying primitives which govern
the search process and influence market outcomes.1 The search process is characterized by a
trade-off between the expected benefit from searching and search frictions (costs). Any inference
about search costs, thus, hinges on the assumed search process and beliefs consumers have about
an unknown product characteristic such as price. Nonetheless, researchers often do not observe
consumers’ beliefs and hence assume rational expectations i.e. consumers’ beliefs coincide with
the true price distribution. In this paper, we study the importance of accounting for heterogeneous
consumers’ beliefs about prices of a homogeneous good in a search paradigm.
We study the importance of price beliefs in two different ways. First, we study how different
specifications (assumptions) of price beliefs influence search cost estimates conditional on an as-
sumed search method. Specifically, we explore the implications of assuming rational expectations
on search cost estimates. In the survey, we elicit the entire distribution of price beliefs (as opposed
to only the expected price) which allows us to study the importance of accounting for standard
deviation of the price distribution in estimating search costs. Second, we explore the role of elici-
ted beliefs in inferring search method based on aggregate data patterns. In contrast to this study,
previous research (see for example, De los Santos, Hortacsu, and Wildenbeest (2012) (hereafter
DHW12) and Honka and Chintagunta (2016) (hereafter HC16)) infers search method assuming
that consumers know the true distribution of prices, which alleviates the need to elicit consumers’
1For example, researchers have studied the market for books (Hong and Shum (2006), De los Santos, Hortacsu,and Wildenbeest (2012)), grocery (Mehta, Rajiv, and Srinivasan (2003), Seiler (2013), Seiler and Pinna (2017)),MP3 players and camera (De los Santos, Hortacsu, and Wildenbeest (2017), Kim, Albuquerque, and Bronnenberg(2010), Bronnenberg, Kim, and Mela (2016)), insurance (Honka (2014)), mutual funds (Hortacsu and Syverson (2004),Koulayev (2013)), hotel bookings (Chen and Yao (2016), Ursu (2018)), gasoline (Lewis (2011)), prescription drugs(Sorensen (2001)) etc.
3

beliefs. Accounting for beliefs is central to not only the literature on consumer search but also to
the economics and marketing literature on dynamic discrete choice, consumer learning, risk and
insurance, and investments. To the extent that beliefs about the construct of interest are not obser-
ved, researchers often assume rational expectations i.e. consumers’ beliefs are consistent with the
observed data. Explicitly eliciting beliefs within the search framework alleviates the need to make
this assumption. Our objective in this paper is not to critique the assumption of rational expectati-
ons; rather, we aim to understand how making this assumption influences estimates of search cost
and our inference of search method.
We design an incentive-aligned online study which simulates consumer search for a homoge-
neous home appliance product (KitchenAid mixer). We elicit the prior price beliefs from each
subject and then simulate search scenarios over prices for the mixer. After each search, we again
elicit the price beliefs and let the subjects choose between searching more versus purchasing at
the lowest observed price, i.e. a case of perfect recall. In our study, both belief elicitation and
search tasks are made incentive-aligned by utilizing the binarized scoring rule (Hossain and Okui
(2013)) and by introducing a trade-off between searching more versus choosing to purchase at the
currently lowest price, respectively. We observe substantial heterogeneity in not only the mean but
also the standard deviation of the prior price belief distribution across subjects. Further, subjects
update both the mean and standard deviation of the price distribution in response to search outco-
mes. Together, these findings point to potential bias in search costs estimated assuming rational
expectations.
We explore the magnitude of the bias in search cost estimates under different assumptions about
prior beliefs. The study design allows us to directly infer bounds on each subject’s search cost from
the data conditional on assuming whether subjects engage in simultaneous or sequential search. For
either assumption of search method, we find that search cost estimates are biased if we assume that
subjects know the true distribution of prices as is often assumed in the search literature. Consistent
with theory, for both simultaneous and sequential search methods, the direction of bias depends
on whether the prior beliefs are higher or lower than the true price distribution. For sequential
4

search, the magnitude of bias also depends on whether subjects update beliefs in an upward or
downward direction, but belief updating explains less variation in the estimated bias as compared
to heterogeneity in prior beliefs. Finally, while accounting for prior beliefs about expected prices is
crucial to getting unbiased estimates of search costs, ignoring heterogeneity in standard deviation
of prior price beliefs does not substantially influence the estimated distribution of search costs.
Put differently, even though subjects differ in their beliefs about price dispersion and update these
beliefs in response to search, ignoring individual-level differences in standard deviation does not
have a substantial effect on the distribution of search costs. The estimated bias in search costs also
has implications for how changes in search costs impact the number of searches. For example,
, assuming rational expectations underestimates the effect of a 10% decrease in search costs on
the number of searches and the proportion of subjects who switch retailers. Notably, the effect of
a reduction in search costs assuming rational expectations differs significantly depending on the
assumed search method, thereby highlighting the importance of assuming how consumers search.
Next, we conduct reduced-form tests previously used in the literature (see DHW12 and HC16)
to explore how knowledge of price beliefs influences the inference about the search method sub-
jects engage in. Much like this literature, we study aggregate data patterns to infer whether con-
sumers engage in simultaneous or sequential search, but additionally account for the role of price
beliefs.2 Assuming rational expectations, we replicate the findings in DHW12 and HC16 utili-
zing our data, and consistent with these papers, conclude that subjects engage in simultaneous
search. However, we find evidence that subjects account for updated beliefs in their decision to
continue searching, thereby providing support to sequential search and pointing to the importance
of accounting for belief updating. Consistent with the results on search costs, we do not find a
significant effect of the standard deviation of updated price beliefs on the decision to search. Taken
together, our findings suggest that eliciting beliefs is important not only to get unbiased estimates
2It is possible that consumers differ in the search method they use or search in some combination of simultaneousand sequential search methods (Morgan and Manning (1985) and Harrison and Morgan (1990)). While we acknow-ledge this possibility, our emphasis on understanding the importance of, and the effort involved in eliciting the standarddeviation of price beliefs. limits the number of search tasks and belief elicitations we can include in our survey design.As a consequence, we do not have enough search outcomes to infer the search method at the individual-level. Webelieve this is an interesting research topic, but defer it to future research.
5

of search costs subject to an assumed search method, but also to correctly infer the search method
used.
This paper makes several contributions to the marketing and economics literature on consumer
search. First, to the best of our knowledge, this is the first paper to explicitly account for the
distribution of beliefs in a search paradigm. Matsumoto and Spence (2016) study the heterogeneity
in expected prices and how experience impacts consumer learning about the true distribution of
prices. We elicit the entire distribution of price beliefs and show that accounting for the mean
or expected price beliefs is more crucial than accounting for the standard deviation of beliefs in
making inference about search costs and search method. Second, we quantify the magnitude and
examine the drivers of bias induced in search cost estimates by assuming rational expectations,
an assumption routinely made in the search literature. Third, previous literature, such as DHW12
and HC16, identifies search method using data patterns implied by theory and assuming rational
expectations. We demonstrate how inference about search method may differ when consumer’s
heterogeneous price beliefs are taken into account.
The rest of the paper is organized as follows. The next section provides an overview of the
search literature and generalizes it to account for heterogeneous price beliefs. Sections 3 and 4
detail the study design and provide data descriptives. We present the estimates of search costs in
section 5 followed by the reduced form tests of search method in section 6. Section 7 includes
robustness checks to our assumptions, and we then conclude with the managerial implications of
our findings and suggest directions for future research.
2 Overview of Search Models
The theoretical and empirical literature typically characterizes and models search as either simulta-
neous (fixed sample) or sequential.3 For homogeneous goods, starting with Stigler (1961), simul-
3Notable exceptions include Morgan and Manning (1985) and Harrison and Morgan (1990) who propose a variablesample size (VSS) strategy where a consumer sequentially chooses the number of samples to take and the size of eachsample. The VSS is a generalization of simultaneous and sequential models.
6

taneous search is characterized by the consumer choosing the number of searches to make before
actually searching and then choosing the searched alternative with highest utility. By contrast, Mc-
Call (1970) and Mortensen (1970) characterize search as a sequential process where the outcome
of each individual search determines whether the consumer chooses to search once more or pur-
chase the searched alternative. Note that the actual search process is sequential under either search
method; they differ in when the consumer decides how much to search and when to stop searching.
Below, we provide a brief overview of both these models for a homogeneous good, but generalize
them to account for heterogeneous prior beliefs and belief updating.
Consider consumer i searching for the lowest price of a homogeneous good across different
retailers. The consumer faces a constant cost ci for every single search. Let Fik (p) denote the
distribution of price beliefs the consumer has after making k searches. The i subscript in Fik (p)
allows for consumers to have heterogeneous beliefs, and the k subscript indexes learning about
the price distribution. In the absence of learning, the beliefs will be independent of the number
of searches. The special case, widely considered in the literature where consumers know the true
distribution of prices (rational expectations), is represented by consumers having beliefs F (p) (no
i or k subscript). Under the simultaneous search model in the context of homogeneous goods,
consumers randomly sample retailers for the lowest price (Stigler (1961)). The expected utility
associated with k searches is given by
E(Uik) =−E(Pik)− kci
=−∫
∞
0kp(1−Fi0 (p))k−1 dFi0− kci (1)
where Fi0 (p) is the distribution function of the consumer’s prior price beliefs. The incremental
gain from searching k times as opposed to k−1 times is thus given by
7

E(Uik)−E(Uik−1) =−E(Pik)− kci +E(Pik−1)+(k−1)ci
= Γsimik − ci (2)
where Γsimik =E(Pik−1)−E(Pik) is the expected benefit from one additional search net of the search
cost. Thus, if the consumer searches k times, then for k searches to be optimal, the search cost ci
is such that ci ∈[Γsim
ik+1,Γsimik
], which can be inferred directly from the data.
Compared to the simultaneous search model, under the classical model of sequential search
(McCall (1970)), consumers’ decision to continue searching is based on the last searched price.
Same as the simultaneous model, the sequential model assumes that consumers know the true
price distribution.This assumption gives rise to a search model where consumers will never recall
an alternative searched earlier provided that they have not exhausted all search outcomes. In our
application, we allow consumers to learn about the price distribution which implies that consumers
may purchase at a recalled price, which may or may not be the last searched price. Lippman and
McCall (1976) and Landsberger and Peled (1977) show that for a homogeneous good with a known
distribution of prices, it is optimal to randomly search for the lowest price and stop searching when
the lowest sampled price is lower than the reservation price. Rothschild (1974) extends this to
account for belief learning and shows that with Dirichlet priors, the optimal search rule mirrors
that in Weitzman (1979). Rosenfield and Shapiro (1981) and Bikhchandani and Sharma (1996)
further generalize this and prove that if the beliefs follow a distribution which satisfies certain
assumptions or if belief updating follows certain rules, then the optimal stopping rule is myopic
such that if it is optimal to not search once more given current beliefs, then it will never be optimal
to search in the future even though consumers learn about the true distribution of prices.4 We show
4Specifically, the conditions put forth by Bikhchandani and Sharma (1996) are as follows: first, the updated be-lief distribution is a convex combination of the prior distribution and the empirical distribution. Second, the pricedistribution is such that the posterior probability of observing a low price, given that all previous draws have beenhigh, decreases with the number of draws. Additionally, Bikhchandani and Sharma (1996) show that if the probabilityof observing a price lower than some threshold, given that all previous price draws have been above this threshold,depends only on the number of draws, then the optimal stopping (myopic) rule is characterized by the reservation
8

that the posterior distribution is a convex combination of the prior and empirical distributions,
and consider a normal distribution which satisfies the assumptions in Bikhchandani and Sharma
(1996), and thus, focus on a myopic search. Let the lowest price a consumer has sampled after
k random searches be given by pik. Thus, the expected gain from searching once more (for the
k+1th time) net of the search cost is given by
Γseqik+1 =
∫ pik
0(pik− p)dFik (3)
If the consumer stops searching after k searches, then we can use this information and knowledge
of Fik to get bounds on the search costs such that ci ∈[Γ
seqik+1,Γ
seqik
]. Thus, as with the simultaneous
model, bounds on the search costs can be inferred directly from data.
Equations 1 and 3 show that even for a simple model of search over prices of a homogeneous
good, knowledge of the prior beliefs (simultaneous search), and additionally, of updated beliefs
(sequential search) is crucial to estimating the distribution of search costs. Beliefs, however, are
not observed in field data and often not elicited in experiments forcing researchers to make as-
sumptions about beliefs.5 In addition to the assumptions about beliefs, the literature often assumes
a search method and estimates distribution of search costs subject to this assumption. For instance,
Mehta, Rajiv, and Srinivasan (2003), Seiler (2013), and Moraga-Gonzalez, Sandor, and Wilden-
beest (2013) assume that consumers engage in simultaneous search and that they know the true
distribution of prices. This not only imposes rational expectations but also that there is no le-
arning about the distribution of prices. Zwick, Rapoport, Lo, and Muthukrishnan (2003), Kim,
Albuquerque, and Bronnenberg (2010), Kim, Albuquerque, and Bronnenberg (2016), and Chen
and Yao (2016) model sequential search and retain the assumption that consumers know the true
price.5Beliefs are not only important in the search literature, but also play an integral role in the literature on dynamic
discrete choice models (Rust (1987)), consumer learning (Erdem and Keane (1996)), reference prices (Winer (1986)),and risk (Kahneman and Tversky (1979)). While the majority of the literature infers beliefs conditional on assumingthat consumers have rational expectations, and that they update beliefs in a Bayesian manner, recent literature in theseareas has either studied behavior by providing subjects with beliefs in a lab setting (see for example, Dube, Hitsch,and Jindal (2014) and Jindal (2015)) or accounting for the expectations consumers may have (Delavande (2008) andErdem, Keane, Oncu, and Strebel (2005)).
9

distribution of prices and that there is no learning.
More recently, Koulayev (2013), De los Santos, Hortacsu, and Wildenbeest (2017), Spence
(2015), Wu (2017) and Hu, Dang, and Chintagunta (2018) model consumer search as a sequential
process and allow consumers to learn about product characteristics. These papers, however, assume
that consumers update their beliefs in a Bayesian manner where beliefs are represented by Dirichlet
priors (process). A subset of these papers (Koulayev (2013) and De los Santos, Hortacsu, and
Wildenbeest (2017)) also assume that the consumer’s prior beliefs coincide with the true (observed)
distribution. Finally, Hong and Shum (2006), DHW12 and HC16 use consumer search data to
test whether consumers engage in simultaneous or sequential search subject to the assumption
that they know the true distribution of beliefs. Thus, while the previous literature has estimated
models consistent with simultaneous and sequential search, explored whether consumers engage
in simultaneous or sequential search, and also allowed for learning about the price distribution
under sequential search, all of these are subject to unverifiable assumptions about prior beliefs and
how consumers update their beliefs in response to search outcomes. In this paper, we explicitly
account for consumers’ heterogeneous beliefs, which requires us to conduct an experimental study
in which we elicit beliefs from subjects.
3 Experimental Design
We designed an online incentive-aligned experiment in which we asked subjects to search for prices
of a KitchenAid Artisan 5-Quart mixer. We conducted our experiment among subjects whom we
recruited from a commercial online panel, Lightspeed Research. We controlled for age, gender
and income distributions to reflect those of the general U.S. population.
Quality Control Procedures
To further ensure the qualification of the subjects, we screened them in such a way that they (i)
have purchased or been actively involved in decision making surrounding kitchen appliances, and
10

(ii) have a basic understanding of probability - we asked them three questions pertaining to proba-
bility and distributions (Web Appendix A); correctly answering two out of the three questions was
required to proceed. After passing the screening questions, we collected information about the sub-
jects’ usage of and interest in purchasing the KitchenAid mixer, cooking behavior, and knowledge
about prices of the KitchenAid mixer and appliances in general. Next, we provided subjects with
an opportunity to familiarize themselves with belief elicitation tasks using the Nutri Ninja blender
as the focal product. We asked them to perform a prior belief elicitation task and a posterior belief
elicitation task after showing them a retail scenario in which a seller was selling the Nutri Ninja
blender for $150. We describe these elicitation tasks in detail in the next section. We wrapped
up the practice session by showing how much money the subjects would have made from the task
though we did not actually pay them for the practice tasks. We allowed subjects to opt out from
the experiment if they did not feel comfortable performing the belief elicitation tasks.
Belief Elicitation and Search Tasks
Once the subjects agreed to continue, we asked them to imagine that they were in the market for
a KitchenAid mixer which was sold online on websites such as Amazon, eBay etc., and also in
local stores. We asked them to assume that there were 100 sellers from which they could potenti-
ally purchase the mixer, and that these sellers may charge different prices, but the prices include
all applicable taxes,handling/shipping charges and the warranty is provided by the manufacturer.
The experimental flow is shown in Figure 1. We began by eliciting subjects’ prior beliefs about
prices of the mixer. Unlike previous research that elicited expected prices (Erdem, Keane, Oncu,
and Strebel (2005) and Delavande (2008)), we follow Manski (2004) and the elicitation routine
outlined in other previous research (Dominitz and Manski (1996, 1997, 2004, 2005)) to elicit the
entire distribution of price beliefs, which allows us to examine the role of the standard deviation
(in addition to the mean) of the price beliefs.6 Note that while eliciting the expected price is rela-
6A potential concern with the belief elicitation task is that subjects may not assess beliefs numerically, and even ifthey do, they may not be able to provide their numerical assessment. Wallsten, Budescu, Rapoport, Zwick, and Forsyth(1986) show that subjects are willing to report their beliefs numerically, and Koriat, Lichtenstein, and Fischhoff (1980)and Ferrell and McGoey (1980) demonstrate that despite difficulty, elicitation of numerical probabilities is feasible.
11

tively straightforward, accounting for the standard deviation of the belief distribution substantially
increases the complexity of the belief elicitation task, as we detail below. Eliciting beliefs requires
proper scoring rules which ensure that subjects are incentivized to reveal their true beliefs. We use
the binarized scoring rule proposed by Hossain and Okui (2013) which makes belief elicitation
incentive aligned irrespective of the subjects risk preferences.
————— Insert Figure 1 here —————
We first asked the subjects what they thought were the minimum and maximum prices of
the KitchenAid mixer to establish the belief bounds (Dominitz and Manski (1997), Oakley and
O’Hagan (2007)). With the price range obtained from each subject, we showed them four custom-
designed price points (p∗d; d ∈ [1,4]) that were spread out evenly as follows: the minimum price
plus the price range multiplied by .2, .4, .6 and .8.7 We then elicited a quantile, i.e. a value from the
cumulative distribution function (CDF), associated with each price point by asking for the number
of sellers (out of 100) who have a price below each of the price thresholds (the quantile scale is also
shown in Web Appendix A). We designed our quantile elicitation task to resemble those used by
Garthwaite, Kadane, and O’Hagan (2005) and Manski (2004).8 Next, we presented subjects with
a retail scenario where they could potentially purchase the mixer and then asked them to report
what they believed to be the median price (Dominitz and Manski (1996)). We created 20 blocks
of prices for each of the four retail scenarios and randomly drew a block of prices to show to each
subject in random order.
After the price exposure, we elicited the posterior (i.e., updated) price belief using a new set
of custom-designed price points given by median±κ( pH−pL
4
), where median is the median price
Further, elicitation of beliefs through numerical as opposed to verbal assessment methods is also common in theeconomics (Juster (1966)) and statistics literature (Garthwaite, Kadane, and O’Hagan (2005)), which have touted theimportance of making belief elicitation incentive-aligned (Schotter and Trevino (2014)).
7We found that some subjects in the pre-test provided unrealistically tight price ranges and were concerned thatsuch narrow price ranges may adversely affect their ability to indicate four quantiles for a set of prices that are too closeto one another. To circumvent this problem, when subjects reported a price range smaller than $150, we promptedthem whether they were confident about the reported price range and wished to provide a new price range. If theyinsisted on the original price range, we used a default minimum price range of $150.
8If belief elicitation influences subsequent behavior, then eliciting beliefs will bias our inference of search costs.Previous research, however, has shown that belief elicitation does not alter subjects’ behavior (Nyarko and Schotter(2002) and Costa-Gomes and Weizsacker (2008)), thereby supporting to our experimental design.
12
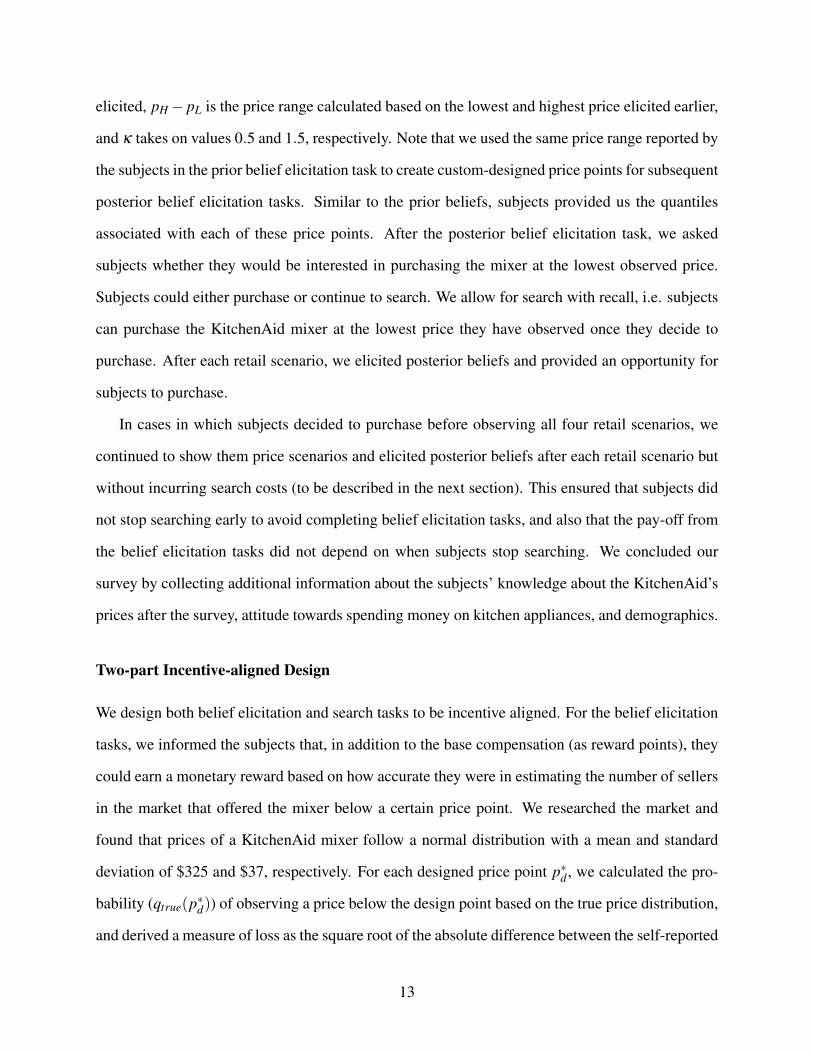
elicited, pH− pL is the price range calculated based on the lowest and highest price elicited earlier,
and κ takes on values 0.5 and 1.5, respectively. Note that we used the same price range reported by
the subjects in the prior belief elicitation task to create custom-designed price points for subsequent
posterior belief elicitation tasks. Similar to the prior beliefs, subjects provided us the quantiles
associated with each of these price points. After the posterior belief elicitation task, we asked
subjects whether they would be interested in purchasing the mixer at the lowest observed price.
Subjects could either purchase or continue to search. We allow for search with recall, i.e. subjects
can purchase the KitchenAid mixer at the lowest price they have observed once they decide to
purchase. After each retail scenario, we elicited posterior beliefs and provided an opportunity for
subjects to purchase.
In cases in which subjects decided to purchase before observing all four retail scenarios, we
continued to show them price scenarios and elicited posterior beliefs after each retail scenario but
without incurring search costs (to be described in the next section). This ensured that subjects did
not stop searching early to avoid completing belief elicitation tasks, and also that the pay-off from
the belief elicitation tasks did not depend on when subjects stop searching. We concluded our
survey by collecting additional information about the subjects’ knowledge about the KitchenAid’s
prices after the survey, attitude towards spending money on kitchen appliances, and demographics.
Two-part Incentive-aligned Design
We design both belief elicitation and search tasks to be incentive aligned. For the belief elicitation
tasks, we informed the subjects that, in addition to the base compensation (as reward points), they
could earn a monetary reward based on how accurate they were in estimating the number of sellers
in the market that offered the mixer below a certain price point. We researched the market and
found that prices of a KitchenAid mixer follow a normal distribution with a mean and standard
deviation of $325 and $37, respectively. For each designed price point p∗d , we calculated the pro-
bability (qtrue(p∗d)) of observing a price below the design point based on the true price distribution,
and derived a measure of loss as the square root of the absolute difference between the self-reported
13

quantile (probability) and its associated true quantile value (loss =√|qsel f (p∗)−qtrue(p∗)|). Fi-
nally, we drew a random number r from a Uniform(0,1) distribution. If loss < r, the subject earned
$0.25 for that design point. Given four price points in each elicitation task, subjects could earn
up to $1 per belief elicitation. This scoring rule is consistent with the binarized scoring rule (Hos-
sain and Okui (2013)) which provides correct beliefs about a random variable independent of the
subjects’ risk preferences and the expected utility hypothesis.9
For the search tasks, subjects pay-off is determined based on a trade-off between searching
once more at a cost of $1 versus the potential benefit from finding a price lower than the currently
available best price. Subjects are endowed with $3 at the beginning of the study, and barring the
first search which is free, for each incremental search, subjects lose $1. Each incremental search
also has a potential benefit wherein a $50 reduction in price as compared to the currently available
best price results in a reward of $1. This induces a trade-off between searching more by paying $1
to get a possibly lower price versus purchasing at the current lowest price and saving $1 in search
costs, which makes the search task (decision to purchase) incentive-aligned. Once subjects decide
to purchase, we show them the remaining search scenarios (if any) without them incurring any
additional search costs. As mentioned earlier, this ensures that the pay-off from belief elicitation
tasks does not depend on the number of searches subjects chose to engage in before purchasing.
4 Data Description
The data for this study was collected using the online panel of Lightspeed Research, a national
market research company. The panel is representative of the U.S. population. Three hundred sub-
jects completed the survey out of which we dropped 19 subjects who provided invariant responses,
thus, resulting in a sample of 281 subjects. The distribution of demographics in the sample is
reported in Web Appendix B. Table 1 reports the statistics on the familiarity subjects have with
prices and purchase decisions for kitchen appliances as well as the KitchenAid mixer. Before ta-
9We also explored other loss functions such as squared and absolute error losses but the square root error lossfunction provided us with the most reasonable probabilities for Type I and Type II errors.
14
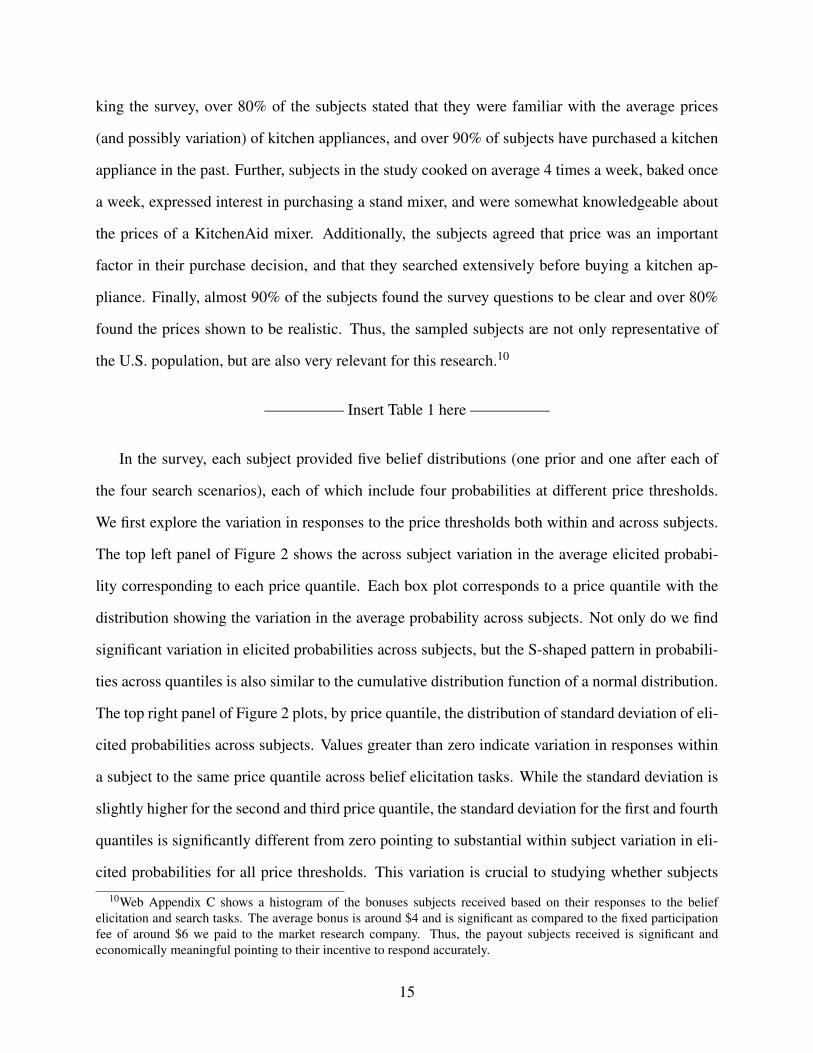
king the survey, over 80% of the subjects stated that they were familiar with the average prices
(and possibly variation) of kitchen appliances, and over 90% of subjects have purchased a kitchen
appliance in the past. Further, subjects in the study cooked on average 4 times a week, baked once
a week, expressed interest in purchasing a stand mixer, and were somewhat knowledgeable about
the prices of a KitchenAid mixer. Additionally, the subjects agreed that price was an important
factor in their purchase decision, and that they searched extensively before buying a kitchen ap-
pliance. Finally, almost 90% of the subjects found the survey questions to be clear and over 80%
found the prices shown to be realistic. Thus, the sampled subjects are not only representative of
the U.S. population, but are also very relevant for this research.10
————— Insert Table 1 here —————
In the survey, each subject provided five belief distributions (one prior and one after each of
the four search scenarios), each of which include four probabilities at different price thresholds.
We first explore the variation in responses to the price thresholds both within and across subjects.
The top left panel of Figure 2 shows the across subject variation in the average elicited probabi-
lity corresponding to each price quantile. Each box plot corresponds to a price quantile with the
distribution showing the variation in the average probability across subjects. Not only do we find
significant variation in elicited probabilities across subjects, but the S-shaped pattern in probabili-
ties across quantiles is also similar to the cumulative distribution function of a normal distribution.
The top right panel of Figure 2 plots, by price quantile, the distribution of standard deviation of eli-
cited probabilities across subjects. Values greater than zero indicate variation in responses within
a subject to the same price quantile across belief elicitation tasks. While the standard deviation is
slightly higher for the second and third price quantile, the standard deviation for the first and fourth
quantiles is significantly different from zero pointing to substantial within subject variation in eli-
cited probabilities for all price thresholds. This variation is crucial to studying whether subjects
10Web Appendix C shows a histogram of the bonuses subjects received based on their responses to the beliefelicitation and search tasks. The average bonus is around $4 and is significant as compared to the fixed participationfee of around $6 we paid to the market research company. Thus, the payout subjects received is significant andeconomically meaningful pointing to their incentive to respond accurately.
15

update beliefs in response to search outcomes.
————— Insert Figure 2 here —————
The bottom left panel of Figure 2 shows the distribution of number of searches (choices) across
subjects. The last column indicates the number of subjects who chose to continue searching after
the four search tasks. Overall, we find variation across subjects in when they decide to stop sear-
ching which, combined with the variation in price beliefs, allows for estimation of search costs.
To understand how subjects respond to search outcomes, in the bottom right panel of Figure 2, we
show a scatter plot between the search outcome and the elicited median price of the belief distri-
bution. The positive relationship between the searched price and elicited median price provides
preliminary evidence that consumers respond to search outcomes and positively (upwards) update
price beliefs in response to higher price outcomes. We explore the updating process more formally
in the subsequent sections.
4.1 Belief Estimation
Our belief elicitation and estimation follows the approach outlined in Manski (2004) and used in
a series of previous papers (see for example, Dominitz and Manski (1996, 1997, 2004, 2005)).
For expositional convenience, we ignore the subject specific subscript i, but note that each subject
sees different thresholds based on responses to upper and lower bounds or the median price. For
each price threshold (design point) p∗d , let Fd denote the probability that the price is below this
threshold i.e. Fd = Pr(
p≤ p∗d). We thus collect the four points Fd on the CDF describing the
subject’s subjective beliefs about prices, and use these to recover the distribution of price F (p)
using the approach outlined in Dominitz and Manski (1996).
The estimation routine outlined above requires assuming a belief distribution. In this pa-
per, we limit our attention to unimodal distributions.11 We first estimate the belief distribu-
tion subject to the assumption that beliefs follow a skew normal distribution. The skew normal11Oakley and O’Hagan (2007) outline a routine which non-parametrically estimates the distribution of beliefs and
allows for multi-modal distributions. While we believe this is valuable, we defer accounting for non-parametricdistributions to future research.
16

distribution is a generalization of the normal distribution and has a density function given by
g(x) = 2ω
φ
(p−ζ
ω
)Φ
(α
p−ζ
ω
)where φ (.) and Φ(.) are the density and distribution functions of a
standard normal distribution, respectively, ζ and ω are the location and scale parameters, respecti-
vely, and α measures the skewness of the distribution. The normal distribution is a special case
of the skew normal distribution with α = 0. Across all subjects and belief elicitations, over 65%
of estimated distributions have a value of α between -2 and 2, which points to almost symmetric
belief distributions. Further, none of the estimated α’s are significantly different from 0. Together,
this supports assuming that the beliefs follow a normal distribution, which has also been assumed
in the previous literature (see for example, Dominitz and Manski (1996)).12 Let (µ,σ) denote the
mean and standard deviation of the normally distributed belief distribution. The estimated para-
meters minimize the sum of the least squared errors between the price thresholds and the predicted
prices given the elicited probabilities:
(µ, σ) = argminµ,σ
∑d
(p∗d−Φ
−1(Fd; µ,σ))2
(4)
where µ and σ are the estimated mean and standard deviation of the subjects’ belief distribution.
Thus, we capture the entire distribution of beliefs as opposed to only the expected value which has
been utilized in the previous literature (Delavande (2008) and Erdem, Keane, Oncu, and Strebel
(2005)).
4.2 Belief Heterogeneity and Updating
We now explore whether subjects differ in their prior beliefs and whether they update their beliefs
in response to search outcomes. While heterogeneity in prior beliefs has implications for search
costs estimated under simultaneous search, belief updating (in addition to prior beliefs) influences
search cost estimates under sequential search. The top panel of Figure 3 plots the distribution of
the estimated means of the prior distribution across all subjects (dotted green density) as well as
12We replicated our analysis assuming that subject’s price beliefs follow a lognormal distribution and do not findany qualitative differences. These results are available from the authors upon request.
17

the true price distribution (dashed blue density) based on prices at hundreds of online and offline
stores.13 The prior distribution is elicited before providing subjects with any price information
about the KitchenAid mixer. Overall, subjects underestimate the true prices of the KitchenAid
mixer and there exists significant heterogeneity in the expected prices across subjects. The bottom
panel of Figure 3 shows the distribution of the estimated standard deviations of the prior belief
distributions along with the true standard deviation (dotted blue line). Again, we find that subjects
differ substantially in their beliefs about the price dispersion in the market for the mixer. The
majority of the subjects overestimate the degree of price dispersion which could have potential
implications for how much subjects search.
————— Insert Figure 3 here —————
The solid red density in the top panel of Figure 3 shows the distribution of estimated means
of the posterior distribution across all subjects obtained at the end of all four search scenarios. As
compared to the prior distribution (dotted green density), the posterior distribution is closer to the
true distribution (dashed blue density), and also has a smaller standard deviation. Thus, it provides
evidence that subjects update their beliefs and learn about the true price distribution. We explore
this more formally by regressing the difference between the estimated mean for scenario t and that
for the scenario t− 1, (µt − µt−1), on the difference between price observed in scenario t and the
mean in scenario t−1, (pt−µt−1). Notably, this model specification is consistent with the adaptive
expectation model proposed by Nerlove (1958). Specifically, we run a regression of the form:
µt−µt−1 = α +β (pt−µt−1)+ ε (5)
where if β is estimated such that 0 ≤ β ≤ 1, then the posterior belief is a convex combination
of the prior belief and the empirical distribution. We estimate a positive and significant value of13The true price distribution is based on prices which include taxes and shipping for a specific zip code, as applica-
ble. To compare this distribution with that from the survey, the subjects were informed that the prices shown includeall applicable taxes and shipping. We admit that this may result in some differences across these distributions sincesubjects in the survey are located in cities with varying taxes and shipping charges while the true distribution is basedon one particular zip code. However, we expect the bias induced due to this to be small and not drive the observeddifferences in the distributions.
18

β = 0.49 which implies that subjects update their price beliefs in response to search outcomes
and the extent of updating depends on how much the observed price differs from the previously
expected price. The belief elicitation also allows us to study how subjects update the standard
deviation of belief distribution. A simple regression of the standard deviation of the price beliefs on
linear and quadratic terms of the search task number (time trend) shows that the standard deviation
of the price distribution decreases at a diminishing rate as the number of search increases.14 Thus,
not only do we estimate substantial heterogeneity in the standard deviation of the subject’s prior
belief distribution (lower panel of Figure 3), but also find that subjects update the standard deviation
meaningfully in response to search outcomes. In the following section, we explore the implications
of (not) accounting for the individual-specific standard deviation on search cost estimates.
5 Beliefs and Search Costs
We now explore the implications of assuming rational expectations on the search cost estimates.
Specifically, we study how not accounting for (i) prior heterogeneity in subjects’ beliefs, and (ii)
belief updating influences search cost estimates. Recall that while the actual searches are done
sequentially, the survey itself does not impose any restriction on whether subjects should adopt a
simultaneous or a sequential search strategy. Further, given our interest in understanding the im-
plications of different assumptions, we designed the survey such that search costs can be estimated
without imposing any parametric assumptions.
5.1 Simultaneous Search
In the survey, the first search is free for the subjects. Thus, it is reasonable to assume that a subject
decides on the number of searches to conduct after realizing the outcome of the first search. Let
pi1 be the price realized by subject i from the first search. Given this observed price, the expected
14The results from both regressions are available from the authors upon request.
19

utility from making k additional searches is given by
E(Uik) = k∫ pi1
0(pi1− p)(1−Fi1 (p))k−1 fi1 (p)d p− kci (6)
where Fi1 (p) denotes the distribution function corresponding to the updated price beliefs the sub-
ject has after realizing the outcome of the first search. Following equation 2, we can compute the
incremental benefit (net of search cost) from k searches as opposed to k−1 searches as
Γsimik = k
∫ pi1
0(pi1− p)(1−Fi1 (p))k−1 fi1 (p)d p
− (k−1)∫ pi1
0(pi1− p)(1−Fi1 (p))k−2 fi1 (p)d p (7)
which provides an upper bound on the search cost for a subject who searches k times. Similarly, we
can calculate a lower bound on the search cost estimate based on the expected gain from searching
k versus k+1 times. We focus on three different specifications about beliefs - (i) subjects have the
belief distribution as estimated from the belief elicitation task, (ii) subjects’ belief distribution has
a mean as estimated from the belief elicitation task, but the standard deviation of their beliefs coin-
cides with the true standard deviation, and (iii) subjects’ beliefs coincide with the true distribution
of prices as observed in practice. While the first scenario estimates the “correct” bounds on search
costs, the second allows us to quantify the importance of accounting for the standard deviation of
beliefs, and the third draws a direct comparison with the assumption of rational expectations which
is commonly made in the empirical literature on search.
————— Insert Figure 4 here —————
In each scenario, we infer the bounds on the search cost for each subject and then take the
average of these bounds and plot a distribution of these estimated averages. Note that for simulta-
neous search, Γsimik decreases with k, and thus, by construction, the lower bound (Γsim
ik+1) is always
lower than the upper bound (Γsimik ). We exclude subjects who do not search more than once, or con-
tinue searching after four search tasks, since for these subjects, we have only a lower or an upper
20

bound, respectively, on their search cost. The top panel of Figure 4 plots the distribution of search
costs under different scenarios. For the elicited belief distribution, we estimate median search costs
of $8, and do not find any qualitative difference in the distribution of search costs if we assume
that the standard deviation of the belief distribution coincides with the true price distribution. This
result is different from the previous literature which does not account for the standard deviation of
the distribution, and thus, cannot comment on its relevance to search outcomes. By contrast, assu-
ming rational expectations results in a median search cost of $12 which is 1.5 times more than the
true search costs. Together, our findings not only highlight the importance of eliciting and accoun-
ting for heterogeneous expected prices, but also show that assuming that all subjects have the same
standard deviation as that of the true price distribution provides qualitatively similar distribution
of search costs. This is especially important given that estimating the standard deviation signifi-
cantly increases the effort in belief elicitation. Notably, the specification of the search model does
not constrain the relative importance of the mean and standard deviation of the belief distribution.
Further, the relatively low importance of standard deviation is not driven by lack of variation in
the elicited standard deviation of prior beliefs in our data. Thus, the relatively low importance of
standard deviation of beliefs in influencing the distribution of search costs is neither an artifact of
the model nor can be attributed to lack of variation in the data.
5.2 Sequential Search
As compared to simultaneous search, under sequential search, the decision to continue searching
(with perfect recall) depends on the lowest price seen by the subject and the updated price beliefs.
Recall from equation 3 that the expected benefit, net of search cost, of searching for the (k+1)th
time is given by Γseqik+1
(=∫ pik
0 (pik− p)dFik
)where pik is the lowest price a subject has sampled
after k searches and Fik (p) denotes the updated distribution of price beliefs. As with simultaneous
search, we calculate the bounds on search costs and take the average of these bounds to calculate
each subject’s search cost. Unlike simultaneous search, however, the bounds on search costs are
derived based on the distributions elicited at the end of k and k+1 searches from the same subject.
21

Given that in this paper, we do not impose any restriction on the nature of belief updating, it is
possible in practice, that the estimated lower bound is higher than the estimated upper bound.
In the data, we find that for around 25% - 30% subjects, the estimated lower bound is greater
than the upper bound. This number is small enough that it could be interpreted as mistakes made
by subjects, or be attributable to the errors in belief estimation or to modeling assumptions. We
do robustness checks to our modeling assumptions in Section 7 and do not find any qualitative
differences in the search cost estimates.
We again treat the first search as free, and estimate search costs subject to the following as-
sumptions about beliefs - (i) subjects have the prior and updated belief distributions as estimated
based on the belief elicitation tasks, (ii) subjects’ prior and updated beliefs have a mean as esti-
mated from the belief elicitation tasks, but the standard deviation corresponds to the true standard
deviation, and (iii) subjects’ beliefs coincide with the true distribution of prices as observed in
practice and they do not update beliefs. The bottom panel of Figure 4 plots the distribution of
search costs from these different scenarios. For the elicited prior and updated beliefs (solid curve),
we estimate a median search cost of $7, which is slightly lower than the search cost estimate under
simultaneous search. Consistent with the simultaneous search scenario, allowing for the estimated
mean price beliefs but assuming that the standard deviation coincides with the true price distri-
bution (dotted curve) does not significantly bias the search cost estimates. Finally, assuming that
subjects know the true distribution of beliefs and do not update price beliefs (dashed curve) results
in median search cost of $15. This is consistent with Koulayev (2013) who overestimates search
cost assuming rational expectations.
5.3 Bias in Search Cost Estimates
We now explore the bias in search cost estimates due to the rational expectations assumption. For
both simultaneous and sequential search models, we define bias in search cost as the difference
between the search cost estimated with elicited heterogeneous beliefs and that estimated assuming
subjects know the true price distribution (rational expectations). We refer to a positive (negative)
22

difference as a downward (upward) bias in assuming rational expectations. We classify subjects
into different groups based on whether the prior expected price is higher or lower than the expected
price from the true distribution, and whether subjects updated their beliefs in a positive or negative
direction. To classify subjects based on belief updating, we regress the expected price beliefs after
each search task on a time trend (task number) and classify updating as positive or negative based
on the sign of the time trend coefficient.
————— Insert Figure 5 and Table 2 here —————
The left panel of Figure 5 shows the average bias for different groups of subjects based on
prior beliefs under simultaneous search. We find that subjects with expected prior price belief lo-
wer (higher) than the expected price of the true price distribution have a downward (upward) bias
in search cost estimates. Subjects with a lower expected prior as compared to the true price distri-
bution have a higher incentive to search since the estimated benefit from searching is higher. This
translates to higher search costs (relative to the estimates assuming rational expectations) which
are required to rationalize the search and choice data. The first column of Table 2 reports estimates
from a regression of the bias on whether the prior expected price and prior standard deviation are
higher than the mean and standard deviation of the true price distribution, respectively. Consistent
with the left panel of Figure 5, we estimate a negative effect of higher expected prior on the bias
and a positive effect of higher prior standard deviation on the bias in search cost. Subjects with
prior standard deviation which is higher than the true standard deviation have a lower incentive to
search assuming rational expectations, which translates to lower search costs if we assume rational
expectations. Lower search costs under rational expectations imply a higher magnitude of down-
ward bias as we find. Thus, the bias in estimated search costs under simultaneous search depends
on how the distribution of price beliefs (both mean and standard deviation) compares to the true
price distribution.
Under sequential search, the bias in search costs from assuming rational expectations can stem
from both heterogeneous prior beliefs and belief updating. The middle panel of Figure 5 presents
the average bias for different groups of subjects based on how prior beliefs compare to the true
23

expected price, and the direction of belief updating. Consistent with the simultaneous search re-
sults, we find that subjects with lower (higher) expected prior beliefs (as compared to the true price
distribution) have downward (upward) bias in search costs. Interestingly, the direction of bias in
search cost is driven by the difference between the expected prior beliefs and the expected true
price and not by the direction of belief updating (positive or negative), which provides preliminary
evidence that the former is more influential than the latter.. To explore this further, we conduct a
simple analysis of variance (ANOVA) where we study how much of the variation in search cost
bias is explained by whether the prior expected price and prior standard deviation are higher than
the mean and standard deviation of the true price distribution, respectively, and whether subjects
update the expected price and the standard deviation of the price beliefs in a positive direction or
not. While the first two measures account for prior beliefs, the last two measures capture the role
of belief updating. The first two measures account for 89% of the variation explained by all the
four measures, thus, pointing to the importance of prior beliefs relative to the true distribution, as
compared to the direction of belief updating. This not only emphasizes the importance of accoun-
ting for prior beliefs to obtain unbiased estimates of search costs, but also provides guidance to
researchers on the relative importance of accounting for heterogeneous prior beliefs as compared
to belief updating.
The second column of Table 2 reports estimates from a regression of the bias on the four
measures discussed above. Consistent with Figure 5, we estimate a negative effect of high prior
and a negative effect of positively updating the expected price on the bias in search cost. If subjects
update beliefs in a positive direction, the marginal benefit from searching goes down which implies
that inferred search cost should be lower. Consequently, we would estimate an upward bias in
search cost as we find. Importantly, the differences in the standard deviation of the prior belief and
that of the true price distribution, and the direction of updating of the standard deviation do not
have significant effects on search cost bias. This is consistent with our previous findings (Figure 4)
where ignoring heterogeneity in standard deviation of price beliefs does not qualitatively influence
the estimated distribution of search costs.
24

Finally, we study how the direction of belief updating influences the difference in search cost
estimates obtained under sequential and simultaneous search models. Based on the right panel of
Figure 5 and the last column of Table 2, we find that if subjects update beliefs in a positive direction,
the difference between sequential and simultaneous search cost estimates is lower as compared to
when subjects update beliefs in a negative direction. Thus, the difference in the estimates of search
cost under sequential and simultaneous search models depends on the direction in which subjects
update prior beliefs.
5.4 Implications of Different Search Cost Estimates
We now comment on the magnitude of estimated search costs and the impact of changing search
costs on the number of searches. In the survey, subjects lose $1 for every incremental search and
receive $1 for every $50 reduction in the lowest searched price. Thus, assuming fungibility of mo-
ney, we implicitly impose a search cost corresponding to 50 survey dollars, which is substantially
higher than the estimated search cost. We believe this difference can be explained by differences
in how a subject accounts for money from the different sources i.e. $1 paid to do an additional
search is not the same as $1 gained from a lower price. This is consistent with the “house money
effect” reported in Thaler and Johnson (1990) where subjects are more risk seeking in the presence
of prior gain. To this end, the $3 we endowed the subjects with at the beginning is essentially a
prior gain (house money) and is treated differently than the amount earned from a lower searched
price.
While we find meaningful differences in search cost estimates subject to different belief spe-
cifications, as a researcher, we are interested in the implications of these differences for quantities
such as elasticities, market shares and price distribution. In designing the survey, we faced a trade-
off between (i) accounting for a heterogeneous product and having a more complicated design
which would allow us to study implications for market shares and price dispersion subject to some
parametric assumptions, and (ii) having a simple design which would allow us to estimate search
costs with minimal assumptions but at the expense of studying market shares and price dispersion.
25
In this paper, we chose to focus on a simple design which allows us to non-parametrically infer
the distribution of search costs and quantify the impact of reducing search costs on the number of
searches under alternative assumptions about price beliefs.
————— Insert Table 3 here —————
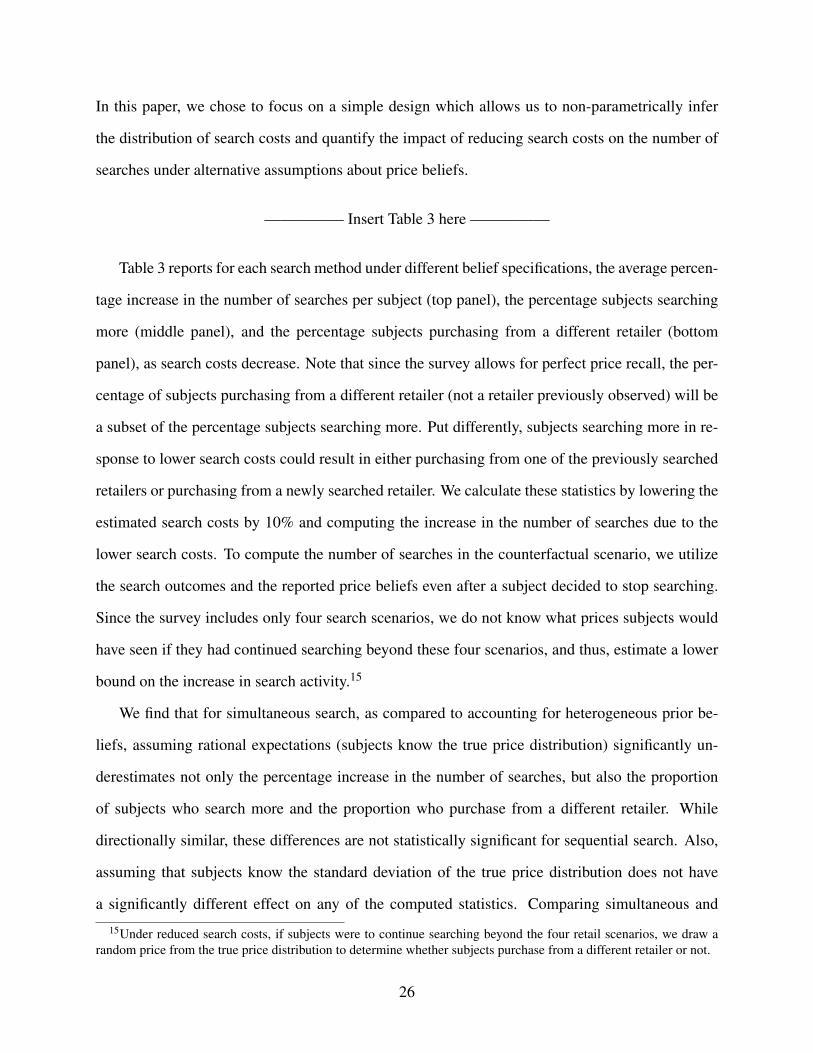
Table 3 reports for each search method under different belief specifications, the average percen-
tage increase in the number of searches per subject (top panel), the percentage subjects searching
more (middle panel), and the percentage subjects purchasing from a different retailer (bottom
panel), as search costs decrease. Note that since the survey allows for perfect price recall, the per-
centage of subjects purchasing from a different retailer (not a retailer previously observed) will be
a subset of the percentage subjects searching more. Put differently, subjects searching more in re-
sponse to lower search costs could result in either purchasing from one of the previously searched
retailers or purchasing from a newly searched retailer. We calculate these statistics by lowering the
estimated search costs by 10% and computing the increase in the number of searches due to the
lower search costs. To compute the number of searches in the counterfactual scenario, we utilize
the search outcomes and the reported price beliefs even after a subject decided to stop searching.
Since the survey includes only four search scenarios, we do not know what prices subjects would
have seen if they had continued searching beyond these four scenarios, and thus, estimate a lower
bound on the increase in search activity.15
We find that for simultaneous search, as compared to accounting for heterogeneous prior be-
liefs, assuming rational expectations (subjects know the true price distribution) significantly un-
derestimates not only the percentage increase in the number of searches, but also the proportion
of subjects who search more and the proportion who purchase from a different retailer. While
directionally similar, these differences are not statistically significant for sequential search. Also,
assuming that subjects know the standard deviation of the true price distribution does not have
a significantly different effect on any of the computed statistics. Comparing simultaneous and
15Under reduced search costs, if subjects were to continue searching beyond the four retail scenarios, we draw arandom price from the true price distribution to determine whether subjects purchase from a different retailer or not.
26

sequential search, we find a significant difference in the proportion of subjects who search more
irrespective of the assumption about belief distribution. A 10% reduction in search costs has, de-
pending on the assumed search method, a significantly different effect on the proportion increase
in number of searches and proportion of subjects who purchase from a different retailer. Thus,
the effect of reducing search cost not only depends on the assumed belief distribution, but also the
assumed search method. Next, we explore how knowledge about subjects’ price beliefs influences
inference of search method.
6 Simultaneous vs Sequential Search?
DHW12 and HC16 use individual-level data on search sequences and consideration sets (in the
absence of search sequences), respectively, to derive theoretically consistent reduced form tests
for comparing different search methods. We follow these papers and replicate the tests in them
in the absence of data on beliefs, i.e. assuming rational price expectations, and then compare the
results with those we derive when subjects’ price beliefs are accounted for. In the same spirit as
these papers, we pool data across subjects to study implied data patterns at the aggregate level, as
opposed to inferring the search method separately for each subject.
6.1 Without Price Beliefs
The left panel of Figure 6 plots the distribution of the number of searches done by each subject
along with a distribution of the number of subjects for whom the last searched price was the lowest
price. Consistent with DHW12, we find that for around 35% of subjects, the last searched price is
not the lowest price i.e. subjects purchase at a recalled price, which provides preliminary evidence
that the observed search and choice patterns are inconsistent with the classic model of sequential
search. This is not surprising since the classic models of search do not allow consumers to update
beliefs which could result in product recall, as is the case in our study.
————— Insert Figure 6 here —————
27

The key empirical difference between simultaneous and sequential search is that under simulta-
neous search, the observed distribution of prices should be independent of the number of searches.
In a sequential search model, however, the observed distribution of prices could either be increa-
sing, decreasing or independent of the number of searches depending on whether or not consumers
update price beliefs. Before replicating the tests from the previous literature, we explore this in-
formally in the absence of any functional form assumptions about the distribution of beliefs. The
right panel of Figure 6 shows the distribution of average search outcome (realized price) by the
number of searches conducted. While we cannot comment on the nature of the first search since it
is free to subjects, we do not find any difference in the average sampled price across subjects who
searched two, three and four times, respectively, which does not rule out either search method.
We now use data on search and prices to test for the search method more formally by first
conducting the test in HC16 which does not require knowledge of search sequence, and then con-
ducting the test in DHW12 which requires information on the search sequence. Both these tests
assume that consumers know the true distribution of prices. Our primary objective of doing these
tests is to understand whether the inference of search method hinges on the knowledge of subjects’
prior price beliefs and how subjects update these beliefs. HC16 show that based on the true price
distribution, if the probability of getting a below-expectation price is λ (e.g., for a normal distribu-
tion λ = 0.5), then under simultaneous search, for any given number of searches, the proportion of
below-expectation prices seen by the consumer should also be λ . Intuitively, this is equivalent to
testing the independence of the distribution of sampled prices (consideration set) and the number
of searches undertaken by the consumer. By contrast, for the sequential search model, HC16 show
that subject to the rational expectations assumption, the proportion of below expectation prices
sampled should be greater than λ , and test this among consumers who search once where they
incur search costs.
————— Insert Table 4 here —————
We generalize this test beyond just the expected price, which for a normal distribution is the
same as the median price. Specifically, let pq represent the price corresponding to the qth percentile
28

in the true price distribution. Following HC16, this implies that, under simultaneous search, the
proportion of price draws below pq should equal q, i.e. Pr(
p < pq)= q, irrespective of the number
of searches conducted. Table 4 reports the proportion of prices sampled below the different price
quantiles (columns). The first column reports the results in HC16 (corresponding to the expected
price) and the other columns report the proportions for the 25th and the 75th percentiles of the
price distribution. Focusing on the first column, we find that the proportion of sampled prices
which are below the expected price is higher than 50% for the first search which points to the
first search being done sequentially, which is not surprising given that the first search was free.
However, the proportion of sampled prices which are below the expected price is not significantly
different from 50% for searches 2, 3 and 4, which subject to the rational expectations assumptions,
implies that subjects are utilizing the simultaneous search method and is consistent with HC16.
We find consistent results if instead of the expected price, we consider the 25th percentile or the
75th percentile of the price distribution (columns 2 and 3 of Table 4).
————— Insert Table 5 here —————
Finally, we utilize information on the search sequence to test whether, assuming rational expec-
tations, the likelihood to continue searching depends on how the current sampled price compares
to the expected price from one additional search. Specifically, we test whether the decision to
continue searching hinges on how the current sampled price compares to the price the consumer
would have seen in the subsequent search. While data limitations constrain DHW12 to focus only
on the decision to engage in one versus two searches, we generalize this test to account for multiple
searches. Table 5 reports the results from a logistic regression in which we regress the decision to
continue searching (after the first, second and third search separately) on whether the current price
is lower than the subsequent price or not. Consistent with DHW12, we find that the coefficient for
the currently sampled price being lower than the subsequent price is negative but not significantly
different from zero, which again rules out sequential search. Thus, subject to the rational expec-
tations assumption, and in the absence of accounting for price beliefs, we conclude, similar to the
previous literature, that subjects engage in simultaneous search.
29

6.2 The Role of Price Beliefs
To understand how knowledge of price beliefs might allow us to infer the search method, we
estimate a logit model corresponding to the probability that subject i decides to buy the product
after searching k times, i.e.,
Pr(buyik) =exp(α +β pik + γE(pik+1)+δσik+1)
1+ exp(α +β pik + γE(pik+1)+δσik+1)(8)
where pik is the lowest sampled price after k searches, and E(pik+1) and σik+1 are the mean and
standard deviation of the updated posterior belief distribution as estimated based on the belief
elicitation task. If subjects engage in simultaneous search, then the updated posterior price beliefs
should not influence the subjects’ decision to search more. Table 6 reports the results from this
model based on all searches and after excluding the first search since the first search is free. While
we do not find a significant effect of the standard deviation, the mean of the updated posterior price
belief distribution has a positive and significant effect on the decision to stop searching. Thus, after
accounting for subjects’ updated beliefs, we conclude that subjects engage in sequential search,
which highlights the importance of accounting for price beliefs when inferring the search method.
————— Insert Table 6 here —————
To understand how accounting for beliefs influences inference of the search method, we note
that the tests for simultaneous or sequential search rely on rational expectations, which imply that
any search outcome can be deemed as favorable (lower than the average price) or unfavorable (hig-
her than the average price) by the subject. Specifically, the tests explore whether subjects’ decision
to continue searching hinges on whether the searched outcomes are favorable or unfavorable. By
contrast, if subjects learn about the true distribution of prices, then search outcomes cannot be
classified as favorable or unfavorable unless the consumer has searched enough to realize the true
distribution of prices. This lack of ability to classify a search outcome as favorable or unfavorable
when the subject learns about the true price distribution results in differences in inferred search
method. Let’s consider two scenarios. First, assume that subjects have prior beliefs significantly
30
lower than the true price distribution and on each successive search, subjects get monotonically
increasing but favorable price draws from the true price distribution. The subjects update beliefs
in response to the searched prices, but continue searching as they believe that these prices are “un-
favorable”. In the absence of price beliefs, we would observe subjects making a large number of
searches even when the search outcomes were favorable, which assuming rational expectations,
would rule out sequential search. Similarly, let’s consider a scenario where subjects’ prior beliefs
are significantly higher than the true price distribution and in each successive search, subjects get
monotonically decreasing but unfavorable price draws from the true price distribution. Subjects
again updates beliefs in response to the searched prices, but believe these prices to be a good
“deal” and decide to purchase before searching extensively. In the absence of price beliefs, we
would observe subjects purchasing with less favorable search outcomes, which assuming rational
expectations, would again rule out sequential search. These examples provide intuition as to why
assuming rational expectations could lead the researcher to infer that search is simultaneous, even
though the underlying data generating process is consistent with sequential search.
7 Robustness to Alternative Specifications
The estimated search costs reported earlier rely solely on the theoretical predictions of the different
search models and do not impose any parametric assumptions on the utility function. We assume
that subjects are searching for the lowest price and have a constant search cost. As we discuss in
Section 5, not imposing any structure or assumptions on belief updating results in about 25-30%
subjects with the estimated lower bound higher than the estimated upper bound. This issue is
specific to the sequential search model and can potentially be attributed to some random shocks
subjects realize to their search costs in each period, idiosyncratic preferences for different retailers,
or the assumption that the optimal stopping rule is myopic in nature..16 While our study does not
allow us to estimate retailer preferences, we perform robustness checks to our base sequential
16If search is not myopic, then not accounting for the option value from future searches will lead to an underestima-tion of search costs.
31

search model by estimating two different models - (i) allowing for random shocks to search costs,
and (ii) accounting for potential dynamic search.
In the model which allows for random shocks to search costs, we assume that a subject realizes
a shock before searching and that the shock is unobserved to the researcher. Let εcik ∼ N(0,1)
denote the shock to search cost for subject i on the kth search. The subject’s decision to continue
searching, thus, depends on the expected gain from searching Γseqik+1 (=
∫ pik0 (pik− p)dFik) and the
magnitude of search cost. As a researcher, we do not observe the shock to search cost so the
probability of continuing to search is given by
Pr(search) = Pr(Γ
seqik+1 > ci + ε
cik)
= Φ(Γ
seqik+1− ci
)(9)
where Φ(.) is the cumulative distribution function of the normal distribution. This model, thus,
allows for the possibility that, given the shock to search cost, the inferred upper bound (Γseqik+1)
might be underestimated resulting in the observed inconsistency. Figure 7 plots the distribution
of search costs from the base sequential search model (green dashed curve) along with the model
which allows for random shocks to search costs (purple dashed curve). While we do find some dif-
ferences in the estimated search costs, these differences are small as compared to the bias induced
from assuming rational expectations (Figure 4).
————— Insert Figure 7 here —————
Alternately, it is possible that the inconsistency in estimated bounds stems from our assumption
that the optimal stopping rule, and hence the search, is myopic in nature. We now allow search to
be dynamic i.e. we allow a subject’s decision to continue searching to be driven by the potential
benefit in the future from updated beliefs about market prices. Recall that, if beliefs follow a
normal distribution and the updated price belief is a convex combination of the prior belief and the
searched outcome, then as Bikhchandani and Sharma (1996) show, optimal search is myopic in
nature. We explicitly test this by estimating a dynamic search model which allows for the “option”
32
value of benefiting from future searches. To do so, we note that subjects were informed that they
will see at most four search outcomes. Thus, the expected benefit from searching further in the last
retail scenario only depends on the price beliefs at the beginning of the last scenario and not on
how subjects update beliefs after the last scenario.17
We use the expected benefit in the last search scenario to backward deduce the expected be-
nefit in the previous search scenario. Specifically, for each retail scenario before the last one, we
compute the expected benefit from searching once, two times, three times etc. by integrating out
over the distribution of prices in each period and allowing for a subject to learn about the true price
distribution based on the observed prices.18 This requires us to integrate over the distribution of
possible search outcomes (observed prices). A priori, it is not clear which distribution of prices
should be used for drawing search outcomes. We consider two potential distributions:the true price
distribution and the subjects’ current price beliefs. In either case, we follow our analysis on belief
updating and write down a reduced form model of belief updating where the subjects’ updated
mean and standard deviation are a function of the prior mean and standard deviation and the se-
arch outcome, respectively. Figure 7 also plots the distribution of search costs from the models
which allow for dynamic search. The estimates under either assumption on the price distribution
are almost identical to the estimates under the base model of myopic search with elicited belief
distributions, which also validates our approach in which the optimal stopping rule is myopic in
nature.
8 Discussion and Conclusion
The extant literature in marketing and economics adopts either a simultaneous or a sequential
search method, estimates search costs (subject to the chosen method), and provides implications
for pricing and market structure. The majority of these papers assume that consumers have rational
17This is similar to dynamic discrete choice models with a terminal period in which the utility in the terminal periodonly depends on the terminal period state vector and not on the beliefs about future realizations of the state variables.
18Web Appendix D outlines the algorithm to compute the expected benefit from searching under dynamic search.
33

expectations in that they know the true distribution of prices. While we understand the need to
make this assumption, ex ante, it is not clear whether consumers know the true price distribution
for less frequently purchased big ticket items, especially given the frequent changes in market
structure in different industries. In this paper we elicit price beliefs and study how the knowledge
of price beliefs informs consumer search costs and method. We study this question in the context of
a KitchenAid mixer which is typically sold for around $300 - $400 and is not purchased frequently
by consumers. This, thus, provides an ideal setting to study the role of price beliefs and the
implications of the assumptions routinely made in the search literature.
We find that subjects differ substantially in the prior beliefs about the prices of the mixer, and
update these beliefs in response to search outcomes. Further, assuming rational expectations sig-
nificantly biases the estimated search costs. For both simultaneous and sequential search models,
assuming that subjects know the true price belief distribution upward biases the median estimate
of search costs by at least 50% on average. For the sequential search model, the magnitude of
bias is influenced by both - heterogeneous prior beliefs and direction of belief updating, but prior
beliefs explain significantly more variation in the bias as compared to belief updating. Importantly,
while there exists heterogeneity in the standard deviation of the price belief distribution and while
subjects meaningfully update the standard deviation of this distribution based on search outcomes,
assuming that all subjects have the same standard deviation as that of the true price distribution
does not influence the distribution of search costs. Finally, assuming rational expectations and the
underlying search method have implications for how a reduction in search cost affects the incre-
ase in the number of searches, the proportion of subjects who search more, and the proportion of
subjects who purchase from a different retailer.
Accounting for heterogeneous price beliefs is also important for inferring the correct search
method. Consistent with previous research, if we assume rational expectations, then patterns in the
data suggest that subjects engage in simultaneous search. Accounting for price beliefs, however,
rules out simultaneous search in favor of sequential search. HC16 show that an incorrect speci-
fication of the search process results in biases in predicted search, consideration sets, and market
34

shares. This has implications for the optimal prices a retailer may charge. In our context, we
find similar results for the search cost elasticities where in addition to the assumption about search
method, different assumptions about prior beliefs result in biased estimates of search cost elastici-
ties with respect to number of searches, proportion of subjects searching more, and proportion of
subjects purchasing from a different retailer.
These results have important implications for both, academics as well as managers. From an
academic perspective, the findings further our understanding of the role of price beliefs in infor-
ming search costs and inference about search method. While some results, such as the relationship
between the magnitude of bias and the prior beliefs, might appear intuitive, other results on the
relative importance of standard deviation as compared to the mean of the prior beliefs, and the
importance of prior beliefs relative to belief updating in explaining biases in search costs are the-
oretically ambiguous. To this end, this paper provides the intuition behind how prior beliefs and
belief updating influence search cost estimates and inference about search method. These results
are also relevant to managers who are interested in how consumers search and the implications of
search on market shares and price dispersion. Specifically, the results herein emphasize the need
to account for consumers’ prior beliefs to accurately estimate search costs, which can then be used
to understand market structure. In the absence of prior beliefs, and assuming rational expectati-
ons, managers can recover search costs but will be unable to assess the magnitude and direction
of bias in the estimated search costs, which crucially depends on how the consumers’ prior beliefs
compare to the true price distribution.
While we believe the paper makes an important contribution to the search literature as well as
the literature on belief elicitation and updating, we acknowledge several limitations of our study.
First, under search with learning about prices, a consumer may decide to stop searching and not
purchase the product if the updated price beliefs make purchase unattractive. In our study, we do
not account for the option of stopping to search and not purchasing. Doing so would require us to
make some parametric assumptions about the utility function to separate product and price prefe-
rence from search costs. By contrast, our study design consistently estimates the bounds on search
35

costs in absence of any parametric assumptions. Second, as mentioned earlier, we consider search
over prices of a homogeneous good. Extending the analysis to heterogeneous goods is of value but
would require more parametric assumptions so we leave this to future research. Third, while our
survey design allows us to use aggregate data patterns to comment on whether subjects engage in
simultaneous or sequential search, subjects may differ in their search method. It is possible that
some subjects engage in simultaneous search while others engage in sequential search. Further,
subjects may also search in stages which combine simultaneous and sequential search methods
(Morgan and Manning (1985) and Harrison and Morgan (1990)). Understanding the nature of se-
arch at an individual-level would require a longer search history for each subject. In this paper,
our emphasis was on inferring the standard deviation of the belief distribution which is more time
consuming and requires substantially more elicitations than required for inferring just the mean.
Thus, we defer a formal treatment of inferring search at the individual level to future research.
Finally, in our analysis we assume that the subjects’ beliefs follow a normal distribution. While
this assumption is supported by the data, and we do a robustness check around this assumption,
it is possible to extend the analysis to allow for more flexible (non-parametric) price belief distri-
butions. Accounting for such non-parametric price distributions may result in non-myopic search,
which, we believe is an interesting topic for future research.
36

References
BAYE, M. R., J. MORGAN, AND P. SCHOLTEN (2006): Information, Search, and Price Disper-
sionvol. 1, chap. 6, pp. 323–376. Elsevier, Amsterdam.
BIKHCHANDANI, S., AND S. SHARMA (1996): “Optimal search with learning,” Journal of Eco-
nomic Dynamics and Control, 20(1), 333 – 359.
BRONNENBERG, B. J., J. B. KIM, AND C. F. MELA (2016): “Zooming in on choice: How do
consumers search for cameras online?,” Marketing Science, 35(5), 693–712.
CHEN, Y., AND S. YAO (2016): “Sequential Search with Refinement: Model and Application with
Click-Stream Data,” Management Science, 63(12), 4345–4365.
COSTA-GOMES, M. A., AND G. WEIZSACKER (2008): “Stated Beliefs and Play in Normal-Form
Games,” The Review of Economic Studies, 75(3), 729–762.
DE LOS SANTOS, B., A. HORTACSU, AND M. R. WILDENBEEST (2012): “Testing Models of
Consumer Search using Data on Web Browsing and Purchasing Behavior,” American Economic
Review, 102(6), 2955–80.
(2017): “Search with Learning for Differentiated Products: Evidence from E-Commerce,”
Journal of Business & Economic Statistics, 35(4), 626–641.
DELAVANDE, A. (2008): “Pill, Patch or Shot? Subjective Expectations and Birth Control Choice,”
International Economic Review, 49(3), 999–1042.
DOMINITZ, J., AND C. F. MANSKI (1996): “Eliciting Student Expectations of the Returns to
Schooling,” The Journal of Human Resources, 31(1), 1–26.
(1997): “Using Expectations Data to Study Subjective Income Expectations,” Journal of
the American Statistical Association, 92(439), 855–867.
(2004): “How Should We Measure Consumer Confidence?,” Journal of Economic Per-
spectives, 18(2), 51–66.
(2005): “Measuring and Interpreting Expectations of Equity Returns,” manuscript.
DUBE, J.-P., G. J. HITSCH, AND P. JINDAL (2014): “The Joint Identification of Utility and
Discount Functions from Stated Choice Data: An Application to Durable Goods Adoption,”
37

Quantitative Marketing and Economics, 12(4), 331–377.
ERDEM, T., AND M. P. KEANE (1996): “Decision-Making under Uncertainty: Capturing Dynamic
Brand Choice Processes in Turbulent Consumer Goods Markets,” Marketing Science, 15(1), 1–
20.
ERDEM, T., M. P. KEANE, T. S. ONCU, AND J. STREBEL (2005): “Learning about Compu-
ters: An Analysis of Information Search and Technology Choice,” Quantitative Marketing and
Economics, 3(3), 207–247.
FERRELL, W. R., AND P. J. MCGOEY (1980): “A Model of Calibration for Subjective Probabili-
ties,” Organizational Behavior and Human Performance, 26(1), 32–53.
GARTHWAITE, P., J. KADANE, AND A. O’HAGAN (2005): “Statistical Methods for Eliciting
Probability Distributions,” Journal of the American Statistical Association, 100(470), 680–700.
HARRISON, G. W., AND P. MORGAN (1990): “Search Intensity in Experiments,” The Economic
Journal, 100(401), 478–486.
HONG, H., AND M. SHUM (2006): “Using Price Distributions to estimate Search Costs,” The
RAND Journal of Economics, 37(2), 257–275.
HONKA, E. (2014): “Quantifying Search and Switching Costs in the U.S. Auto Insurance Indu-
stry,” The RAND Journal of Economics, 45(4), 847–884.
HONKA, E., AND P. CHINTAGUNTA (2016): “Simultaneous or Sequential? Search Strategies in
the U.S. Auto Insurance Industry,” Marketing Science, 36(1), 21–42.
HORTACSU, A., AND C. SYVERSON (2004): “Product Differentiation, Search Costs, and Com-
petition in the Mutual Fund Industry: A Case Study of S&P 500 Index Funds,” The Quarterly
Journal of Economics, 119(2), 403–456.
HOSSAIN, T., AND R. OKUI (2013): “The Binarized Scoring Rule,” Review of Economic Studies,
80(3), 984–1001.
HU, M. M., C. I. DANG, AND P. K. CHINTAGUNTA (2018): “Groupon Fatigue: Search & Lear-
ning in a Daily Deals Site,” manuscript.
JINDAL, P. (2015): “Risk Preferences and Demand Drivers of Extended Warranties,” Marketing
38

Science, 34(1), 39–58.
JUSTER, F. T. (1966): “Consumer Buying Intentions and Purchase Probability: An Experiment in
Survey Design,” Journal of the American Statistical Association, 61(315), 658–696.
KAHNEMAN, D., AND A. TVERSKY (1979): “Prospect Theory: An Analysis of Decision under
Risk,” Econometrica, 47(2), 263–291.
KIM, J. B., P. ALBUQUERQUE, AND B. J. BRONNENBERG (2010): “Online Demand under Li-
mited Consumer Search,” Marketing Science, 29(6), 1001–1023.
(2016): “The Probit Choice Model under Sequential Search with an Application to Online
Retailing,” Management Science, 63(11), 3911–3929.
KORIAT, A., S. LICHTENSTEIN, AND B. FISCHHOFF (1980): “Reasons for Confidence.,” Journal
of Experimental Psychology: Human learning and memory, 6(2), 107.
KOULAYEV, S. (2013): “Search with Dirichlet Priors: Estimation and Implications for Consumer
Demand,” Journal of Business & Economic Statistics, 31(2), 226–239.
LANDSBERGER, M., AND D. PELED (1977): “Duration of Offers, Price Structure, and the Gain
from Search,” Journal of Economic Theory, 16(1), 17–37.
LEWIS, M. S. (2011): “Asymmetric Price Adjustment and Consumer Search: An Examination of
the Retail Gasoline Market,” Journal of Economics & Management Strategy, 20(2), 409–449.
LIPPMAN, S. A., AND J. J. MCCALL (1976): “The Economics of Job Search: A Survey,” Econo-
mic Inquiry, 14(2), 155–189.
MANSKI, C. F. (2004): “Measuring Expectations,” Econometrica, 72(5), 1329–1376.
MATSUMOTO, B., AND F. SPENCE (2016): “Price beliefs and experience: Do consumers’ beliefs
converge to empirical distributions with repeated purchases?,” Journal of Economic Behavior &
Organization, 126, 243–254.
MCCALL, J. J. (1970): “Economics of Information and Job Search,” The Quarterly Journal of
Economics, 84(1), 113–126.
MEHTA, N., S. RAJIV, AND K. SRINIVASAN (2003): “Price Uncertainty and Consumer Search:
A Structural Model of Consideration Set Formation,” Marketing Science, 22(1), 58–84.
39

MORAGA-GONZALEZ, J. L., Z. SANDOR, AND M. R. WILDENBEEST (2013): “Semi-
Nonparametric Estimation of Consumer Search Costs,” Journal of Applied Econometrics, 28(7),
1205–1223.
MORGAN, P., AND R. MANNING (1985): “Optimal Search,” Econometrica, 53(4), 923–944.
MORTENSEN, D. T. (1970): “Job Search, the Duration of Unemployment, and the Phillips Curve,”
The American Economic Review, 60(5), 847–862.
NERLOVE, M. (1958): “Adaptive expectations and cobweb phenomena,” The Quarterly Journal
of Economics, 72(2), 227–240.
NYARKO, Y., AND A. SCHOTTER (2002): “An Experimental Study of Belief Learning using Eli-
cited Beliefs,” Econometrica, 70(3), 971–1005.
OAKLEY, J. E., AND A. O’HAGAN (2007): “Uncertainty in Prior Elicitations: A Nonparametric
Approach,” Biometrika, 94(2), 427–441.
ROSENFIELD, D. B., AND R. D. SHAPIRO (1981): “Optimal Adaptive Price Search,” Journal of
Economic Theory, 25(1), 1–20.
ROTHSCHILD, M. (1974): “Searching for the Lowest Price When the Distribution of Prices Is
Unknown,” Journal of Political Economy, 82(4), 689–711.
RUST, J. (1987): “Optimal Replacement of GMC Bus Engines: An Empirical Model of Harold
Zurcher,” Econometrica, 55(5), 999–1033.
SCHOTTER, A., AND I. TREVINO (2014): “Belief Elicitation in the Laboratory,” Annual Review
of Economics, 6, 103–128.
SEILER, S. (2013): “The Impact of Search Costs on Consumer Behavior: A Dynamic Approach,”
Quantitative Marketing and Economics, 11(2), 155–203.
SEILER, S., AND F. PINNA (2017): “Estimating Search Benefits from Path-Tracking Data: Mea-
surement and Determinants,” Marketing Science, 36(4), 565–589.
SORENSEN, A. T. (2001): “An Empirical Model of Heterogeneous Consumer Search for Retail
Prescription Drugs,” Discussion paper, National Bureau of Economic Research.
SPENCE, F. (2015): “Consumer Experience and the Value of Search in the Online Textbook Mar-
40
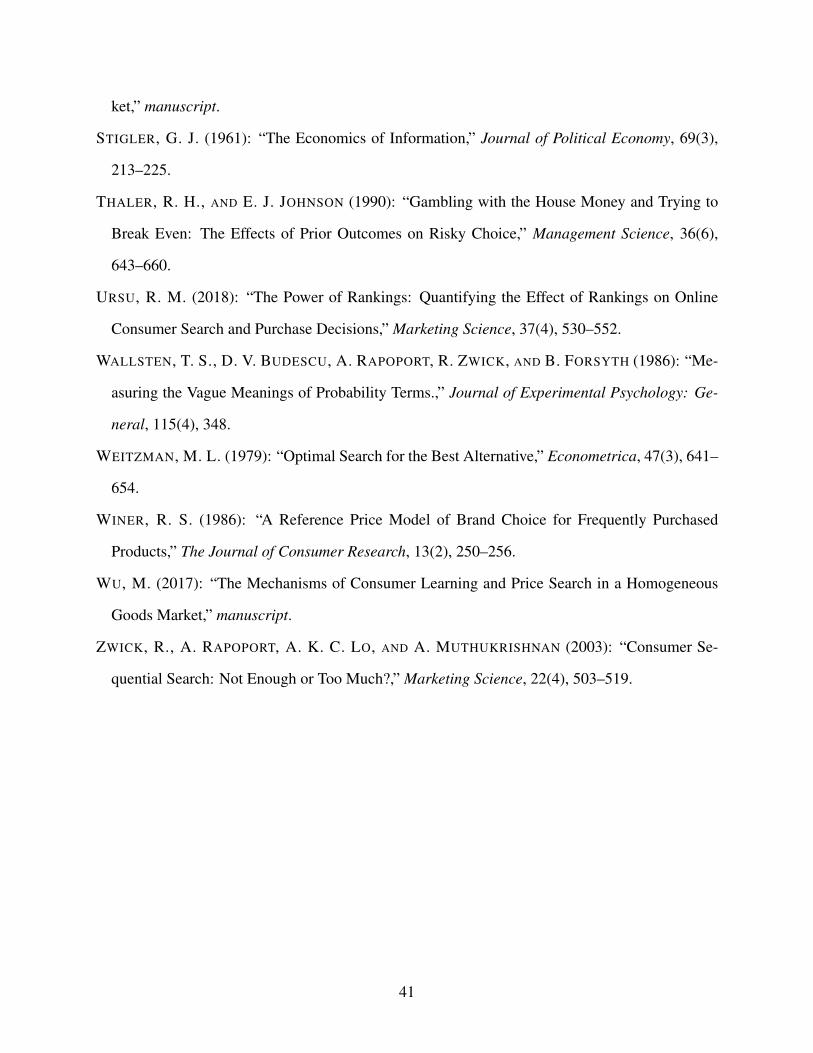
ket,” manuscript.
STIGLER, G. J. (1961): “The Economics of Information,” Journal of Political Economy, 69(3),
213–225.
THALER, R. H., AND E. J. JOHNSON (1990): “Gambling with the House Money and Trying to
Break Even: The Effects of Prior Outcomes on Risky Choice,” Management Science, 36(6),
643–660.
URSU, R. M. (2018): “The Power of Rankings: Quantifying the Effect of Rankings on Online
Consumer Search and Purchase Decisions,” Marketing Science, 37(4), 530–552.
WALLSTEN, T. S., D. V. BUDESCU, A. RAPOPORT, R. ZWICK, AND B. FORSYTH (1986): “Me-
asuring the Vague Meanings of Probability Terms.,” Journal of Experimental Psychology: Ge-
neral, 115(4), 348.
WEITZMAN, M. L. (1979): “Optimal Search for the Best Alternative,” Econometrica, 47(3), 641–
654.
WINER, R. S. (1986): “A Reference Price Model of Brand Choice for Frequently Purchased
Products,” The Journal of Consumer Research, 13(2), 250–256.
WU, M. (2017): “The Mechanisms of Consumer Learning and Price Search in a Homogeneous
Goods Market,” manuscript.
ZWICK, R., A. RAPOPORT, A. K. C. LO, AND A. MUTHUKRISHNAN (2003): “Consumer Se-
quential Search: Not Enough or Too Much?,” Marketing Science, 22(4), 503–519.
41

Table 1: Survey Summary - Pre and post survey familiarity and purchase behavior for home appli-ances and KitchenAid mixer
Pre-Survey Measures
Current familiarity with the kitchen appliance prices N Percent
Average price and variation 103 37%
Average price but not variation 134 48%
Do not have a good sense 44 16%
Have purchased kitchen appliance in the past 256 91%
Own stand mixer 158 56%
How often use stand mixer (per month) 1.98
How often cook at home (per week) 4.41
How often bake at home (per week) 1.07
Interest in purchasing mixer in near future (5-point scale) 3.11
Knowledge about prices of KitchenAid mixer (7-point scale) 4.12
Post-Survey Measures
Extent of agreement (5-point scale)
Purchase most home appliances online 2.74
Like to see the appliance in person before purchasing 4.06
Extensively search for the best price before purchasing 4.27
Purchase once I find the appliance with all the features I like 3.89
Stores are unable to match prices offered by websites 3.07
Can purchase home appliances at lower prices online 3.55
Great kitchen appliance is worth paying a lot of money for 3.48
Less willing to buy new appliances if they have a high price 3.76
Price of buying new appliances is important to me 4.20
Don’t mind spending a lot to buy a new appliance 2.69
Involvement in purchasing home appliances N Percent
I decide 158 56%
My spouse/partner and I together decide 111 40%
My spouse/partner decides 7 2%
Someone else decides 5 2%
Familiarity with features of KitchenAid mixer (7-point scale) 5.2
Knowledge about prices of KitchenAid mixer (7-point scale) 5.87
Clarity and Realistic? N Percent
Survey questions were clear 247 88%
Price thresholds were realistic 230 82%
Note. The table summarizes the subjects familiarity and purchase intentions for home appliances and KitchenAidmixer both, pre and post belief elicitation and search tasks.
42

Table 2: Determinants of Bias in Search Cost EstimatesSimultaneous Sequential Seq. - Sim.
Intercept 8.17**(2.48)
43.56**(8.03)
21.68**(5.56)
Higher Prior Mean -21.82**(2.69)
-43.32**(5.63)
Higher Prior St. Dev. 9.32**(2.65)
1.84(5.76)
Positive updating Mean -18.46**(6.81)
-18.79**(6.41)
Positive updating St. Dev. 0.16(6.12)
3.61(5.88)
Note. The table reports results from regressions with bias in search costs as the dependent variable and whether subjectshave higher prior beliefs (as measured by mean and standard deviation) and whether they update beliefs positively ornot as the independent variables. The bias for both simultaneous (column 1) and sequential (column 2) models iscomputed as the difference between search costs estimated with elicited heterogeneous beliefs and those estimatedassuming the subjects know the true price distribution (rational expectations). Additionally, column 3 reports resultsfrom the regression with difference in search costs estimated with elicited heterogeneous beliefs under the sequentialand simultaneous search models, respectively. ** indicates coefficients which are significantly different from 0 at the95% confidence level.
Table 3: Search Cost ElasticitiesSimultaneous Search Sequential Search
% Increase in Number of SearchesElicited Belief Distribution 17.30% (2.56%) 18.51% (1.73%)Elicited Mean with True Std 21.94% (2.85%) 21.42% (1.99%)
True Distribution 5.64% (1.46%)** 17.34% (1.57%)++
% Subjects Searching MoreElicited Belief Distribution 34.23% (3.90%) 49.66% (4.11%)++
Elicited Mean with True Std 39.60% (4.02%) 51.68% (4.11%)++
True Distribution 12.08% (2.68%)** 48.32% (4.11%)++
% Subjects Purchasing from Different RetailerElicited Belief Distribution 12.08% (2.68%) 14.77% (2.92%)Elicited Mean with True Std 18.80% (3.21%) 18.80% (3.31%)
True Distribution 2.68% (1.33%)** 20.13% (3.30%)++
Note. The table reports, for each search method, the average percentage increase in the number of searches persubject (top panel), percentage of subjects searching more (middle panel), and percentage of subjects purchasingfrom a different retailer (bottom panel), corresponding to a 10% decrease in the estimated search costs. Standarderrors around the means are reported in parenthesis. ** indicates numbers which are significantly different (at the95% confidence level) from those corresponding to the elicited belief distribution for the same search method in thesame panel. ++indicates numbers in the last column (sequential search) which are significantly different (at the 95%confidence level) from those corresponding to simultaneous search.
43

Table 4: Proportion of Sampled Prices Below Different Quantiles
# Searches 50% 25% 75% # Subjects1 0.69*** (0.07) 0.56*** (0.08) 0.90*** (0.05) 392 0.45 (0.07) 0.33 (0.06) 0.74 (0.06) 1103 0.52 (0.07) 0.26 (0.06) 0.74 (0.06) 1594 0.43 (0.08) 0.21 (0.06) 0.73 (0.07) 164
Note. The table reports for each quartile of the price distribution (columns), the proportion of sampled prices whichare below the corresponding quartile conditional on the number of searches (rows). Standard errors are reported inparenthesis. The last column reports the number of subjects who engaged in the number of searches mentioned in thefirst column. The asterisk denote the following: ***: p < 0.01.
Table 5: Search decision versus Current PriceSearch No. 1 2 3
I(pi,k < pi,k+1) -0.68*(0.38)
-0.48(0.32)
-0.52(0.33)
Note. The table reports results from a logistic regression of decision to continue searching on a variable which takesthe value 1 if the current searched price is lower than the subsequent searched price. Each column reports results froma different regression corresponding to the search number. The asterisk denote the following: *: p < 0.1.
Table 6: Role of Price Beliefs in Search DecisionAll Searches Excluding First Search
Price -2.35*** (0.29) -2.19*** (0.34)Mean - Price Belief 0.39*** (0.12) 0.35*** (0.14)
St. Dev. - Price Belief 0.24 (0.18) 0.02 (0.18)
Note. The table reports results from a logistic regression of decision to purchase on the current lowest price, the meanand the standard deviation of the distribution of market price beliefs. The table reports results separately for analysisincluding all searches, and that which excludes the first search. The asterisk denote the following: ***: p < 0.01.
44

Figure 1: Survey Design (Flowchart)
Note. The figure shows the flow of the survey in terms of the sequence of different search tasks and the belief elicitationtasks. Along with the survey flow, the figure also shows the potential money earned and lost along each path.
45

●
●
●
●
0
25
50
75
100
1st 2nd 3rd 4th
Threshold
Ave
rage
_CD
FWithin−individual Average CDF for Each Threshold
●
●●
●
0
10
20
30
1st 2nd 3rd 4th
Threshold
SD
_CD
F
Within−individual Std. Dev. of CDF for Each Threshold
Figure 2: Variation in subjects responses to price thresholds, price changes and search decisions
Note. The top left figure shows the box plot across subjects of the average probability (across different belief elicitati-ons) plotted by each price quantile. The top right figure shows the distribution of the within subject standard deviationacross these elicited probabilities plotted by price quantile. The bottom left scatter plot plots the relationship betweenthe search outcome and the elicited median of the price belief distribution. Finally, the bottom right figure shows thedistribution of number of searches incurred by each subject.
46

0.000
0.003
0.006
0.009
0 200 400 600
Mean_Price
dens
ity
Condition
Posterior
Prior
True
Mean Price Belief Distributions
0.000
0.005
0.010
0.015
0 100 200 300 400
Std_Price
dens
ity
Distribution of Prior Standard Deviation
Figure 3: Subject’s Belief DistributionsNote. The top figure shows the distribution (across subjects) of the estimated means of the prior distribution asmeasured at the beginning of the study, the true price distribution, and the distribution of the posterior means acrosssubjects as measured after the completion of all search tasks. The bottom figure shows the distribution (across subjects)of the estimated standard deviation of the prior belief distribution.
47
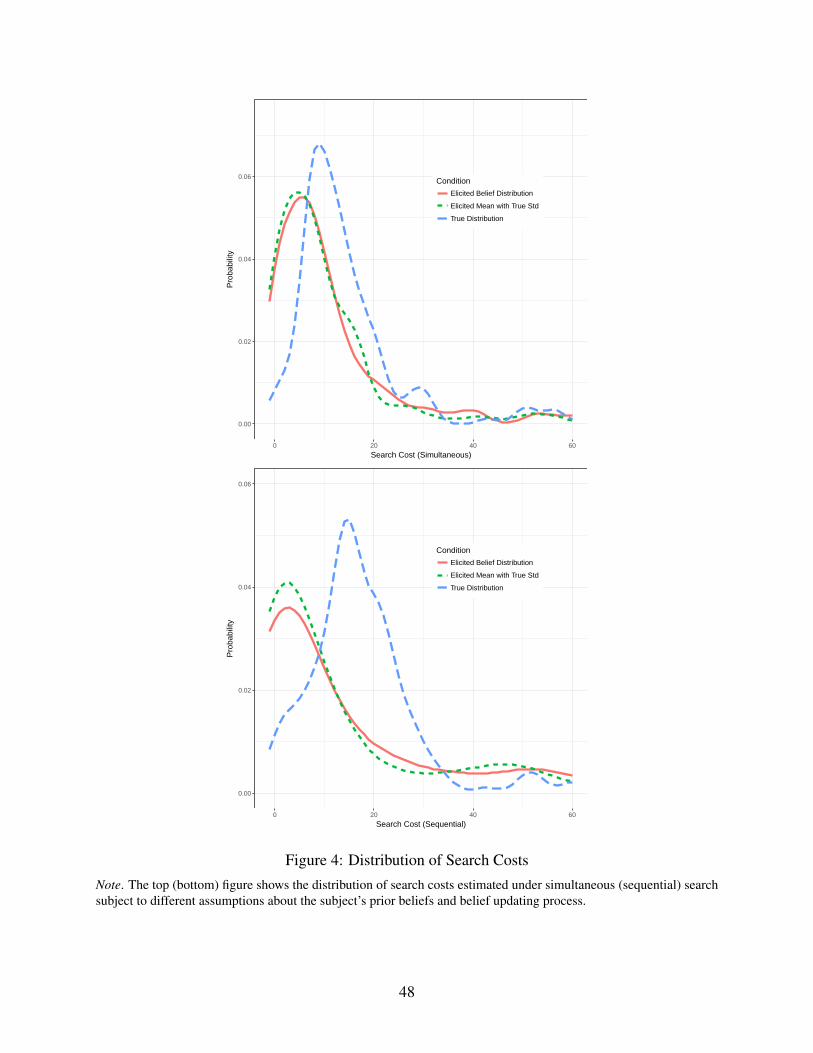
0.00
0.02
0.04
0.06
0 20 40 60
Search Cost (Simultaneous)
Pro
babi
lity
Condition
Elicited Belief Distribution
Elicited Mean with True Std
True Distribution
0.00
0.02
0.04
0.06
0 20 40 60
Search Cost (Sequential)
Pro
babi
lity
Condition
Elicited Belief Distribution
Elicited Mean with True Std
True Distribution
Figure 4: Distribution of Search CostsNote. The top (bottom) figure shows the distribution of search costs estimated under simultaneous (sequential) searchsubject to different assumptions about the subject’s prior beliefs and belief updating process.
48

Figure 5: Bias in Search Cost Based on Direction of Prior Belief and Belief UpdatingNote. The figure shows the average bias in search costs across different groups of subjects estimated under the simul-taneous search model (left panel) and sequential search model (middle panel). Subject groups are defined based onwhether the prior expected price is higher or lower than the average price of the observed distribution, and whethersubjects update beliefs in a upward (positive) or downward (negative) direction. The right panel shows the averagedifference between the search costs estimated under sequential and simultaneous search models utilizing the elici-ted heterogeneous beliefs. The error bars show the 95% confidence interval around the average bias in search costestimates.
Figure 6: Choice Distribution and Average Sampled PricesNote. The left (right) figure shows the distribution of number of searches (average sampled price by number ofsearches) across subjects.
49

0.00
0.01
0.02
0.03
0.04
0 20 40 60
Search Cost (Sequential)
Pro
babi
lity
Condition
Dynamic Search − Individual Belief draws
Dynamic Search − True Distribution draws
Myopic Search − Elicited Belief Distribution
Myopic Search − Search Cost Shock
Figure 7: Search Cost distribution under Alternate Model SpecificationsNote. The figure shows the distribution of search costs estimated under alternate models which either allow for shocksto search costs or model dynamic search with learning about the distribution of true prices.
50

A Web Appendix - Survey Screenshots
Figure 8: Math Screener Questions
51

Figure 9: KitchenAid Mixer Description
52

Figure 10: Prior Belief Elicitation
53

Figure 11: Posterior Belief Elicitation and Choice
54
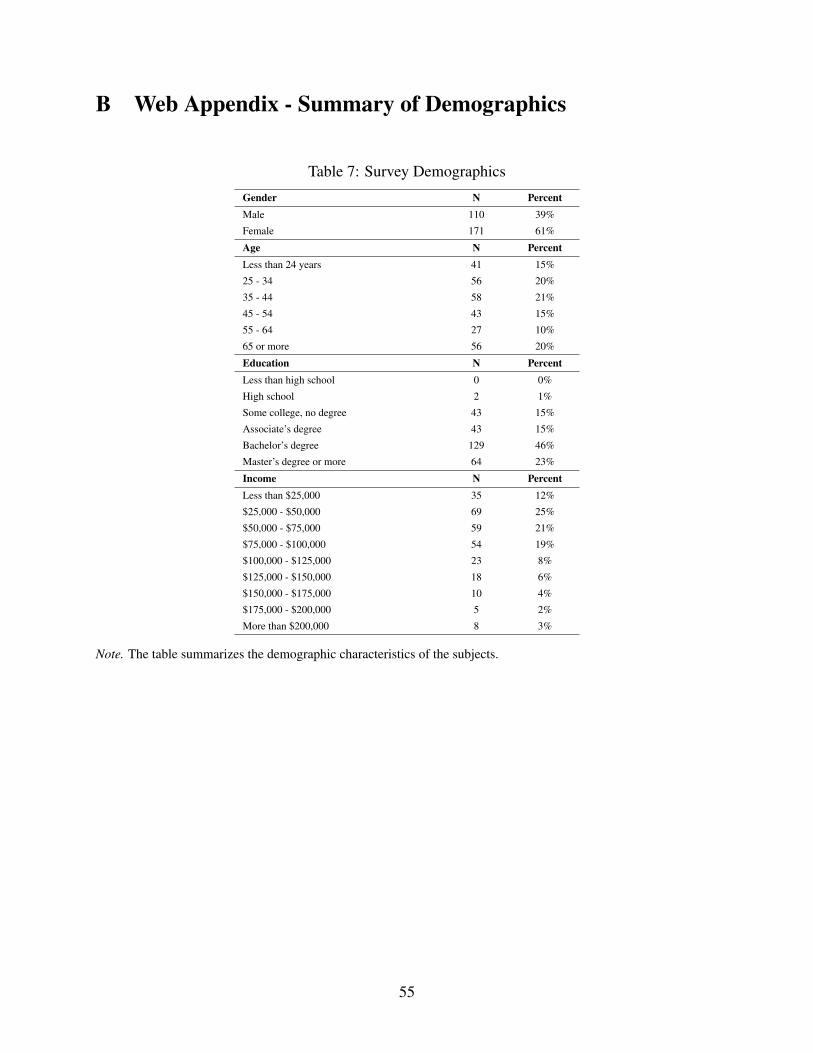
B Web Appendix - Summary of Demographics
Table 7: Survey Demographics
Gender N PercentMale 110 39%
Female 171 61%
Age N PercentLess than 24 years 41 15%
25 - 34 56 20%
35 - 44 58 21%
45 - 54 43 15%
55 - 64 27 10%
65 or more 56 20%
Education N PercentLess than high school 0 0%
High school 2 1%
Some college, no degree 43 15%
Associate’s degree 43 15%
Bachelor’s degree 129 46%
Master’s degree or more 64 23%
Income N PercentLess than $25,000 35 12%
$25,000 - $50,000 69 25%
$50,000 - $75,000 59 21%
$75,000 - $100,000 54 19%
$100,000 - $125,000 23 8%
$125,000 - $150,000 18 6%
$150,000 - $175,000 10 4%
$175,000 - $200,000 5 2%
More than $200,000 8 3%
Note. The table summarizes the demographic characteristics of the subjects.
55
C Web Appendix - Distribution of Bonuses
0.0
0.1
0.2
0.3
0.0 2.5 5.0 7.5
incentive
dens
ity
Distribution of Incentives
Figure 12: Histogram of the bonuses a subject receivedNote. The figure shows the distribution of the bonuses (over and above the fixed participation fee) subjects receivedbased on their responses to the belief elicitation and search task questions.
56

D Web Appendix - Dynamic Search Model
Below, we outline the steps to compute the search cost bounds under a dynamic search model
where a subject’s decision to continue searching depends not only on the current period expected
benefit from searching, but also on the expected benefit from searching in the future based on the
updated price beliefs, which themselves are a function of the current period search outcome. As
mentioned in the paper, the subjects know that they will see four retail scenarios. Thus, the decision
to search further after the fourth scenario hinges only on the expected benefit from searching once
i.e. future search outcomes are irrelevant in the fourth retail scenario. We focus on the scenario
where the potential search outcomes are drawn from the subjects’ prior beliefs (step 2 below). For
the scenario where potential search outcomes are drawn from the true distribution, step 2 changes
such that the price draws, pdt+1, are from the true distribution and independent of the subject’s
priors.
In our discussion below, we ignore the individual level i subscript for brevity. Let Ft (p) ∼
N (µt ,σt) denote the updated distribution of the price beliefs at the end of t searches (period t).
Further, let pt be the search outcome in period t and pt be the lowest price observed so far such
that pt = min(pt−1, pt). Finally, let gm (.) and gs (.) be the updating functions for mean and stan-
dard deviation, respectively. Specifically, µ t+1 = gm (µt , pt) and σ t+1 = gs (σt , pt). Note that the
estimated beliefs based on elicitation tasks are considered data and denoted by µ and σ . By con-
trast, the beliefs updated based on the updating rules are denoted by µ and σ , respectively. In
period 4, the expected benefit from searching is given by
Γ5 =∫ p4
0(p4− p)dF4 (p) (10)
Consider a subject’s decision to engage in search for the t+1th (t < 4) time after searching t times.
1. The potential benefit in the current period from searching is given by Γt+1 =∫ pt
0 (pt− p)dFt (p).
2. We make D = 100 price draws pdt+1 from the subject’s belief distribution Ft (p) correspon-
57

ding to potential search outcomes in the next search. For each price draw pdt+1, we compute
the lowest price observed pdt+1 = min
(pt , pd
t+1), the updated mean and standard deviation:
µdt+1 = gm
(µt , pd
t+1)
and σdt+1 = gs
(σt , pd
t+1), and the corresponding expected benefit
from searching in the next period as
Γdt+2|pd
t+1 =∫ pd
t+1
0
(pd
t+1− p)
dFdt+1 (p)
The net expected benefit from t +2th search is thus given by Γt+2 =1D ∑D
(Γd
t+2|pdt+1).
3. For each price draw pdt+1, we make further D price draws pdd′
t+2 from the subject’s updated
belief distribution Fdt+1 (p) and compute the expected benefit from search Γdd′
t+3. The expected
benefit from t + 3th search is then given by Γt+3 =1D ∑D
(1D ∑D
(Γdd′
t+3|pdt+1, pdd′
t+2
)). Simi-
larly, we compute the per period expected benefit from all future searches with the expected
benefit from terminal period computed using equation 10.
4. To compute the expected benefit from searching, we account for the fact that the subject may
stop searching after t + 2 search, or after t + 3 search etc. Thus, we calculate the expected
gain conditional on searching t + k times where
Γt+k =1k
k
∑l=1
Γt+l
5. Finally, we compute the maximum expected benefit from all possible conditional benefits
such that Γt+1 = maxk Γt+k. The decision to search is based on whether the expected benefit
Γt+1 is higher or lower than the search cost.
6. The above computation assumes that the price draws pdt+1 come from the subject’s belief
distribution Ft (p). However, the actual search outcomes follow the true price distribution.
Thus, we alternately, compute the search costs by repeating steps 1 through 5 but by assu-
ming that the price draws come from the true price distribution.
58