
The Importance of Monitoring and Performance Analysis of a ...
16
The Importance of Monitoring and Performance Analysis of a Rural Solar PV Electrification Project Malla Avishek 1 , Zahnd Alex 2 , Dr. Haddix McKay Kimber 3 , Ellul Alicia 4 1 Rural Intregrated Development Service (RIDS) -Nepal 2 Kathmandu University & RIDS-Nepal 3 University of Montana & The ISIS Foundation 4 Planet Contracting Services 1 [email protected] , 2 [email protected] ABSTRACT Over the last decade there has been a significant increase in the number of projects implementing solar Photovoltaic (PV) systems for rural electrification. Unfortunately many of these systems are not able to provide the energy services expected by end- users, nor attain their projected life expectancy. Thus, many projects fall short of their intended aim. Long- term monitoring of solar PV systems in their installed context, to analyse their detailed performance over time and local seasonal shifts is almost unheard of, especially in developing countries. The vital information gained through monitoring is essential to understand a system's actual field performance. This leads to more appropriate system design, considering the local context in regard to the prevailing meteorological conditions and energy service demands. Since November 2006, RIDS-Nepal, with the support of the ISIS Foundation, has been monitoring and recording twenty-one parameters for a 2-axis, central-tracking solar PV village system, installed in Tulin village, in the remote high altitude north-west district of Humla, Nepal. The system provides continuous electricity for 3 WLED (white light emitting diode) lamps for each of the twenty-eight households in the village. This paper presents a detailed description of the solar PV data monitoring system as well as graphical presentations and descriptions of the monitored parameters. The analysis focuses on daily solar PV power output, battery bank's performance, load usage and load patterns as well as the system's performance ratio. INTRODUCTION Tulin village is located at latitude 29°59'23.48" North, longitude 81°46'57.05" East and lies at 2’377 meters above sea level. It is a three hour walk along the trekking route to Mansharowar in Tibet from Simikot 1 .Twenty eight households of the village are electrified with a 300W R , 2-axis, self tracking, solar PV system powering a 300Ah, 24V deep cycle battery bank with an autonomy period 2 of 3 days. Each house is connected through underground cabling to the battery bank and has 3 WLED lamps installed, consuming 1 watt each. 1 Headquarter of Humla District 2 Days without sunshine
Transcript of The Importance of Monitoring and Performance Analysis of a ...

The Importance of Monitoring and Performance
Analysis of a Rural Solar PV Electrification Project
Malla Avishek1, Zahnd Alex
2, Dr. Haddix McKay Kimber
3, Ellul Alicia
4
1Rural Intregrated Development Service (RIDS) -Nepal
2 Kathmandu University & RIDS-Nepal
3 University of Montana & The ISIS Foundation
4 Planet Contracting Services
ABSTRACT
Over the last decade there has been a significant increase in the number of projects
implementing solar Photovoltaic (PV) systems for rural electrification. Unfortunately
many of these systems are not able to provide the energy services expected by end-
users, nor attain their projected life expectancy. Thus, many projects fall short of their
intended aim. Long- term monitoring of solar PV systems in their installed context, to
analyse their detailed performance over time and local seasonal shifts is almost unheard
of, especially in developing countries. The vital information gained through monitoring
is essential to understand a system's actual field performance. This leads to more
appropriate system design, considering the local context in regard to the prevailing
meteorological conditions and energy service demands.
Since November 2006, RIDS-Nepal, with the support of the ISIS Foundation, has been
monitoring and recording twenty-one parameters for a 2-axis, central-tracking solar PV
village system, installed in Tulin village, in the remote high altitude north-west district
of Humla, Nepal. The system provides continuous electricity for 3 WLED (white light
emitting diode) lamps for each of the twenty-eight households in the village. This paper
presents a detailed description of the solar PV data monitoring system as well as
graphical presentations and descriptions of the monitored parameters. The analysis
focuses on daily solar PV power output, battery bank's performance, load usage and
load patterns as well as the system's performance ratio.
INTRODUCTION
Tulin village is located at latitude 29°59'23.48" North, longitude 81°46'57.05" East and
lies at 2’377 meters above sea level. It is a three hour walk along the trekking route to
Mansharowar in Tibet from Simikot1.Twenty eight households of the village are
electrified with a 300WR, 2-axis, self tracking, solar PV system powering a 300Ah, 24V
deep cycle battery bank with an autonomy period2 of 3 days. Each house is connected
through underground cabling to the battery bank and has 3 WLED lamps installed,
consuming 1 watt each.
1 Headquarter of Humla District
2 Days without sunshine

A. Malla, A. Zahnd et al.
Solar09, the 47th ANZSES Annual Conference
29 September-2 October 2009, Townsville, Queensland, Australia 2
Fig.1: Tulin village with 28 households and with the 2-axis tracking central PV system
METHODOLOGY
Eleven fundamental parameters are monitored and ten additional parameters are
consequently calculated to determine the status and the performance of the solar PV
village system and its equipment. They are measured and the data recorded using a
DT80 dataLogger3 (see Fig. 2). The measured parameters are identified in the following
table:
Tab. 1: Fundamental parameters measured and equipment / type of sensors used
S.N Parameters Sensor Type Units
1. Ambient Temperature T-type thermocouple ºC
2. Battery Bank Temperature T-type thermocouple ºC
3. PV Cell Temperature T-type thermocouple ºC
4. Horizontal Solar Radiation 80SPC, SolData
Pyranometer4
W/m2
5. Solar Radiation on the Plane of Array (POA) 80SPC, SolData
Pyranometer
W/m2
6. Solar PV Array Current HXS 20-NP5 Current
Transducers
Amperes
7. Solar PV Array Voltage Direct to dataLogger
DT80 connected
DC Volts
8. Battery Bank Voltage Direct to dataLogger DC Volts
3 DT80 from dataTaker: http://www.datataker.com/products/dt80.html
4 http://www.soldata.dk/ and http://www.soldata.dk/PDF/pyrano%2080spc%20A4%20-%20UK.pdf
5 http://www.lem.com/hq/en/content/view/148/126/

A. Malla, A. Zahnd et al.
Solar09, the 47th ANZSES Annual Conference
29 September-2 October 2009, Townsville, Queensland, Australia 3
DT80 connected
9. Battery Bank Current In / Out HXS 20-NP Current
Transducers
Amperes
10. WLED Load Voltage Direct to dataLogger
DT80 connected
DC Volts
11. WLED Load Current HXS 20-NP Current
Transducers
Amperes
The DT80 data logger system is installed in the power house, along with the battery
bank and the main analog volt and ampere indicators (see in Fig. 3 top left corner).
Figures 2 and 3 show some of the details.
Fig. 2: Sensors connected to the DT80 data
logger. A special protective casing was
fabricated for the monitoring equipment.
The DT80 is separately powered with two
20WR Solar PV modules and a 30Ah sealed
deep cycle battery. Care needs to be taken
that the mice can’t easily get access to the
wires.
Fig. 3: Installation of the data logging
system in Tulin village. The program,
specifically written for the data logger
DT80, is loaded and tested. The sensors’
cabling is carefully connected to the data
logger.
The dataTaker6 DT80 samples each of the parameters every 10 seconds and averages it
over one minute. The averaged values are recorded in the DT80’s internal memory
under three different time schedules:
• five minutes (averaged)
• one hour (averaged)
• one day (24-hours averaged)
The data is downloaded monthly to a USB stick directly from the dataTaker DT80.
ANALYSIS
Local available Solar Energy Resource
An important parameter for the design of a solar PV system is the peak sunshine hours
per day over the course of each month of the year. The global solar radiation in Tulin is
measured on two surfaces, the plane of the array (POA), representing the received
6 Logging instrument (www.dataker.com.au )

A. Malla, A. Zahnd et al.
Solar09, the 47th ANZSES Annual Conference
29 September-2 October 2009, Townsville, Queensland, Australia 4
global solar radiation on the solar PV modules in the array, and the horizontal global
solar radiation, which is the international standard, allowing a comparison with other
international data. These two parameters are measured with a pyranometer, a calibrated
silicon solar cell, SolData 80SPC, with an accuracy of +/- 3% against a thermopile Kipp
& Zonen CM 21 pyranometer7.
Fig.4: Daily average horizontal and POA global solar irradiation per month for the year
2006/2007
Figure 4 shows the averaged daily global solar irradiation (Wh/m2 per day) received in
Tulin village over the period of a year, from December 2006 to November 2007.
The important features of the locally available solar resource identified from the data
analysis are as following:
1. The average solar irradiation on the 2-axis tracked surface over the year was
5.492kWh/m2 per day.
2. Annual solar irradiation received on the tracked surface was 28.5% more than on
the horizontal surface.
3. The maximum solar irradiation on the 2-axis tracked surface over the year was
6.412kWh/m2 per day, while the minimum was 4.194kWh/m
2 per day.
7 http://www.kippzonen.com/?product/1491/CMP+21.aspx

A. Malla, A. Zahnd et al.
Solar09, the 47th ANZSES Annual Conference
29 September-2 October 2009, Townsville, Queensland, Australia 5
Fig. 5: The yearly sun path diagram for Tulin village and its 360°
horizon, indicating all the mountain peaks (red line) surrounding the
village, thus limiting the interception of the daily solar radiation
according to the different seasons.
As shown in Fig. 5, Tulin receives fewer hours of sunlight due to the high surrounding
mountains. Sunlight is especially limited during the 4 winter months from November to
February. Due to the clustered arrangement of the houses and limited peak sun hours, a
2-axis central tracking PV system was chosen by RIDS-Nepal. Tracking from East-West
is achieved with a bi-directional 1.5VDC motor, powered by the relative voltage
difference between two 2.5WR solar modules positioned at 30° to each other. Back
tracking to East in the morning is done by a 2.5WR module positioned at the East side of
the PV array frame (see Fig. 6). The second axis, the North-South axis, is manually
adjusted from 5°-60°, depending on the seasonal variation of the sun path angle (see
Fig. 7). The increase in solar radiation in the POA shows the benefit of our locally
developed and manufactured 2-axis tracking system (as seen Fig. 1, 6, 7). During the
period under study, the monthly adjustment of the North-South tracker was not routinely
carried out by the locally trained users residing in the village. Data recorded over the
same time period with the same tracking system in our Simikot office, 6km aerial
distance south of Tulin, shows, that if the North-South adjustment is carried out
periodically, the system’s annual solar reception can increase by an additional 8%-12%.
This demonstrates the necessity for routine staff training as well as support to the end-
users in the villages.
In Fig. 6 the various components of the Tulin 300 WR 2-axis Solar PV Tracking System
are indicated. Also important to notice is that the central tracking system is installed
without any cement due to the prohibitive transport cost (12-fold price compared to the
purchase price) and thus the inability of the local people to maintain it if in the future
additional cement is needed. Instead the frame is developed in such a way that it can be
filled with stones, which are widely and easily available in the village. Further, the PV
system does not take any space away from the already utilised and limited roof tops.
Thus the tracker system integrates seamlessly with the daily tasks such as drying grass,
vegetables and fruits as well as the children’s games. This is part of the development of
contextualised technologies.

A. Malla, A. Zahnd et al.
Solar09, the 47th ANZSES Annual Conference
29 September-2 October 2009, Townsville, Queensland, Australia 6
Fig. 6: Tulin 300 WR central PV System. Two 2.5WR solar modules
positioned at 30° to each other power the 1.5 VDC motor which turns the
tracker daily from East – West according to the sun’s daily path.
Fig. 7: While the sun’s daily East-West path is automatically tracked, the
sun’s seasonal elevation is bi-weekly manually adjusted. This allows a much
simpler technology to be applied for the remote place, increasing the
sustainability while minimising the maintenance requirements.
Power Generation
Tulin’s solar PV village system has 4 x 75WR BP275F mono-crystalline solar PV
modules installed. The system’s voltage is 24VDC, with a peak power output of 300WR.

A. Malla, A. Zahnd et al.
Solar09, the 47th ANZSES Annual Conference
29 September-2 October 2009, Townsville, Queensland, Australia 7
Fig. 8: Daily average 300 WR Solar PV Array Energy Generation, Array and Reference
Yield for each month from December 2006 – November 2007
Figure 8 shows the daily average energy generation, Array8 and Reference Yield
9 over
the year.
The important features of the Solar PV array performance identified from the data
analysis are as following:
1. On an average 1.310kWh energy per day was generated over the course of a
year. During this period the PV system achieved an overall average efficiency10
of 9.47%.
2. From figure 8 it can be seen that a minimum of 0.894kWh energy per day was
generated during August which is the worst month due to the monsoon climate,
during which it can rain, for days at a time. The average minimum generation is
well over the maximum average load described in one of the following sections.
3. Figure 8 shows that a maximum of 1.871kWh energy per day was generated
during one of the clear, sunny days in November.
4. A clear seasonal energy generation pattern can be seen due to the pertaining
seasonal, climatic and meteorological pattern. This is particularly evident when
the lower energy generation is observed during the monsoon season and
snowfall, from end of May to September and December to January respectively.
Spring (mid-February to May) and early winter (October to November) seasons
8 It is defined as the ratio of the daily array energy generation to the peak installed capacity of the system
9 It is the number of peak sun hours (PSH, defined as number of hours per day with 1000 W/m
2 global
solar radiation received in a day) 10
Solar PV Array Efficiency = Power Generated by PV Array /( Solar Irradiation x Total Area of the
Array)

A. Malla, A. Zahnd et al.
Solar09, the 47th ANZSES Annual Conference
29 September-2 October 2009, Townsville, Queensland, Australia 8
are sunny with clear skies, consequently generating more energy per day.
Energy Storage
A well designed battery bank energy storage unit is essential in a RAPS (Remote Area
Power Supply) PV system which is not connected to the grid, as the power generation is
inherently intermittent. Tulin village has a battery bank with a capacity of 300Ah @ 24
VDC (six 12VDC, 100Ah deep cycle batteries). The battery bank is designed for 3 days
of autonomy, which means that the system can meet the average total village load
demand without sunshine for up to three consecutive days with a maximum Depth of
Discharge (DoD) of 30%.
The battery bank in Tulin remains on a constant high state of charge (SOC) each day, as
the average daily DoD measured is low, between 3.29%-8.85%. The charge controller
switches to trickle charge by open circuiting the PV array, as the battery bank reaches
above 90%-95%. This keeps the battery bank protected from being overcharged. Thus
the PV array power output is not fully utilised in relationship to what it could produce
under the prevailing meteorological conditions.
Over the year the array efficiency was recorded to be 9.47% with a maximum of 11.89%
in October. A lot of energy is being lost due to the high capacity status of the battery
bank. This is expected for the first few years of the Tulin PV system as the system was
designed for a 10 years maximum battery bank life expectancy and thus the system and
battery bank is designed to provide the full energy demand by the local community after
5-6 years of population growth and increase in energy requirement.
Fig. 9: Daily average battery bank voltage and depth of discharge per month for 2006/2007

A. Malla, A. Zahnd et al.
Solar09, the 47th ANZSES Annual Conference
29 September-2 October 2009, Townsville, Queensland, Australia 9
The above graph shows the average battery bank voltage and the battery bank’s average
daily depth of discharge (DoD) per month over the year.
The important features of the battery performance identified from the data analysis are
as following:
1. The battery bank’s voltage never dropped below 25.84 VDC, with a yearly
average of 26.27 VDC.
2. Over the course of the year on average 0.939kWh energy per day, generated by
the PV array is fed into the battery bank.
3. The maximum energy input into the battery bank recorded was 1.510kWh/day in
November, where as the minimum was 0.613kWh/day during the monsoon
month in August (see Figure 7).
4. The daily DoD on an average was 5.57% over the year. The maximum daily
DoD was 8.85% in September, whereas a minimum of 3.29% in August.
5. The DoD trend reflects the living pattern of the villagers. Beside the shorter
nights, during the summer months (June to August) some of the villagers move
to the higher altitude (3000-4500 m.a.s.l11
) meadows with their animals. This
reduces the village population and hence results in lower daily DoD during this
period. Once they returned with their livestock in early September, more people
were in the village, and the longer winter nights slowly set in. Both of these
factors increase the demand for the lights, resulting in higher daily DoD of the
battery bank.
The constant high battery bank voltage level indicates a good, high SOC of the battery
bank throughout the year. Thus, over the year all the load demands for the designed
indoor lighting could be provided without interruption. That means there was 0% loss of
load (LoL) due to insufficient power generation by the solar PV system or insufficient
energy storage capacity of the battery bank. The initially designed low DoD value has
certainly added to the overall system cost, but factors such as expected population
growth, days of autonomy period, potential of unauthorised connection of a high load
demand (or misuse of the PV system) and extended battery bank life expectancy were
accounted for in the design.
Load Demand
Each of the 28 houses is connected through armoured underground cabling to the
battery bank and has three WLED lamps, each consuming 1 watt (see Fig 12, 13). Thus
a total theoretical maximum load of ~ 100 W (28 households x 3 watt plus max. 20%
system losses) at any given time is expected.
11 Meters Above Sea Level
A. Malla, A. Zahnd et al.
Solar09, the 47th ANZSES Annual Conference
29 September-2 October 2009, Townsville, Queensland, Australia 10
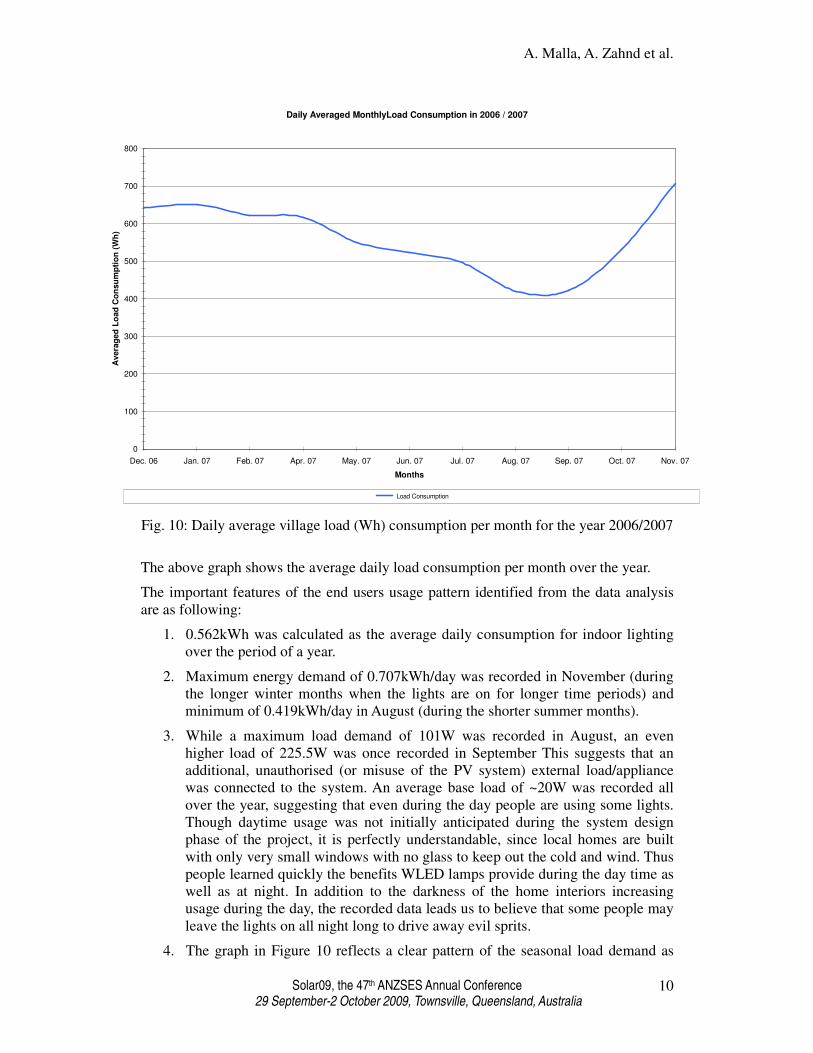
Daily Averaged MonthlyLoad Consumption in 2006 / 2007
0
100
200
300
400
500
600
700
800
Dec. 06 Jan. 07 Feb. 07 Apr. 07 May. 07 Jun. 07 Jul. 07 Aug. 07 Sep. 07 Oct. 07 Nov. 07
Months
Avera
ged
Lo
ad
Co
nsu
mp
tio
n (
Wh
)
Load Consumption
Fig. 10: Daily average village load (Wh) consumption per month for the year 2006/2007
The above graph shows the average daily load consumption per month over the year.
The important features of the end users usage pattern identified from the data analysis
are as following:
1. 0.562kWh was calculated as the average daily consumption for indoor lighting
over the period of a year.
2. Maximum energy demand of 0.707kWh/day was recorded in November (during
the longer winter months when the lights are on for longer time periods) and
minimum of 0.419kWh/day in August (during the shorter summer months).
3. While a maximum load demand of 101W was recorded in August, an even
higher load of 225.5W was once recorded in September This suggests that an
additional, unauthorised (or misuse of the PV system) external load/appliance
was connected to the system. An average base load of ~20W was recorded all
over the year, suggesting that even during the day people are using some lights.
Though daytime usage was not initially anticipated during the system design
phase of the project, it is perfectly understandable, since local homes are built
with only very small windows with no glass to keep out the cold and wind. Thus
people learned quickly the benefits WLED lamps provide during the day time as
well as at night. In addition to the darkness of the home interiors increasing
usage during the day, the recorded data leads us to believe that some people may
leave the lights on all night long to drive away evil sprits.
4. The graph in Figure 10 reflects a clear pattern of the seasonal load demand as

A. Malla, A. Zahnd et al.
Solar09, the 47th ANZSES Annual Conference
29 September-2 October 2009, Townsville, Queensland, Australia 11
previously discussed in point 5 under energy storage.
5. The data shows that the average daily load profile differs from what was
expected. Initially, the solar PV system’s load profile was defined to be ~8 hours
a day, with two peak energy demands, one in the morning hours and one in the
evening hours. However, our data suggest that for a few short time periods,
additional loads were connected to the system. This could have been for
charging additional external batteries for flashlights or for other equipment such
as radios. These additional, unauthorised loads can lead to faster discharging of
the battery bank and lower average battery bank voltage, and thus faster aging of
the battery bank. Also the PV system is exposed to a higher risk of short circuits
or the destruction of system parts. This information was shared with the
villagers, and they agreed to look out for any misuse and to put an end to such
activities. For future system designers this experience serves as an indication of
the necessity to include unforeseen loads in the system design and to include
necessary precautions to protect the system from unanticipated high loads. This
could be achieved by including electronic power limiting circuit breakers or
relevant low voltage recognition equipment which, once a set threshold is
reached, cut the village power supply.
System Performance Ratio
The Performance Ratio (PR) is used to indicate the overall effect of losses on the solar
PV array’s rated output under defined meteorological conditions due to the solar PV
modules’ temperature incurred losses, only partial utilisation of the available solar
irradiation (due to a full battery bank, inaccurate PV module angle or shading etc.), and
system component inefficiencies, cable losses or system equipment failures (IEA PVPS
Task 2, 2000).
The performance Ratio is the ratio of Final yield12
to the Reference yield i.e.
=
kWkWhPerDay
YieldeferenceR
kWkWhPerDay
YieldFinal
PRR
12
Final Yield is defined as the ratio of the daily load consumption to the peak installed capacity of the
system

A. Malla, A. Zahnd et al.
Solar09, the 47th ANZSES Annual Conference
29 September-2 October 2009, Townsville, Queensland, Australia 12
Daily Averaged Monthly System Performance Ratio in 2006 / 2007
0.350.34
0.40
0.33 0.32 0.33
0.36
0.330.32
0.29
0.38
0.34
0.00
0.05
0.10
0.15
0.20
0.25
0.30
0.35
0.40
0.45
0.50
Dec. 06 Jan. 07 Feb. 07 Apr. 07 May. 07 Jun. 07 Jul. 07 Aug. 07 Sep. 07 Oct. 07 Nov. 07 Average
Months
Pe
rfo
rma
nc
e R
ati
o (
Fin
al
Yie
ld / R
efe
ren
ce Y
ield
)
Performance Ratio (Yf/Yr)
Fig. 11: Daily average Performance Ratio per month for 2006/2007
The figure above shows the daily average system Performance Ratio PR per month from
December 2006 to November 2007.
Figure 11 demonstrates some key performance features of the system:
1. A maximum PR value of 0.40 was recorded for the month of February. This
value shows lower capture losses13
compared to other months, as the sun is not
yet as strong and the sun hours not as long as during the later spring months.
Further, the February winter month nights are still long, corresponding with
higher load consumption.
2. A minimum PR value of 0.29 was recorded on October. This is a result of higher
capture losses as higher PSH values are recorded in October per day, resulting in
surplus energy generation with the battery bank being often greater than 90%
full. The DoD graph in Figure 9 is not directly indicative of this finding, since
we suspect that in the month of September extra loads were plugged into the
system, discharging the battery bank more than otherwise would have been the
case. As the graph presents the monthly average values, the October monthly
average is not directly indicative of the lowest PR value over the year.
3. On a yearly average the PR is 0.34. From an analysis of 260 systems, the IEA-
PVPS Task 2 report mentions that the annual PR of stand-alone (no backup)
13
Array capture losses incur mainly when the battery bank is nearly full (90%-95% SOC) or full, as then
the charge controller open circuits the PV array power flow to the battery bank. Thus the available excess
power can not be utilized and thus is considered a loss. Other capture losses include PV module
temperature incurred losses, wind and shading losses.

A. Malla, A. Zahnd et al.
Solar09, the 47th ANZSES Annual Conference
29 September-2 October 2009, Townsville, Queensland, Australia 13
solar PV systems ranges from 0.1 to 0.6. The Tulin village solar PV system is a
prototype system and was designed for minimum LoL in order to have
continuous performance data and an uninterrupted practical experience for the
local users. Due to these demands set for the system at the design stage, we
expected a slightly decreased average PR value and an increased total system
cost.
The PR value is dependent on the load usage. An oversized RAPS Solar PV Systems as
in this case has higher system losses which results from a more frequent disconnection
of the PV array from the fully charged battery bank. Correspondingly, it is not entirely
correct to say that a system with a higher PR value indicates a more economical system.
The Tulin village solar PV system was intentionally oversized to allow higher reliability,
lower LoL, and a population and load demand growth over the course of its first 5-6
years of operation. Further, it is a first-time experience for this community to have basic
electric indoor lighting. With these parameters under consideration, it is expected that
the performance ratio of the Tulin solar PV system will improve over time.
System efficiency
As previously mentioned, the PR value in itself is not sufficient to give the overall
picture of the system’s operation. Hence additional parameters have to be monitored to
completely understand the system. One such additional parameter is the system
efficiency, which can be calculated by specifying the ratio of solar PV array power
generation and load consumption at standard test conditions (STC).
System Efficiency = Final Yield / Array Yield
Accordingly the average system efficiency of the Tulin solar PV system over the year
was 78.8%. On an analysis based on more than 30 stand-alone systems installed
worldwide, with peak power varying from 450Wp to 5000Wp, Mayer and Heidenreich
conclude that “good” systems are those with efficiencies ranging from 75%-95% and
with a PR greater than 0.3. A high efficiency value indicates few or no technical
problems in a system (Mayer and Heidenreich, 2003). Measuring the system efficiency
factor along with the PR value gives a clearer idea of the system’s operation.
CONCLUSION
Comprehensive monitoring is essential in order to know a system’s performance under
real field conditions. For instance the solar PV array under study in this project was
found to be operating at an overall efficiency (generated electrical power by the solar
PV array surface per m2 divided by the received global solar radiation per m
2) of 9.47%
over the year, though slightly higher future efficiency values are expected with the
increase of the village load demand compared to the current average load. The local
geographical and meteorological conditions justify the use of a solar PV array tracking
system with the POA results showing that 28.5% more energy is captured with the POA
than the horizontal array. Furthermore, the monitoring system provides a detailed
understanding of the varying village load patterns over the course of each day, month
and each season of the year. From these findings, important lessons can be learnt.
The monitoring system’s data also show that the village solar PV system may
occasionally have been misused, which otherwise would have not been possible to
know. One of the lessons learned is of the importance of incorporating a load
disconnection unit to protect the system from higher than designed currents being
drawn. Additionally, the data revealed the fact that alongside the energy storage system,

A. Malla, A. Zahnd et al.
Solar09, the 47th ANZSES Annual Conference
29 September-2 October 2009, Townsville, Queensland, Australia 14
the battery bank needs to be calculated and designed with appropriate energy storage
capacity, in order to provide the villagers with the energy they need during the predicted
number of days without sunshine.
Overall, the data collected by our monitoring system show that the Tulin solar PV
system is performing well in general, as designed and as expected. Crucial parameters
such as the locally available solar resource, the solar PV array’s power generation, the
battery bank’s daily voltage, SOC and energy storage levels, as well as the village load
consumption, were monitored and recorded. These data give an excellent overall
understanding of the system’s performance, providing a detailed record of each
individual parameter and the operation of the system overall. This would not be possible
without a data logging system, which is lacking in most solar PV systems installed in
similar contexts throughout the region. Monitoring of a solar PV system under various
meteorological conditions over the course of several years allows for the improvement
and optimisation of the solar PV system through adjustments made on the initial design
calculations. These adjustments then help to avoid unnecessary system failures, and
improve economic efficiency of new PV systems based on real field experience. Careful
monitoring and system adjustment in this fashion helps to improve the delivery of
quality energy service to the consumers by minimising any system downtime. Further,
the data and knowledge gained from these experiences, appropriately contextualised,
can provide the development community with important tools to improve the design of
solar PV systems for particular contexts. This is beneficial for end-users, for equipment
manufacturers, and for researchers interested in RAPS systems implemented through
solar PV technology.
A professional and contextualised solar PV system design for a defined local context
and application is essential for long-term reliability and sustainability. This information
can only be acquired through detailed and long-term data collection and analysis for
whole solar PV systems in the installed context. The data gained through monitoring can
improve the design of solar PV systems and their long-term sustainability. To date, the
long-term performance of the small scale solar PV systems installed elsewhere in Nepal
has been inconsistent. The approach described above offers a solution to this situation.
We suggest that eventually the painstakingly data-rich, carefully monitored and
optimised project approach described herein for Tulin may be able to transform the
performance and sustainability of other systems in regions throughout Nepal.
REFERENCES Alicia Ellul, Technical Analysis of the Performance of a Small-Scale, Centralised
Village Photovoltaic System in Tulin, Humla Nepal, A MSc (Master in Science)
Dissertation in Renewable Energy from Murdoch University in Perth Western
Australia, available at: http://www.rids-
nepal.org/index.php/Download_document/64_Techincal_Analysis_of_the_perform
ance_of_a_Small-Scale_Centralized_Village_Pv_System_in_Tulin.html
Didier Mayer and Michael Heidenrich, Performance Analysis of Stand alone PV
Systems from a Rational Use of Energy Point of View, in proceedings of the 3rd
world Conference on Photovoltaic Energy Conversion, Osaka, Japan, 2003
http://www.datataker.com/newsletters/sitemap_u1.html , PD189, PD190 News 2007 and
AN34 January 2005 News, Three research project reports published on their
NEWS web site about the application of datataker's DT80 and DT605 data
loggers in the RIDS-Nepal Humla and Kathmandu University based research

A. Malla, A. Zahnd et al.
Solar09, the 47th ANZSES Annual Conference
29 September-2 October 2009, Townsville, Queensland, Australia 15
projects. The papers are published at: May 2007 News
International energy Agency, Analysis of Photovoltaic System: Report IEA-PVPS T2-
01:2000
Zahnd A. (2004), Case Study of a Solar Photovoltaic Elementary Lightning System for a
Poor and Remote Mountain Village in Nepal, MSc in Renewable Energy
Dissertation, available at: http://www.rids-
nepal.org/index.php/Dissertations/View_category.html
Zahnd A. and McKay, K. (2005A), Renewable Energy Resources for Improved,
Sustainable Livelihood A Case Study of a Holistic Community Development
Project with a Remote and Poor Mountain Village in the Nepal Himalayas,
conference proceedings for the 6APRSCP Melbourne, AUS, 10th
– 12th
October
2005, available at: http://www.rids-
nepal.org/index.php/Download_document/62_Renewable_Energy_Resources_6A
PRSCP_Melbourne_2005_Paper.html
APPENDICES
Fig. 12: 1 watt WLED (White Light
Emitting Diode) lamp, manufacturing in
Nepal with original Nichia NSPW 510BS
diodes from Japan.
Fig. 13: WLED Lights have replaced
“Jarro” (resin soaked wood burned for
lighting), providing a cleaner and
brighter indoor environment.
BRIEF BIOGRAPHY OF PRESENETERS
MALLA, Avishek is a mechanical engineer and is currently working on his Masters in
Renewable Energy at Murdoch University, Australia. He was awarded the gold medal
from former King Gyanendra Bir Bikram Shah Dev for graduating with the highest
grade in 2005. From 2005-2007 he was involved in academic teaching and research in
renewable energy focusing on solar photovoltaic and solar water heater technologies at
Kathmandu University. From 2007 -2008, he worked with the non-profit NGO RIDS-
Nepal on long term holistic community development projects implemented in Humla,
one of the poorest and remotest regions of Nepal.
ZAHND, Alex has a mechanical engineering degree from Switzerland, and a Masters in
Renewable Energy from Murdoch Australia. He has been in Nepal since 1983 and
works in holistic community development projects since 1996 in the remotest and
poorest mountain communities in the Himalayas. Since 2001 he has also been a member

A. Malla, A. Zahnd et al.
Solar09, the 47th ANZSES Annual Conference
29 September-2 October 2009, Townsville, Queensland, Australia 16
of expatriate staff of Kathmandu University, involved in teaching Renewable Energy
courses as well as in applied research of renewable energy technologies. Since 2002 he
combined his extensive field experience and applied academic research projects by
developing and leading a long-term HCD project and a High Altitude Research Station,
in the very remote and impoverished north western district of Humla, through the
established non-profit NGO RIDS-Nepal (www.rids-nepal.org). He is also working on
his PhD on the role of renewable energy technology in holistic community
development, with practical applications in Himalayan villages in Nepal.
HADDIX MCKAY, Kimber is a cultural anthropologist who specializes in demography,
health and human behavioral ecology. Dr. McKay has worked both full time and as a
consulting anthropologist designing studies of health and treatment of illness in remote
areas of Nepal and Uganda. She has lived and worked in Nepal frequently from 1994 to
the present, and assisted in the design of locally appropriate development schemes
aimed at improving health conditions, particularly in the use of sustainable energy
technologies and in public health-related interventions such as latrine design,
improved/smokeless cook stoves, lighting schemes, community based health training,
and drama programs with specific health-related messages. She works with The ISIS
Foundation as Manager, Humla and Research, and is an associate professor of
Anthropology at the University of Montana, Missoula, MT, USA.
ELLUL, Alicia has a degree in Science from the University of Sydney, with a
mathematic major and a Masters in Renewable Energy from Murdoch University. Alicia
is currently a sustainability consultant for Planet Contracting Services, an electrical and
renewable energy company working in the Sydney region. This company aims to reach
developing countries and help achieve PV systems to small villages such as Tulin, in
Humla Nepal, in the future.