The importance of Measurement Systems Analysis
24
Presented by Lisa Goch DFSS Project Lead Diebold, Incorporated April 2014 The importance of Measurement Systems Analysis
description
Presented by Lisa Goch DFSS Project Lead Diebold, Incorporated April 2014. The importance of Measurement Systems Analysis. When can tight specifications NOT lead to a quality product?. 1. 3. 2. Measurement Systems aren’t Calibrated. Specs aren’t set based on Functionality Requirements. - PowerPoint PPT Presentation
Transcript of The importance of Measurement Systems Analysis

Presented by Lisa GochDFSS Project Lead
Diebold, IncorporatedApril 2014
The importance of
Measurement Systems Analysis
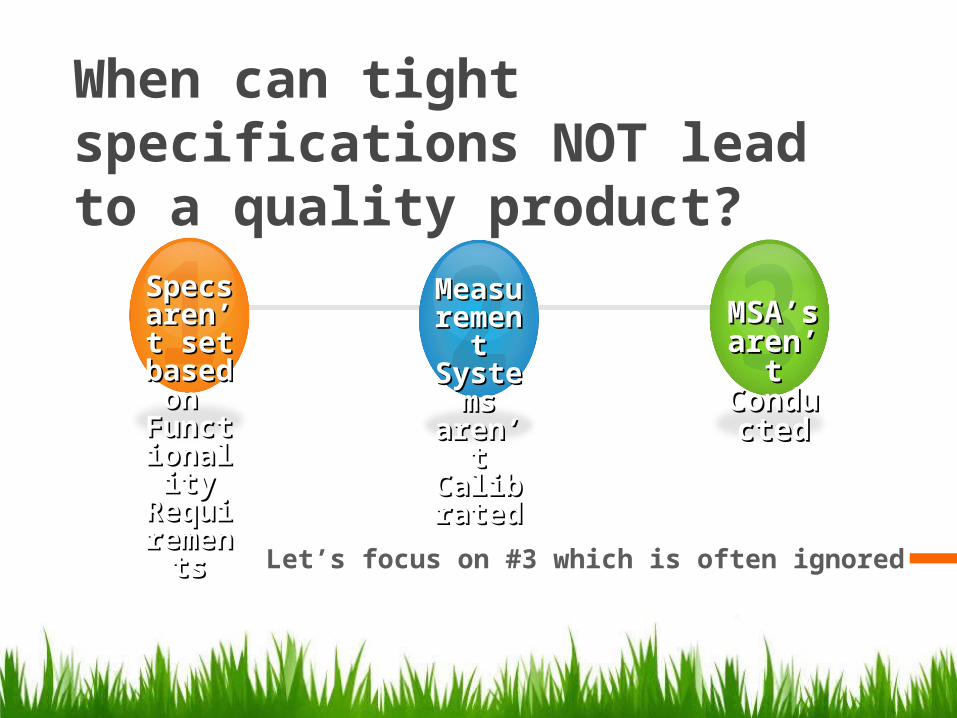
When can tight specifications NOT lead to a quality product?
Let’s focus on #3 which is often ignored
Specs Specs aren’t aren’t set set based based on on
FunctioFunctionality nality RequirRequirementsements
MeasurMeasurement ement SystemSystems aren’t s aren’t CalibraCalibratedted
MSA’s MSA’s aren’t aren’t ConduConductedcted

Part Number
Measured HighIn the MiddleMeasured Low
MSA RESULTS on Three CALIBRATED TESTERS:

What is an MSA?
Measurement Systems Analysis
MSA’s MSA’s aren’t aren’t ConduConductedcted

Measurement Components:
CALIBRATEDYesNo

Main MSA Com
ponents
Where does Variation Come From?Divide and conquer Variation by organizing your Search into the different components.
Determining the reproducibility factors takes the most time & effort.
Overall Variation
Part-to-Part Variation
Measurement System Variation
Reproducibility-Operator-Day-Tester-Procedure-Etc…
Repeatability- Gage Error

Excel & Minitab are the 2 most popular for MSA Analysis.
Whatever program is used, a good MSA analysis is about using both Graphs & Summary Metrics to draw conclusions.
MSA Software:
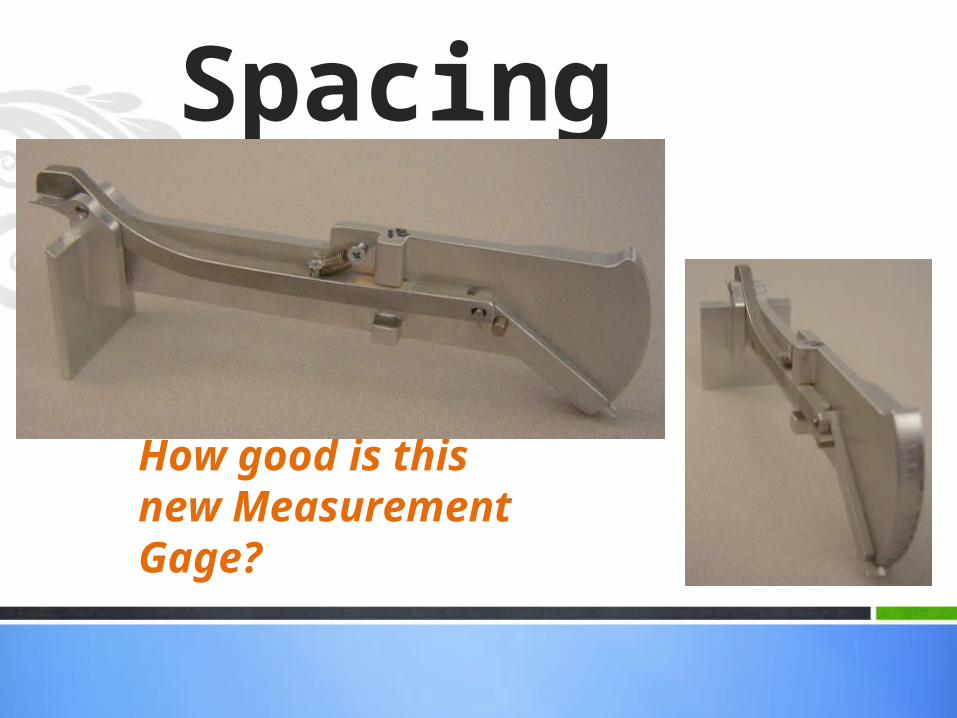
How good is this new Measurement Gage?
Spacing Gage

10 Parts – Select Parts from the top, middle & bottom end of the specification
3 Operators – Select different skill levels of operators if possible
3 Repeats – less than 3 may cause problems with mathematical accuracy
Step 1) All Parts are Measured once by all Operators.Parts are measured in Random Order
Step 2) Repeat step 1) two more times.
Standard MSA Procedure

Minitab MSA Analysis: By Operator
% P/T Needs to be <30%
Meas Error: +/- 0.125

Minitab MSA Analysis: By Operator
Want >80%
Provides Clues for
Improvement

Minitab MSA Analysis: By Operator

• % Contribution% Contribution Repeat + Reprod = Gage R&R Gage R&R + Part-to-Part = 100% Highest % should be Part-to-Part
• % Tolerance = % P/T% Tolerance = % P/T %P/T Goal is < 30% % P/T is not additive
Variance Components Analysis CHART:

• Is there at least 5 different values on the R Chart?• All values should be within the control limits.• Does one Operator have higher values than the others
(i.e. more measurement error)?
Range Control Chart:

• Most values should be outside control limits. Points outside says that the gage can discriminate be/t different parts.
• Does one Operator have higher values than the others (i.e. on average are the Operators measuring the same)?
Xbar Control Chart:

• Each part was measured 9 times in the same place.Each part was measured 9 times in the same place. Do some parts have a wider spread (more meas error)? Does the parts with the largest average have the largest
spread? Or vise versa Are there any patterns?
Box Plot by Part:

• Each Operator took 72 measurements (9 Readings * 12 Parts)Each Operator took 72 measurements (9 Readings * 12 Parts) Is any Operator measuring consistently higher or lower
than other Operators? Does any Operator have a wider spread on their Box &
Whisker Plot?
Box Plot by Operator:
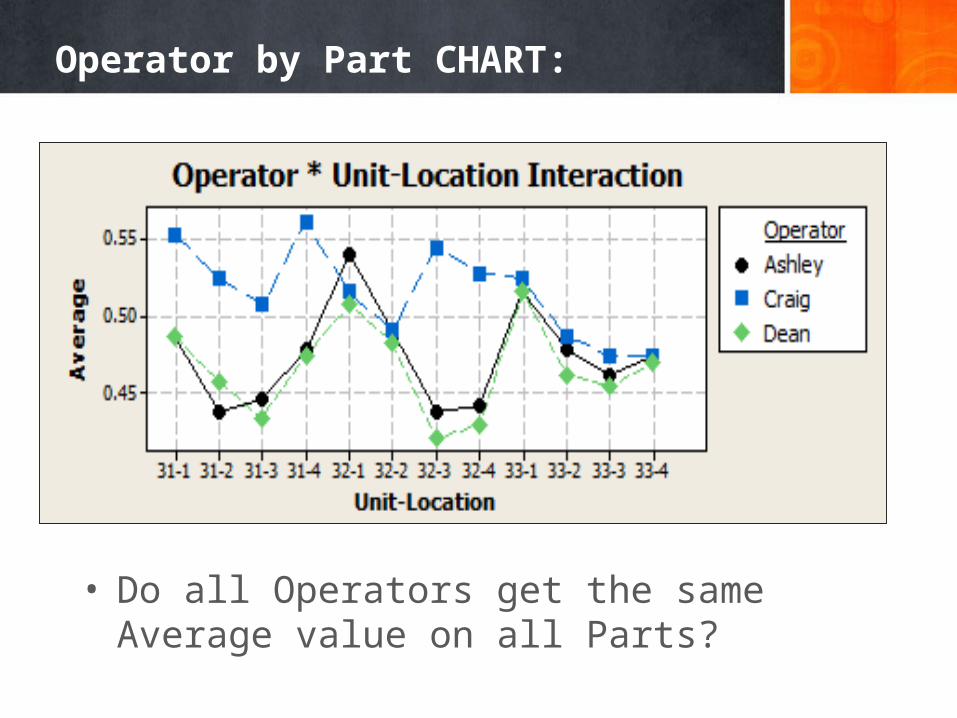
• Do all Operators get the same Average value on all Parts?
Operator by Part CHART:

My Favorite Charts
Why does Ashley have more Measurement Error?
Why is she less consistent when measuring the parts?
Why is Craig getting higher Measurements on 6 of the 12 parts?
Is there something different about the parts that he is sensitive too?

When a NIST or other Calibration Standard isn’t available
A place for “Golden” Parts.

»“Golden” Parts are often used when a traceable Calibration standard is unavailable.
A custom Part made precisely to nominal values
Part(s) specifically selected for their measurement values
Golden Part Selection

Golden Part Characterization
How “Golden” is your Part?
Does the part measure the same day after day?
Will the part be able to detect drifting or shifts in your measurement system?

To achieve Reliable & Repeatable Part Measurements
Focus must be on all 3 steps!!!
Set Set Specs Specs based based on on
FunctioFunctionality nality RequirRequirementsements
CalibraCalibrate te
MeasurMeasurement ement SystemSystem
ConConduct duct MSA MSA AnalAnalysisysis