B2B and Facebook + The Importance of Location Pages by Shelly Kramer

THE IMPORTANCE OF CORPORATION TAX POLICY IN THE LOCATION CHOICES OF MULTINATIONAL FIRMS Part of the Economic Impact Assessment of Ireland’s Corporation Tax Policy
OCTOBER 2014

2
The Importance of Corporation Tax Policy in the
Location Choices of Multinational Firms
Martina Lawless, Daire McCoy, Edgar Morgenroth and Conor O’Toole

3
Executive Summary This paper examines the effects of corporate tax on the location decisions of foreign direct investment.
We use data on newly established multinational subsidiaries across 26 European countries from 2005
to 2012 in order to examine the effects of country characteristics, including a range of different
estimates of statutory and effective average tax rates, on location decision. Our main findings can be
summarised as follows:
We find a consistent negative effect of the corporate tax rate on the probability of a country
being chosen as a location by multinationals.
We find a highly significant, albeit modest sized, effect of allowing for non-linearity in the
effect of the tax structure. In other words, a change in the tax rate will have a larger effect if
the starting point is a low rate of tax compared to if the same size change is applied to a higher
tax rate.
A summary of the marginal effects for our main estimates is presented overleaf. These
combine the direct and non-linear elements of the estimated effects.
o Focusing on our benchmark extended model, a one percent increase in the policy rate
would lead to a reduction in the likelihood of choosing a destination of 0.68 percent.
o A one percent increase in the effective average tax rate (EATR) would lead to a
reduction in the likelihood of choosing a destination of 1.15 percent. The use of the
EATR picks up variation across countries in taxes due to differences in allowances and
exemptions along with the direct effect of the headline tax rate.
We find large variations in the sensitivity to tax rates across sectors. For manufacturing firms,
the effect is similar to the baseline but for service firms the effect is noticeably smaller.
Services firms may be more likely to make location decisions based on the need to be close to
their identified customer base and this reduces their sensitivity to tax rates.
When comparing the effect of taxation to other important factors, we find that taxation is the
largest single determinant of the location decision.
Financial sector firms are most sensitive to changes in corporation tax rates, with an estimated
marginal effect more than double those of the other sectors. This is likely to be a reflection
of the more footloose nature of these firms, and has important implications for the potential
effect of a tax change in Ireland, given the weight of the financial sector in foreign investment
in this country. Firms with higher assets sizes appear more responsive to corporation taxation
in their location decision.
Combining all effects of tax and country characteristics, Ireland had a 3.1% probability of being
chosen as a location for the newly established subsidiaries over the period investigated. For
context, Irish GDP is 1.4% of the EU-26 total, so this demonstrates the attractiveness of the
country as a destination for foreign investment well in excess of its size.
As a policy experiment, we simulate the possible effect of a number of changes in Irish
corporate tax rate on the entry of new multinational subsidiaries. The results can be
summarised as follows:
o If the Irish tax rate had been 15% over the period in our sample, the number of new
foreign affiliates entering the country would have been 22 % lower.
o If the tax rate had been 22.5% (the sample average), the number of new foreign
affiliates would have been 50 % lower.

4
Countries with strong market potential, in terms of size and proximity to other large markets,
are more likely to be chosen for new subsidiaries. This suggests that more peripheral
economies may be at a relative disadvantage in attracting foreign direct investment, unless
they are able to compete on other grounds.
Summary of Marginal Effects
Marginal Effects – Summary Table
Policy Rate Mean EATR Total Tax Rate
Main Model -0.68 -1.15 -0.56
Sector Type Manufacturing -0.63 -0.94 -0.48
Services -0.31 -0.75 -0.45 Financial sector -1.36 -2.58 -0.67 Other (Utilities and construction) -0.73
Sector Skill High-tech non-financial -0.47 -0.50 Low-tech non-financial -0.45 -0.91 -0.46
Sector Type and Skill High-tech Manufacturing -0.41 Low-tech Manufacturing -0.93 -1.19 -0.54 High-tech Services -0.50 -0.55 Low-tech Services -0.37 -0.93 -0.41 Notes: Missing cell indicates the effect is insignificant.
Findings of Policy Experiment
Effect of Changes in Irish Statutory Tax Rate on Location Probability
Remain at 12.5%
Change to 15%
Change to 17.5%
Change to 20%
Change to 22.5%
Probability of locating in Ireland 3.12% 2.44% 1.98% 1.65% 1.43%
Change in percent of new affiliates opened in Ireland 0% -22% -37% -47% -54%

5
The Authors
Edgar Morgenroth is an Associate Research Professor, Martina Lawless is a Senior Research Officer,
Conor M. O’Toole is a Research Fellow and Daire McCoy is a Research Assistant at the Economic and
Social Research Institute.
The views and findings are those of the authors and not of the Economic and Social Research Institute.
Emails: [email protected], [email protected], [email protected],
Acknowledgements
This research was carried out for the Department of Finance following a competitive tender process.
We would like to thank Professor Ronald Davies of University College Dublin for his helpful comments
on this report. We would also like to thank Gary Tobin, Brendan O’Connor, Kate Levey, Terence Hynes
and David Hegarty at the Department of Finance for supporting the research and for their valuable
input.

6
Introduction Firms that operate in a global marketplace are faced with a variety of decisions on how to manage
their international activities. One of the first of these is whether to continue to use a domestic base
and export their product or service to the foreign markets where it is demanded. At a certain scale,
however, it may be more efficient to set up a new affiliate abroad either to improve market access or
to reduce the costs of production and avoid the costs associated with exporting. Once a firm has
decided to set up a base abroad, it then is faced with the decision of where to locate. A wide range of
factors are likely to impact on this decision by the firm. As many of these factors are beyond the
control of policy-makers, particular attention has been paid to the role of corporate tax rates as a
potential way to increase the attractiveness of a country to business seeking a location for a new
investment.
This paper examines the effects of corporate tax on the location decisions of foreign direct investment
in Europe, while also accounting for other location choice variables. We use data on newly established
multinational subsidiaries across 26 European countries over the period from 2005 to 2012 in order
to examine the determinants of country characteristics, including a range of different estimates of
statutory and effective average tax rates, on location decisions. The focus here is on the initial decision
to establish a new facility in the destination country, and we do not examine the subsequent decision
paths that the firm is faced with in terms of the volume of investments or allocation of investments
across multiple affiliates.
We extend the existing literature on the effect of corporate taxation on location choices of
multinationals both by using a data set that covers a wide range of information on both the source
and potential host countries and also by examining the effects of a non-linear response of firm location
decisions to changes in the tax rate. We find that accounting for this non-linearity improves the
performance of the model for all of the alternative measures of the tax rate. All specifications show
a significantly negative effect of taxation on the probability of location choice but a positive squared
term shows that the strength of this negative effect moderates as the tax rate increases. In other
words, although overall tax has the expected negative effect on location probability, the marginal
effect of an increase is lower at higher rates of tax (and conversely a change in the tax rate will have a
larger effect on the location probability if the rate is already low).
Our baseline result is a finding that a one percent increase in the policy rate of corporation tax would
lead to a reduction in the conditional location probability of 0.68 percent. Using the effective average
tax rate (EATR), the marginal effect implies a reduction in the probability of 1.15 percent following a
1 percent increase in the tax rate. These combine the direct and non-linear elements of the estimated
effects. The use of the average effective tax rate picks up variation across countries in taxes due to
differences in allowances and exemptions along with the direct effect of the headline tax rate.
In terms of other country factors, we find that higher levels of GDP and GDP growth increase the
probability of a country being chosen as a location by a multinational, picking up the attractiveness of
access to larger and higher-income markets. Market potential, capturing the ease of access to other
nearby markets, is also positively linked with location attractiveness but is not always statistically
significant. This suggests that more peripheral economies may be at a relative disadvantage in
attracting foreign direct investment, unless they are able to compete on other grounds. Infrastructure

7
(as proxied by motorway network coverage) has a positive and significant effect on the probability of
location choice.
Looking more deeply into how the tax system affects different types of firm, we find large variations
in the sensitivity to tax rates across sectors. For manufacturing firms, we find a significant negative
coefficient combined with a smaller positive squared term, with the sizes of the effects being fairly
close to those observed in the overall results. For services firms the size of the effect is noticeably
smaller than that for manufacturing, suggesting that services firms are more likely to be driven in their
location decisions by the need to be close to their identified customer base and this reduces their
sensitivity to tax rates.
Financial sector firms appear to be the most sensitive to changes in corporation tax rates with an
estimated marginal effect more than double those of the other sectors. This is likely to be a reflection
of the more footloose nature of these firms. The sectoral composition of a country’s foreign
investment therefore has significant implications for the potential effect of a tax change. We estimate
that when the share of affiliates for each sector in Ireland is controlled for the effects of a tax change
are -1.8 for the EATR and -0.9 for the policy rate coefficient, approximately one-third larger than the
average effects across all countries. This is due to the larger weight of the financial sector in foreign
investment in this country.
Combining all effects of tax and country characteristics, Ireland had a 3.1% probability of being chosen
as a location for the newly established subsidiaries over the period investigated. To place this
probability in context, we note that Irish GDP is 1.4% of the EU-26 total, so we are finding that the
attractiveness of the country as a destination for foreign investment is well in excess of what in would
expect to get if all of the destination decisions were allocated relative to country size.
The marginal effects reported from the conditional logit estimation used in this report are changes in
the probability of a firm choosing a particular location at different points in the distribution of country
characteristics. It can be difficult to interpret how this translates to the overall number of new
affiliates that would be established or not in the event of a change in the corporate tax rate. In order
to better interpret the results therefore, we perform a policy experiment where we simulate the
possible effect of a number of changes in Irish corporate tax rate on the entry of new multinational
subsidiaries. Over the period 2004-2012, we estimate that there would have been a reduction of 22%
in the probability of Ireland being chosen as a location had the tax rate been 15% and a halving of the
probability if the rate had been 22.5%.
The paper is structured as follows: Section 2 reviews the literature on FDI location and, in particular,
the link with corporate tax rates. Section 3 describes the data used, including a discussion of the
alternative measures available for corporate tax rates. It also describes the methodology used.
Section 4 presents the empirical results.

8
Background and literature There is a large literature which explores the determinants of the location decisions of multinational
firms and more specifically focuses on the role of corporate tax in influencing such decisions. In
modelling the effect of corporation tax on investment location decisions of multinationals, our work
is most relevant to the latter literature but draws heavily on the former in terms of methodology,
approach and context.
There is a large literature which tests the effect of corporate taxation on the location of investment
capital, an early review of which is provided in Devereux and Griffith (2002; 2003). While this literature
is extensive, and many early studies focus on modelling the flows of foreign capital (Devereux and
Freeman, 1995; Billington, 1999; Young, 1999), our work focuses on the binary decision of where to
invest. Focusing on this subfield in the literature, there are a number of papers of particular relevance
to our research. These studies differ across a number of dimensions, most notably on methodology,
the measures of taxation, and country coverage.
Using data on large corporates from the US, Kemsley (1998) jointly models the decision to locate a
foreign plant abroad or to export. Measuring taxation using the foreign average tax rate, US statutory
rate, as well as foreign tax credits, he finds that firms are more likely to use exports to serve high-tax
foreign markets and are also more likely to use exports when foreign tax credits are binding.
Devereux and Griffith (1998) test the effect of taxation on the location of production for a sample of
US firms moving into Europe over the period 1980 to 1994. Focusing on both marginal and average
effective tax rates, they find a negative and significant effect of taxation on the choice between
locations within Europe but not between Europe and non-EU destinations. Their results imply a one
percent increase in the rate of the effective average tax rate in the UK reduces the conditional
probability of locating by 1.29 percentage points. The equivalent value for France is 0.5 percentage
points and 0.97 percentage points for Germany.
A close paper to ours in terms of data and methodology is Barrios et al. (2012) who consider the effect
of host and parent country taxation on the location decisions of European firms. Using data from
Bureau Van Dijk Amadeus (Amadeus) across 33 European economies over the period 1999-2003, they
separately model the effect of host economy corporate income tax, host economy dividend
withholding taxes and home economy corporate income taxes on the probability of choosing a specific
country. A novelty of their research is to separate out the three aforementioned taxation channels as
the majority of studies to date have solely focused on host economy corporate income taxes. The
methodology uses a conditional logit model controlling for taxation factors, labour costs, common
borders, market size and economic freedom. They find a significant and negative effect of the effective
rate as well as the host country corporation taxation on the probability of choosing a location.
Additionally, they find an independent and strongly negative effect of parent country taxation on
foreign subsidiary location decisions, suggesting both host and home country taxation are important
determinants of firm operational choices on affiliate locations.
A second strand of research that is relevant to our work is the literature that models the location
decisions of FDI firms more generally. Basile et al. (2009) use data on 5509 foreign subsidiaries across
50 European regions in 8 European countries over the period 1991-1999 to test the determinants of
multinational location choice. Their main research hypothesis is to test the effect of EU structural

9
funds on FDI location decisions. Using a mixed logit approach model, they find that agglomeration
economies play a key role in determining location choices but the effects differ by whether the FDI
originates within the European Union. They also identify a role for EU structural funds in determining
location decisions.
A number of studies have focused on the outward flows of FDI from one country. Chen and Moore
(2010) test the effect of firm heterogeneity on the selection of FDI investment locations on a sample
of French multinational corporations. They find that the investment of French multinationals into host
economies is a function of the investing firm’s productivity: the share of higher productivity MNCs in
total FDI is greater in economies with a smaller market potential, higher fixed costs of investment or
lower import tariffs. Their findings are robust to country and firm specific heterogeneity and
endogeneity in the productivity-FDI relationship. Davies et al. (2009) focus on the role played by tax
treaties in determining both the propensity to invest and the level of investment across locations for
a sample of Swedish multinationals over the period 1965-1998. They find that tax treaties affect the
probability of investment in a location but not the volume of investment by FDI firms. They argue that
their findings suggest the impact of tax treaties work through a reduction in investor uncertainty
rather than a reduction in effective tax rates. Head and Mayer (2005) consider the issue of market
potential using a theoretical model of location choice. Their predictions are tested empirically using
data on Japanese multinationals. Their results show that market potential matters for location choice
but their analysis notes unexplained variation in choices. While not a direct focus in their work, they
include corporate income tax as a determinant of the location decision. Using a conditional logit
model, they estimate that a one percent rise in corporation taxation leads to a near 5 percent
reduction in the probability that a specific region is chosen.
Additional relevant research undertaken by Siedschlag et al. (2013a) modelled 446 location decisions
of R&D firms across EU regions over the period 1999-2006. Using Amadeus data, they link location
choice to a range of region-specific and country-specific covariates. They find that the probability of
location choice of a foreign R&D affiliate is positively affected by increased FDI presence, human
capital levels and research capacity and quality. The effects of research are stronger for affiliates of
non-European origin. While it is not the focus of their research, they include corporation tax rates as
a control. Measuring taxation using the statutory policy rates, they find no significant effects in a
majority of specifications. Siedschlag et al. (2013b) also model the location decisions of EU firms on a
cross-regional basis. They focus on firms in the ICT sector over the period 1998-2008 and find that
location probability increases with market size, market potential and the presence of other foreign-
owned firms. Their research also identifies a role for human capital, income tax, and the size of the
services sector. They do not find any effect of corporation taxes with the exception of affiliates of US
origin.

10
Data and methodological approach
Data
The data used in our analysis comes from the Bureau Van Dijk Amadeus database, supplemented with
FAME data for Ireland and the United Kingdom. Our sample includes information on 3238 new foreign
affiliates across 26 countries for the period 2005-2012. We restrict our sample to firms we can identify
as foreign owned, in which the owner has an ownership percentage of 50% or more.
We first describe the various tax measures used, then we describe in detail the sample of firms used
in the analysis.
Tax variables
We use a number of alternate tax variables; the Policy Rate, the Mean Effective Average Tax Rate
(Mean EATR) and the Total Tax Rate. The sources for each of these variables are presented in Annex
1. We also use the EATR Crossborder as a robustness check.
1. Policy Rate
The statutory rate charged by the host country government on corporate profits
earned by the subsidiary.
2. Mean EATR
This is calculated by comparing the cash-flows from a hypothetical, forward-looking
investment project in the presence and absence of taxation. It is a weighted average
of the effective marginal tax rate and the policy rate, converging towards the policy
rate for a highly profitable investment. We use the mean EATR as this also accounts
for the implications of using different financing sources to fund the investment
project, applying a weighting of 0.55 on projects financed by retained earnings, 0.1 on
equity and 0.35 on debt. In order to accurately calculate the NPV of the investment,
this measure also explicitly considers each country’s real interest rate, inflation rate,
true economic depreciation rate, and the NPV of capital allowances on different asset
types; industrial buildings, intangibles, machinery, financial, inventory1.
3. Total Tax Rate
This includes all taxes and mandatory contributions payable by businesses after
accounting for allowable deductions and exemptions.
4. EATR Crossborder
This is calculated in a similar manner to the mean EATR except in an international
setting. The approach considers a parent firm located and owned by shareholders in
a home country which undertakes an investment in a host country through a wholly-
owned subsidiary. It considers taxes levied by the host country government on income
earned by the subsidiary and corporate taxes levied by the home country government
1 For a detailed example of these calculations for both measures of EATR please see “Section B – Worked Examples” of
Spengel et al (2012) report for the EU Commission.

11
on the same income and personal taxes levied by the home country government on
the shareholders.
Table and Table below display descriptive statistics and the correlation matrix for each tax variable
used. As can be seen the Policy Rate and Mean EATR are highly correlated. The EATR Crossborder has
a wider range as this measure takes home country taxation into account. The main difference between
the EATR Crossborder and the first two measures is the presence of some outliers in the distribution,
e.g. the EATR Crossborder for an investment from France into Bulgaria was 52.9% in 2005.
Table : Summary Statistics of Tax Variables
Variable Source N Mean Std. Dev. Min Max
Policy Rate KPMG 82224 0.237 0.067 0.100 0.384
Mean EATR EU Commission 82224 0.218 0.064 0.088 0.365
EATR Crossborder EU Commission 80430 0.247 0.068 0.075 0.532
Total Tax Rate WDI 82224 0.457 0.116 0.214 0.768
Table : Correlation Matrix for Tax Variables
Policy rate Mean EATR EATR crossborder Total tax rate
Policy Rate 1.00
Mean EATR 0.94 1.00
EATR Crossborder 0.71 0.77 1.00
Total Tax Rate 0.56 0.53 0.41 1.00
The Total Tax Rate is correlated with the other tax variables but has a much higher mean and wider
distribution due to the inclusion of other taxes levied. The box plot in Figure graphically illustrates
these distributions. The centre line is the median of the distribution and the upper and lower ends of
each box represent the 75th and 25th percentiles respectively. Outliers are denoted by dots to the
extreme end of the distribution.
The scatter plots in Figure graphically show the relationships between each pair of tax rates.
Interestingly the plot between the Mean EATR and the EATR Crossborder illustrates that the tax
payable is at least the Mean EATR of the host country, but may be significantly higher, depending on
the home country taxation rates.

12
Figure Box Plot of Tax Variables
Source: ESRI analysis of tax data
Figure Scatter Plot of Tax Variables
Source: ESRI analysis of tax data

13
Number of firms by location of new foreign affiliate
In the following series of tables we describe host and home country coverage, sectoral and firm-level
splits that are employed in the analysis and other country-level variables we control for. A full list of
variables and their sources is included in Annex 1.
A wide range of European countries is included in our analysis as can be seen from Table 3. This
includes 130 foreign affiliates opened in Ireland.
Table : Number of Firms by Host Country
Country No of Firms
Austria 101
Belgium 27
Bulgaria 121
Czech Republic 214
Germany 316
Denmark 30
Estonia 66
Spain 320
Finland 40
France 213
Greece 6
Croatia 90
Hungary 14
Ireland 130
Italy 421
Lithuania 36
Latvia 42
Netherlands 249
Norway 104
Poland 142
Portugal 109
Sweden 34
Slovenia 23
Slovakia 48
United Kingdom 342
Total 3238
Number of firms by sector
We aggregate up NACE 2 digit sectors into the following broad categories: manufacturing, services,
financial, and other (construction and utilities) as well as high-tech and low-tech2. The following table
2 The initial sector aggregation in table 4 is a Eurostat aggregation based on NACE Rev 1.1 codes. For further details see
http://epp.eurostat.ec.europa.eu/cache/ITY SDDS/Annexes/htec esms an2.pdf

14
illustrates how our sample is split across these sectors. The sector aggregations are presented in Table
4 below.
Table : Sector Aggregation for Regressions
Sector Sector Type Sector Skill
High tech manufacturing Manufacturing Hi-tech
Medium tech manufacturing Manufacturing Hi-tech
Medium-low tech manufacturing Manufacturing Low-tech
Low tech manufacturing Manufacturing Low-tech
Knowledge-intensive market services Services Hi-tech
High-tech knowledge-intensive services Services Hi-tech
Other knowledge-intensive services Services Hi-tech
Less knowledge-intensive market services Services Low-tech
Construction Other Low-tech
Financial Services and Insurance Financial Financial
Utilities Other Low-tech
The number of firms in each of these sectors is broken down in Tables 5 and 6.
Table : Number of Firms by Sector Type
Sector Type Number Percentage
Manufacturing 400 12%
Services 2,020 62%
Financial 639 20%
Other 179 6%
Table : Number of Firms by Sector Skill
Sector Skill Number Percentage
Hi-tech 896 28%
Low-tech 1,703 53%
Financial 639 20%

15
We further disaggregate manufacturing and services into high and low tech in Table 7.
Table : Number of Firms by Sector Type & Skill
Sector Skill Number Percentage
High tech manufacturing 176 5%
Low tech manufacturing 224 7%
High tech Services 720 22%
Low tech Services 1,300 40%
Financial 639 20%
Other 179 6%
A large proportion of the Irish firms in our sample are in the Financial Services and Insurance industry.
This reflects the growing importance of this sector to the Irish economy
The number of Irish firms in each of these sectors is broken down in Table 8.
Table : Number of Irish Firms by Sector Type & Skill
Sector Skill Number Percentage
High tech manufacturing 3 2%
Low tech manufacturing 4 3%
High tech Services 20 15%
Low tech Services 25 19%
Financial 75 58%
Other 3 2%
Number of firms by asset size
Amadeus contains Profit and Loss and Balance Sheet information on each firm in the database.
However, this is not always very well reported and due to patchy coverage of other variables we can
only include data on each firm’s total assets. For a set of regressions we group firms by size: Small,
Medium and Large. This split is outlined in Table 9 below.
Table : Number of Firms by Asset Size
Size Definition Number Percentage
Small Total Assets less than €250k 950 29%
Medium Total Assets greater than €250k and less than €3m 804 25%
Large Total Assets greater than €3m 853 26%
Unknown No Asset data 631 19%
16
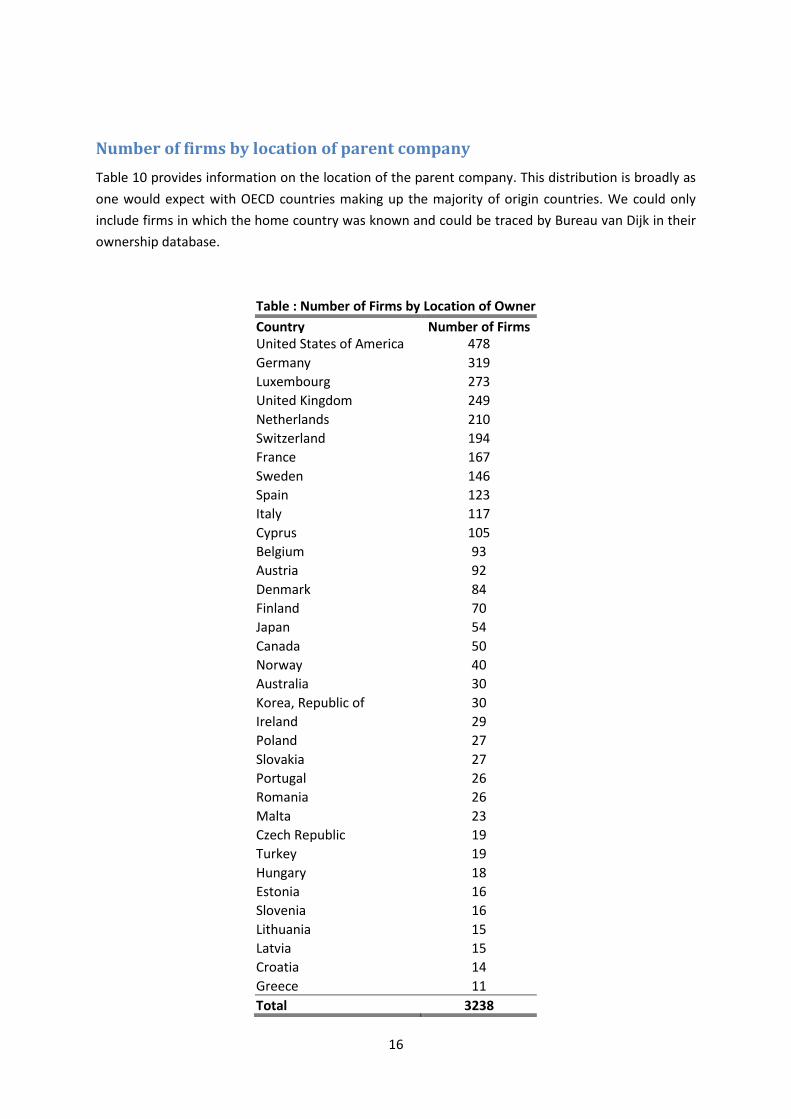
Number of firms by location of parent company
Table 10 provides information on the location of the parent company. This distribution is broadly as
one would expect with OECD countries making up the majority of origin countries. We could only
include firms in which the home country was known and could be traced by Bureau van Dijk in their
ownership database.
Table : Number of Firms by Location of Owner
Country Number of Firms United States of America 478
Germany 319
Luxembourg 273
United Kingdom 249
Netherlands 210
Switzerland 194
France 167
Sweden 146
Spain 123
Italy 117
Cyprus 105
Belgium 93
Austria 92
Denmark 84
Finland 70
Japan 54
Canada 50
Norway 40
Australia 30
Korea, Republic of 30
Ireland 29
Poland 27
Slovakia 27
Portugal 26
Romania 26
Malta 23
Czech Republic 19
Turkey 19
Hungary 18
Estonia 16
Slovenia 16
Lithuania 15
Latvia 15
Croatia 14
Greece 11
Total 3238

17
If we look at Irish owned firms, we find that they are mainly owned by companies based in the US
and UK as can be seen from in Table 11.
Table : Number of Irish Firms by Location of Owner
Country Total Sample
United Kingdom 50
United States of America 43
Netherlands 7
Luxembourg 6
France 5
Canada 3
Australia 2
Switzerland 2
Cyprus 2
Spain 2
Norway 2
Belgium 1
Germany 1
Denmark 1
Italy 1
Korea, Republic of 1
Portugal 1
Total 130
Number of firms by year of entry
Our year coverage is from 2005-2012 as presented in Table 12. One might have expected a significant
drop in the number of new affiliates being opened as a result of the financial crisis and subsequent
recession in Europe in 2008. We can see this in the 2009 data, however this trend does not continue
as we have a higher number of new affiliates opened in 2010 than any other year.
Table : Number of Firms by Year of Entry
Year of Entry No of Firms
2005 389
2006 444
2007 423
2008 439
2009 217
2010 634
2011 486
2012 206
Total 3,238

18
Other variables used in regressions
We use a wide range of country controls in our regressions. Our choice is informed by the literature
on firm location decision.
To capture information on host country market potential and growth we use inverse distance-
weighted GDP and GDP growth respectively.
The cost and quality of the labour force is commonly found to be a significant determinant of location
choice. We include information on both relative labour cost and the share of the host country labour
force with third level education.
Other relative measures included are distance in km between home and host country capital cities,
relative GDP per capita and relative population. In our baseline we include only the log of GDP to
capture country size. However, in our main extended model, we replace this with the log of relative
GDP between the home and host economies. We also conduct a robustness check to control for a
non-linear impact of country size by including a squared term with lnGDP.
The lag of FDI stock as a proportion of GDP within each potential host country is used to capture
agglomeration as well as potential crowding out by existing FDI firms. As this measure is broad it may
also capture potential displacement effects of similar firms. By including the proportion of motorways
as a percentage of total land area we have a broad proxy for the level of infrastructure in the host
country.
A range of other potential explanatory variables we include are dummy variables to indicate whether
the host and home country share a common language, if they shared a colonial relationship at some
stage in the past and if they share a border.
We also include a dummy for EU15 membership. Detailed information on variable definitions and
source data is contained in Annex 1.
Table 13 contains summary statistics and table 14 the correlation matrix for all variables used in our
analysis.

19
Table : Summary Statistics
Variable Source N Mean Std. Dev. Min Max
Location AMADEUS 82224 0.039 0.194 0 1
Market potential* WDI, CEPII 82224 23.058 0.895 20.402 24.133
GDP growth WDI 82224 0.022 0.039 -0.180 0.122
Labour education WDI 82224 0.266 0.075 0.115 0.415
Relative Labour cost* AMECO 82224 -0.401 2.470 -6.995 3.421
Agglomeration WDI 82224 0.513 0.331 0.098 2.044
Distance* CEPII 82224 7.396 0.943 4.088 9.802
Infrastructure 82224 0.016 0.016 0 0.064
Common language CEPII 82224 0.068 0.252 0 1
Share border CEPII 82224 0.096 0.295 0 1
Former colony CEPII 82224 0.044 0.205 0 1
Natural resources WDI 82224 0.016 0.032 0 0.219
EU 15 membership - 82224 0.530 0.499 0 1
Relative Population* WDI 82224 0.691 2.246 -5.627 5.464
Relative GDP PC* WDI 82224 0.579 0.863 -3.134 3.076
* Variable in natural logarithm

20
Table : Correlation Matrix for Variables Included in Regressions
Market potential
GDP growth
Labour education
Relative Labour cost Agglomeration Distance Infrastructure
Common language
Share border
Former colony
Natural resources
EU 15 membership
Relative Population
Relative GDP PC
Market potential 1.00
GDP growth 0.03 1.00
Labour education -0.04 -0.15 1.00
Relative Labour cost 0.73 0.12 -0.18 1.00
Agglomeration -0.01 0.01 0.39 -0.06 1.00
Distance -0.80 -0.02 -0.02 -0.59 -0.10 1.00
Infrastructure -0.04 -0.19 0.10 -0.14 0.35 -0.14 1.00
Common language 0.02 -0.04 0.14 -0.05 0.20 -0.20 0.19 1.00
Share border 0.14 -0.02 0.02 0.09 0.05 -0.44 0.19 0.48 1.00
Former colony -0.14 -0.02 0.10 -0.16 -0.01 -0.03 0.02 0.26 0.16 1.00
Natural resources 0.01 0.00 0.23 -0.05 -0.09 0.00 -0.24 -0.10 -0.05 -0.04 1.00
EU 15 membership -0.04 -0.26 0.29 -0.22 0.06 -0.02 0.48 0.24 0.16 0.09 -0.28 1.00
Relative Population -0.47 0.01 0.12 -0.49 0.13 0.38 -0.12 -0.12 -0.11 -0.03 0.11 -0.22 1.00
Relative GDP PC 0.10 0.18 -0.34 0.27 -0.04 0.07 -0.32 -0.11 -0.13 -0.04 -0.19 -0.62 0.01 1.00

21
Methodological approach
To explore the relationship between the location choice of multinationals and corporate tax rates, we
draw on the existing literature and use a conditional logit model as in McFadden (1974). This model
has been applied empirically in the recent literature both on the wider determinants of location
choices of multinationals (Head and Mayer, 2004; Siedschlag et al., 2013a,b) and more specifically on
research focusing on the effect of corporation tax on MNE location decisions (Devereux and Griffith,
1998; Barrios et al., 2012). While alternative approaches such as the nested logit model and Poisson
models can be used, the conditional logit is the most widely applied in the extant literature.
Schmidheiny et al (2011) and Guimaraes et al. (2003; 2004) provide a useful discussion on the relative
merits of each when modelling the firm location decision problem.
To model the locational choice facing the enterprise, the firm’s problem can be outlined as follows.
The profits earned from locating in a particular country, Πic, are:
Πic, = 𝑿𝒊𝒄𝜷 + 𝜀𝑖𝑐
Where X is a vector of location specific control variables. The firm therefore faces a choice across
destinations which yield different potential returns. It must therefore choose the location, c, across J
alternatives which satisfies the condition:
Πic > Πij ∀ j = 1, … J 𝑤𝑖𝑡ℎ 𝑗 ≠ 𝑐
That is Πic yields the highest profit across all groups. The firm therefore makes the following
decision, :
𝑌 = {1 𝑖𝑓 Πic > Πij ∀ ≠ 𝑐
0 𝑜𝑡ℎ𝑒𝑟𝑤𝑖𝑠𝑒}
In this case Y, the dependent variable, is an indicator of the location choice of Multinational Enterprise
(MNE) i, over a set of all possible locations J. It is a function of the location specific characteristics 𝑿𝒊𝒄.
Assuming that the error term 𝜀𝑖𝑐 is modelled as a type 1 extreme value distribution, IID across all firms
and countries, the probability of choosing country c can be expressed as follows:
𝑃(𝑌 = 𝑐|1, … , 𝐽, 𝑿𝒊𝒄) = 𝑒𝑿𝒊𝒄𝜷
∑ 𝑒𝑿𝒊𝒋𝜷𝐽𝑗=1
The coefficient vector 𝜷 can be estimated using maximum likelihood methods. An important
consideration is the selection of control variables in 𝑿. Following the existing literature, we include
the following controls in our baseline model: market potential (distance weighted GDP), ln GDP to
capture market size, GDP growth, host economy labour cost, the share of the population with tertiary
education (% of labour force) to capture labour quality, the existing stock of FDI (to capture
agglomeration and network effects), the density of motorways to capture the quality of infrastructure
and the distance between host and home country capital cities.
An extended, more global model includes controls for countries that share a common language, a
common border or shared a past colonial link. A dummy for EU-15 is also included while a control for

22
the share of natural resources is also included. We also include relative GDP, population and labour
costs. Standard errors are robust to heteroskedasticity and clustered at the firm level.
When applying non-linear discrete choice models such as the conditional logit, a number of issues
arise in calculating the magnitude of effects from the coefficients. Firstly, while the sign on the
coefficient is always interpretable as the direction of the effect, the magnitude is not so easily
interpreted as the model is non-linear and the effect is dependent on the functional form.
Secondly, developing a single magnitude from a coefficient is non-trivial as there are a number of
available methodologies including estimated marginal effects and probability elasticities. Greene
(2012) notes that the selection between marginal effects and elasticities is mainly a matter of choice,
as the sign and significance does not change between the effects. In essence both apply a different
positive scaling to the estimated coefficient so no changes occur in relation to the sign of the effect.
Thirdly, there is no consensus in the literature as to which effect is the “industry standard” with some
papers reporting marginal effects (Devereux and Griffith, 1998; Barrios et al., 2012) and others
reporting probability elasticities (Head and Mayer, 2004). Given our paper is closer to Devereux and
Griffith (1998), we report estimated marginal effects. These are calculated as follows:
𝜕𝑃(𝑦 = 𝑐)
𝜕𝑋= 𝑃𝑐(1 − 𝑃𝑐)𝛽𝑋
Where 𝑃𝑐3 simplifies to 1/J when evaluated at the means of all covariates. In our case, J = 26
representing the number of countries in our choice set. The marginal effects can be interpreted as an
increase in variable X by 1 percent changes the conditional probability of locating in particular country
by the estimated value (in percent). In section 4, we provide both the coefficients and tables of
estimated marginal effects for our tax rates of interest.
In estimating the marginal effects for corporate taxation, consideration must be given to the fact that
the variable enters the estimation equation in a non-linear fashion. To estimate an overall marginal
effect for corporation taxation, which includes both linear and non-linear terms, we follow Davies et
al. (2001) and apply the following calculation:
𝜕𝑃(𝑦 = 𝑐)
𝜕𝑋= 𝑃𝑐(1 − 𝑃𝑐)(𝛽𝑇1 + 2𝛽𝑇2 �̂�)
Where 𝛽𝑇1 is the estimated coefficient on the linear term, 𝛽𝑇2 is the estimated coefficient on the non-
linear term and �̂� is the mean tax rate from the sample data.
Empirical results Our first results look at the effects on multinational location decisions for the entire sample of firms,
focusing on the effects of various estimates of the corporate tax rate faced by the firm in each
potential country. We then look deeper into the sensitivity of firms in different broad sectors to the
location characteristics and to different elements of the tax structure.
3 Where Pc = P(y=c) probability the location is chosen amongst the alternatives.

23
Baseline results
We begin with the baseline results presented in Column 1 of Table 15, where we include the statutory
policy rate as our measure of corporate tax. Looking at the other country characteristics first, we find
the expected positive effect of GDP on the probability of locating in a particular country, picking up
the attractiveness of access to larger and higher-income markets. In the initial specification, we also
find a positive and significant effect of market potential. This is in line with expectations and captures
the attractiveness of larger, closer proximity markets. GDP growth is also insignificant in this initial
specification but, as we shall see in the next table, this is not the case when we take into account the
non-linearity of the effect of the tax rate. We find the expected negative and significant effect of
labour cost on the location decision: in our sample, firms are attracted towards lower labour cost
destinations. We find some evidence that labour quality is positively associated with location choice
but the effect is weak.
Table : Estimates of Conditional Logit Model for Multinational Location Choice – Baseline – Linear Tax Rates
(1) (2) (3)
b/se b/se b/se Market Potential 3.114*** 3.221*** 3.170***
(0.334) (0.337) (0.330)
Ln GDP 0.684*** 0.614*** 0.634***
(0.030) (0.030) (0.026)
GDP Growth -0.628 -0.268 -0.365
(0.886) (0.890) (0.890)
Ln Labour Cost -0.271*** -0.364*** -0.341***
(0.049) (0.049) (0.044)
Labour Quality 0.510 0.664* 0.720*
(0.416) (0.403) (0.434)
FDI Stock (% of GDP) t-1 -0.895*** -0.855*** -0.876***
(0.080) (0.078) (0.084)
Motorway Density 4.743*** 3.277** 3.533**
(1.455) (1.504) (1.513)
Ln Distance -1.283*** -1.289*** -1.285***
(0.042) (0.041) (0.041)
Policy rate -2.092***
(0.603)
Mean EATR 0.840
(0.701)
Total Tax Rate 0.008
(0.188)
N 82224 82224 82224
Pseudo R2 0.121 0.120 0.120
Standard errors in parentheses
*** p<0.01, ** p<0.05, * p<0.1

24
Given that labour cost and GDP per capita are quite strongly correlated, this implies a trade-off facing
the firm between access to high-income customers and high wage workers. We do not include GDP
per capita in the specification due to this extremely high correlation (𝜌 = 0.96).
We include the lag of the stock of FDI in the economy to capture both agglomeration as well as
potential crowding out by existing FDI firms. The literature on agglomeration effects has found
evidence that there are benefits to firms to locating in the same regions as other similar firms in order
to take advantage of potential spillovers and other externalities such as supplier and labour pools.
Although much of this research relates to regional or city level clusters and our data is at a more
aggregated level, we do not find such an effect. This may perhaps indicate that there is also a
competitive effect that offsets the agglomeration benefits, or, perhaps equally likely, that
agglomeration externalities are better measured using firm counts at a regional level which we do not
have access to. Lagged motorway density is included as a proxy to indicate infrastructure and public
investment and has a positive and significant effect on the probability of location choice.
The first tax measure we include in this baseline specification is the country’s headline policy rate for
corporate profits. We find a significant and negative effect of this rate on the probability of choosing
a location. The other columns in Table examine how this result is affected by using different measures
of the tax rate. Column 2 uses the effective average tax rate (EATR). The other country characteristics
have the same pattern as before, apart from labour quality which becomes statistically significant.
The EATR is insignificant., In contrast to the policy rate but in line with the EATR results, the total tax
rate is not found to be statistically significant.
The first results presented in Table 15 showed a negative relationship between the probability of
location choice and corporate tax rates for only one specification. Our next set of results show that
this was almost certainly due to not taking account of non-linearity in the reaction of firms to the tax
rate. Table 16 uses the same set of country characteristics as the baseline regressions and the same
set of three alternative measures of the corporate tax rate. However, in this set of specifications, we
include a squared term for each of the tax rates.

25
Table : Estimates of Conditional Logit Model for Multinational Location Choice – Baseline – Linear Tax Rates
(1) (2) (3)
b/se b/se b/se
Ln GDP 0.704*** 0.732*** 0.643***
(0.029) (0.033) (0.025) Market Potential 3.932*** 4.674*** 3.489***
(0.364) (0.390) (0.331)
GDP Growth 0.986 1.478 3.246***
(0.890) (0.916) (1.005)
Ln Labour Cost -0.182*** -0.038 -0.533***
(0.047) (0.053) (0.051)
Labour Quality 0.598 -0.428 2.763***
(0.414) (0.411) (0.502)
FDI Stock (% of GDP) t-1 -1.154*** -1.032*** -1.082***
(0.083) (0.081) (0.085)
Ln Distance -1.369*** -1.414*** -1.350***
(0.043) (0.044) (0.042)
Motorway Density 6.623*** 5.887*** 7.891***
(1.508) (1.526) (1.553)
Policy rate -21.917***
(2.241)
Policy rate 2 0.382***
(0.041)
Mean EATR -34.530***
(2.879)
Mean EATR 2 0.665***
(0.052)
Total Tax Rate -14.519***
(0.942)
Total Tax Rate 2 0.148***
(0.010)
N 82,224 82,224 82,224
Pseudo R2 0.125 0.129 0.132
Standard errors in parentheses
*** p<0.01, ** p<0.05, * p<0.1
Taking into account this non-linearity in the effect of the tax rate on firm location decisions improves
the performance of the model for all of the alternative measures of the tax rate. All three columns
show a significantly negative effect of taxation on the probability of location choice. However, the
strength of this negative effect moderates as the tax rate increases, as shown by the positive squared
term in all of the specifications. In other words, although overall tax has the expected negative effect
on location probability, the marginal effect of an increase is lower at higher rates of tax.

26
Table 17 examines the robustness of these results by expanding the set of country characteristics
relative to the base specification. The additional variables are all expected to increase the
attractiveness of a particular location, either by capturing characteristics of the country itself that
would make doing business there easier (such as sharing a common border or the availability of
natural resources) or by proxying for the closeness of the relationship between countries (such as
historical colonial links or common language). We also include the relative population size between
home and host economies to capture country size differentials.
Table : Estimates of Conditional Logit Model for Multinational Location Choice – Baseline - Quadratic Tax Rates – Extended Model
(1) (2) (3) Ln GDP -0.494*** 0.080 0.136 (0.154) (0.164) (0.160) Market Potential 3.401*** 3.928*** 2.707*** (0.389) (0.410) (0.366) GDP Growth 3.556*** 3.525*** 5.184*** (0.934) (0.962) (1.048) Ln Labour Cost 0.413*** 0.036 -0.597*** (0.140) (0.153) (0.145) Labour Quality -0.769* -1.517*** 1.823*** (0.436) (0.433) (0.509) FDI Stock (% of GDP) t-1 -1.004*** -0.936*** -1.008*** (0.089) (0.085) (0.088) Ln Distance -1.094*** -1.137*** -1.024*** (0.053) (0.053) (0.050) Motorway Density 8.342*** 7.779*** 10.006*** (1.666) (1.655) (1.675) Common Language 0.348*** 0.412*** 0.319*** (0.068) (0.070) (0.070) Contiguity (Common Border) 0.410*** 0.348*** 0.563*** (0.067) (0.067) (0.064) Colonial relationship 0.326*** 0.355*** 0.305*** (0.064) (0.064) (0.065) Natural resource dependence 10.075*** 8.974*** 8.665*** (1.144) (1.098) (1.167) Relative Population -1.156*** -0.544*** -0.383** (0.167) (0.177) (0.171) EU 15 0.966*** 0.844*** 0.873*** (0.121) (0.118) (0.127) Policy rate -18.766*** (2.333) Policy rate2 0.299*** (0.043) Mean EATR -31.427*** (2.741) Mean EATR2 0.605*** (0.051) Total Tax Rate -15.222*** (0.965) Total Tax Rate2 0.154*** (0.010) N 82,224 82,224 82,224 Pseudo R2 0.138 0.141 0.146
Standard errors in parentheses *** p<0.01, ** p<0.05, * p<0.1

27
The effects of the extended specifications are consistent regardless of the measure of the tax rate
used. Sharing a common official language, common border or historical colonial links all pick up the
extent of linkages between the FDI source and potential host countries and have significantly positive
effects on the probability of being chosen as the preferred location by the multinational. The extent
of natural resource availability is also a feature positively associated with multinational entry. Relative
population carries a statistically significant and negative sign.
Despite increasing the set of possible explanatory variables, we continue to find a significant negative
effect of each of the tax rates on the location probability, with a small offsetting positive coefficient
on the squared tax rate indicating a lessening of the effect at higher rates. Finally, we add a number
of additional relative measures to this extended model which capture the differences between the
home and host economies. This includes relative labour cost and relative GDP. Combined with relative
distance and relative population, these factors should capture the differential effect between home
and host economies that bear influence on the corporate location strategy.
Including these additional controls, our main findings hold in all cases with a negative and significant
effect of the main tax effect and a positive and significant effect of the squared term. We use this
model as our baseline going forward when estimating differences across groups of firms, sectors and
presenting the marginal effects.

28
Table : Estimates of Conditional Logit Model for Multinational Location Choice – Quadratic Tax Rates – Extended Main Model
(1) (2) (3) Market Potential 3.401*** 3.928*** 2.707*** (0.389) (0.410) (0.366) GDP Growth 3.556*** 3.525*** 5.184*** (0.934) (0.962) (1.048) Labour Quality -0.769* -1.517*** 1.823*** (0.436) (0.433) (0.509) Relative Labour Cost -0.413*** -0.036 0.597*** (0.140) (0.153) (0.145) FDI Stock (% of GDP) t-1 -1.004*** -0.936*** -1.008*** (0.089) (0.085) (0.088) Distance -1.094*** -1.137*** -1.024*** (0.053) (0.053) (0.050) Motorway Density 8.342*** 7.779*** 10.006*** (1.666) (1.655) (1.675) Common Language 0.348*** 0.412*** 0.319*** (0.068) (0.070) (0.070) Continguity (Common Border) 0.410*** 0.348*** 0.563*** (0.067) (0.067) (0.064) Colonial Relationship 0.326*** 0.355*** 0.305*** (0.064) (0.064) (0.065) Natural Resource Dependence 10.075*** 8.974*** 8.665*** (1.144) (1.098) (1.167) EU 15 0.966*** 0.844*** 0.873*** (0.121) (0.118) (0.127) Relative Population -0.662*** -0.624*** -0.519*** (0.035) (0.039) (0.032) Relative GDP 0.494*** -0.080 -0.136 (0.154) (0.164) (0.160) Policy rate -18.766*** (2.333) Policy rate2 0.299*** (0.043) Mean EATR -31.427*** (2.741) Mean EATR2 0.605*** (0.051) Total Tax Rate -15.222*** (0.965) Total Tax Rate2 0.154*** (0.010)
N 82,224 82,224 82,224 Pseudo R2 0.138 0.141 0.146
Standard errors in parentheses *** p<0.01, ** p<0.05, * p<0.1
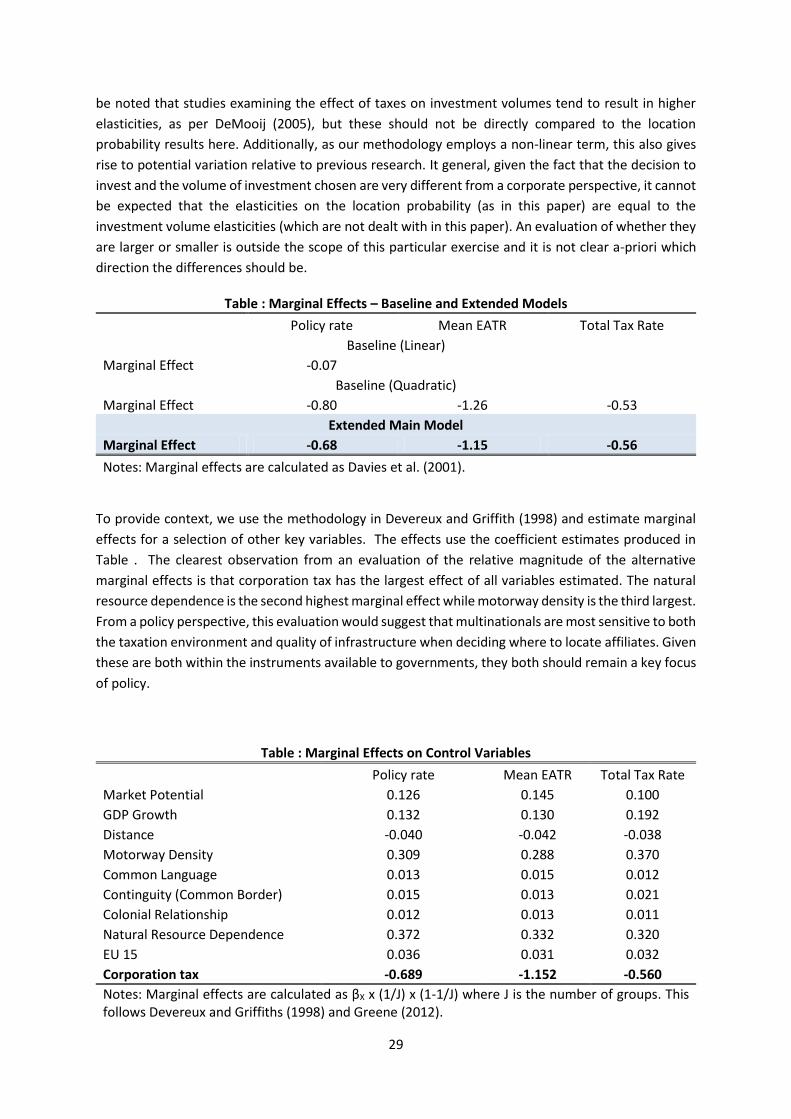
Interpretation of the coefficients of a conditional logit model can be somewhat difficult so Table
makes an adjustment following Davies et al. (2001) to convert the coefficients on the tax variables
into marginal effects. Comparing these results to others in the literature such as Devereux and Griffith
(1998) our baseline elasticity of 1.15 on the EATR is in line with their finding of 1.26. However, it should
29
be noted that studies examining the effect of taxes on investment volumes tend to result in higher
elasticities, as per DeMooij (2005), but these should not be directly compared to the location
probability results here. Additionally, as our methodology employs a non-linear term, this also gives
rise to potential variation relative to previous research. It general, given the fact that the decision to
invest and the volume of investment chosen are very different from a corporate perspective, it cannot
be expected that the elasticities on the location probability (as in this paper) are equal to the
investment volume elasticities (which are not dealt with in this paper). An evaluation of whether they
are larger or smaller is outside the scope of this particular exercise and it is not clear a-priori which
direction the differences should be.
Table : Marginal Effects – Baseline and Extended Models
Policy rate Mean EATR Total Tax Rate
Baseline (Linear)
Marginal Effect -0.07
Baseline (Quadratic)
Marginal Effect -0.80 -1.26 -0.53
Extended Main Model
Marginal Effect -0.68 -1.15 -0.56
Notes: Marginal effects are calculated as Davies et al. (2001).
To provide context, we use the methodology in Devereux and Griffith (1998) and estimate marginal
effects for a selection of other key variables. The effects use the coefficient estimates produced in
Table . The clearest observation from an evaluation of the relative magnitude of the alternative
marginal effects is that corporation tax has the largest effect of all variables estimated. The natural
resource dependence is the second highest marginal effect while motorway density is the third largest.
From a policy perspective, this evaluation would suggest that multinationals are most sensitive to both
the taxation environment and quality of infrastructure when deciding where to locate affiliates. Given
these are both within the instruments available to governments, they both should remain a key focus
of policy.
Table : Marginal Effects on Control Variables
Policy rate Mean EATR Total Tax Rate
Market Potential 0.126 0.145 0.100
GDP Growth 0.132 0.130 0.192
Distance -0.040 -0.042 -0.038
Motorway Density 0.309 0.288 0.370
Common Language 0.013 0.015 0.012
Continguity (Common Border) 0.015 0.013 0.021
Colonial Relationship 0.012 0.013 0.011
Natural Resource Dependence 0.372 0.332 0.320
EU 15 0.036 0.031 0.032
Corporation tax -0.689 -1.152 -0.560
Notes: Marginal effects are calculated as βX x (1/J) x (1-1/J) where J is the number of groups. This follows Devereux and Griffiths (1998) and Greene (2012).
30
Sectoral and skill variation in tax response
The results discussed so far have pooled all firms in the sample. However, firms in different sectors
may have different reaction functions to differences across many country level characteristics,
including those relating to taxation. The results are presented in Table . We divide firms into four
subgroups – manufacturing, services, financial firms and other sectors (primarily utilities and
construction) – in order to examine if there are any differences in their sensitivity to the tax measures
estimated above. We also separately look at the effects of a high and low technology split in the non-
financial sectors as well as at low-tech and high-tech manufacturing and services separately.
The results are quite striking, with large variation in the size of the coefficients across the broad
sectors. For manufacturing firms, we find a pattern very similar to that of the total sample, with each
of the tax measures having a significant negative coefficient combined with a smaller positive squared
term.
The estimated coefficients for services firms have the expected negative sign and are statistically
significant but the size of the effect is smaller than that for manufacturing. We interpret this as
suggesting that services firms are more likely to be driven in their location decisions by the need to be
close to their identified customer base and this reduces their sensitivity to tax rates. A similar
explanation would also apply to the generally insignificant response to tax rates for the group of other
sectors as utilities and construction would be particularly market access driven and immobile.
In contrast to other services firms, financial firms have a much greater sensitivity to taxation. This is
likely to be a reflection of the more footloose nature of these firms, given limited fixed assets relative
to other sectors and less of a requirement to locate close to their market (particularly for more “back-
office” type operations). This could allow these firms greater freedom to choose lower tax locations
than is the case for manufacturing and other services firms.
As well as splitting the sample by strict economy sector, we use EC definitions for high-tech and low-
tech industries and recalculate the effects for these groupings (excluding the financial sector). We also
split the skill categories by manufacturing and services to explore whether there is further
heterogeneity beneath the broad aggregation.
Interesting we find that low-skill firms are more sensitive to tax rates and this result holds for firms in
both the manufacturing and services sectors. It is unclear a-priori whether to expect low-tech or high-
tech firms to be more or less sensitive to corporation tax. In line with our findings, high-tech firms may
be more inclined to prioritise labour quality or the R&D environment with low-tech firms taking “off-
the-shelf” capital structures to the lowest cost (in terms of operating costs and tax considerations)
destination. However, it is not necessarily the case that this logic applies across both services and
manufacturing firms.

31
Table : Coefficients –Extended Model – By Sector
Policy rate Mean EATR Total Tax Rate Obs Manufacturing
Coeff Tax -17.123*** -25.630*** -13.061*** 10,123 Coeff Tax Rate ^ 2 0.356*** 0.526*** 0.140***
Services Coeff Tax -8.489*** -20.527*** -12.346*** 51,235 Coeff Tax Rate ^ 2 0.211*** 0.510*** 0.130***
Financial sector Coeff Tax -36.832*** -70.170*** -18.188*** 16,339 Coeff Tax Rate ^ 2 0.327** 1.086*** 0.176***
Other (Utilities and construction) Coeff Tax -13.177 -18.240 -19.896*** 4,527 Coeff Tax Rate ^ 2 0.276 0.352 0.226***
High-tech non-financial Coeff Tax -4.562 -12.740** -13.647*** 22,791 Coeff Tax Rate ^ 2 0.078 0.275*** 0.136***
Low-tech non-financial Coeff Tax -12.361*** -24.990*** -12.377*** 43,094 Coeff Tax Rate ^ 2 0.316*** 0.614*** 0.137***
High-tech Manufacturing Coeff Tax -5.377 -17.878 -11.016*** 4,468 Coeff Tax Rate ^ 2 0.127 0.381* 0.112***
Low-tech Manufacturing Coeff Tax -25.511*** -32.439*** -14.649*** 5,655 Coeff Tax Rate ^ 2 0.528*** 0.665*** 0.164***
High-tech Services Coeff Tax -5.6 -13.637** -15.052*** 18,323 Coeff Tax Rate ^ 2 0.079 0.276** 0.149***
Low-tech Services Coeff Tax -10.204*** -25.572*** -11.141*** 32,912 Coeff Tax Rate ^ 2 0.289*** 0.663*** 0.123***
*** p<0.01, ** p<0.05, * p<0.1
The estimated marginal effects by sector are presented in Table below.
Table : Marginal Effects - Main Model – By Sector
Policy rate Mean EATR Total Tax Rate
Split by Sector Type
Manufacturing -0.63 -0.94 -0.48
Services -0.31 -0.75 -0.45
Financial sector -1.36 -2.58 -0.67
Other (Utilities and construction) -0.73
Split by Sector Skill
High-tech non-financial -0.47 -0.50
Low-tech non-financial -0.45 -0.91 -0.46
Split by Sector Type & Skill
High-tech Manufacturing -0.41
Low-tech Manufacturing -0.93 -1.19 -0.54
High-tech Services -0.50 -0.55
Low-tech Services -0.37 -0.93 -0.41
32
Firm size
As discussed in the data section, the information on firm characteristics in their year of entry is more
limited than our information on entry and reduces the sample size by approximately one-fifth.
However, this still leaves a large enough number of firms to allow us to do an interesting comparison
of the sensitivity to tax rates of different sized firms, which would be an important consideration for
policy makers. The firms are divided into three groups according to the assets of the newly established
subsidiary (as discussed in the data section) and the location decision specification run separately for
each group. We find that across all of our measures of the tax rate there is an increase in the absolute
value of the coefficients, showing that higher tax rates are regarded as a greater disincentive to
choosing a location by larger firms. In addition, the countervailing positive squared term does not
change much across the firm size group.
Table : Coefficient Estimates by Firm Size
Policy rate Mean EATR Total Tax Rate
Size 1 - Small
Coeff Tax 5.501 -20.149*** -11.449***
(5.985) (5.394) (1.754)
Coeff Tax Rate ^ 2 0.043 0.596*** 0.136***
(0.102) (0.100) (0.017)
Size 2 - Medium
Coeff Tax -13.807*** -28.864*** -14.001***
(4.897) (5.296) (1.782)
Coeff Tax Rate ^ 2 0.359*** 0.689*** 0.157***
(0.084) (0.098) (0.017)
Size 3 - Large
Coeff Tax -26.834*** -36.680*** -12.432***
(4.358) (5.329) (1.933)
Coeff Tax Rate ^ 2 0.414*** 0.654*** 0.121***
(0.081) (0.100) (0.020)
Standard errors in parentheses
*** p<0.01, ** p<0.05, * p<0.1
Note: Model estimated using all controls as in main extended model.
The marginal effects are presented in Table .
Table : Marginal Effects by Size
Policy rate Mean EATR Total Tax Rate N
Size 1 – Small -0.74 -0.42 24,056
Size 2 – Medium -0.50 -1.06 -0.52 20,350
Size 3 – Large -0.99 -1.35 -0.46 21,714

33
Policy Experiment
To provide insight into the meaning of our results for policymakers, we undertake a number of
simulations which examine the effect of changing the rate of corporation tax on the probability of a
firm choosing to locate in Ireland.
To undertake this experiment, we use the predicted probability from the main extended model. These
probabilities basically capture the likelihood on average that a firm will chose Ireland relative to all
other locations in the choice set. Given the size of Ireland’s economy, it is not necessarily the case that
it will receive a large absolute number of FDI affiliates but our attractiveness to FDI, and historical
success in developing a robust FDI sector, would suggest we should receive a larger share of firms that
our economy size would suggest.
To motivate this we present a table of mean location probability from our model and the mean share
of GDP. The location probabilities shown are individual probabilities calculated by the conditional logit
model, averaged for each country from the model presented in Table 18. These are not simply the
share of affiliates in each country.
Table : GDP Share and Location Probability by Country
Country GDP Share Location Probability Share of Affiliates in Sample
Austria 2.1% 4.8% 3.1%
Belgium 2.6% 3.5% 0.8%
Bulgaria 0.2% 2.3% 3.7%
Czech Republic 1.0% 2.4% 6.6%
Germany 19.4% 12.8% 9.8%
Denmark 1.7% 3.3% 0.9%
Estonia 0.1% 0.4% 2.0%
Spain 7.8% 5.7% 9.9%
Finland 1.4% 2.2% 1.2%
France 14.6% 9.6% 6.6%
Greece 1.6% 2.7% 0.2%
Croatia 0.3% 1.6% 2.8%
Hungary 0.7% 2.1% 0.4%
Ireland 1.4% 3.1% 4.0%
Italy 11.8% 8.9% 13.0%
Lithuania 0.2% 1.3% 1.1%
Latvia 0.1% 1.5% 1.3%
Netherlands 4.5% 6.6% 7.7%
Norway 2.1% 3.1% 3.2%
Poland 2.4% 6.1% 4.4%
Portugal 1.3% 3.0% 3.4%
Sweden 2.6% 2.3% 1.1%
Slovenia 0.3% 1.0% 0.7%
Slovakia 0.5% 1.6% 1.5%
United Kingdom 15.8% 7.4% 10.6%

34
We can see that these series are highly correlated (𝜌 = 0.92), however a trend emerges in that larger
countries such as Germany, France, Italy and the UK tend to host less firms than their share of GDP
would indicate. This is more clearly illustrated in the following graph. The reverse is true for smaller
countries which tend to be over-represented. For instance a firm has a 3.1% chance of locating in
Ireland during our sample period, while the Irish share of GDP is only 1.4%. In this chart, countries to
the left of the red line receive a lower share of FDI affiliates relative to their GDP share, whereas firms
in the right of the line receive a higher share of FDI than their GDP share.
Figure Scatterplot of GDP Share and Location Probability

35
Given this fact, it would be interesting to see what would happen were Ireland to have had a different
headline policy rate during this period. To examine this further we conduct a policy experiment in
which the current Irish policy rate of 12.5% is substituted with an alternative tax rates, holding all
other control variables and other countries tax rates constant. We then measure the subsequent
change in location probability.
As described in the Methodology section, the probability of choosing country c within the conditional
logit model can be expressed as follows:
P(Y = c|1, … , J, Xic) = eXicβ
∑ eXijβJj=1
In order to simulate the tax change, we first estimate our main model and calculate the country
specific location probability. Assuming the vector Tic represents the current policy rate in the larger
matrix of controls Xic, for each country within this calculation, we then substitute this vector with T∗ic
which contains the new Irish tax rate.
Tic ≠ T∗ic
This vector is then included in a new control matrix X∗ic. The probabilities are then recalculated and
the difference expressed as a percentage change over the initial probability. Formally, for each new
tax rate we calculate:
P(Y = c|1, … , J, X∗ic) − P(Y = c|1, … , J, Xic)
P(Y = c|1, … , J, Xic)
The results are summarised in Table below
The results indicate that our statutory tax rate is an important factor in location probability, if this rate
is lowered the probability of a firm locating in Ireland increases, and as it is raised the probability of
firms choosing Ireland decreases.
Table 26: Effect of Changes in Irish Statutory Tax Rate on Location Probability
Remain at
12.5% Change to
15% Change to
17.5% Change to
20% Change to
22.5%
Probability of locating in Ireland 3.12% 2.44% 1.98% 1.65% 1.43% Change in percent of new affiliates opened in Ireland 0% -22% -37% -47% -54%
We also see that this effect is non-linear, and the percentage change in probability decreases as the
tax rate increases.

36
Figure : Probability of locating in Ireland at different tax rates
We must be careful when interpreting these results. For example, this result means that if Ireland’s
tax rate had been 15% from 2005-2012, the probability of a firm locating there would have been
reduced by 22% over this period, or alternatively the number of firms locating in Ireland would have
been reduced by 22%. This does not imply that if Ireland raised its tax rate to 15% tomorrow, it would
lose 22% of new affiliates being opened by multinationals.
Re weighting main effects for Ireland
A final estimation we conduct to provide policy insight is an attempt to provide an alternative overall
marginal effect that better reflects the Irish sample in the data. To do this, we take the average sector
marginal effects for manufacturing, services, financial and other and multiply these by the share of
affiliates across sectors that choose Ireland. Specifically, this is re-weighted as follows:
𝑀𝐹𝑋_𝑁𝑒𝑤 = 𝑀𝐹𝑋𝑀 × 𝑆ℎ𝑎𝑟𝑒𝑀 + 𝑀𝐹𝑋𝑆 × 𝑆ℎ𝑎𝑟𝑒𝑆 + 𝑀𝐹𝑋𝐹 × 𝑆ℎ𝑎𝑟𝑒𝐹 + 𝑀𝐹𝑋𝑂 × 𝑆ℎ𝑎𝑟𝑒𝑂
where MFXi is the marginal effect of the manufacturing, services, financial and other sectors
respectively. These are taken from Table . The share of affiliates for each sector in the Irish data is
presented in the table below. Using these shares and the previous marginal effects, the re-weighted
effect which is better balanced for Ireland is approximately -1.8 for the EATR and -0.9 for the policy
rate coefficient. The figures presented in the table above should be directly compared to the extended
main model outlined in Table 19.
0.000
0.005
0.010
0.015
0.020
0.025
0.030
0.035
0.040
0.045
10 12 14 16 18 20 22 24
P
r
o
b
a
b
i
l
i
t
y
Percentage Tax Rate

37
Table : Sector MFX Re-calculated using Mean EATR
Affiliates Share
Manufacturing 7 0.05
Services 50 0.36
Financial 80 0.57
Other 3 0.02
Mean EATR -1.79
Policy rate -0.92
Robustness checks
To ensure that our results are robust to considerations of specification and sampling, we undertake a
number of robustness checks. The checks are as follows:
R1: Estimate the model including the cross border EATR
R2: Include both the EATR cross border and the mean EATR
R3: Limit the sample to home country firms that are in the OECD
R4: Limit the sample to home country firms that are in the EU 28
R5: Remove US firms are re-estimate.
R6: Remove all investment option pairs (home-host) that are never chosen by a firm.
R7: Additional size controls.
Further robustness checks have also been completed which include controls for trade openness,
further modelling of labour costs, and labour income taxation and the main results hold in all cases.
While not presented here, there results are available on request from the authors.
Across all robustness checks, the effects of the new variables and sample splits are qualitatively the
same and in all cases the signs and significance of the tax rate and its squared term remain unchanged
although the magnitudes are slightly reduced in some of the specifications.
Table includes the EATR crossborder in an additional regression. The sample size falls as some firms
are missing observations. We also re-estimate the model for the other tax rates on this smaller sample.
In all cases, the main results hold with a negative and significant main effect and a positive and
significant square term on the corporation tax variable.

38
Table : R1: EATR Crossborder
Policy rate -26.434*** (4.122) Policy rate2 0.332*** (0.075) Mean EATR -37.856*** (4.970) Mean EATR2 0.586*** (0.091) Total Tax Rate -17.341*** (1.728) Total Tax Rate2 0.170*** (0.018) Crossborder EATR -28.462*** (3.647) Crossborder EATR2 0.425*** (0.063)
N 31330 31330 31330 31330 Pseudo R2 0.168 0.166 0.168 0.164
Standard errors in parentheses *** p<0.01, ** p<0.05, * p<0.1
To further explore the relative effects of EATR crossborder with the main EATR, both variables are
included in the same regression. The results are presented in Table . Including this control can ensure
the results are not being driven by parent country taxation considerations. The results suggest that
the effects are driven by both variables.
Table : R2: Decompose EATR Crossborder
Mean EATR -26.168*** (6.01) Mean EATR2 0.379 *** (0.113) EATR Crossborder - 18.977 (4.228) Crossborder EATR2 0.305 (0.076)
N 31330 Pseudo R2 0.168
Standard errors in parentheses *** p<0.01, ** p<0.05, * p<0.1
Robustness checks R3, R4, and R5 each estimate the main tax effects on different sub samples of firms.
These checks are motivated by the fact that firms from different jurisdictions may be non-randomly
selected into the sample due to data availability. There may also be treaty issues or home country
factors that lead firms from different jurisdictions to make systematically different choices. These
39
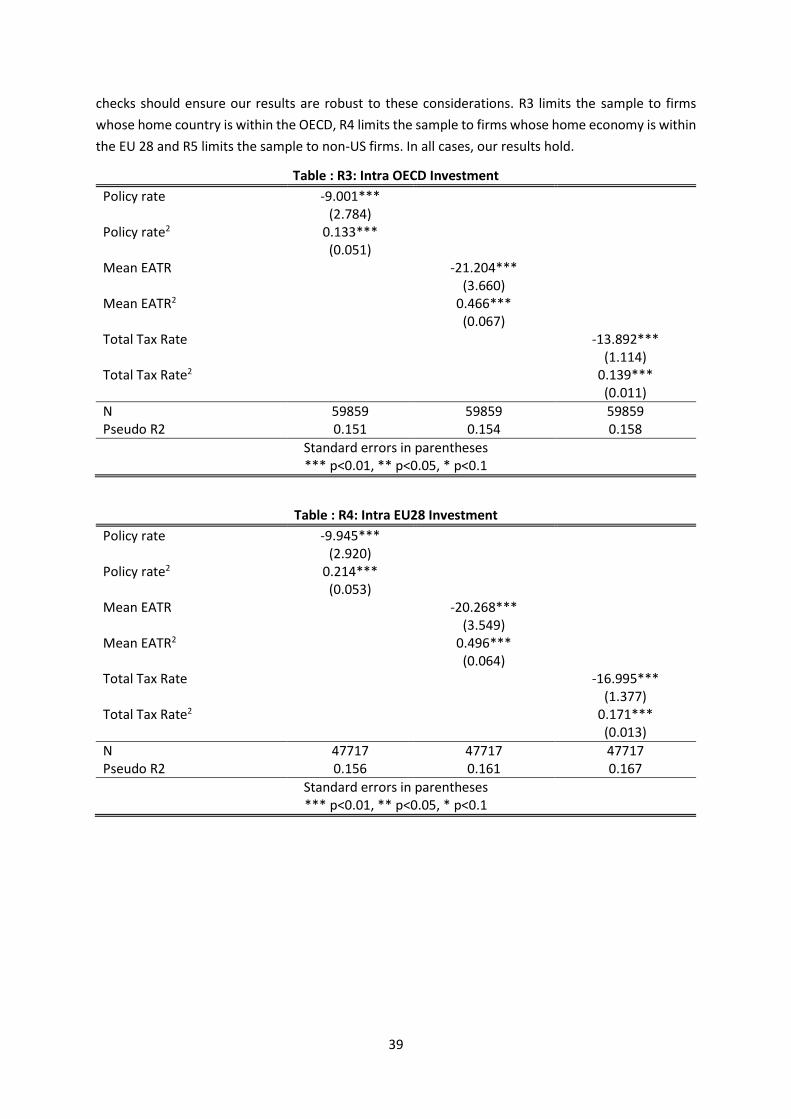
checks should ensure our results are robust to these considerations. R3 limits the sample to firms
whose home country is within the OECD, R4 limits the sample to firms whose home economy is within
the EU 28 and R5 limits the sample to non-US firms. In all cases, our results hold.
Table : R3: Intra OECD Investment
Policy rate -9.001*** (2.784) Policy rate2 0.133*** (0.051) Mean EATR -21.204*** (3.660) Mean EATR2 0.466*** (0.067) Total Tax Rate -13.892*** (1.114) Total Tax Rate2 0.139*** (0.011)
N 59859 59859 59859 Pseudo R2 0.151 0.154 0.158
Standard errors in parentheses *** p<0.01, ** p<0.05, * p<0.1
Table : R4: Intra EU28 Investment
Policy rate -9.945*** (2.920) Policy rate2 0.214*** (0.053) Mean EATR -20.268*** (3.549) Mean EATR2 0.496*** (0.064) Total Tax Rate -16.995*** (1.377) Total Tax Rate2 0.171*** (0.013)
N 47717 47717 47717 Pseudo R2 0.156 0.161 0.167
Standard errors in parentheses *** p<0.01, ** p<0.05, * p<0.1

40
Table : R5: Drop USA Parent
Policy rate -17.330*** (2.614) Policy rate2 0.324*** (0.047) Mean EATR -29.466*** (3.029) Mean EATR2 0.618*** (0.056) Total Tax Rate -13.161*** (1.045) Total Tax Rate2 0.140*** (0.011)
N 69796 69796 69796 Pseudo R2 0.144 0.149 0.152
Standard errors in parentheses *** p<0.01, ** p<0.05, * p<0.1
Another robustness check that we undertake tests the robustness of the model to exclusion of host-
home country pairs in which no firm actually makes an investment. Excluding these groups should
provide a very severe test against including irrelevant alternatives in the choice set of enterprises. The
results of our main model on this reduced sample are included in Table . While the effects are
somewhat weaker for the policy rate, in all cases, our general findings hold.
Table : R6: Eliminate No Investment Country Pairs
Policy rate -4.238* (2.357) Policy rate2 0.052 (0.042) Mean EATR -13.114*** (2.829) Mean EATR2 0.281*** (0.052) Total Tax Rate -12.524*** (0.971) Total Tax Rate2 0.126*** (0.010)
N 57594 57594 57594 Pseudo R2 0.101 0.102 0.110
Standard errors in parentheses *** p<0.01, ** p<0.05, * p<0.1
The final robustness check that we include tests the sensitivity of the results to controlling for country
size. In this model, we remove the relative GDP and population measures and allow the log of GDP to

41
enter both on its own and with a square term which also controlling for the country specific host
population size. This robustness check should help provide extra robustness in the face of alternative
specifications on firm size.
Table : R7: Additional Size Controls
Policy rate -11.901*** (2.78) Policy rate2 0.180*** (0.051) Mean EATR -20.753*** (3.303) Mean EATR2 0.412*** (0.059) Total Tax Rate -12.669*** (1.095) Total Tax Rate2 0.120*** (0.011)
N 57594 57594 57594 Pseudo R2 0.101 0.102 0.110
Standard errors in parentheses *** p<0.01, ** p<0.05, * p<0.1

42
Conclusions When companies internationalise their operations, they face many decisions. These include whether
or not to export or to locate a plant abroad, where to locate an affiliate if FDI is the chosen method of
globalisation, and then the volume of investment once the destination is chosen.
This research report is narrowly focused on evaluating the role of corporation taxation on the location
decision of foreign affiliates. It assumes that the firm has chosen FDI as its preferred
internationalisation strategy and does not model investment flows. Our focus is therefore on
identifying the degree to which corporation tax affects the location decision of foreign multinationals
while controlling for a range of other important factors such as infrastructure, market potential, labour
market cost and quality and geographic factors.
A number of results emerge. We find a strong negative, but non-linear, effect of taxation on the
likelihood of a destination being chosen. The result holds using a range of tax measures including the
statutory policy rate, an estimated effective average tax rate, and a total tax rate. The findings are
robust to the inclusion of a range of additional control variables and sub-sample splits. When
comparing the effect of taxation to other important factors, we find that taxation is the largest single
determinant of the location decision.
Splitting the sample by sector and by skill type, we find that the financial sector is the most sensitive
to changes in the corporation tax rate, following by the manufacturing and services sectors. The
utilities and construction sectors appear the least sensitive to corporation tax changes. Across both
non-financial services and manufacturing, the location decisions of foreign affiliates in high-tech
sectors are less sensitive to corporation taxation changes than firms in low-tech sectors. These
heterogeneous impacts across industrial groupings are important to understand the impact of policy
changes to corporation taxation across countries. The difference in sectoral responsiveness of FDI
location to taxation has implications for the composition of the foreign-invested sector and must be
taken into account when policymakers are evaluating taxation considerations. If particular sectors are
chosen as a policy focus, then their responsiveness of taxation must be evaluated with regard to the
basket of other factors which determine their corporate decision as well as their sector specific
responsiveness to taxation.
While our research is narrowly focused on the decision where to locate a specific affiliate, there are a
number of avenues of additional research that would be complementary and provide additional
insight. These include the following:
Evaluating the impact of corporation taxation on volume of investment flows and the
committed capital of the FDI affiliate;
Testing the impact of corporation tax treatment of financing sources on the financing
structure of the investment (the composition of debt, equity and retained earnings used); and
Evaluating the impact of taxation competition on the decision where to locate the affiliate.
Furthering this current evaluation with research on the aforementioned additional topics would
enhance our understanding of how corporation tax affects enterprises decisions more broadly.

43
Bibliography
Barrios, S., Huizinga, H. P., Laeven, L., & Nicodème, G. J. (2012). International taxation and
multinational firm location decisions. Journal of Public Economics , 96 (11), 946-958.
Basile, R., Castellani, D., & Zanfei, A. (2008). Location choices of multinational firms in Europe: The role
of EU cohesion policy. Journal of International Economics , 74 (2), 328-340.
Billington, N. (1999). The location of foreign direct investment: An empirical analysis. Applied
Economics , 31, 65-76.
Chen, M., & Moore, M. O. (2010). Location decision of heterogeneous multinational firms. Journal of
International Economics , 80 (2), 188-199.
Davies, R., Norbäck, P.-J., & Tekin-Koru, A. (2009). The Effect of Tax Treaties on Multinational Firms:
New Evidence from Microdata. The World Economy , 32 (1), 77-110.
DeMooij, R. A. and S. Ederveen (2005) How does foreign direct investment respond to taxes? A meta
analysis, Paper presented at the Workshop on FDI and Taxation, GEP Nottingham, October.
Devereux, M. P., & Freeman, H. (1995). The impact of tax on foreign direct investment: Empirical
evidence and the implications for tax integration schemes. International Tax and Public Finance , 2 (1),
85-106.
Devereux, M. P., & Griffith, R. (2003). Evaluating Tax Policy for Location Decisions. International Tax
and Public Finance , 10 (2), 107-26.
Devereux, M. P., & Griffith, R. (1998). Taxes and the location of production: evidence from a panel of
US multinationals. Journal of Public Economics , 68 (3), 335-367.
Devereux, M. P., & Griffith, R. (2002). The impact of corporate taxation on the location of capital: A
review. Swedish Economic Policy Review , 9, 79-102.
Devereux, M. P., & Griffith, R. (2003). The Impact of Corporate Taxation on the Location of Capital: A
Review. Economic Analysis and Policy (EAP) , 33 (2), 275-292.
Greene, W. (2012). Econometric Analysis (Seventh Edition ed.). Pearson.
Guimaraes, P., Figueirdo, O., & Woodward, D. P. (2003). A Tractable Approach to the Firm Location
Decision Problem. The Review of Economics and Statistics , 85 (1), 201-204.
Guimaraes, P., Figueiredo, O., & Woodward, D. P. (2004). Industrial Location Modeling: Extending the
Random Utility Framework. Journal of Regional Science , 44 (1), 1-20.

44
Head, K., & Mayer, T. (2004). Market Potential and the Location of Japanese Investment in the
European Union. The Review of Economics and Statistics , 86 (4), 959-972.
Kemsley, D. (1998). The effect of taxes on production location. Journal of Accounting Research , 36.
McFadden, D. (1974). Frontiers in Econometrics. In P. Zarembka (Ed.). Academic Press, New York.
Schmidheiny, K., & Brülhart, M. (2011). On the equivalence of location choice models: Conditional
logit, nested logit and Poisson. Journal of Urban Economics , 69 (2), 214-222.
Siedschlag, I., Zhang, X., & Smith, D. (2013). What determines the location choice of multinational
firms in the information and communication technologies sector? Economics of Innovation and New
Technology , 22 (6), 581-600.
Siedschlag, I., Zhang, X., Smith, D., & Turcu, C. (2013). What determines the location choice of R&D
activities by multinational firms? Research Policy , 42, 1420-1430.
Young, G. (1999). The Influence of Foreign Factor Prices and International Taxation on Fixed
Investment in the UK. Oxford Economic Papers , 51 (2), 355-73.
ZEW. (2013). Effective Tax Levels Using the Devereux-Griffith Methodology: 2012 report. Taxation
Studies, Directorate General Taxation and Customs Union, European Commission.
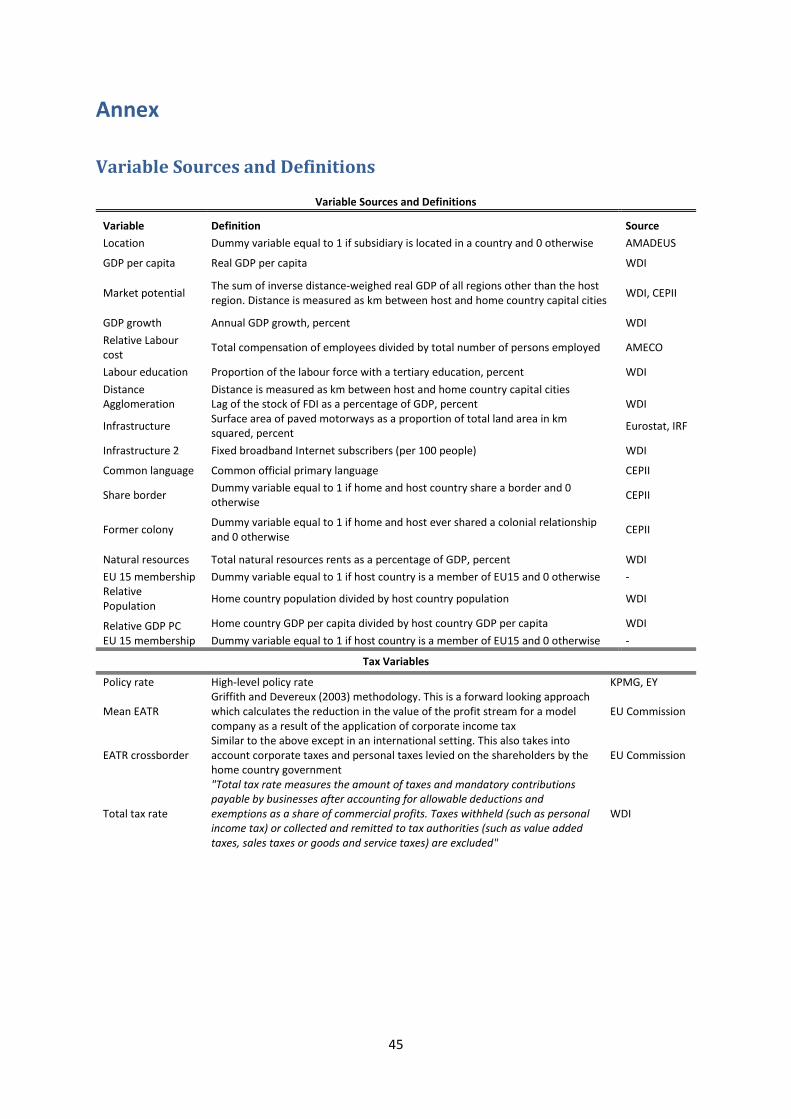
45
Annex
Variable Sources and Definitions
Variable Sources and Definitions
Variable Definition Source
Location Dummy variable equal to 1 if subsidiary is located in a country and 0 otherwise AMADEUS
GDP per capita Real GDP per capita WDI
Market potential The sum of inverse distance-weighed real GDP of all regions other than the host region. Distance is measured as km between host and home country capital cities
WDI, CEPII
GDP growth Annual GDP growth, percent WDI
Relative Labour cost
Total compensation of employees divided by total number of persons employed AMECO
Labour education Proportion of the labour force with a tertiary education, percent WDI
Distance Distance is measured as km between host and home country capital cities Agglomeration Lag of the stock of FDI as a percentage of GDP, percent WDI
Infrastructure Surface area of paved motorways as a proportion of total land area in km squared, percent
Eurostat, IRF
Infrastructure 2 Fixed broadband Internet subscribers (per 100 people) WDI
Common language Common official primary language CEPII
Share border Dummy variable equal to 1 if home and host country share a border and 0 otherwise
CEPII
Former colony Dummy variable equal to 1 if home and host ever shared a colonial relationship and 0 otherwise
CEPII
Natural resources Total natural resources rents as a percentage of GDP, percent WDI
EU 15 membership Dummy variable equal to 1 if host country is a member of EU15 and 0 otherwise - Relative Population
Home country population divided by host country population WDI
Relative GDP PC Home country GDP per capita divided by host country GDP per capita WDI
EU 15 membership Dummy variable equal to 1 if host country is a member of EU15 and 0 otherwise -
Tax Variables
Policy rate High-level policy rate KPMG, EY
Mean EATR Griffith and Devereux (2003) methodology. This is a forward looking approach which calculates the reduction in the value of the profit stream for a model company as a result of the application of corporate income tax
EU Commission
EATR crossborder Similar to the above except in an international setting. This also takes into account corporate taxes and personal taxes levied on the shareholders by the home country government
EU Commission
Total tax rate
"Total tax rate measures the amount of taxes and mandatory contributions payable by businesses after accounting for allowable deductions and exemptions as a share of commercial profits. Taxes withheld (such as personal income tax) or collected and remitted to tax authorities (such as value added taxes, sales taxes or goods and service taxes) are excluded"
WDI