The Importance of Cephalopods in the Diets of … Doccuments/1998/M/M0898.pdfDirectly from...
16
Not to be cited without prior reference to the authors THEME SESSION (M) Impact of Cephalopods in. the Food Chain and Their Interaction with the Environment ICES CM 19981M:8 The Importance of Cephalopods in the Diets of Marine Mammals and Other Top Predators M.R. Clarke, M.B. Santos and GJ. Pierce The importance of cephalopods in the diets of top predators is reviewed, with particular reference to studies by the authors on sperm whales (Physeter macrocephalus), common dolphins (Delphinus delphis), blue sharks (Prionace glauca) and swordfish (Xiphias gladius). The use of such data to estimate cephalopod consumption by top predator populations is illustrated, as is the potential for estimating cephalopod population biomass. Cephalopods have been shown to constitute an important part of the diet of many top predator species, although the importance of cephalopods varies with area (e.g. comparing the Antarctic and NE Atlantic). Quantifying the importance of cephalopods in diets presents some methodological problems due to, e.g., differing passage rates and digestibility of fish and cephalopods. These uncertainties and biases can significantly affect calculations of the amount of food consumed. Further problems are encountered when estimating population consumption, e.g. due to uncertainty in population size estimates. Confidence limits for consumption of cephalopods by sperm whales in the NE Atlantic are estimated using bootstrap procedures. Lower and upper 95% confidence limits, based on simple assumptions about likely random errors in parameter estimates, can differ by an order of magnitude. Computations such as those used here are useful in showing where data is most imperfect. At present, the multiplicity of potential errors in any but the most basic calculations will extend confidence limits beyond the point that their quantification is helpful. However, within distinctly prescribed geographic areas, where populations are well known, modelling of species interactions may be productive. <t KEYWORDS: cephalopods, top predators, marine mammals, diet, food consumption, fisheries MR Clarke: Southdown, Millbrook, Torpoint, Cornwall, PLIO 1EZ, UK [e-mail: [email protected] ME. Santos and G.J. Pierce: Department of Zoology, University of Aberdeen, Tillydrone Avenue, AB24 2IZ, UK [tel: +44 1224 272459, fax: +44 1224272396, e-mail: [email protected]@abdn.ac.ukJ
Transcript of The Importance of Cephalopods in the Diets of … Doccuments/1998/M/M0898.pdfDirectly from...

Not to be cited without prior reference to the authors
THEME SESSION (M)
Impact of Cephalopods in. the Food Chain and Their Interaction with the Environment
ICES CM 19981M:8
The Importance of Cephalopods in the Diets of Marine Mammals and Other Top Predators
M.R. Clarke, M.B. Santos and GJ. Pierce
The importance of cephalopods in the diets of top predators is reviewed, with particular reference to studies by the authors on sperm whales (Physeter macrocephalus), common dolphins (Delphinus delphis), blue sharks (Prionace glauca) and swordfish (Xiphias gladius). The use of such data to estimate cephalopod consumption by top predator populations is illustrated, as is the potential for estimating cephalopod population biomass.
Cephalopods have been shown to constitute an important part of the diet of many top predator species, although the importance of cephalopods varies with area (e.g. comparing the Antarctic and NE Atlantic). Quantifying the importance of cephalopods in diets presents some methodological problems due to, e.g., differing passage rates and digestibility of fish and cephalopods. These uncertainties and biases can significantly affect calculations of the amount of food consumed. Further problems are encountered when estimating population consumption, e.g. due to uncertainty in population size estimates.
Confidence limits for consumption of cephalopods by sperm whales in the NE Atlantic are estimated using bootstrap procedures. Lower and upper 95% confidence limits, based on simple assumptions about likely random errors in parameter estimates, can differ by an order of magnitude.
Computations such as those used here are useful in showing where data is most imperfect. At present, the multiplicity of potential errors in any but the most basic calculations will extend confidence limits beyond the point that their quantification is helpful. However, within distinctly prescribed geographic areas, where populations are well known, modelling of species interactions may be productive. <t
KEYWORDS: cephalopods, top predators, marine mammals, diet, food consumption, fisheries
MR Clarke: '~ncarva", Southdown, Millbrook, Torpoint, Cornwall, PLIO 1EZ, UK [e-mail: [email protected] ME. Santos and G.J. Pierce: Department of Zoology, University of Aberdeen, Tillydrone Avenue, AB24 2IZ, UK [tel: +44 1224 272459, fax: +44 1224272396, e-mail: [email protected]@abdn.ac.ukJ

Introduction
Analyses of stomach contents of 'top marine predators can be useful for many different investigations. Besides indicating what a predator depends on for food, the predator's distribution, diving prowess etc., it can also tell us more about the ecology of the prey species, their distribution (Clarke, 1980), seasonal fluctuations and sometimes their growth (Clarke, 1993). Extensions of such analyses havepotential for giving information on the biomass of the prey (Clarke, 1987.), on the interaction of predators with other species such as commercial species offish (Smale, 1996.) and on fluctuations of what is present in an area.
Here, we are mainly concerned with cephalopods in the diets of odontocetes although mention will be made of teuthophagous birds, seals and large fish. What can be deduced from the basic data derived from examining stomach contents very much depends on our knowledge of the cephalopods and predators concerned and whether the predator being considered also includes fish and/or crustaceans in the diet.
The material we obtain from stomachs varies from complete prey animals to just eye lenses. Each type of material will help us to answer different questions and provide progress towards all or some of the aims outlined above. Each has different problems; usually there is little flesh left of many oceanic cephalopods since they are digested rapidly, more rapidly than fish muscle. Cephalopod beaks are largely undigested and .sometimes accumulate in the stomach while many otoliths and bones of fish are digested and are lost from the stomach before the beaks. Fish scales, finrays and teeth can all be used for identification. Cephalopod pens and spermatophores can aid identification but the former are usually broken up early in the digestive process and the latter have not been used. Eye lenses are digested only slowly although those of cephalopods break up much more quickly than those of fish and the ratio between them is not a good guide to the ratio in the diet (Clarke et at., 1995) although their presence sometimes shows cephalopod presence in an otherwise heavily piscivorous diet.
Here we shall co.nsider some of the sources of error in estimating the importance of cephalopods in the diet of cetaceans and other top predators. Our measure of "importance" will be biomass and our data will come from our own published and unpublished work. We hope to show limitations of present information and potential for further work.
Dietary analysis can only provide representative results if the sample is representative. Since many current studies rely on strandings and by-catches, this is difficult to ensure (or even to test since, for some species, the only information on popUlation structure comes from strandings ).
To assess 'importance" of cephalopods, in general and for species, requires first the identification of cephalopods and their beaks .. As few cephalopods are found in a sufficiently undigested state to be identified, the most efficient utilisation of samples involves identification of the beaks (as many as 18,000 beaks can be present in a sperm whale stomach, Clarke, 1980). Identification to as Iowa taxon as possible facilitates calculation of mass since size of beaks to mass relationships differ markedly according to.genus and sometimes species (and in a few families according to. sex, e.g. Onychoteuthidae). Identifying genera is usually possible from the lower beaks, for specified areas such as.the North Atlantic and many genera often include but one species in a region. Although some beaks remain unidentified in almost any oceanic region, these are not among the most numerous species and difficulties reflect taxonomic problems due to inadequacy in sampling cephalopods from oceanic waters.
--~
2

Directly from identification we can assess frequency of occurrence and relative numerical occurrence (%) which give a 'feel' for the relative importance of the species.
Estimates of the relationship between beak length (lower rostral length and lower crest or lower hood lengths- LRL, LCL, LHL, respectively) and body mass could be greatly improved for most genera. Particularly serious errors can arise from extrapolation from small animals (which are caught in nets and therefore available) to much larger animals in the food of the larger predators such as whales, seals or large fish (which are rarely caught by fishing gear, Clarke, 1983). Confidence limits have been published for few of these relationships and errors in these calculations lead to errors in the biomass percentage calculations even if only one of the species in the diet is significantly incorrect.
When such biomass estimates are used to find population consumption in a geographic region these errors may be compounded by other factors such as errors in the estimation of the predator's population. Another factor in these calculations is the food requirement, usually expressed as a percentage of the mass of the predator per day (ranging from 2.0 - 3.5% for sharks and marine mammals, Clarke, 1979; Lockyer, 1981; R. Clarke et al., 1988 ; Clarke et al., 1996.).
Estimates from calorific values is another way of calculating consumption but, at present, we have sufficient data for few families and any errors compound the errors of biomass estimates for each prey species.
While all the above difficulties are serious when a predator under study only eats cephalopods, even more difficulties arise when the predator also eats fish because, at present, we have no effective way of quantifying cephalopods relative to fish. The latter are identified from calcareous parts, mainly otoliths, which dissolve rapidly in digestive juices while the beaks of cephalopods resist digestion and pass from the stomach at unknown intervals. Thus, they are lost from the stomach at different, unknown, intervals of time. This may lead to a considerable over estimation of the importance of cephalopods in the diet unless some way of recognising the intake during a particular time period can be found. This may be possible when feeding is restricted to dark hours and digestion during the day is followed by evacuation of remains from the stomach before the next feeding period (Clarke et a!., 1996).
Statistical treatment of the computations based upon beak identifications and rostral measurements has not been popular largely because the data can so obviously only be considered a rough guide to reality due to the unknowns involved. Statistical analysis would suggest some confidence in the actual numbers given. Confidence limits can be difficult to calculate in dietary analysis for several reasons. Typically diets are described in terms of the overall proportion by weight of different prey species in a set of samples. The estimated importance of a species is thus a single number derived from the whole set of samples and does not have any confidence limits (unless we have several sets of samples and can calculate a mean and variance for sets). Furthermore, weights of prey are not measured directly, but estimated from measurements of hard parts (fish otoliths, cephalopod beaks) using previously established regression equations.
An important recent development has been the application of computer simulations and statistical procedures to quantify the errors that arise in the collection and analysis of samples and that allow the calculation of confidence limits. Reynolds & Aebisher (1991) described the application of bootstrap procedures to estimate confidence limits for mammalian diet composition. However, there are currently few published examples of the application of these
3

techniques to marine mammal diets. Hammond & Rothery (1996) recently applied such procedures to estimates of seal diet composition. Here, bootstrap simulations were used to calculate confidence limits for the estimated values of cephalopod consumption by the sperm whale population in the Northeast Atlantic.
Methodology
The present paper discusses and/or revises figures of population consumption by sperm whales, globally and in some regions (the Antarctic, the North Atlantic and the Azores), previously published by M.R. Clarke (Clarke, 1977; 1983; Clarke etal., 1993). New data on population consumption by common dolphins off Galicia and sperm whales in the Northeast Atlantic are also presented together with information. on the diets of swordfish and blue sharks (Clarke et at., 1995; Clarke et al" 1996). Population consumption estimates for common dolphins are based in dietary data obtained from a sample of91 non-empty stomachs stranded on the Galician coast between 1991 and 1995 (see Santos et at., 1995a; 1996a). For figures of sperm whale population consumption in the NE Atlantic, the data comes from two mass strandings and 1 single stranding in Scotland between 1994 and 1996 (samples were collected from 10 stomachs) and 1 mass stranding and 3 single strandings in Denmark between 1990 and 1996 (samples were collected from 7 stomachs; see Santos et at., 1995b, 1996b).
In all cases, prey remains were identified using published guides and reference material (Clarke, 1980, 1986; Hiirkonen, 1986; Perez-Gillldaras, 1986; Watt et aI., 1997) and a reference collection. Standard measurements (rostral length for decapods and hood length for octopods (Clarke, 1980, 1986) and otolith length or width {Hiirkonen, 1986) were taken using either callipers or a binocular microscope fitted with an eyepiece graticule.Prey size was estimated from these measurements using published. and unpublished regressions (Bedford et at., 1986; Clarke, 1986; Coull etal., 1989; J. Hislop, Unpubl. data; G.J. Pierce & M.B. Santos, Unpubl. data).
Details of calculations for population consumption are explained in each of the following sections. In general, the form of the calculations is as follows:
where:
Ii is the annual consumption of the prey category i by the predator population (in tonnes .or millions oftonnes) N is the predator population size Pi is the proportion by weight of prey category i in the diet F is the average weight of food eaten daily by an "average" individual predator T is the number of days when prey and predator are in contact.
This approach ignores seasonal and regional variation in diet and, in referring to "average" individuals, ignores population structure. However, the· data available generally preclude a more detailed approach.
Bootstrap procedures for estimating confidence limits are based on unpublished work by M.B. Santos and G.J. Pierce.
,-
4

Results and discussion
Global estimates
In order to indicate the importance of cephalopods in the ocean an attempt was made (Clarke,1977) to estimate the total biomass consumed by sperm whales alone from estimates oftotal sperm whale population. For this purpose, sperm whales were particularly useful since they are very large, their food is known to be almost entirely cephalopod in most parts of the world and their population had recently been estimated. The relevant data and estimates were as follows (weights in tonnes):
Total No. of sperm whales (males and females, 1972) Mean weight
1,258,000 15 and 5
11,000,000 (males, females,
Total weight Weight of prey consumed per day respectively) Weight of prey consumed per year
Weight of prey consumed in 1946
2% and 3%
(minimum) (maximum, 1St mean weight and all at 3.5%) (immediately after the war)
96,000,000 320,000,000 260,000,000
These estimates were then compared with the 70 million tonnes of sea animals caught annually by man (90 million tonnes today) and they were large enough to drastically change our view of the importance of cephalopods in the deep ocean. Add to this the fact that nearly all of the species eaten by sperm whales are poorly represented in commercial or research catches and the possible inaccuracy of the estimates was of little consequence since the broad figures proved the point However, it is worth reflecting on possible errors in these estimates. The mean weights of the sperm whales was a complete guess based on the facts that the mean adult male is about 45feet long and weighs 45 tonnes and the mean adult female is about 35 feet and 11 tonnes. Even allowing for young whales and a prolonged suckling period (Best et al., 1984) the estimates of mean weights was still probably low. R. Clarke et al. (1988) carefully examined the daily feeding rates used by other workers and came to the conclusion that Sergeant's (1969) estimate of 3.32% body weight per day, based on feeding of cetaceans in captivity, was close to his own estimates from the meal sizes of commercially killed whales in the Southeast Pa~ific. R. Clarke considered the consumption of 2-3% per day used above low. In addition Sergeant's calculations were based upon feeding with fish or squids of high calorific value but over half the squids consumed by sperm whales are ammoniacal and have less than half the calorific value of commercially important cephalopods (Loliginidae, Ommastrephidae and Octopodidae). R. Clarke concluded that the minimum figure given above is much too low and that the maximum figure may be nearer the truth. Thus, even after 21 years, the overall estimate of 100 million tonnes would probably stand as being well on the conservative side.
The tonnages of the various squid families cannot be calculated from the total consumption estimate since .all regions vary and their limits cannot be assessed. However, in general, we can conclude that the bulk of the tonnage taken in the Arctic are Gonatidae, in the temperate and tropical seas Histioteuthis spp. and Taningia sp. and in the Antarctic the cranchid Mesonychoteuthis and the onychoteuthid Kondakovia.
5

Antarctic Ocean
Because the Antarctic ocean is well defined, has fewer species than other oceans, is less faunistically variable by longitude than by latitude and has predators which have been well studied, it is easier to obtain an overall picture of specific distribution than in other oceans. Clarke (1983) gave an estimate of cephalopod biomass as 34 million tonnes from population estimates of the main predators in the region. His estimates were as follows (in millions of tonnes):
Sperm whales Baleen whales Elephant seals Other seals All birds Total
11.8 1.8 4.5 2.6
13.5 34.2
More recent work suggests this estimate is too high.
Regarding the cetaceans, Klinowska (1991) estimated the sperm whales to number 30,000-60,000. Recalculating the cephalopod mass from these new figures, sperm whales would consume:
Minimum Maximum
30,000 x 30 x 0.033 x 122 x 0.95 = 3.44million tonnes 60,000 x 40 xO.033 x 122 x 0.95 = 9.18 million tonnes
where upper and lower figures are' given for the numbers and the mean weights. The assumed number of days in the Antarctic Ocean supposes that the numbers (of whales) are stable through the Southern Winter and that the % of the food which is cephalopod is the same as from observation (Clarke, 1980).
From 1955-65 annual catches of sperm whales averaged about 5,000 per year. These were all large males, and, as they take about 25 years to grow to that size, the 50,000 taken in the periodmust have been present throughout the 10 years or the CPUE would have plummeted. In view of that, the upper estimate for sperm whales seems more likely.
Beaked whales were not included in the above estimate because oflack of data but Kasamatsu (1991) estimated beaked whales to number 224,000-377,000 in the Antarctic, and these would consume
Minimum Maximum
224,000 x 3.7 x 0.033 x 60 x 0.95 = 1.56 million tonnes 377,000 x 3.7 x 0.033 x 122 x 0.95 = 5.34 milliontonnes
assuming a mean weight of 3.7 tonnes, a conversion factor of 0.033, 60 or 122 days in the Antarctic and 95% cephalopods.
Regarding the seals, Clarke was probably high in his estimates of the % of cephalopods in the diets of Crabeater seals (Lobodon carcinophagus, 2%), Ross seals (Ommatophoca rossii, 64%), fur seals (33%) and low for Southern elephant seals (Mirounga leonina, 75%), Weddell seals (Leptonychoetes weddellii, 11%) and leopard seals (Hydrurga leptonyx, 8%) (Klages, 1996). Boyd et at. (1994) estimated an annual consumption of squids by elephant seals at South Georgia of 2.28 million tonnes so Clarke's estimate for all the Antarctic may not be too inaccurate. Other seals might be expected to eat perhaps 1 million tonnes.
6

Regarding the sea birds, Clarke's estimate (13.54 million tonnes) was probably far too high since recent estimates suggest.oniy 0.57 million tonnes for the squid consumption of all seabirds at Prince Edward,Heard, McDonald and South Georgia Islands.
From calculations of the squid consumption per unit area of the foraging areas of birds, in three sub-antarctic areas (Croxall & Prince, 1996) over 400kg of squids per km2 were eaten (up to 833kg). The part of the Antarctic ocean, which is free of ice during summer, has an area of 10,000,000 km2 Assuming all this area is foraged by squid eating birds, 4 million tonnes would be eaten.
Taking the new estimates together, the consumption of cephalopods, mainly oceanic squids, total from:
Minimum Maximum
3.44 + 1.56 + 4.5 + 1 + 2 = 12.5 million tonnes 9.18 + 5.34 +4.5 + 1 +4 = 24.0 million tonnes
but these estimates exclude all odontocetes other than sperm whales and beaked whales, exclude baleen whales which are known to include a small amount of squid in the diet, include seals other than the elephant seal as only 1 million tonnes, and exclude any large fish which might eat cephalopods in their diet. The sperm whale population taken for the original estimate (85,000).was the estimated initial stock before whaling, which would be higher than the present stock.
The biomass of cephalopods consumed annually by the three most important predators is shown in Table 1. From the results, Mesorrychoteuthis is clearly the most important at 3.7-10.6 million tonnes. Second is Kondakovia at 0.9 -2.1 million tonnes and third are octopus at 1.8-2.7 million tonnes.
North Atlantic
The 1973 estimate of sperm whale population in the North Atlantic was 22,000 which, on assumptions used previously, would consume a total of 2.4 million tonnes of cephalopods per year:
11,000 males x 15 x 0.03 x 365= l.8 million tonnes 11,000 females x 5 x 0.03 x 3.65 = 0.6 million tonnes
Croxall and Prince (1996), based on Furness (1994), calculated that the consumption of cephalopods by sea birds in the Northeast Atlantic was 2,700g/km2 If this consumption were extended to the whole North Atlantic, the sea birds would consume 48,533,000 x 0.0027 = 0.13 million tonnes. However, the real value would probably be more since the estimated consumption of squids by birds varies greatly and can be much more in productive areas (for four areas ofthe.North Atlantic the consumption is estimated at 400,000, 63,000,21,000 and 300gm/km2).
Santos (1998) made new estimates offood consumption by sperm whales overwintering in the North Atlantic. She used population size estimates from Gunnlaugsson & Sigurj6nsson (1990) and Sigmj6nsson & Vikingsson (1992). Gunnlaugsson & Sigurj6nsson (1990) reported figures of sperm whale abundance in Iceland, Faeroe Islands and adjacent waters (north of 50"N)
7

from a survey carried out between June-July 1987 as part of the joint 1987 North Atlantic Sighting Survey (NASS-87). However, these estimates of abundance were not correctedJor the time spent underwater by the. whales. Sigurjonsson & Vikings son (1992) corrected. the estimates of the NASS-87 survey and applied the same formula for the estimates of a similar survey in 1989 (NASS-89).
The proportion by weight of a prey category in the diet was calculated pooling together all the diet data collected by Santos (1998) from sperm whales stranded in Scotland and Denmark during 1991-96. The weight of the individual sperm whales stranded in the North Sea was calculated from their lengths using a regression equation from Lockyer (1991). For each of 48 sperm whales stranded in the study period, the amount of food required per day was calculated using 3.25% of their body weight (after Sergeant, 1969 and Lockyer, 1981). A mean value for F was then obtained. The whales were assumed to spend half of the year (182.5 days) in the North Atlantic.
Assuming the stomach coritents examined were representative of the overall diet, sperm whales north of SOON could be consuming close to 1,460,000 tonnes of Gonatus. Sperm whales could take 25,000 tonnes of Haliphron atlanticus and 18,000 tonnes of Histioteuthis bonnellii. Values for the other prey species and for other areas are shown in Table 2.
Santos (1998) estimated population consumption for common dolphins off NW Spain. In the absence· of survey data for the area; common dolphin population size was estimated from population densities recorded in other surveys (Goujon et a!., 1993; Hammond et al., 1995). The weight of food eaten daily by a common dolphin was estimated as 3.5% of body weight (this value was given by Yasui & Gaskin, 1986 for harbour porpoise, Phocoena phocoena, and was used as an approximation since there were no values for common dolphins). Dolphin weight was calculated from dolphin length for each of the common dolphins stranded in the area of the study for which length was known, using the only available regression for the area (Gayoso, 1994). A mean value for daily food intake was then obtained. This is assumed to be representative of the population as a whole. Common dolphins were assumed to be present in the area 365 days a year.
If dolphin densities are similar to those in other regions, common dolphins off Galicia (subdivisions VIlle west and IXa north) could consume around 312 tonnes ofLoligo and 132 tonnes of Illex coindetii. Off the Cantabrian coast (subdivision VIlle east), common dolphins could eat around 363 tonnes and 153 tonnes of Loligo and Illex coindetii respectively (assuming dolphins from this area to have a similar diet that the Galician dolphins). Values for other ICES subdivisions and the other prey species are shown in Table 3.
Azores
In order to obtain an indication of the importance of cephalopods in the food web of Azotean waters, Clarke (1996) argued that as over 400 sperm whales were caught each year between 1935-1949, and these whales take over 14 years to reach the mean size caught of 45 feet for males and 35 feet for females, more than the number caught (5,600) must have been present over the whole period to sustain the catch. He assumed the whales averaged 40 tonnes in weight, each stayed only 2 months in Azorean waters each year and they eat 2.5% of their body weight each day. From these assumptions they would eat a minimum of:
5,600 x 40 x 0.025 x 60 = 373,000 tonnes per year.
8
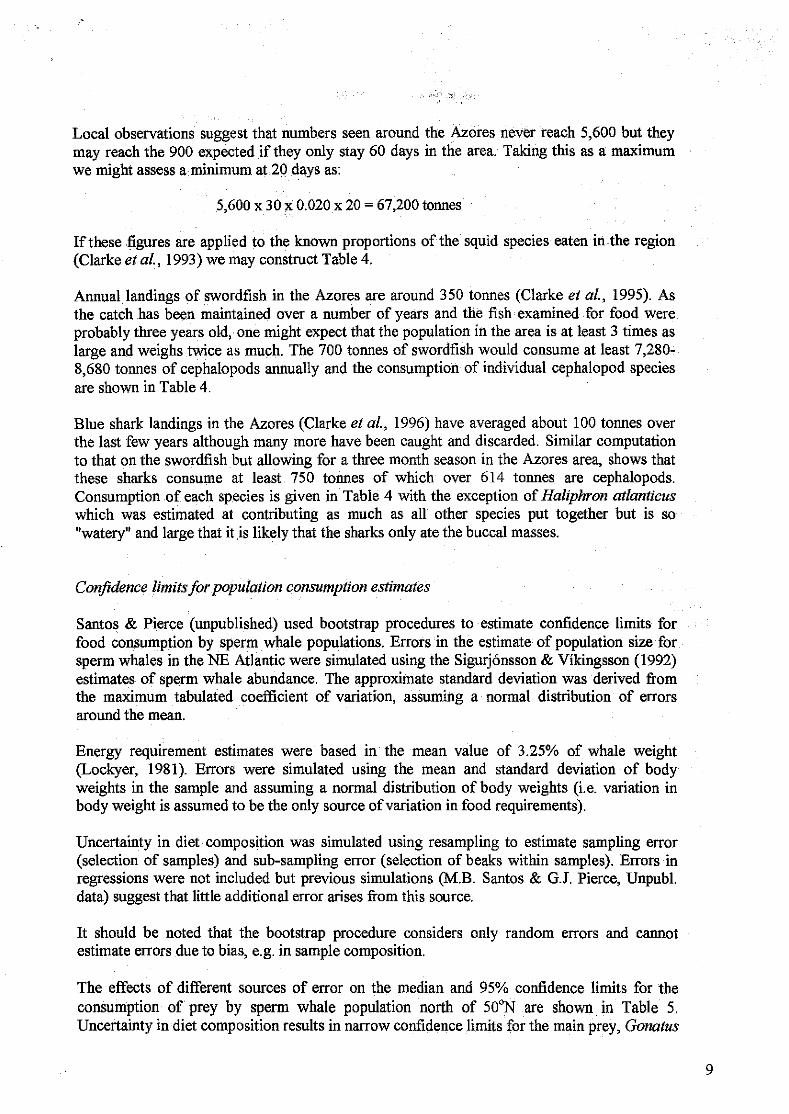
Local observations suggest that numbers seen around the Azores never reach 5,600 but they may reach the 900 expected if they only stay 60 days in the area. Taking this as a maximum we might assess a minimum at 20 days as:
5,600 x 30 x 0.020 x 20 = 67,200 tonnes
If these figures are applied to the known proportions of the squid species eaten in the region (Clarke et al., 1993) we may construct Table 4.
Annual landings of swordfish in the Azores are around 350 tonnes (Clarke et ai., 1995). As the catch has been maintained over a number of years and the fish examined for food were probably three years old, one might expect that the population in the area is at least 3 times as large and weighs twice as much. The 700 tonnes of swordfish would consume at least 7,280-8,680 tonnes of cephalopods annually and the consumption of individual cephalopod species are shown in Table 4.
Blue shark landings in the Azores (Clarke et al., 1996) have averaged about 100 tonnes over the last few years although many more have been caught and discarded. Similar computation to that on the swordfish but allowing for a three month season in the Azores area, shows that these sharks cO,nsume at least 750 tonnes of which over 614 tonnes are cephalopods. Consumption of each species is given in Table 4 with the exception of Haliphron atlanticus which was estimated at contributing as much as all other species put together but is so "watery" and large that it is likely that the sharks only ate the buccal masses.
Confidence limits for popUlation consumption estimates
Santos & Pierce (unpublished) used bootstrap procedures to estimate confidence limits for food consumption by sperm whale populations. Errors in the estimate of population size for sperm whales in the NE Atlantic were simulated using the Sigurj6nsson & Vikingsson (1992) estimates of sperm whale abundance. The approximate standard deviation was derived from the maximum tabulated coefficient of variation, assuming a normal distribution of errors around the mean.
Energy requirement estimates were based in the mean value of 3.25% of whale weight (Lockyer, 1981). Errors were simulated using the mean and standard deviation of body weights in the sample and assuming a normal distribution of body weights (i. e. variation in body weight is assumed to be the only source of variation in food requirements).
Uncertainty in diet composition was simulated using resampling to estimate sampling error (selection of samples) and sub-sampling error (selection of beaks within samples). Errors in regressions were not included but previous simulations (M.B. Santos & G.I. Pierce, Unpub\. data) suggest that little additional error arises from this source.
It should be noted that the bootstrap procedure considers only random errors and cannot estimate errors due to bias, e.g. in sample composition.
The effects of different sources of error on the median and 95% confidence limits for the consumption of prey by sperm whale population north of 50"N are shown in Table 5. Uncertainty in diet composition results in narrow confidence limits for the main prey, Gonatus
9
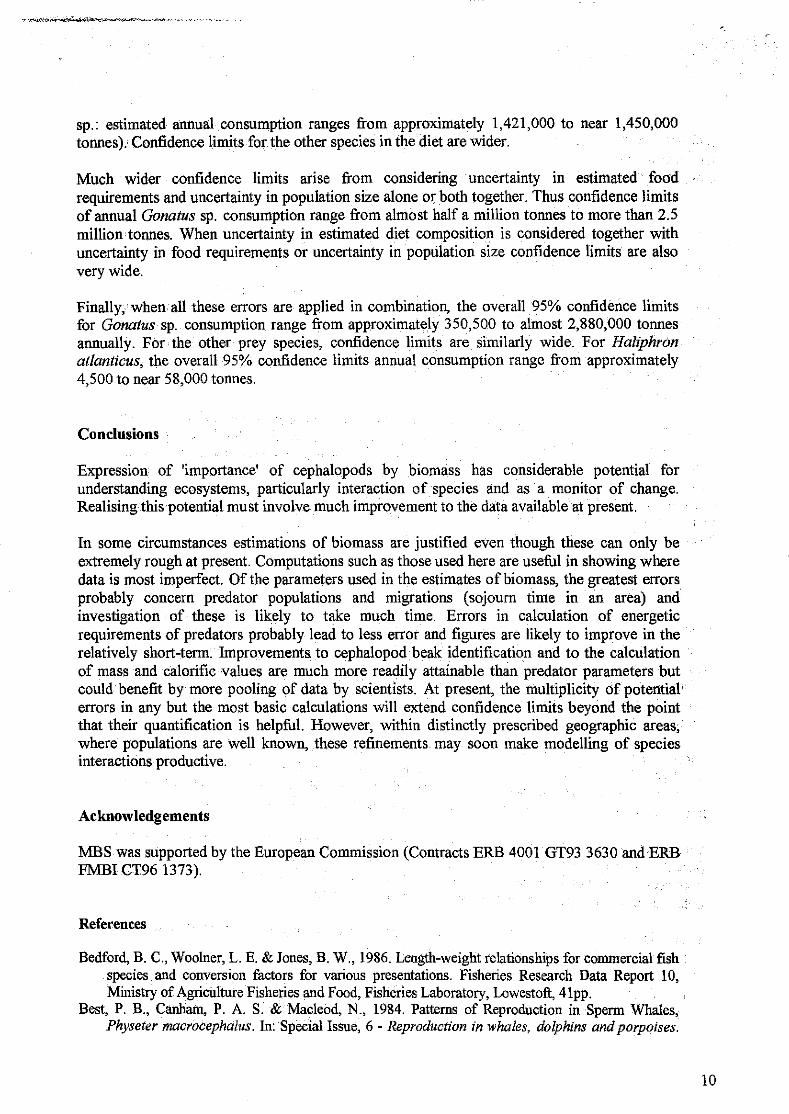
sp.: estimated annual consumption ranges from approximately 1,421,000 to near 1,450,000 tonnes).' Confidence limits for the other species in the diet are wider.
Much wider confidence limits arise from considering uncertainty in estimated food requirements and uncertainty in population size alone or both together. Thus confidence limits of annual Gonatus sp. consumption range from almost half a million tonnes to more than 2.5 million tonnes. When uncertainty in estimated diet composition is considered together with uncertainty in food requirements or uncertainty in population size confidence limits are also very wide.
Finally,' when all these errors are applied in combination, the overall 95% confidence limits for Gonatus sp. consumption range from approximately 350,500 to almost 2,880,000 tonnes annually. For the other prey species, confidence limits are similarly wide. For Haliphron at/anticus, the overall 95% confidence limits annual consumption range from approximately 4,500 to near 58,000 tonnes.
Conclusions
Expression of 'importance' of cephalopods by biomass has considerable potential for understanding ecosystems, particularly interaction of species and as a monitor of change. Realising this potential must involve much improvement to the data available at present.
In some circumstances estimations of biomass are justified even though these can only be extremely rough at present. Computations such as those used here are useful in showing where data is most imperfect. Of the parameters used in the estimates of biomass, the greatest errors probably concern predator popUlations and migrations (sojourn time in an area) and investigation of these is likely to take much time. Errors in calculation of energetic requirements of predators probably lead to less error and figures are likely to improve in the relatively short-term: Improvements to cephalopod beak identification and to the calculation of mass and calorific values are much more readily attainable than predator parameters but could benefit by more pooling of data by scientists. At present, the multiplicity of potential errors in any but the most basic calculations will extend confidence limits beyond the point that their quantification is helpful. However, within distinctly prescribed geographic areas, where populations are well known, these refinements may soon make modelling of species interactions productive.
Acknowledgements
MBSwas supported by the European Commission (Contracts ERB 4001 GT93 3630 andERB FMBl CT96 1373).
References
Bedford, B. C., Woolner, L. E. & Jones, B. W., 1986. Length-weight relationships for commercial fish species and conversion factors for various presentations. Fisheries Research Data Report 10, Ministry of Agriculture Fisheries and Food, Fisheries Laboratory, Lowestoft, 41pp.
Best, P. B., Canham, P. A. S. & Macleod, N., 1984. Patterns of Reproduction in Spenn Whales, Physeter macrocephalus. In:Special Issue, 6 - Reproduction in whales, dolphins and porpoises.
10
(Perrin, W. F., Brownell, R. L. J. & DeMaster, D. P:; edS), pp. 51-79. International Whaling Commission, Cambridge.
Boyd, I. L., Amborn, T. A.'& Fedak, M. A., 1994. Biomass and energy consumption of the South Georgia population of southern elephant seals. In: Elephant Seals: population, ecology, behaviour and physiology(Le Boef; B. J. & Laws, R. M., eds.), pp. 98-117. University of California Press, Berkley.
Clarke, M. R., 1977. Beaks, nets and numbers. Symp. Zool. Soc. Lond, 38: 89-126. Clarke, M. R., 1980. Cephalopoda in the diet of sperm whales of the southern hemisphere and their
bearing on sperm whale biology. Discovery Rep., 37: 1-324. Clarke,M.R. 1983. Cephalopod biomass - estimation from predation. Memoirs Nat. Mus. Victoria, 44:
95-107. Clarke, M. R. (ed.), 1986. A handbook for the identification of cephalopod beaks. Clarendon Press,
Oxford. 273 pp. Clarke, M. R., 1987. Cephalopod biomass - estimation from predation. In: Cephalopod lifo cycles.
Vol. 2: Comparative Reviews. (Boyle, P. R., ed.), pp. 221-238. Academic Press, London. Clarke, M.R. 1993 Age determination and common sense- a free discussion on difficulties
encountered by the author. In: Recent Advances in Cephalopod Fisheries Biology. (Okutani, T., O'Dor, R. K. & Kubodera, T., eds.), pp. 61-69. Tokai University Press, Tokyo.
Clarke, M. R., 1996. Cephalopods as prey. III. Cetaceans. Phil. Trans. R. Soc. Lond B, 351: 1067-1081.
Clarke, M. R., Clarke, D. C., Martins, H. R. & Da Silva, H. M., 1995. The diet of the swordfish (Xiphias gladius) in Azorean waters. Arquipelago. Lifo and Marine Sciences, 13A: 53-69.
Clarke, M. R., Clarke, D. C, Martins, H. R. & Da Silva, H. M., 1996. The diet of the blue shark (Prionace glauca L.) in Azorean waters. ArquipeIago, Life and Marine Sci., 14A: 41-56.
Clarke, M. R. & MacLeod, N., 1976. Cephalopod remains from sperm whales caught off Iceland. J. Mar. Bioi. Ass. UK, 56: 733-749.
Clarke, M. R., Martins, H. R. & Pascoe, P., 1993. The diet of sperm whales (Physeter macrocephalus Linnaeus 1758) off the Azores. Phil. Trans. R Soc. Lond B, 339: 67-82.
Clarke, R., Paliza,. O. & Aguayo A. L., 1988 Sperm whales of the Southeast Pacific. Part IV: Fatness, Food and Feeding. Investigations on Cetacea, 21: 53-195
Coull, K. A., Jermyn, A. S., Newton, A. W., Henderson, G. I. & Hall, W. B., 1989. Length/weight relationships for 88 species of fish encountered in the North East Atlantic. Scottish Fisheries Research Report 43, Department of Agriculture and Fisheries for Scotland. 81 pp.
Croxall, J. P. & Prince, P. A., 1996. Cephalopods as prey. I. Seabirds. Phil. Trans. R Soc. Lond B, 351: 1045-1052.
Furness, R. W. 1994. An estimate of the quantity of squid consumed by seabirds in the eastern North Atlantic and adjoining seas. Fish. Res., 21: 165-177.
Gayoso, A., 1994. Datos preliminares sobre a relacion lonxitude/peso no golfifio comim, Delphinus delphis. Eubalaena, 5: 21-24.
Goujon, M., Antoine, L., Collet, L. & Fifas, S., 1993. Approche de l'impact ecologique de la pecherie thoniere au filet maillant derivant en Atlantique nord-est. Rapport interne de la Direction des Resources Vivantes de l'IFREMER, 47 pp.
Gunnlaugsson, T. & Sigurjonsson, J., 1990. NASS-87: Estimation of whale abundance based on observations made onboard Icelandic and Faroese survey vessels. Rep. Int. Whal. Commn., 40: 571-580.
Hammond, P. S., Benke, H., Berggren, P., Borchers, D. L., Buckland, S. T., Collet, A., HeideJergensen, M. P., Heimlich-Boran, S., Hiby, A. R., Leopold, M. F. & 0ien, N., 1995. Distribution and abundance of the harbour porpoise and other small cetaceans in the North Sea and adjacent waters. Life 92-2/UK!027, 240 pp.
Hammond, P. S. & Rothery, P., 1996. Application of computer sampling in the estimation of seal diet. J. Appl. Stat., 23(5): 525-533.
Hark6nen, T. J., 1986. Guide to the otoliths of the bony fishes of the Northeast Atlantic. Danbni ApS, Hellerup. 256 pp.
Kasamatsu, F., 1991. Current occurrence of toothed whales and abundance of beaked whales in the Antarctic. IBI Rep., 2: 75-77
Klages, N. T. W., 1996. Cephalopod as prey. II. Seals. Phil. Trans. R Soc. Lond B, 351: 1053-1065.
11

Klinowska, M. M., 1991. Dolphins, porpoises and whales of the world. The IUCN Red Data Book. IUCN - The World Conservation Union, Gland, Switzerland and Cambridge, 429 pp.
Lockyer, C., 1981. Estimates of growth and energy budget for the sperm whale, Physeter catodon. FAa Fish. Ser. No 5, 3: 489-504.
Lockyer, C., 1991. Body composition of the sperm whale, Physeter catodon, with special reference to the possible function offat deposits. Rit. Fiskideilar, 12(2): 1-24.
Martin, A R. & Clarke, M. R., 1986. The diet of sperm whales (Physeter macrocephalus) captured between Iceland and Green1and. J. Mar. Bioi. Ass. u.K., 66: 779-790.
Perez-Gandaras, G., 1986. Estudios sobre los cefa16podos ibliricos: sistematica y bionomia mediante el estudio morfometrico comparado de sus mandibulas. Ph.D. thesis, Universidad Complutense de Madrid, Madrid, Spain .. 318 pp.,
Reynolds, J. & Aebischer, N. J., 1991. Comparison and quantification of carnivore diet by faecal analysis: a critique, with recommendations 'based on a study of the fox Vulpes vulpes. Mamm. Rev., 21(3): 97-122.
Santos, M.B., 1998. The feeding ecology of harbour porpoises, conunon and bottlenose dolphins and sperm whales in the Northeast Atlantic. PhD thesis, University of Aberdeen., 424 pp.
Santos, M. B., Boyle, P. R., Pierce, G. J., Wijnsma, G., Ross, H. Reid, R. J. & CiaJ:ke, M. R., 1995b. Diets of sperm whales stranded in Scotland. International Counciljor the Exploration of the Sea CM 19951N:6
Santos, M. B., Pierce, G. J., Gonz:ilez, A, LOpez, A., Barreiro, A. & Guerra, A., 1995a. Diets of small cetaceans stranded on the Galicean coast, (NW Spain). International Councilfor the Exploration of the Sea CM 19951N:ll.
Santos, M. B., Pierce, G, J., Guerra, A, LOpez, A. & Barreiro, A, 1996a. Diets Of Small Cetaceans Stranded in NW Spain 1994-95. International Council for the Exploration of the Sea C.M. 19961N:1l
Santos, M. B., Pierce, G. J., Carter, T. J., Hoskins, S., Ross, H. M., Reid, R. J. & McKenzie, c., 1996b. Stomach contents of sperm whales stranded in the North Sea. International Councilfor the Exploration of the Sea C.M. 19961N:1O
Sergeant, D. E., 1969. Feeding rates of cetacea. FiskDir. Skr. Ser. HavUnders; 15: 246-258, Sigurjonsson, J. & Vikingsson, G. A., 1992. Investigations on the ecological role of cetaceans in
Icelandic and adjacent waters. International Council for the Exploration of the Sea, CM 19921N:24.
Smale, M. J., 1996. Cephalopods as prey. IV. Fishes. Phil. Trans. R Soc. Lond. B, 351: 1083-1104. Watt, J., Pierce, G. J. & Boyle, P. R., 1997. A guide to the premaxillae and vertebrae of North Sea
fishes. Co-operative Research Report, No 220. International Council for the Exploration of the Sea.
Yasui, W. C. & Gaskin, D. E., 1986. Energy budget of a small cetacean, the harbour porpoise, Phocoena phocoena (L.). Ophelia, 25: 183-197.
12

,
Table 1. Estimation of consumption of cephalopods (millionsoftoDnes}bythree.main predators in the Antarctic. (Min = minimum, Max = maximum).
Species Kondakovia Moroteuthis Mesonychoteuthis Gonatus Other squids Octopus TOTAL Min Max Min Max Min Max Min Max Min Max Min Max Min Max
Sperm 0.62 1.65 0.14 0.37 2.65 7.07 . . 0.Q3 0.10 . . 3.44 9.19 whales .
Beaked 0.05 0.16 . . 1.05 3.58 0.02 0.10 0.25 0.90 . . 1.37 4.74 whales· .
Elephant 0.21 0.32 0.30 0.45 0.45 0.70 0.24 0.40 1.80 2.70 0.Q3 0.10 3.03 4.67 seals TOTAL 0.88 2.13 0.44 0.82 4.15 11.35 0.26 0.50 2.08 3.70 0.03 0.10 7.84 18.60 • Non Antarctic speCies excluded
Table 2. Estimated consumption of cephalopods and fish (tonnes) by the NE Atlantic sperm whale population by prey species and area.
Year Are. Haliphron Eledone Gonatus Histioteuthis fo°
ligo T euthowenia Todarodes Saithe Sum iltIantiCliS cirrhosa sv. bonnolli; orbesi mer!GlODS SG£ittatus
1987 Nof60° 5,852 63 343,328 4,308 28 1,223 1,543 1,381 356,725
Iceland 3,713 40 217,171 2,733 18 776 979 876 226,304
1989 No/50° 24,953 267 1,459,660 18,367 119 5,214 6,579 5,888 1,521,047
Nof60° 6,354 68 371,687 4,677 30 1,328 1,675 1,499 387,319
Iceland 3,009 32 176,007 2,215 14 629 793 710 183,409
Mean Nof50° 24,953 267 1,459,660 18,367 119 5,214 6,579 5,888 1,521,047
Nof60o 6,103 65 357,008 4,492 29 1,275 1,609 1,440 372,022
Iceland 3,361 36 196,589 2,474 16 702 886 793 204,856
Table 3. Estimation of consumption of main prey (tonnes) by common dolphin off Galicia (NW Spain)
Area Loligo Illex Sardine Blue Trisopterus Scad Hake SUM sp. eoindetii whitin!!, SlJP.
VIlle west + 313 132 871 2,188 444 913 172 5,033 IXanorth VIlle east 364 154 1,013 2,544 516 1,062 200 5,853
IXa central· 246 104 684 1,718 349 717 135 3,953 north
IXa central· 222 94 619 1,556 316 650 122 3,579 south
IXasouth 375 159 1,044 2,623 532 1,095 206 6,034 VIIId 713 302 1,986 4,988 1,012 2,083 393 11,477 VIlla 881 372 2,453 6,160 1,250 2,572 485 14,173 VIIIb 461 195 1,284 3,226 655 1,347 254 7,422
VIlle + IXb 2,905 1,229 8,090 20,320 4,123 8,483 1,599 46,749 TOTAL 6,480 2,741 18,044 45,323 9,197 18,922 3,566 104,273
13

Table 4. Estimation of consumption of cephalopods (tonnes) by three predators in the Azores. (Min = minimum, Max = maximum).
Species Sperm whale Swordfish Blue shark TOTAL Min MaX Min Max Min Max Min Max
Octopoteuthidae 26,692 1148,156 - - 191 1,906 26,883 150,062 Histioteuthidae 21,961 121,896 45 54 122 1,226 22,128 123176 Architeuthidae 8,131 45,133 - - - - 8131 45133 Lepidoteuthidae 3,064 17,009 - - - - 3,064 17,009 0 hidae 2,251 12,496 1866 2,225 - - 4,117 14,721 Pholidoteuthidae 1,438 7,982 1 160 1,384 - - 2,598 9,366 Cvcloteuthidae 1,250 6,938 8 10 7 71 1,265 7,019 Cranchiidae 1,142 6,341 84 100 27 271 1,253 6,712 Ancistrocheiridae .. 376 2,089 - - III 1,110 487 3,199 Alloposidae 497 2,760 40 47 - - 537 . 2807 Onychoteuthidae 249 1,380 475 566 10 95 734 2,041 Mastigoteuthidae 34 187 5 6 90 903 129 1,096 Chiroteuthidae 47 261 46 55 41 417 134 .733 Vampyroteuthidae 7 37 - - 9 85 16 122 Gonatidae - - - - 7 69 7 69 Ar~onautidae - - 40 48 1 10 41 58 Loliginidae - - 48 57 - - 48 57 Grimalditeuthidae - - 7 9 4 41 11 50 Ocythoidae - - - - 3 30 3 30 Ctenopterygidae - - - - 1 13 1 13 Ioubiniteuthidae - - - - 0.3 3 0.3 3 TOTAL 67139 372,665 3,824 4,561 624.3 6250 71,587 383,476
14
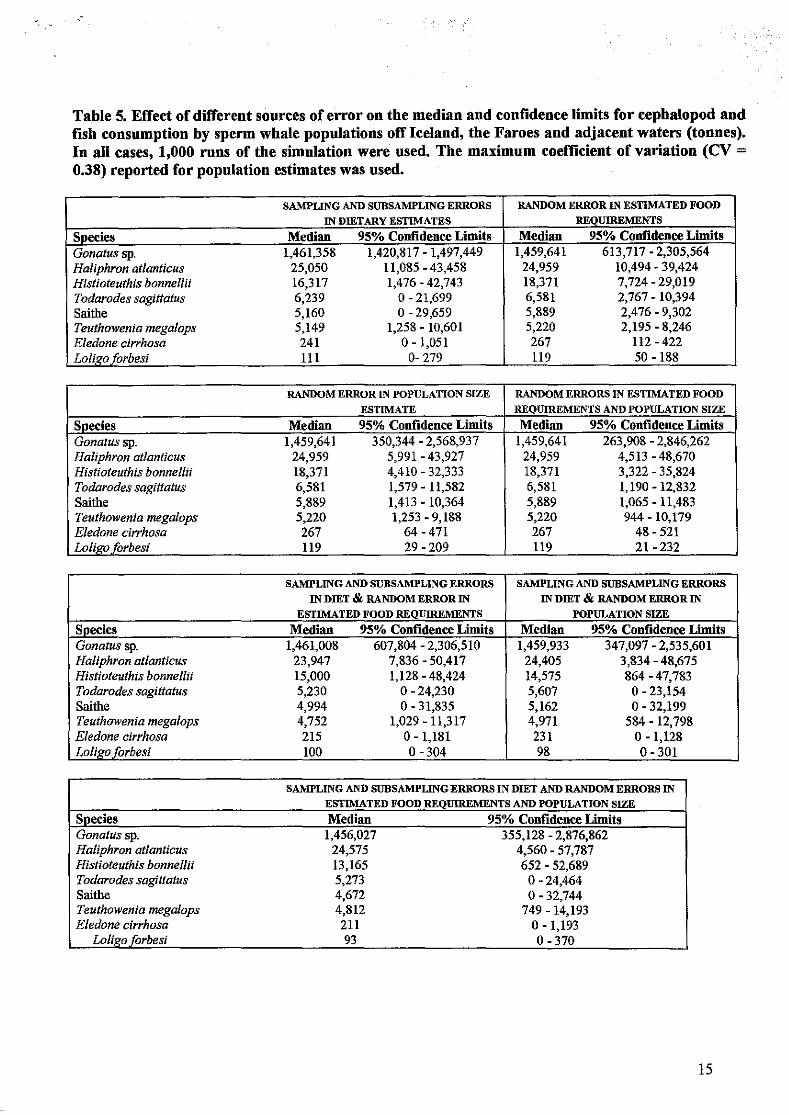
Table 5. Effect of different sources of error on the median and confidence limits for cephalopod and fish consumption by sperm whale populations off Iceland, the Faroes and adjacent waters (tonnes). In all cases, 1,000 runs of the simulation were used. The maximum coefficient of variation (CV = 0.38) reported for population estimates was used.
SAMPLING AND SUBSAMPLING ERRORS RANDOM ERROR IN ESTIMATED FOOD
IN DffiTARY ESTIMATES REQUIREMENTS
Species Median 95% Confidence Limits Median 95% Confidence Limits Gonatussp. 1,461,358 1,420,817 - 1,497,449 1,459,641 613,717 - 2,305,564 Haliphron at/anticus 25,050 11,085 - 43,458 24,959 10,494 - 39,424 Histioteuthis bonnellti 16,317 1,476 - 42,743 18,371 7,724 - 29,019 Todarodes sagittatus 6,239 0-21,699 6,581 2,767 - 10,394 Saithe 5,160 0-29,659 5,889 2,476 - 9,302 Teuthowenia megalops 5,149 1,258 - 10,601 5,220 2,195 - 8,246 E/edone cirrhosa 241 0-1,051 267 112 - 422 Lo/i~oforbesi III 0- 279 119 50 - 188
RANDOM ERROR IN POPULATION SIZE RANDOM ERRORS IN ESTIMATED FOOD
ESTIMATE REQUIREMENTS AND POPULATION SIZE
Species Median 95% Confidence Limits Median 95% Confidence Limits Gonatus sp. 1,459,641 350,344 - 2,568,937 1,459,641 263,908 - 2,846,262 Ha/iphron at/anticus 24,959 5,991 - 43,927 24,959 4,513 - 48,670 Histioteuthis bonnellii 18,371 4,410 - 32,333 18,371 3,322 - 35,824 Todarodes sagittatus 6,581 1,579 - 11,582 6,581 1,190 -12,832 Saithe 5,889 1,413 - 10,364 5,889 1,065 - 11,483 Teuthowenia mega/ops 5,220 1,253 - 9,188 5,220 944 - 10,179 E/edone cirrhosa 267 64 - 471 267 48 - 521 Loligo forbesi 119 29 - 209 119 21 - 232
SAMPLING AND SUBSAMPLING ERRORS SAMPLING AND SUBSAMPLING ERRORS
IN DffiT & RANDOM ERROR IN IN DffiT & RANDOM ERROR IN
ESTIMATED FOOD REQUIREMENTS POPULATION SIZE
Species Median 95% Confidence Limits Median 95% Confidence Limits Gonatus sp. 1,461,008 607,804 - 2,306,510 1,459,933 347,097 - 2,535,601 Ha/iphron at/anticus 23,947 7,836 - 50,417 24,405 3,834 - 48,675 Histioteuthis bonnellti 15,000 1,128 - 48,424 14,575 864 -47,783 Todarodes sagittatus 5,230 0-24,230 5,607 0-23,154 Saithe 4,994 0-31,835 5,162 0-32,199 Teuthowenia mega/ops 4,752 1,029 - 11,317 4,971 584 -12,798 E/edone cirrhosa 215 0-1,181 231 o -1,128 Lo/igo forbesi 100 0-304 98 0-301
SAMPLING AND SUBSAMPLING ERRORS IN DIET AND RANDOM ERRORS IN
ESTIMATED FOOD REQUIREMENTS AND POPULATION SIZE
Sp~cies Median 95% Confidence Limits Gonatus sp. 1,456,027 355,128 - 2,876,862 Ha/iphron at/anticus 24,575 4,560 - 57,787 Histioteuthis bonnellii 13,165 652 - 52,689 Todarodes sagittatus 5,273 0-24,464 Saithe 4,672 0-32,744 Teuthowenia mega/ops 4,812 749 - 14,193 E/edone cirrhosa 211 0-1,193
Lo/igo forbesi 93 0-370
15

-"-"-"~"---"--"----"-------------------------