The Impacts of Self-Help Group Programs: …epu/acegd2014/papers/JunGoto.pdf1 The Impacts of...
16
1 The Impacts of Self-Help Group Programs: Experimental and Survey Evidence from South India Jun Goto 1 Hitotsubashi University (Preliminary Results) August, 2014 Abstract This study aims to provide empirical evidence of the economic and social impacts of access to microloans disbursed thorough self-help group (SHG) programs. For this purpose, primary data were collected from households in Kerala, South India, and combined with detailed financial transactions of SHG members and information collected through laboratory experiments. The estimation results show that wealthier group members are significantly more likely to reap economic benefits, probably from productive investments. For poor members, asset accumulation and consumption smoothing are the two main pathways out of poverty through SHG-modeled microfinance initiatives. Finally, I find that reciprocal cooperation and trust among group members are developed by repeated social interactions, which are facilitated by weekly meetings of SHGs. Keywords: microfinance, impact evaluation, self-help group, social capital, pipeline approach, laboratory experiment JEL O12, D03, C93 1 Address; 2-1 Naka, Kunitachi, Tokyo, Japan. 186-8603. Email; [email protected]. Phone; +81-42-580-8346
Transcript of The Impacts of Self-Help Group Programs: …epu/acegd2014/papers/JunGoto.pdf1 The Impacts of...

1
The Impacts of Self-Help Group Programs:
Experimental and Survey Evidence from South India
Jun Goto1
Hitotsubashi University
(Preliminary Results)
August, 2014
Abstract
This study aims to provide empirical evidence of the economic and social impacts of
access to microloans disbursed thorough self-help group (SHG) programs. For this
purpose, primary data were collected from households in Kerala, South India, and
combined with detailed financial transactions of SHG members and information
collected through laboratory experiments. The estimation results show that wealthier
group members are significantly more likely to reap economic benefits, probably from
productive investments. For poor members, asset accumulation and consumption
smoothing are the two main pathways out of poverty through SHG-modeled
microfinance initiatives. Finally, I find that reciprocal cooperation and trust among
group members are developed by repeated social interactions, which are facilitated by
weekly meetings of SHGs.
Keywords: microfinance, impact evaluation, self-help group, social capital, pipeline
approach, laboratory experiment
JEL O12, D03, C93
1 Address; 2-1 Naka, Kunitachi, Tokyo, Japan. 186-8603. Email;
[email protected]. Phone; +81-42-580-8346

2
1. Introduction
Microfinance is the provision of financial services such as loans, insurance, and
fund transfers to the poor, who do not have access to banking services owing to the high
transaction costs and asymmetric information problems associated with the provision of
these services. It is of particular importance in developing countries as it could help to
generate income through self-employment and create social capital.
In India, microfinance became increasingly important after the government launched
a massive microfinance program in 1992 with the objective of connecting
community-based financial groups, or self-help groups (SHGs), to the existing banking
network in order to deliver financial services to the poor. Since the inception of this
program, interest in the multifaceted impact of SHGs on households’ livelihoods has
been considerable, to the point that a large number of programs in developing countries
have begun to follow the Indian model. However, rigorous evidence on whether the
SHG program provides economic benefits and fosters the creation of social capital at
the local level is virtually non-existent2.
The present study aims to provide empirical evidence on the economic and social
impacts of the access to microloans through the SHG program using primary data
collected in Kerala, South India, in 2008. Specifically, it describes not only the direct
economic effects but also the spillover effects on participants who do not borrow
microloans. In addition, it focuses on the extent to which these types of
community-based financial services contribute to creating social capital among
participants through daily interaction and/or collaborative works.
It is worth noting that this study has two advantages. First, the data set is rich and
original because it was collected through three distinct sources: a questionnaire survey
on household characteristics, including social network information in a village; personal
financial diaries recorded by SHG members, which included details of weekly financial
transactions of each SHG; and laboratory experiments targeting program participants in
order to measure social capital. The second advantage is related to the estimation
strategy used in this study, which overcomes both sample selection bias and
replacement bias. I could employ the pipeline approach developed by Coleman (1999)
to identify the causal relationship between access to microfinance programs and the
well-being of participants, as this was a targeted SHG program with simultaneous
recruitment of participants executed in a single village. This methodological framework
2 Recently, an experimental approach known as randomized controlled trial was adopted in microfinance
programs, although not in the SHG program (Banerjee et al. 2009, Karlan and Zinman 2009). Since there
is no consensus with regard to the positive and significant impacts of microfinance, further rigorous
studies—including ones adopting nonexperimental approaches—are needed.
3
enables us to measure the program impacts accurately.
2. Literature Review
Since the 2000s, a number of empirical studies applying the pipeline approach have
been published (e.g., Barnes, Gaile, and Kibombo 2001, Dunn and Arbuckle 2001, and
Mosley 2001). These studies have generally found positive and significant impacts of
microfinance on economic benefits, and subsequently, the welfare levels of program
participants3. Focusing on the SHG program in India, Swain and Varghese (2009, 2011)
also employed the pipeline approach and found positive impacts on asset accumulation,
and increases in livestock income and salaries of program participants; surprisingly,
they found a negative impact on total income4.
The difficulty in reaching a consensus on whether microfinance has economic
benefits may stem from the existence of heterogeneous impacts among borrowers.
Coleman (2006) explicitly considers this difference in creditworthiness among
participants and finds that microfinance has little impact because loans are
disproportionately obtained by wealthier participants. Furthermore, Pitt and Khandker
(1998) describe the possible existence of spillover effects from villages included in the
microfinance initiative to control villages. Although this sort of externality was
subsequently confirmed by the findings of Khandker (2005), the spillover pathway
between participants who have access to loans and those who do not has not been found
using microdata.
In terms of the social impact of microfinance, some authors have shed light on its
potential to create social capital and facilitate female empowerment through
microfinance programs (Garikipati 2008, Rai and Ravi 2011, Swain and Wallentin
2009). Supported by economic theory (e.g., Kreps et al. 1982), an abundance of
microfinance approaches—including SHG programs—have clearly stated that
community-based financial programs are expected to promote social interactions among
group members who live in the same community; this, in turn, brings significant
monetary and nonmonetary returns in comparison to regular interaction. To the best of
my knowledge, Feigenberg et al. (2010), who provide the first and only rigorous
evidence in this regard, employ an experimental approach and show that simply
encouraging people to interact more often actually increases economic cooperation
among microfinance participants. In addition, the cooperative norm improves informal
3 Duvendack et al. (2011) and Kono and Takahashi (2010) provide comprehensive surveys for the
methodology of impact evaluation and empirical results of affluent cases of microfinance. 4 Deininger and Liu (2009) collected original data in Andhra Pradesh. They concluded that there is a
positive impact on female empowerment and found increases in consumption and nutritional intake in
program areas. Interestingly, their econometric results revealed few impacts on household income.

4
risk sharing and reduces microloan defaults.
In sum, despite increasing attempts to evaluate microfinance programs, the
economic and social impacts of microfinance and poverty reduction mechanisms
through microfinance are yet to be clearly established and remain controversial.
3. Survey Design
3.1 Research Setting
Generally speaking, SHG-based microfinance, which falls under the category of
village banking, extends the solidarity-type model to 10–20 (primarily female) members.
Such a microfinance program follows a group-lending methodology with joint liability
clauses inserted into credit transactions and compulsory saving systems. The following
paragraphs in this subsection elaborate the financial scheme of the SHG-based
microfinance model in the village that I surveyed, which is a part of the ward located in
a northern district or Wayanad in Kerala5. The survey targets the 220 individuals who
participate in the SHG program6.
Figure 1 Process of the activity and loan availability in an SHG
Figure 1 shows the process of the activity and loan availability of the program in the
form of a timeline. Here, the formation process and the conditions of loan availability
are the most important institutional features since they relate to the identification
strategy and the interpretation of econometric results. Therefore, I will first explain how
5 The SHG-based microfinance program that I surveyed is run by the Government of Kerala with the
active support of the Government of India and the National Bank for Agriculture and Rural Development
(NABARD) to eradicate absolute poverty in Kerala. This program, called Kudumbashree, was started in
1998. The State Poverty Eradication Mission, an autonomous body in the State, implements the program
through local self-governments (gram panchayats), formed and empowered in 1992 by the 73rd and 74th
constitutional amendments (Kadiyala 2004, p.4). 6 Note that this survey encompasses all people who live in a part of this ward and participate in the SHG
program.
ZERO TO TWELVE MONTHS
Starting with a small amount of savings
External loans
become available
SIX TO TEN MONTHS
Internal loans
become available
First meeting
(finalization of
group members)
Decision
to join
Training on financial discipline

5
villagers were organized into SHGs. Second, the conditions for accessing microloans
are listed.
Initially, microfinance program coordinators, who are hired by the local
self-government, visit the targeted village and prepare a list of potential members for
each SHG with the support of local NGOs. Note that, in this procedure, they are not
supposed to use eligibility criteria adopted in other microfinance programs, such as a
threshold of income or land holdings. Alternatively, they identify candidates for each
SHG so as to minimize the geographical distance between each other. This is because
one of the priorities of the program is to facilitate social interaction through weekly
meetings held in one of the members’ houses. Thus, the program is open to all villagers,
and all they need do is to decide whether to participate in the program with given
partners. This recruitment procedure is executed at almost the same time for all those
who live in the targeted village. In sum, the program is characterized by simultaneous
recruitment in the village, and members are not allowed to select their partners since
they are supposed to be organized into each SHG based on geographical proximity7.
With regard to microloan transactions, SHG members have access to two types of
loans: internal and external. The process of obtaining internal and external loans is
described below.
It should be emphasized that credit is not instantly extended to SHG members. First,
established SHGs must agree on weekly meeting schedules and determine other group
rules such as minimum contributions per member at each meeting8. Then, the groups
must build credit records by first saving small amounts. In addition, all group members
are obliged to receive financial training before internal loans are provided from
members’ savings accounts. Owing to the shortage of program coordinators and poor
facilities in the sampled area, these mandatory training sessions were randomly assigned
to newly formed SHGs to avoid conflicts among SHGs. Consequently, some SHGs were
forced to wait, without prior notification, for access to internal loans. Once savings
cross a certain threshold and program-mandated training sessions are completed, groups
are qualified to offer internal loans to their members. Thereafter, it takes approximately
another six to ten months for SHGs to gain access to external loans disbursed by formal
banks. I exploit this time lag and select SHG members who have not yet received their
external loans to be part of a control group (Swain and Varghese 2009, 2011).
External loans can be given for up to four times the savings amount. Banks disburse
loans under the name of the group rather than the individual member; thus, the group 7 In my target area, there are no dropouts from the list prepared by program coordinators.
8 In the study area, the minimum contribution at each meeting usually ranged from Rs.10 to 50 per
member.

6
decides how to manage and allocate those resources. As savings increase through the
group operation, the group can access higher amounts of loans9.
3.2 Experimental Design
The data used for the empirical analysis in this study were collected by the author in
200810
. The household survey was conducted using a questionnaire, and laboratory
experiments were used to construct a cross-sectional data set11
.
I conducted three types of laboratory experiments in order to determine each
participant’s social preference parameters: public goods game, dictator game, and trust
game12
. According to the interpretation of standard experimental games typically used
to measure social preferences, contribution to the public goods game reflects
reciprocated expected cooperation, sending amounts in the dictator game reflects
altruism, and sending amounts in the trust game as the first mover reflects the degree of
trust (Camerer and Fehr, 2004; Levitt and List, 2007).
First, I conducted a simple public goods game. In this setting, SHG members were
allocated to anonymous groups that comprised four members; members remained in the
same group for the entire experiment. At the beginning of the first round, each player
was given an envelope containing 10 coins amounting to Rs.100; each player was asked
to specify a number of coins, if any, for contribution to the group project and keep the
residual amount. The total group contribution was doubled and redistributed evenly
among all four members. In the process of this experiment, I carefully controlled the
so-called “anonymous” settings. In the first control condition, the games were
conducted in a perfectly anonymous setting—members were notified that their partners
would be selected from both outside and within their SHGs or the same village. I
defined the social preferences extracted from this game as the nature of each participant.
In the second control condition, members played the games in a quasi-anonymous
9 The SHG program provides, in addition to microloans, two types of subsidy: a matching grant and a
revolving fund. The latter is further classified into two types of funds, one for group members and the
other for borrowers. The matching grant is provided when the group composition is finalized. Amounting
to Rs.5,000, the total grant is supposed to be equally divided among members. The revolving fund,
totaling Rs.10,000 for a single SHG, is disbursed to group members as an internal loanable fund after
completion of financial training. The revolving fund for borrowers is granted for persons who borrow
external loans for the first time and the amount is 10% of loans (with a ceiling of Rs.25,000). Note that all
participants are assured access to these grants and funds, although the time of access may differ among
them. 10
Note that information from laboratory experiments was obtained in 2011. 11
Following the taxonomy suggested by Harrison and List (2004), we could term the laboratory
experiments artefactual field experiments. 12
In addition, we conducted a risk investment game to capture individuals’ risk attitude, as in Schechter
(2007). Although risk preference would not be included in social capital, we should have grasped this
preference to put it in the econometric specification as an independent variable to control the effect of risk
aversion that might come up in the trust game, as shown by Schechter (2007).

7
condition in which partners of an experiment were selected only from among members
of the same SHG. Thus, here, the amount of sending money reflected the reciprocal
cooperation within groups. I continued this contribution stage for four rounds in both
control conditions.
Second, in the dictator game using the strategy method, which is similar to the
public goods game, each player was given an envelope containing 10 coins amounting
to Rs.100 and was asked to decide how many coins to place into his/her partner’s
envelope. Employing the strategy method, the respondent’s partner could be somebody
in the same village and two identified persons in the same SHG. The sending amount
decided in the former (latter) partner case is defined as the nature (identified) of
altruism.
Finally, I used a two-player trust game using the strategy method—as in the dictator
game where individuals played the roles of both investor or sender and trustee or
receiver. The structure of the game is similar to that given in Burks et al. (2003) and
Bouma et al. (2008); however, the participants of this experiment were SHG members,
rather than students and Indian farmers. Again, the strategy method allowed us to define
both the nature and the identified trust.
Descriptive statistics for the results of the questionnaire survey and laboratory
experiments are shown in Table A1.1 and Table A1.2, respectively, in Appendix 1.
4. Estimation Strategy
Although seemingly straightforward, assessing the impact of SHGs may be affected
by the presence of selection bias because of unobserved variables, since the decision to
participate in SHGs depends on the same factors that determine impact. At a broader
level, bias can arise because policymakers tend to introduce programs into targeted
areas, leading to nonrandom program placement. The fact that the selected treatment
areas are chosen first means that they are likely to have different characteristics to those
of areas chosen subsequently.
A design feature of the SHGs that I targeted provides us with the necessary variables
to perform a quasi-experiment on the availability of internal and external loans. Note
that I selected treatment and control groups from a single village where simultaneous
recruitment was strictly conducted. Fortunately, as mentioned above, newly formed
SHGs are randomly forced to wait to receive the necessary financial training before
obtaining access to internal loans. Additionally, after beginning the internal loan
transaction, there is another waiting period of six to ten months to obtain permission to
receive external loans from the bank. Thus, while preceding SHGs have already begun
to invest their external loans, lagging SHGs are restricted to receiving internal loans of

8
relatively small amounts. In other words, even though they simultaneously decided to
join the SHG program, the order of turning to financial transactions was exogenously
executed by the program coordinator. Bearing in mind the outlined identification
strategies, I estimate the following regression:
𝑌𝑖𝑠 = 𝑎 + 𝛼𝑋𝑖𝑠 + 𝛽𝑆𝑠 + 𝛾𝑆𝐻𝐺𝑀𝑂𝑁𝑖𝑠 + 𝛿𝑁𝐸𝑇𝑊𝑖𝑠 × 𝐷𝐸𝑀𝐴𝑖𝑠 + 휀𝑖𝑠, (1)
where 𝑌𝑖𝑠 is the economic outcome for household i in SHG s, 𝑋𝑖𝑠 is a vector of the
household characteristics, and 𝑆𝑠 is SHG’s characteristics. The parameter of interest is
𝛾, which is the causal treatment effect where SHGMON is the number of months since
the first external loan was disbursed to members. I hypothesize that SHGMON is
exogenous to the households. Because there may be household-wide spillover effects
from microloan borrowers to other members, I explicitly control for these effects by
restricting the ranges of their social networks in the above specification as NETW
multiplied by DEMA. NETW is defined as the number of partners with whom one has
personal experience of availing interest-free informal credit and/or gift exchange in the
village, and DEMA is the total amount of microloans borrowed by other villagers in the
same network. Without including these variables, the spillover effects would create an
estimation bias in which the coefficient for SHGMON would be underestimated. In
other words, this study hypothesizes that the effect of external loans or profits from
productive investments can trickle down through informal credit transactions and/or gift
exchanges in a social network. I also estimate the following regression:
𝐸𝑋𝑃𝐸𝑅𝑖𝑠 = 𝑐 + 𝜇𝑋𝑖𝑠 + 𝜋𝑆𝑠 + 𝜌𝑆𝐻𝐺𝑀𝑂𝑁𝑖𝑠 + 𝜎𝐷𝐸𝐹𝑖𝑠 + 휀𝑖𝑠, (2)
where EXPER represents the results of laboratory experiments that indicate social
preferences of participants. In addition, I include the variable DEF, which represents the
number of days borrowers in the same group postponed the stipulated deadline for their
loans. I construct this variable on the basis of personal and group financial diaries.
5. Estimation Results
Table 1 provides the regression results for the equations given in section 4 for the
various economic outcomes in different specifications. In the first column, I employ a
gross income specification. The second column uses the same gross income
specification but only includes earnings from agricultural activities. The third and fourth
columns use food expenditure as economic outcomes, but the latter only focuses on
expenditure during a non-harvesting season in which households tend to be susceptible
to a decrease in agricultural income. Finally, the fifth to last columns explore the impact
on non-food expenditure and asset accumulation.
9
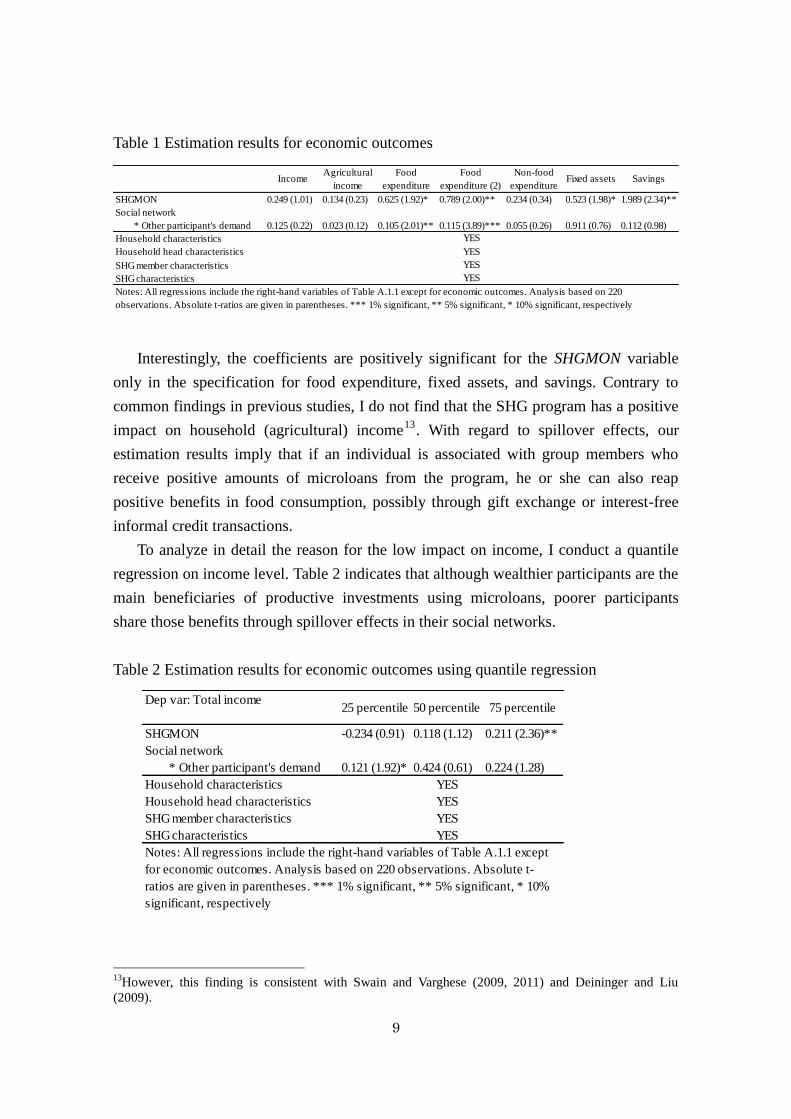
Table 1 Estimation results for economic outcomes
Interestingly, the coefficients are positively significant for the SHGMON variable
only in the specification for food expenditure, fixed assets, and savings. Contrary to
common findings in previous studies, I do not find that the SHG program has a positive
impact on household (agricultural) income13
. With regard to spillover effects, our
estimation results imply that if an individual is associated with group members who
receive positive amounts of microloans from the program, he or she can also reap
positive benefits in food consumption, possibly through gift exchange or interest-free
informal credit transactions.
To analyze in detail the reason for the low impact on income, I conduct a quantile
regression on income level. Table 2 indicates that although wealthier participants are the
main beneficiaries of productive investments using microloans, poorer participants
share those benefits through spillover effects in their social networks.
Table 2 Estimation results for economic outcomes using quantile regression
13
However, this finding is consistent with Swain and Varghese (2009, 2011) and Deininger and Liu
(2009).
SHGMON 0.249 (1.01) 0.134 (0.23) 0.625 (1.92)* 0.789 (2.00)** 0.234 (0.34) 0.523 (1.98)* 1.989 (2.34)**
Social network
* Other participant's demand 0.125 (0.22) 0.023 (0.12) 0.105 (2.01)** 0.115 (3.89)*** 0.055 (0.26) 0.911 (0.76) 0.112 (0.98)
Household characteristics
Household head characteristics
SHG member characteristics
SHG characteristics
YES
YES
YES
Food
expenditure (2)Savings
Food
expenditure
Non-food
expenditureIncome Fixed assets
Notes: All regressions include the right-hand variables of Table A.1.1 except for economic outcomes. Analysis based on 220
observations. Absolute t-ratios are given in parentheses. *** 1% significant, ** 5% significant, * 10% significant, respectively
Agricultural
income
YES
Dep var: Total income
SHGMON -0.234 (0.91) 0.118 (1.12) 0.211 (2.36)**
Social network
* Other participant's demand 0.121 (1.92)* 0.424 (0.61) 0.224 (1.28)
Household characteristics YES
Household head characteristics YES
SHG member characteristics YES
SHG characteristics YES
Notes: All regressions include the right-hand variables of Table A.1.1 except
for economic outcomes. Analysis based on 220 observations. Absolute t-
ratios are given in parentheses. *** 1% significant, ** 5% significant, * 10%
significant, respectively
25 percentile 50 percentile 75 percentile

10
Table 3 provides evidence of the social impact of the SHG program. The
coefficients for trust and reciprocal cooperation among SHG members are positively
correlated with the SHGMON variable. Combined with the fact that the coefficient for
altruism among SHG members is not statistically significant, repeated social
interactions in an SHG promote the creation of social capital on the basis of reciprocity
and dyadic trust, while sacrificing altruistic preferences. It must be emphasized that
altruism among group members is particularly susceptible to the sharking behavior of
other group members, such as defaulters. Coefficients in terms of social preferences
defined as the nature of participants are not influenced by the activities of or social
interaction within SHGs.
Table 3 Estimation results for social outcomes
6. Conclusion
This study evaluated the economic and social impacts of SHG-based microfinance
initiatives in Kerala, South India. Comparing these impacts on current and future
self-selected borrowers, I found that longer SHG-membership durations since external
loans have become available positively influence food expenditure, particularly by
buffering its inherent seasonal volatility. Although I found no impact on total current
income for poor group members, the estimation results from the quantile regression
showed that wealthier members are significantly more likely to reap economic benefits
that might stem from productive investments. I also found that there exist spillover
effects of microloans on food expenditure from actual borrowers of microloans to other
members of SHGs, which can possibly be realized through a risk-sharing network
comprising informal credit and gift exchange in a village. Therefore, taken together, for
poor participants, asset accumulation and consumption smoothing driven by not only
microloans but also the risk-sharing network in a village are the main pathways out of
poverty through SHG-based microfinance initiatives. Most previous studies evaluating
SHGMON 1.661 (1.61)* 0.717 (0.21) 0.101 (2.21)** -0.191 (0.44) -0.234 (1.54) 0.051 (0.79)
Default experience in a group -0.473 (1.01) -0.233 (0.55) -0.002 (1.88)* -0.178 (1.02) -5.43 (2.36)** -0.123 (0.99)
Household characteristics
Household head characteristics
SHG member characteristics
SHG characteristics
YES
YES
Trust
(identified)
Trust
(nature)
Cooperation
(identified)
Cooperation
(nature)
Altruism
(identified)
Notes: All regressions include the right-hand variables of Table A.1.1. In addition, NETW and DEMA are also included.
Analysis based on 220 observations. Absolute t-ratios are given in parentheses.
*** 1% significant, ** 5% significant, * 10% significant, respectively
Altruism
(nature)
YES
YES

11
the impact of similar microfinance programs do not highlight this fact14
.
Furthermore, as measured in our laboratory experiments, repeated social interactions
have a positive impact on trust and reciprocal cooperation. However, interestingly,
altruistic behavior tends to be crowded out from this process of creating social capital. It
is worth noting that this estimation result is the first evidence to specify which type of
social capital can be created by a microfinance program, which, in turn, implies that
social preferences can endogenously change through social interactions.
Appendix 1: Descriptive Statistics
Table A1.1 presents summary data on characteristics of household, household head,
SHG member, SHG, and financial transaction, collected by a questionnaire survey.
Variables on economic outcomes are used as dependent variables for specification (1).
Other variables listed in Table A1.1 are included in specification (1) as independent
variables, as well as SHGMON. Table A1.2 shows the results of laboratory experiments.
Panel A reports the results of the public goods game. Average contributions in perfectly
anonymous and quasi-anonymous conditions are used in specification (2) as the innate
and the identified cooperation, respectively. Average sending amount to the two
identified persons in dictator game and trust game are defined as the identified altruism
and trust. Sending amount to somebody in the same village in dictator game and trust
game are interpreted as innate social preferences. Finally, invested amounts in risk game
measure risk preference and I put it in the right-hand side of specification (2). Again,
variables in Table A1.1 including economic outcomes are used as independent variables
in specification (2).
14
Only Deininger and Liu (2009) and Swain and Varghese (2009, 2011) highlight this fact. In line with
their results, my estimation results confirm that this alternative pathway out of poverty is likely to be
suitable for Kerala as well.

12
Table A.1.1 List of variables
Variables Obs Mean Std. Dev Min Max
Economic Outcomes
Total income (Rs.) 220 35,147.50 18,951.48 3,680.00 103,000.00
Agricultural income (Rs.) 220 9,648.50 11,002.19 1,000.00 75,000.00
Food expenditure (Rs.) 220 274.18 281.45 84.74 929.05
Food expenditure (2) (Rs.) 220 141.27 102.12 54.22 341.14
Non-food expenditure (Rs.) 220 311.23 274.81 63.08 1,029.14
Total Fixed assets (Rs.) 220 10,632.24 10,837.71 1,284.00 39,812.31
Total Savings (Rs.) 220 5,699.09 6,389.22 0.00 100,000.00
Landholdings (100m2) 220 69.27 81.63 0.00 410.00
Government transfer (Rs.) 220 189.64 676.17 0.00 5,500.00
No. of family labor (age 16-59) 220 2.99 1.18 0.00 7.00
No. of family member 220 4.03 1.20 1.00 9.00
Characteristics of Household head
Educational attainment 220 2.66 1.15 1.00 5.00
Age 220 45.19 10.66 24.00 78.00
Dummy for female household head 220 0.17 0.38 0.00 1.00
Characteristics of a SHG member
Age 220 40.16 9.91 18.00 70.00
Educational attainment 220 3.62 1.02 1.00 5.00
Residential year 220 32.57 10.85 3.00 58.00
Dummy for experience of emigrant 220 0.04 0.19 0.00 1.00
Private transfer within village (Rs) 220 1,136.36 4,635.53 0.00 30,000.00
Characterisitics of SHG
Social homogeneity 220 0.54 0.19 0.25 1.00
Total number of participants 220 12.59 2.23 9.00 17.00
Financial transaction
Dummy for potential demand for loans 220 0.93 0.51 0.00 1.00
Dummy for credit constraint 220 0.80 0.40 0.00 1.00
Friends, relatives (Rs.) 220 342.73 907.95 0.00 7,800.00
Money lender (Rs.) 220 315.91 1,999.19 0.00 19,000.00
SHG (Rs.) 220 10,737.05 15,773.73 0.00 72,500.00
Credit cooperatives (Rs.) 220 3,363.64 15,688.01 0.00 175,000.00
Commercial bank (Rs.) 220 3,643.18 22,516.89 0.00 250,000.00
Government Bank (Rs.) 220 2,900.00 13,461.22 0.00 150,000.00
Total loans (Rs.) 220 22,262.27 37,995.45 0.00 365,000.00
SHGMON (month) 220 44.51 18.59 0.00 72.00
Default experience of SHG loans: DEF (days) 220 2.89 6.33 0.00 35.00
Social network: NETW (No. of persons) 220 6.21 4.19 0.00 12.00
Total amounts of microloans in NETW : DEMA (Rs.) 220 10,871.34 12,094.46 0.00 23,781.44
Characteristics of Household
Notes: Food expenditure, food expenditure (2), and non-food expenditure are defined as monthly per capita consumer expenditure (MPCE),
MPCE only during a non-harvesting season, and MPCE only for non-food goods. These definitions follow the ones adopted in an all-
India sample survey of households consumer expenditure conducted by NSS.

13
Table A.1.2 Results of laboratory experiments
Appendix 2: Relevance of the Pipeline Approach
As described in section 4, our approach to overcoming selection bias was to
hypothesize that current borrowers of external loans and future self-selected SHG
members have similar “unobservables” because of their seemingly random assignments.
Although it is notoriously difficult to prove this assumption because of the nature of
unobservables, one critical check for random assignment might be important to support
our assumption. Thus, I employ a logit model to estimate whether there is a substantial
difference between current borrowers and future self-selected borrowers15
. The
estimation results in Table A.2 show that a dummy variable for SHGs that have access
to external loans is not systematically determined by a participant’s or the SHG’s
observed characteristics. This implies that policymakers do not seem to prefer
expanding the qualification criteria for loan transactions for a certain SHG or individual.
15
A similar estimation strategy is employed in Swain and Varghese (2011).
Variables Obs Mean Std.Dev. Min Max
Panel A: Public Goods Game
Perfectly anonymous condition
Contribution in 1st round 220 44.54 30.71 0 100
Contribution in 2nd round 220 43.87 32.05 0 100
Contribution in 3rd round 220 41.49 35.31 0 100
Contribution in 4th round 220 39.66 38.38 0 100
Average contribution 220 42.39 28.83 13.42 93.99
Quasi-anonymous condition
Contribution in 1st round 220 48.46 31.17 0 100
Contribution in 2nd round 220 47.13 32.28 0 100
Contribution in 3rd round 220 50.44 36.34 0 100
Contribution in 4th round 220 51.39 39.08 0 100
Average contribution 220 49.36 30.23 21.59 94.54
Panel B: Dictator Game
Sending amount to the identified person 440 31.81 19.24 0 100
Sending amount to somebody in the same village 220 29.15 20.77 10 90
Panel C: Trust Game
Sending amount to the identified person 440 61.19 23.51 10 100
Sending amount to somebody in the same village 220 54.04 24.70 10 80
Panel D: Risk Game
Invested amount 220 25.11 19.00 0 100
Note: Perfectly anonymous condition in Public Goods Game was played by the half of participants at the first time, while
the other half of participants was assigned to quasi-anonymous condition. After four rounds in a certain condition, the
former (the latter) was assigned to quasi-anonymous (perfectly anonymous) condition. We did not notify there were two
conditions in Public Goods Game beforehand; they could only understand how many times they would play in a certain
condition and who the player was at the time before the first contribution.

14
Table A.2 Estimation result for the logit model
References
Armendariz de Aghion, B. & Morduch, J. (2005). The Economics of Microfinance,
Cambridge, MA: MIT Press.
Banerjee, A., Duflo, E., Glennerster, R. & Kinnan, C. (2010). The Miracle of
Microfinance? Evidence from a Randomized Evaluation, mimeo
Barnes, C., Gaile, G., & Kibombo, R. (2001). The impact of three microfinance
programs in Uganda. AIMS paper. Washington, DC: Management Systems
International.
Bouma, J., Bulte, E., & Van Soest, D. (2008). Trust and cooperation: Social capital and
community resource management. Journal of Environmental Economics and
Coefficient z-value
Landholdings (100m2) -1.4312 -0.6345
Government transfer (Rs.) 0.1838 0.7227
No. of family labor (age 16-59) -0.0686 -0.1645
No. of family member -1.1341 -0.6789
Characteristics of Household head
Educational attainment 0.339** 2.5134
Age 0.5040 0.5415
Dummy for female household head -0.5660 -0.3415
Characteristics of a SHG member
Age 1.0505 0.4201
Educational attainment 1.1530 0.7227
Residential year 0.0290 1.4789
Dummy for experience of emigrant -0.1510 -0.3414
Private transfer within village (Rs) 0.4600 1.5134
Characterisitics of SHG
Social homogeneity 0.1580 0.3911
Total number of participants 0.3650 0.2264
Financial transaction
Dummy for potential demand for loans 0.6450 0.7719
Dummy for credit constraint 0.6970 0.5550
Loan from
Friends, relatives (Rs.) -0.1880 -1.4801
Money lender (Rs.) 0.0560 0.4537
Credit cooperatives (Rs.) 0.6892 0.0674
Commercial bank (Rs.) 0.6700 0.2178
Government Bank (Rs.) 0.3658 1.0407
Total loans without SHG loans (Rs.) 0.5629 0.9273
Pseudo R^2 0.251
Log likelihood -38.7259
*** 1% significant, ** 5% significant, * 10% significant, respectively
Characteristics of Household
Dep var: Dummy for a SHG w/ access to external
loans =1
15
Management, 56(2), 155-166.
Burks, S., Carpenter, J., Verhoogen, E. (2003). Playing both roles in the trust game.
Journal of Economic Behavior and Organization, 51(2), 195-216.
Camerer, C. F., & Fehr, E. (2004). Measuring social norms and preferences using
experimental games: A guide for social scientists. In J. Henrich, R. Boyd, S. Bowles,
C. Camerer, E. Fehr, & H. Gintis (eds.), Foundations of Human Sociality. Oxford:
Oxford University Press.
Coleman, B. E. (1999). The impact of group lending in Northeast Thailand. Journal of
Development Economics, 60(1), 105-141.
Coleman, B. E. (2006). Microfinance in Northeast Thailand: who benefits and how
much? World Development, 34(9), 1612-1638.
Daley-Harris, S. (2009). State of the Microcredit Summit Campaign Report 2009,
Washington, D.C. http://www.microcreditsummit.org/state_of_the_campaign_report/
Deininger, K., & Liu, Y. (2009). Economic and social impacts of self-help groups in
India. World Bank Policy Research Working Paper Series, Vol.
Dunn, E., & Arbuckle, J. G. (2001). Microcredit and microenterprise performance:
impact evidence from Peru. Small Enterprise Development, 12(4), 22-33.
Duvendack, M., Palmer-Jones, R., Copestake, J. G., Hooper, L., Loke, Y. & Rao, N.
(2011). What is the evidence of the impact of microfinance on the well-being of poor
people? EPPI-Centre, Social Science Research Unit, Institute of Education,
University of London, London.
Feigenberg, B., Field, E. M., & Pande, R. (2010). Building social capital through
microfinance, NBER Working Paper No. 16018
Gadenne and Vasudevan (2007). How do women in mature SHGs save and invest their
money? Evidence from Self -Help Groups in India, IMFR center for microfinance,
Working Paper.
Garikipati, S. (2008). The impact of lending to women on household vulnerability and
women’s empowerment: evidence from India. World Development, 36(12),
2620-2642.
Harrison, G. W., & List, J. A. (2004). Field experiments. Journal of Economic Literature,
42(4), 1009-1055.
Kadiyala, S. (2004). Scaling up Kudumbashree: Collective Action for Poverty
Alleviation and Women's Empowerment. Washington, DC: International Food Policy
Research Institute.
Karlan, D., & Zinman, J. (2009). Expanding microenterprise credit access: Using
randomized supply decisions to estimate the impacts in Manila. Discussion Paper No.

16
976, Economic Growth Center.
Khandker, S. R. (2005). Microfinance and poverty: Evidence using panel data from
Bangladesh. World Bank Economic Review, 19(2), 263-286.
Kono, H., & Takahashi, K. (2010). Microfinance revolution: Its effects, innovations, and
challenges. The Developing Economies, 48(1), 15-73.
Kreps, D. M., Milgrom, P., Roberts, J., & Wilson, R. (1982). Rational cooperation in the
finitely repeated prisoners’ dilemma. Journal of Economic Theory, 27(2), 245-252.
Levitt, S. D., & List, J. A. (2007). What do laboratory experiments measuring social
preferences reveal about the real world? The Journal of Economic Perspectives, 21(2),
153-174.
Mosley, P. (2001). Microfinance and poverty in Bolivia. Journal of Development
Studies, 37(4), 101-132.
Pitt, M. M., & Khandker, S. R. (1998). The impact of group-based credit programs on
poor households in Bangladesh: does the gender of participants matter? Journal of
Political Economy, 106(5), 958-996.
Rai, A., & Ravi, S. (2011). Do Spouses Make Claims? Empowerment and Microfinance
in India. World Development, 39(6), 913-921.
Schechter, L. (2007). Traditional trust measurement and the risk confound: An
experiment in rural Paraguay. Journal of Economic Behavior & Organization, 62(2),
272-292.
Swain, R. B., & Varghese, A. (2009). Does Self Help Group Participation Lead to Asset
Creation? World Development, 37(10), 1674-1682.
Swain, R. B., & Varghese, A. (2011). Reassessing the impact of SHG participation with
non-experimental approaches. Economic & Political Weekly, 46(11), 51.
Swain, R. B., & Wallentin, F. Y. (2009). Does microfinance empower women? Evidence
from self-help groups in India. International Review of Applied Economics, 23(5),
541-556.