The Impacts of Air Quality Regulations on the Pipeline ...c.ymcdn.com/sites/ · The Impacts of Air...
33
The Impacts of Air Quality Regulations on the Pipeline Industry – An Overview March 3, 2014 James Smith Air Quality Director
Transcript of The Impacts of Air Quality Regulations on the Pipeline ...c.ymcdn.com/sites/ · The Impacts of Air...

The Impacts of Air Quality Regulations
on the Pipeline Industry – An Overview
March 3, 2014
James Smith
Air Quality Director

Overview
Drivers for Increased Regulation
Air Quality Regulations
Enforcement
What’s Ahead?
2

Drivers for Increased Regulation
Boom in O&G production (fracking!) and low NG price
Has led to increase in capital projects across supply chain
Well-sites / CPFs
Pipelines (oil and NG)
NG fractionation plants
Refinery expansions
Terminal expansions
Increased pollutant
emissions
March 4, 2014 3

Drivers (cont’d)
O&G industry largest source of
industrial VOC
NOx and formaldehyde from gas-fired
sources of primary concern
Pipeline facilities a significant source of methane
(greenhouse gas)
Recent lawsuits have driven EPA to meet previously ignored
rulemaking schedules, so new/revised rules have proliferated
March 4, 2014 4

Eagle Ford Shale From ~zero to >1,000,000 BOE/day by end of 2013
Page 5

Page 6

Air Quality Regulations – Categories
EPA/State construction and operating permit rules (40 CFR 52, 70, 71)
Could trigger stringent emission controls – Best Available Control Technology (BACT) or
Lowest Achievable Emission Rate (LAER)
Interstate pipelines - different States can have different permitting procedures
Must conduct a permit review before moving engines from site to site
New Source Performance Standards (NSPS) (40 CFR 60)
New, modified, or reconstructed sources – rules target “criteria” pollutants
National Emission Standards for Hazardous Air Pollutants (NESHAP)
For Source Categories (40 CFR 63) – Maximum Achievable Control Technology (MACT)
Rules target defined HAPs at large (major) and small (area) facilities
Mandatory Greenhouse Gas Reporting (40 CFR 98)
Methane from leaks and vents is primary GHG of concern
National Ambient Air Quality Standards (NAAQS) (40 CFR 50)
Defined for six pollutants – NO2, CO, PM (PM10/2.5), Ozone, SO2, and Pb
“Nonattainment areas” do not meet the NAAQS for a particular pollutant (severities)
1-hr SO2 and NO2 (modeling issue)
March 4, 2014 7

Specific Air Regulations – List
Federal Rules That May Apply ….
NSPS (40 CFR 60) Subpart
A – General
GG – Stationary Gas Turbines
IIII – “Compression” Ignition Internal Combustion Engines (diesel)
JJJJ – “Spark” Ignition Internal Combustion Engines (gas)
KKKK – Stationary Combustion Turbines
OOOO – Crude Oil and Natural Gas Production, Transmission, and
Distribution
NESHAP for Source Categories (40 CFR 63) Subpart
A – General
R – Bulk Gasoline Terminals and Pipeline Breakout Stations
HH – Oil and Natural Gas Production Facilities
TT/UU – Equipment Leaks
March 4, 2014 8

Specific Air Regulations (cont’d)
Federal Rules That May Apply (cont’d) ….
NESHAP for Source Categories (40 CFR 63) Subpart
VV – Oil-Water Separators
HHH – Natural Gas Transmission and Storage Facilities
EEEE – Organic Liquids Distribution (Non-Gasoline)
YYYY – Stationary Combustion Turbines
ZZZZ – Stationary Reciprocating Internal Combustion Engines
DDDDD – Major Sources: Industrial, Commercial, and Institutional Boilers and
Process Heaters
BBBBBB – Gasoline Distribution Bulk Terminals, Bulk Plants, Pipeline Facilities
JJJJJJ – Industrial, Commercial, and Institutional Boilers (Area Sources)
GHG Mandatory Reporting Rule (40 CFR 98) Subpart
A – General
C – Stationary Fuel Combustion Sources
W – Petroleum and Natural Gas Systems
March 4, 2014 9

Consider State/Local Air Regulations
State and local rules can be more stringent than the
federal rules (cannot be less stringent)
Most States have one environmental
protection agency that handles AQ
(e.g. TCEQ, LDEQ, NYDEC, etc.)
California has CARB, part of Cal/EPA
35 local AQ management districts
each with its own set of Air rules
March 4, 2014 10

Sections Of An Air Regulation
Applicability/Exemptions
Emission Limits
Operating Limits
Work Practice Standards
Performance Testing
Monitoring
Recordkeeping
Reporting
March 4, 2014 11

Overview of RICE MACT (“Quad Z”)
Rule originally issued in 2004, revisions in 2008, 2010, 2011, and 2013
Requires reduction of criteria and HAP emissions
from stationary ICE By 2013, US-wide reductions of:
CO by 248,400 tpy
PM10 by 6,500 tpy
VOC by 27,000 tpy
HAP by 6,600 tons per year (tpy) mainly formaldehyde, methanol, acrolein, acetaldehyde
Applies to “existing” and “new” CI (diesel-fired) and SI (gas-fired) engines
located at “major” and “area” sources of HAP emissions SI engines – two vs four stroke, and rich burn vs lean burn (e.g. 2SLB, 4SRB)
Major HAP source – emits ≥ 10 tpy single HAP or 25 tpy combination of HAPs
Area HAP source – source that is not major
March 4, 2014 12

RICE MACT (cont’d)
March 4, 2014 13
“Existing” engine
Area HAP source: Engines constructed/reconstructed before June 12, 2006
Major HAP source:
o Engines ≤ 500 bhp constructed/reconstructed before June 12, 2006
o Engines > 500 bhp constructed/reconstructed before Dec 19, 2002
“New” engine – constructed/reconstructed on or after the above dates
Emission and operating limits, and work practices,
found in the twelve appendix tables
Convoluted rule! EPA has a question-based
navigation tool to walk you through rule applicability
and requirements for your specific operating
scenarios

RICE MACT (cont’d)
March 4, 2014 14
Typical after-treatment technologies include Oxidation Catalyst for CO, or
Non-Selective Catalytic Reduction (NSCR) for NOx
Use only Ultra Low Sulfur Diesel (ULSD) Fuel for Existing Non-
Emergency CI Engines > 300 HP and <30 liter/cylinder displacement
located at a Major HAP source
Engines > 300 hp must be equipped with closed or open crankcase
filtration system to reduce metallic HAP emissions (e.g. nickel, mercury)
For certain new/reconstructed engines, compliance with RICE MACT is
met by compliance with NSPS Subparts IIII (CI engines) and JJJJ (SI
engines)

GHG MRR Subpart W
March 4, 2014 15
Rule applies to …..
Offshore and Onshore Petroleum and Natural Gas
Production
Onshore Natural Gas Processing
Onshore Natural Gas Transmission Compression
Underground Natural Gas Storage
LNG Storage
LNG Import and Export Equipment
Natural Gas Distribution – pipelines and metering stations operated by a
Local Distribution Company within a single State (i.e., downstream of “city
gate”)

GHG MRR Subpart W (cont’d)
March 4, 2014 16
Onshore NG Transmission Compression “….means any stationary combination of
compressors that move natural gas from
production fields, natural gas processing
plants, or other transmission compressors
through transmission pipelines to natural gas
distribution pipelines, LNG storage facilities,
or into underground storage. In addition, a
transmission compressor station includes
equipment for liquids separation, and tanks
for the storage of water and hydrocarbon
liquids. Residue (sales) gas compression
that is part of onshore natural gas processing
plants are included in the onshore natural gas
processing segment and are excluded from this segment.”

GHG MRR Subpart W (cont’d)
March 4, 2014 17
Rule does not set GHG emission limits, only reporting requirements
GHGs are Carbon Dioxide (CO2), Methane (CH4), Nitrous Oxide (N2O)
Applicability threshold is 25,000 metric tons (MT) Carbon Dioxide
Equivalent (CO2e), applied to each compressor station
CO2e (MT/yr) obtained by multiplying individual GHG emission rate
(GHGi) with the GHG’s defined Global Warming Potential (GWPi)
GWPCO2 = 1
GWPCH4 = 25
GWPN2O = 298

GHG MRR Subpart W (cont’d)
March 4, 2014 18
For NG transmission sector, report GHG emissions from
Reciprocating Compressors (rod packing vent line)
Centrifugal Compressors (wet seal degassing vent)
Transmission Storage Tank Vents
Blowdown Vent Stacks
NG Pneumatic Bleed Devices (high and low bleed)
Fugitive emissions from pipeline component leaks
(Also any other combustion sources, e.g. flares)
Must report prior year’s total GHG (CO2e)
emissions by March 31 using EPA’s
electronic reporting tool (e-GGRT)

Potential Enforcement
March 4, 2014 19
EPA’s Six National Enforcement Initiatives for 2014 – 2016 o Keeping raw sewage and contaminated stormwater out of our nation’s waters
o Preventing animal waste from contaminating surface and ground waters
o Cutting toxic air pollution that affects communities’ health
o Reducing widespread air pollution from the largest sources, especially the
coal-fired utility, cement, glass, and acid sectors
o Reducing pollution from mineral processing operations
o Assuring energy extraction sector compliance with
environmental laws
For HAPs, EPA focused on three areas of reduction (based
on historical non-compliance) 1. Leak Detection and Repair (LDAR)
2. Reducing volume of waste gas to flare and flare control efficiency
3. Excess emissions, including those from Startup, Shutdown, and Malfunction
Potential Enforcement (cont’d)
March 4, 2014 20
EPA Office of Enforcement and Compliance Assurance (OECA) …
“An unprecedented acceleration of natural gas development has led to a
significant rise in air pollution throughout the intermountain West.
Geospatial analysis suggests that a similar rise in air pollution is possible
elsewhere as unconventional gas development grows in other shale plays.”
EPA will enforce based upon Clean Air Act, Clean Water Act, Safe
Drinking Water Act, and other authorities
Air regulations (e.g. GHG MRR) have language stating that a violation of
any part of the rule constitutes a violation of the Clean Air Act
Each day of a violation constitutes a separate violation
Civil penalties can range anywhere from zero to $25,000 – $35,000/day
What’s Ahead?
March 4, 2014 21
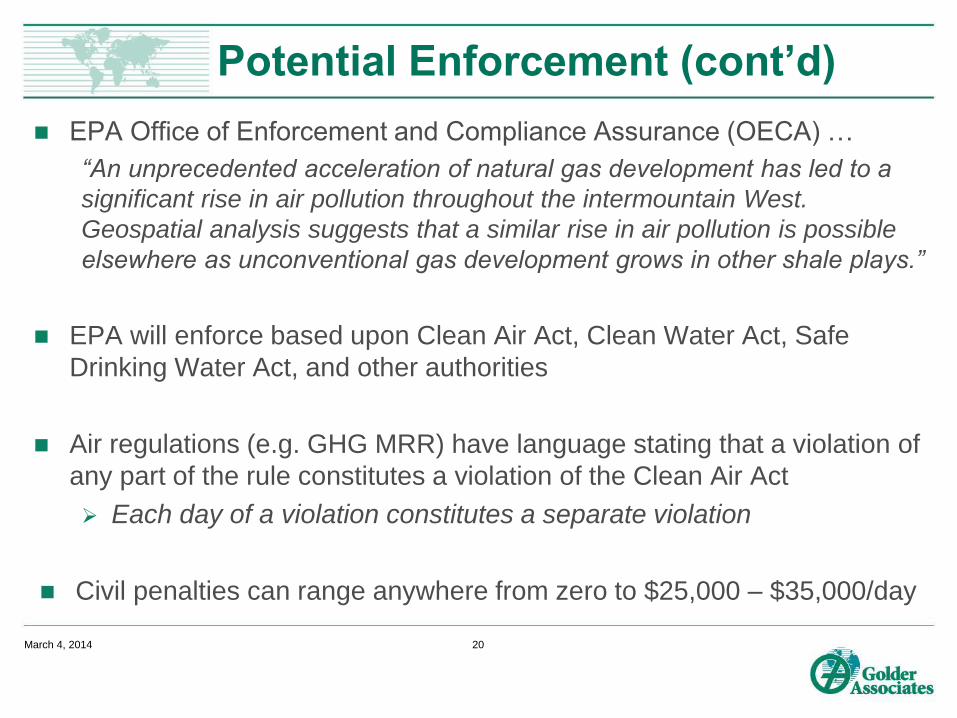
Lowering of Ozone NAAQS (primary)
0.12 ppmv (1-hr) for many years
0.08 ppmv (84 ppbv) (8-hr) in 1997
0.075 ppmv (75 ppbv) (8-hr) in 2008
Pending: 60 – 70 ppbv (8-hr)?
Timetable: EPA proposes new standard by Dec 2014
Finalizes new standard by Oct 2015
Will create more Ozone “nonattainment” areas in US

Ozone NAAQS
March 4, 2014 22
EPA Ozone Nonattainment Map – 75 ppbv

Ozone NAAQS
March 4, 2014 23
EPA Ozone Nonattainment Map – 60 ppbv (projected)

What’s Ahead? (cont’d)
March 4, 2014 24
GHG-related issues
PSD Tailoring Rule – On Feb 24, 2014 US Supreme Court heard
arguments on EPA’s authority to limit GHG in air permits
EPA developed GHG rules for motor vehicles and said the CAA forced
similar rules for stationary sources
Observers expect high court to curb EPA’s authority to limit GHGs in
permits
140 facilities already have GHG PSD permits, TX has 80 pending
Mandatory Reporting Rule, Subpart W – Proposed revisions
to expand use of site-specific gas composition data, revise calc.
methods for compressors that have safety or operational concerns,
remove use of alternative monitoring methods

What’s Ahead? (cont’d)
March 4, 2014 25
Pollutant Emission Factor Revisions?
On Feb 25, 2014 EPA settled lawsuit by TX/LA
community groups who claim factors are too low
(emissions are underestimated) EPA has agreed to review/revise factors for emissions of VOC, CO, and
NOx from liquid storage tanks, industrial flares, and wastewater
treatment systems at refineries and petrochemical plants
More Scrutiny of Methane Emissions – U.S. Energy Secretary
Moniz wants closer look at methane emissions from transmission and
distribution systems (says actual emissions higher than EPA’s estimates)
Questions?
James Smith
Golder Associates Inc.
500 Century Plaza Drive, Ste. 190
Houston, TX 77073
(281) 821-6868
March 4, 2014 26

Backup Slides
March 4, 2014 27

Number Air Permit Applications Received (TCEQ)
196 240 225 173 154 139
1,863
3,183
3,559
4,512
5,338 5,155
5,623
5,295
4,492
6,945
9,276
9,664
0
2,000
4,000
6,000
8,000
10,000
12,000
FY05 FY06 FY07 FY08 FY09 FY10 FY11 FY12 FY13
Ap
pli
cati
on
s R
eceiv
ed
Oil and Gas Projects
Total NSR Projects

Consider State/Local Air Regulations
Ozone Transport Commission (OTC)
Multi-state organization tasked with advising EPA
on how to solve pollutant transport and ozone
NAAQS compliance problem in the northeast
Developing “model rule” for NOx control from
equipment in O&G E&P sector, including compressors
Evaluated reciprocating gas-fired (SI) engines (2SLB, 4SLB, 4SRB),
diesel-fired (CI) engines, and combustion turbines
Found that largest sources of NOx emissions from existing recip engines
and combustion turbines
March 4, 2014 29

Typical Emission Sources / Pollutants
Combustion Sources – NOx, CO, PM10/2.5, VOC, HAPs, GHG
Engines (Diesel-Fired, Gas-Fired)
Gas Turbines
Compressors
Heaters and Boilers
Flares
Glycol Dehydrators – VOC
Storage Tanks – VOC, GHG
Equipment Leaks (aka “Fugitives”) – VOC, GHG
Valves, flanges, pump/compressor seals, sampling stations, pneumatic
devices, open-ended lines, etc.
March 4, 2014 30
RICE MACT – Example Tables
March 4, 2014 31
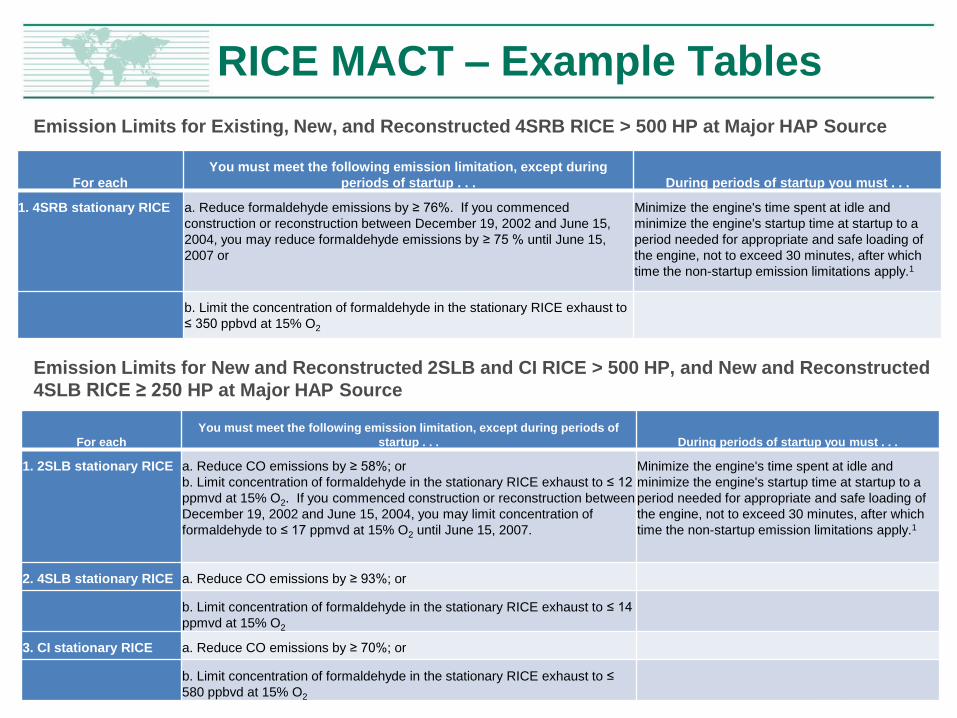
Emission Limits for Existing, New, and Reconstructed 4SRB RICE > 500 HP at Major HAP Source
Emission Limits for New and Reconstructed 2SLB and CI RICE > 500 HP, and New and Reconstructed
4SLB RICE ≥ 250 HP at Major HAP Source
For each
You must meet the following emission limitation, except during
periods of startup . . . During periods of startup you must . . .
1. 4SRB stationary RICE a. Reduce formaldehyde emissions by ≥ 76%. If you commenced
construction or reconstruction between December 19, 2002 and June 15,
2004, you may reduce formaldehyde emissions by ≥ 75 % until June 15,
2007 or
Minimize the engine's time spent at idle and
minimize the engine's startup time at startup to a
period needed for appropriate and safe loading of
the engine, not to exceed 30 minutes, after which
time the non-startup emission limitations apply.1
b. Limit the concentration of formaldehyde in the stationary RICE exhaust to
≤ 350 ppbvd at 15% O2
For each
You must meet the following emission limitation, except during periods of
startup . . . During periods of startup you must . . .
1. 2SLB stationary RICE a. Reduce CO emissions by ≥ 58%; or
b. Limit concentration of formaldehyde in the stationary RICE exhaust to ≤ 12
ppmvd at 15% O2. If you commenced construction or reconstruction between
December 19, 2002 and June 15, 2004, you may limit concentration of
formaldehyde to ≤ 17 ppmvd at 15% O2 until June 15, 2007.
Minimize the engine's time spent at idle and
minimize the engine's startup time at startup to a
period needed for appropriate and safe loading of
the engine, not to exceed 30 minutes, after which
time the non-startup emission limitations apply.1
2. 4SLB stationary RICE a. Reduce CO emissions by ≥ 93%; or
b. Limit concentration of formaldehyde in the stationary RICE exhaust to ≤ 14
ppmvd at 15% O2
3. CI stationary RICE a. Reduce CO emissions by ≥ 70%; or
b. Limit concentration of formaldehyde in the stationary RICE exhaust to ≤
580 ppbvd at 15% O2

GHG MRR Subpart W (cont’d)
March 4, 2014 32
TABLE W-3 OF SUBPART W OF PART 98—DEFAULT TOTAL HYDROCARBON EMISSION FACTORS FOR
ONSHORE NATURAL GAS TRANSMISSION COMPRESSION
Onshore natural gas transmission compression Emission factor (scf/hour/component)
Leaker Emission Factors—Compressor Components, Gas Service
Valve1 14.84
Connector 5.59
Open-Ended Line 17.27
Pressure Relief Valve 39.66
Meter 19.33
Leaker Emission Factors—Non-Compressor Components, Gas Service
Valve1 6.42
Connector 5.71
Open-Ended Line 11.27
Pressure Relief Valve 2.01
Meter 2.93
Population Emission Factors—Gas Service
Low Continuous Bleed Pneumatic Device Vents2 1.37
High Continuous Bleed Pneumatic Device Vents2 18.20
Intermittent Bleed Pneumatic Device Vents2 2.35

Ozone NAAQS
March 4, 2014 33
Interstate and Intrastate Pipelines With Compressor Stations


![[Pipeline] Inspecting Pipeline Installation](https://static.fdocuments.us/doc/165x107/55cf8d045503462b1391543e/pipeline-inspecting-pipeline-installation.jpg)