THE IMPACT OF WORKING ARRANGEMENTS ON THE...
17
THE IMPACT OF WORKING ARRANGEMENTS ON THE PHYSICAL AND PSYCHOLOGICAL HEALTH OF WORKERS AND THEIR PARTNERS David Peetz Georgina Murray Olav Muurlink Centre for Work, Organisation and Wellbeing Griffith Business School Griffith University Nathan 4111 Brisbane Australia Contact email: [email protected] © 2012 the authors No written or electronic reproduction without permission
Transcript of THE IMPACT OF WORKING ARRANGEMENTS ON THE...
THE IMPACT OF WORKING ARRANGEMENTS ON
THE PHYSICAL AND PSYCHOLOGICAL HEALTH
OF WORKERS AND THEIR PARTNERS
David Peetz
Georgina Murray
Olav Muurlink
Centre for Work, Organisation and Wellbeing Griffith Business School
Griffith University Nathan 4111
Brisbane Australia
Contact email: [email protected]
© 2012 the authors No written or electronic reproduction without permission
2
The impact of working arrangements on the physical and psychological health of workers and their partners
David Peetz, Georgina Murray & Olav Muurlink
There is a substantial body of research into the relationship between work and occupational safety. Thorough research into the general health dimensions of working arrangements is less common. Our paper presents the most recent research on the health dimensions of work using, as a case study, an industry that has undergone significant changes in working time and work organisation over the past two decades: the coal mining industry in Australia. The changes are dramatic. Coal mining had been the Australian industry with the shortest standard working hours, but it became the one with the second longest; in most mines 8-hour days worked five days a week have been replaced for many (but not all) workers by rotating 12-hour shifts which take no account of weekends; the use of contractor firms in place of permanent mine employees has increased exponentially; and work organisation has been fundamentally altered.1 Mining companies have largely abandoned building mining towns and instead promote long distance commuting (LDC) arrangements, through fly-in-fly-out (FIFO) workforce in more remote mines. Even in mines near existing communities, drive-in-drive-out (DIDO) LDC has become common for a significant part of the workforce. At the same time, major change in communities supporting mines has taken place. Many coal mining town populations fell in the 1990s, and most growth since 2001 has been in the ‘visitor’ populations2 workers who now often live in camps on the edge of mining towns or in share accommodation in such towns, where housing prices have soared. Many mining families are split, mineworkers commonly spending half to three quarters of their time in the camps while their partners and children live several hours drive away, in coastal towns or provincial or capital cities. For other families that can stay together in the mining communities, shift patterns mean mineworkers have only one or two full weekends free per month. As the majority of mine workers are men, this has gendered implications for child care, involvement of men in community sporting and leisure activities and intra-family relationships in both mining communities and LDC provincial towns.3 The research question we present here is a key element in a project that investigates the impact of working arrangements on the coal industry in relation to miners’ well-being in their regional communities. The particular focus of this paper is on several issues: how do the hours preferred by mining and energy workers compare to the hours they actually work; how much say to mining and energy workers have in the hours they work; and what are the consequences of working arrangements in mining and energy, particularly when workers do not have say and are working hours inconsistent with their preferences?
1 Waring, P. and M. Barry (2001). "The changing frontier of control in coal: evidence from a decade of enterprise bargaining in the Australian black coal mining industry." Australian Bulletin of Labour 27(3): 216-‐237, Di Mila, L. and B. Bowden (2007). "Unanticipated safety outcome drive in and drive out workforces in Queensland Bowen Basin " Asia Pacific Journal of Human Resources 45: 110-‐115. 2 Australian Bureau of Statistics (4102.0). Towns of the mineral boom. Australian Social Trends 2008, . Canberra. 3 Murray, G. and D. Peetz (2010). Women of the Coal Rushes. Sydney, University of NSW Press.
3
Methods The findings here are principally drawn from the ACES (Australian Coal and Energy Survey) survey. ACES is a contemporary study of wellbeing and working arrangements, managed by the authors and funded jointly by the Commonwealth’s Australian Research Council (ARC) and the Mining and Energy Division of the Construction, Forestry, Mining and Energy Union (CFMEU) through the ARC’s Linkage research scheme. It is a survey of 4500 people, comprising mining and energy workers who were members of the CFMEU in August-December 2011, and their partners. Approximately 80 per cent of the mine and energy workers sample worked in coal mining, 10 per cent in other mining industries and less than 10 per cent in energy. The survey instrument comprised a detailed 16 page survey for mineworkers and a 12 page survey for their partners. Data reported here were obtained from 2540 members and 1902 partners, of whom 1725 could be matched with mineworker spouses. These responses represented response rates of 28 per cent amongst the mine and energy workers and 76 per cent amongst the partners of mine and energy workers who responded. Amongst mining and energy workers we surveyed, 90 per cent were in a relationship – ie not single, widowed or separated/divorced.
The CFMEU covers approximately 60 per cent of the nation’s coal mining employees. Using union members as the target population enables a greater N and diversity of shift and employment arrangements than company or mine-based studies. Our instrument makes use of: health measures, including but not restricted to those constructed in the widely used General Health Questionnaire (GHQ);4 shiftwork and sleep quality questions from the standard shiftwork index (SSI)5 work-life balance questions from the Australian Work and Life Index (AWALI)6 and elsewhere;7 ‘morningness’ questions from Adan & Almirall;8 relationship quality using the Revised-Dyadic Adjustment Scale;9 questions on job insecurity, autonomy, child care, alcohol and cigarette consumption and life satisfaction from the Household, Income and Labour Dynamics in Australia (HILDA) survey;10 questions on child behaviour from the Strengths and Difficulties Questionnaire;11 social capital questions from the World Values Survey12 and HILDA; and a series of questions designed and tested
4 eg Watson, D. and J. W. Pennebaker (1989). "Health complaints, stress, and distress: Exploring the central role of negative affectivity." Psychological review 96(2): 234. 5 Barton, J., E. Spelten, P. Totterdell, L. Smith, S. Folkard and G. Costa (1995). "The Standard Shiftwork Index: a battery of questionnaires for assessing shiftwork-‐related problems." Work & Stress 9(1): 4-‐30. 6 Pocock, B. and N. Skinner (2009). The Australian Work and Life Index (AWALI), Centre for Work + Life,, U. o. S. Australia. <http://www.unisa.edu.au/hawkeinstitute/cwl/default.asp>. 7 Allen, C., R. Loudon and D. Peetz (2005). "influences on work/non work conflict." Journal of Sociology 43: 219-‐239.; Gutek, B. A., S. Searle and L. Klepa (1991). "Rational versus gender role explanations for work-‐family conflict." Journal of Applied Psychology 76(4 ): 560. 8 A shortened version of the scale from Adan, A. and H. Almirall (1991). "Horne & Östberg morningness-‐eveningness questionnaire: A reduced scale." Personality and Individual differences(12): 3. 9 Hunsley, J., M. Best, M. Lefebvre and D. Vito (2001). "The seven-‐item short form of the Dyadic Adjustment Scale: Further evidence for construct validity." American Journal of Family Therapy 29(4): 325-‐335. 10 Watson, N. and M. Wooden (2002). The Household, Income and Labour Dynamics in Australia (HILDA) Survey: Wave 1 Survey Methodology. HILDA Project Technical Paper Series No. 1/02, Melbourne Institute of Applied Economic and Social Research, University of Melbourne. 11 Goodman, R. (1997). "The Strengths and Difficulties Questionnaire: A Research Note." Journal of Child Psychology and Psychiatry 38(5): 581-‐86. 12 European Values Study Group and World Values Survey Association (2006). European and World Values Surveys: Four Wave Integrated Data File, 1981-‐2004,. v.20060423.
4
specifically for this project. Our focus in this initial paper is on dimensions affecting, and influenced by, health.13 We tested three alternative methods of survey administration with varying costs and benefits, and chose for the main survey the method that had the highest response rate in the pilot (42 per cent and 37 per cent amongst workers and partners respectively, compared to 28 per cent/17 per cent, and 24 per cent/12 per cent, under alternative methods).
To test the validity of the data we benchmarked key questions against data in the Australian Work and Life Index (AWALI) survey. AWALI was undertaken annually by the Centre for Work + Life at the University of South Australia from 2007.14 AWALI surveys a representative, national, stratified random sample of the Australian workforce. Sample sizes were 1435 in 2007, 2831 in 2008 and 2691 in 2009. A request was made to the AWALI project team for unpublished data on hours preferences in the mining industry. In order to achieve a reasonable sample size, data from the three years of AWALI (2007 to 2009) were aggregated to produce a total N for mining of 188 for the question on hours worked and 176 for hours preferences. The findings are reported elsewhere, as is reportage of qualitative research we had undertaken in the Bowen Basin coal fields of Queensland, involving interviews with 137 women and men.15 Indeed this previous qualitative research had motivated us to undertake this project. We discuss the comparisons with AWALI below. Notably, a key aspect of the ACES findings is that in many respects they closely follow those of the AWALI survey mentioned, a fact that increases confidence in the findings.
A point on terminology: we sometimes present data on a partner’s perception of their own partner who is, of course, a mining and energy worker in the original sample. So to avoid confusion, when referring to married, cohabiting or non-cohabiting couples in which one is a mine and energy worker, the term ‘spouse’ is used to refer to the person who is the mine and energy worker and ‘partner’ is the term used to describe the other member of the couple. The questionnaires themselves used the term ‘partner’ for both members of the couple, but we use ‘spouse’ here to avoid the confusion of referring to partners’ partners.16
Preferred and actual hours
In ACES, workers were asked ' Including any paid or unpaid overtime, how many hours per week do you work on average in your main job?’ They were then immediately asked ‘If you could choose the number of hours you work each week, and taking into account how that would affect your income, leisure and domestic activities, how many hours a week would you
13 The data presented here are preliminary in several respects: the datasets containing information on mineworkers’ hours worked and on partner attitudes were only received by the principal researchers on 14 February; there are still a small number of observations of mineworkers and partners to be received and/or entered; some fields (eg on roster patterns) are still being entered; the data are presently unweighted; and some minor cleaning is still to be done. Updated data will be presented at Philadelphia. 14 Skinner, N. and B. Pocock (2008). Work, Life & Workplace Culture: The Australian Work and Life Index 2008, Centre for Work + Life, University of South Australia: Adelaide, Pocock, B., N. Skinner and R. Ichii (2009). Work, Life & Workplace Flexibility: The Australian Work and Life Index 2009, Centre for Work + Life, University of South Australia: Adelaide. 15 Peetz, D. and G. Murray (2011). "'You Get Really Old, Really Quick': Involuntary Long Hours in the Mining Industry." Journal of Industrial Relations 53(1): 13-‐29. 16 Amongst the couples from whom we have data, 84 per cent were married couples, 15 per cent non-‐married but cohabiting, and 1 per cent not cohabiting.
5
choose to work?’. As with AWALI, the ACES data revealed that the majority of mineworkers (61 per cent) preferred to work less than forty-one hours per week. The distribution concentrated in the 38-41 hour range, preferred by 31 per cent of respondents. The median of preferred hours – that is, the 'mid point' – was 40 hours per week (as with AWALI). In total, 67 per cent of mining employees preferred to work less than 44 hours per week and only 33 per cent preferred to work 44 hours or more per week. (In AWALI, the figures were 64 and 36 per cent respectively.) Consistent with AWALI, By far the most common (modal) hours preference in ACES was for a 40 hour working week.
ACES also asked employees the number of hours that they worked. The median mining employee in ACES worked 44 hours per week, and the median full-timer worked 44.5 hours per week. (These numbers are slightly lower than in AWALI, suggesting that average hours in unionised coal mining are lower than average hours in the largely non-unionised metals mining sectors. ABS data also indicate that coal mining has the lowest hours worked per employee of the five sub-industries within the mining industry.17)
Some 50 per cent of employees in ACES were working more hours than they would prefer, even after taking into account how that would affect their income and other activities, while 39 per cent were working the number of hours they would prefer and 11 per cent would prefer to be working more hours. These numbers are not significantly different to those in AWALI. Amongst the 11 per cent who would prefer to be working more hours, the median gap between what they would prefer and what they were working was 12 hours. Amongst the 50 per cent of mining employees who would rather be working fewer hours, the median gap between the hours they are working and the hours they would prefer to work was 8 hours. Importantly, the idea that current working hours arrangements in the mining industry are driven primarily by changes in employee preferences was thus shown to be incorrect.
There is, of course, some labour market sorting before these data are collected. These data refer to the hours preferences of workers currently employed in the industry at the time of the survey. Some workers who do not like the current working hours arrangements will have entered and left the industry before they could have been observed in this survey. In our earlier qualitative research we reported meeting people who had left the industry and would not return due to the length of shifts.18 The survey was therefore likely to understate the gap between employee preferences and the actual hours worked for those workers who have entered the industry.
Say over hours and shifts To date the mining industry provides relatively little say for employees in choosing their hours of work or rosters. Some of the respondents in our qualitative research told us how they had been able to swap shifts to meet their personal needs (for example, to enable a husband and wife to work the same shifts), and this was borne out in ACES. But overall, employee input was minimal. Some told us how their social lives had been transformed because they were no longer on the same shift patterns as their friends (or even husbands) and could not socialise or go away with them. This was confirmed in some ACES responses: amongst partners in ACES who said that their working hours rarely or never aligned with
17 Australian Bureau of Statistics (6306.0). Employee Earnings and Hours, Australia. Canberra. May 2010, Spreadsheet 63060DO010_201005, 2011. 18 Peetz, D. and G. Murray (2011). "'You Get Really Old, Really Quick': Involuntary Long Hours in the Mining Industry." Journal of Industrial Relations 53(1): 13-‐29.
6
their spouse’s, 39 per cent agreed that their partner’s working hours interfered with their ability to maintain connections and friendships in the community; this was the case for amongst only 24 per cent of those whose hours almost always aligned with their spouse’s. ACES confirmed the low level of input of mine and energy workers into their shift arrangements: 61 per cent of mine and energy workers had no say at all in how many hours they worked a week, 70 per cent had no say in the types of shifts they worked (e.g. night, 8 hour or 12 hour etc), 74 per cent had no say in which shifts they worked on a particular day, and 79 per cent had no say in their starting and finishing times. These four items were each measured on four point scales ranging from ‘none’ through ‘some’ and ‘quite a lot’ to ‘a great deal’. These figures confirm that workers in mining and energy have very low rates of say in their hours and shifts, compared to other industries. For example, by comparison, an earlier survey of 15 organisations across diverse industries and size bands in Queensland found that only 33 per cent of workers outside mining reported having no say over how many hours they worked per week and only 31 per cent reported having no say over their start and finish times.19 (That earlier survey included one mining organization, and it had the lowest rates of employee say of any organization in the survey.)
We constructed a ‘say over hours’ index (α=.85) comprising the above four items. After recoding into a three-point scale, those who had no say on all four items were given a score of 1 (‘none’). They accounted for slightly more than half the sample. Those who reported ‘some’ say in either one or two items, and none on the rest (or ‘quite a lot’ on one item and ‘none’ on the other three) were given a score of 2 (‘some’). They accounted for slightly more than a quarter of the sample. Those who reported ‘some’ say on three or more items (or ‘quite a lot’ on one and ‘some’ or better on another) were given a score of 3 (‘more’). They accounted for slightly less than a quarter of the sample. We also asked how much say employees had over when they ‘can take time off e.g. for holidays, dentist appointments’, a question not included in the index for reasons of index reliability. Here respondents showed some greater levels of influence: only 3 per cent of those who answered had no say, a plurality (48 per cent) had ‘some’ say, 37 percent had ‘quite a lot’ and 12 per cent had a ‘great deal’.
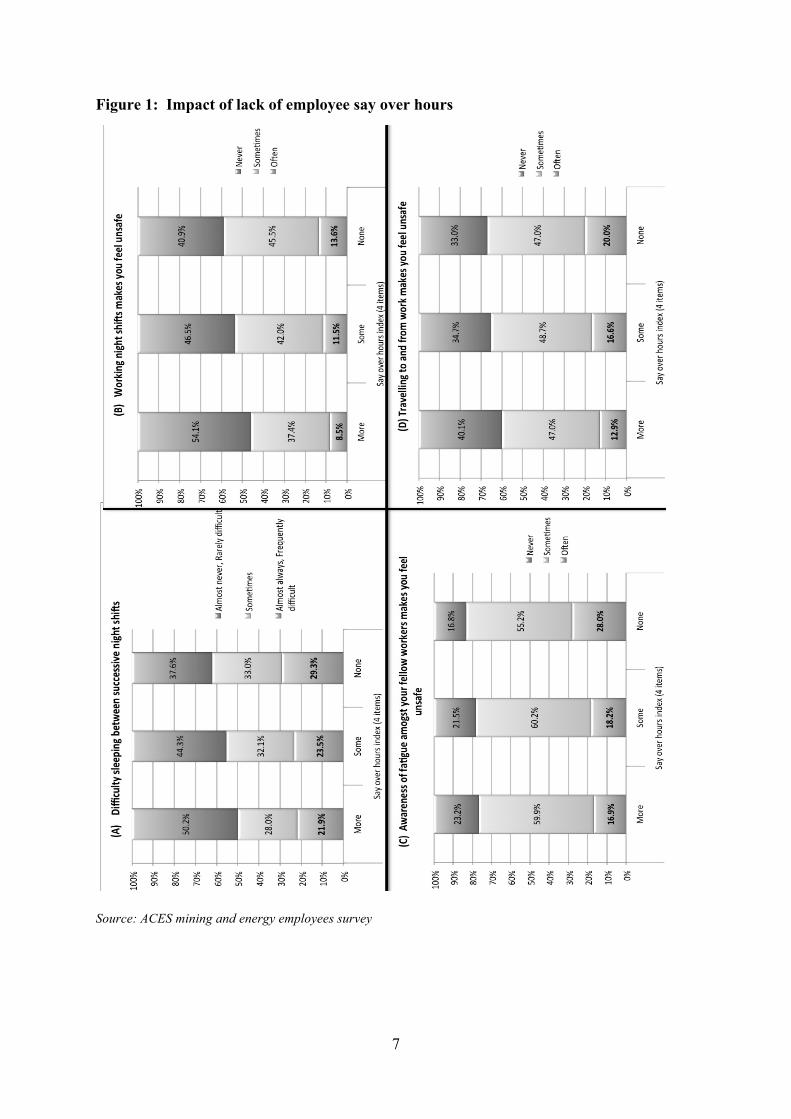
Lack of employee ability to prevent excessive and hence unreasonable hours in turn creates problems for employees in terms of their wellbeing and family relationships. This is illustrated in the four panels of Figure 1. Those who had no say over any of these aspects of hours and shifts were more likely to say they had difficulty sleeping between night shifts (29 per cent) than other workers (22-23 per cent) (Panel A of Figure 1). They were more likely than other workers to say that they often felt unsafe working night shifts (Panel B). They were more likely than other workers to say that their awareness of fatigue amongst their fellow workers often made them feel unsafe (Panel C). They were also more likely than others to say that they felt unsafe travelling to and from work (Panel D).
19 Unpublished data from Peetz, D., K. Townsend, R. Russell, C. Houghton, A. Fox and C. Allan (2003). "Race Against Time: Extended Hours in Australia." Australian Bulletin of Labour 29(2): 126-‐142.
7
Figure 1: Impact of lack of employee say over hours
Source: ACES mining and energy employees survey
8
Workers who had no say over their hours or shifts were more likely to agree that ‘After work, I come home too tired to do some of the things I’d like to do or need to do’ (70 per cent) than were those with ‘some’ (64 per cent) or ‘more’ (55 per cent) say over hours. They were more likely to agree that ‘I am often so emotionally drained when I get home from work that it prevents me from contributing to my family’ (44 per cent) than were those with ‘some’ (34 per cent) or ‘more’ (29 per cent) say over hours.
Those who had no say over when they could take time off were considerably more likely to say that they were getting on worse with people at home: 11 per cent said that how well they ‘got on with people at home’ had gone down over the previous two years, versus 6.5 per cent for whom it had gone up. By comparison, amongst those who had a ‘great deal’ of say over when they could take time off, only 3 per cent were getting on worse with people at home and 10 per cent were getting on better.
Work-life interference
The AWALI project showed that, when all industries are ranked on an index measuring the degree of interference between work and family life, the mining industry is ranked the second worst.20 (This AWALI index is constructed from responses to five questions concerning whether: work interferes with activities outside work; work interferes with enough time with family or friends; work interferes with community connections; respondents feel rushed or pressed for time; and respondents feel satisfied with their work life balance. One reason for mining's poor ranking on work-life interference is the divergence between hours preferred and hours worked. The AWALI index is scored from zero (best possible fit between work and life) to 100 (worst possible fit). Nationally, male workers who are working more hours than they would prefer have an index score 35 per cent higher (ie 35 per cent worse) than male workers who are working at or near their preferred hours. For female workers, the impact is 46 per cent. According to the AWALI researchers, this finding has important implications, as 'measures which help workers find a better fit between actual and preferred hours will result in lower work-life conflict'.21 Our qualitative research indicated that working hours in mining were negatively affecting the balance between work and personal lives.22
So it was that those ACES respondents who would prefer to be working fewer hours scored poorly on the component questions in the AWALI index mentioned above. For example, 29 per cent of mine and energy workers who preferred fewer hours said that work ‘often’ or ‘almost always’ interferes with responsibilities and activities outside of work, almost double the 15 per cent portion amongst those who preferred their current number of hours. The figure rose to 33 per cent amongst those who wanted fewer hours and had no say over their hours. Mine and energy workers who wanted to work fewer hours were more likely to say that work, often or almost always, stopped them spending the amount of time they would like with their family or friends, and that it often or always interfered with their ability to develop or maintain connections and friendship in their community. Overall, while 25 per cent of those working the hours they preferred said they were, often or almost always, rushed and pressed for time, the figure rose to 48 per cent amongst those who wanted to work fewer
20 Skinner, N. and B. Pocock (2008). Work, Life & Workplace Culture: The Australian Work and Life Index 2008, Centre for Work + Life, University of South Australia: Adelaide. p7. 21 Ibid. 22 Peetz, D. and G. Murray (2011). "'You Get Really Old, Really Quick': Involuntary Long Hours in the Mining Industry." Journal of Industrial Relations 53(1): 13-‐29.
9
hours; 53 per cent of those who wanted to work fewer hours and had no say over their hours said that they often felt rushed or pressed for time.
The effects were felt not just by mine and energy workers but also by their partners. Amongst partners of mine and energy workers who would prefer to work fewer hours, over half (52 per cent) often or almost always felt rushed or pressed for time, compared to 43 per cent of workers whose spouses were content with their hours. Table 1 shows this and other relationships. Partners of workers who wanted to work fewer hours were more likely than other partners to agree that their spouse was often so emotionally drained when they get home from work that it prevented them from contributing to the family, that after work, their spouse came home too tired to do some of the things they’d like them do or need them to do, that their spouse’s working hours interfered with their own ability to maintain connections and friendships in the community, and to disagree that their spouse seems relaxed most of the time at home. Broadly similar patterns emerged when comparing the partners of mine and energy workers who had no say, versus those with some say, over their working hours.
Table 1: Relationship between preferences-hours worked discrepancy amongst mining and energy workers and their partners’ views on various issues
Partner views: Spouse preferred to work fewer
hours
Spouse preferred to work same no
of hours
Often or almost always feel rushed or pressed for time 52 43
My spouse is often so emotionally drained when they get home from work that it prevents them from contributing to the family
44 28
After work, my spouse comes home too tired to do some of the things I’d like them do or need them to do
64 52
My spouse’s working hours interferes with my ability to maintain connections and friendships in the community
36 25
Disagree that: my spouse seems relaxed most of the time at home
40 25
Partner working night shifts make you anxious – often 28 19
Would prefer your spouse gave up working shifts and got day time job
50 32
N= 780 (prefer fewer hours), 596 (prefer same hours). Note: The term ‘partner’ used in the questionnaire has been replaced by ‘spouse’ in this table, to maintain consistency with our naming convention. All differences statistically significant at 5% level or higher. Source: Matched ACES partners and mine and energy workers surveys.
In a t-test applied to a scale measuring how happy partners were with their relationship, it was shown that partners of workers who had no say over their hours were less happy with their relationship than those whose spouses had some say over their hours.
10
Short-term illnesses
We gave respondents a long list of health problems and asked them to indicate which of these they had experienced in the last twelve months, regardless of whether or not they considered the illness or injury to be now cured or under control. Our focus is on a group of eight classed under a heading “short term problems”. The immune system acts to protect the body from organisms like bacteria, viruses, toxins and parasites,23 and relatively minor clinical symptoms can thus serve as indicators of immunosuppression.24 Those in our group of eight comprised: abdominal or stomach pain; cold or flu; constipation; diarrhea; ear ache; fainting; ‘headache (not migraine)’; and rash. We created an index of short-term illnesses – a simple count of how many out of the eight each respondent reported experiencing over the previous year – as well as analyzing illnesses individually.
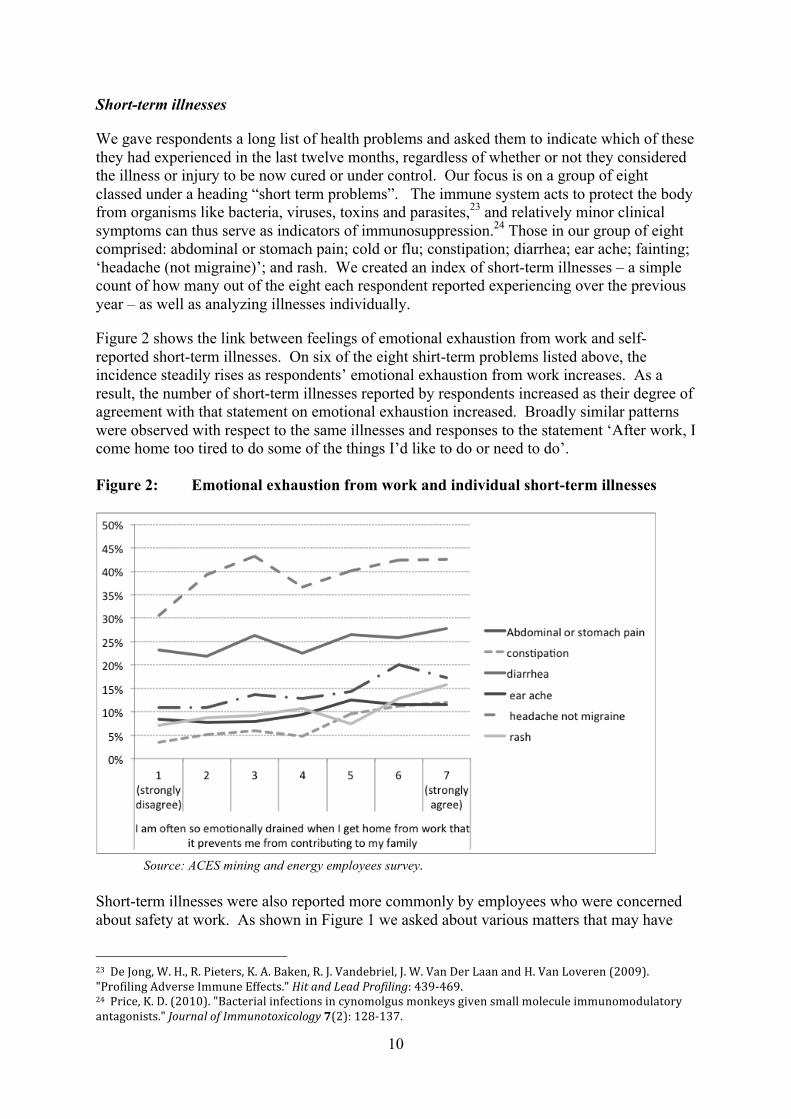
Figure 2 shows the link between feelings of emotional exhaustion from work and self-reported short-term illnesses. On six of the eight shirt-term problems listed above, the incidence steadily rises as respondents’ emotional exhaustion from work increases. As a result, the number of short-term illnesses reported by respondents increased as their degree of agreement with that statement on emotional exhaustion increased. Broadly similar patterns were observed with respect to the same illnesses and responses to the statement ‘After work, I come home too tired to do some of the things I’d like to do or need to do’. Figure 2: Emotional exhaustion from work and individual short-term illnesses
Source: ACES mining and energy employees survey.
Short-term illnesses were also reported more commonly by employees who were concerned about safety at work. As shown in Figure 1 we asked about various matters that may have
23 De Jong, W. H., R. Pieters, K. A. Baken, R. J. Vandebriel, J. W. Van Der Laan and H. Van Loveren (2009). "Profiling Adverse Immune Effects." Hit and Lead Profiling: 439-‐469. 24 Price, K. D. (2010). "Bacterial infections in cynomolgus monkeys given small molecule immunomodulatory antagonists." Journal of Immunotoxicology 7(2): 128-‐137.
11
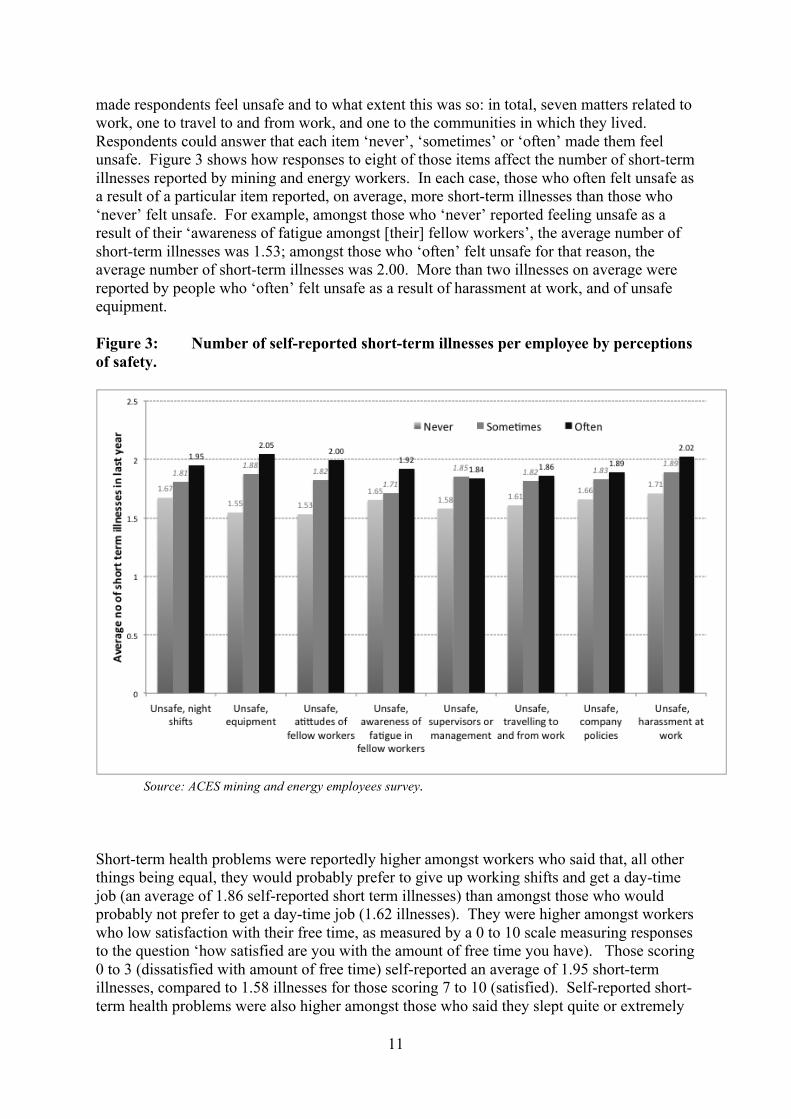
made respondents feel unsafe and to what extent this was so: in total, seven matters related to work, one to travel to and from work, and one to the communities in which they lived. Respondents could answer that each item ‘never’, ‘sometimes’ or ‘often’ made them feel unsafe. Figure 3 shows how responses to eight of those items affect the number of short-term illnesses reported by mining and energy workers. In each case, those who often felt unsafe as a result of a particular item reported, on average, more short-term illnesses than those who ‘never’ felt unsafe. For example, amongst those who ‘never’ reported feeling unsafe as a result of their ‘awareness of fatigue amongst [their] fellow workers’, the average number of short-term illnesses was 1.53; amongst those who ‘often’ felt unsafe for that reason, the average number of short-term illnesses was 2.00. More than two illnesses on average were reported by people who ‘often’ felt unsafe as a result of harassment at work, and of unsafe equipment. Figure 3: Number of self-reported short-term illnesses per employee by perceptions of safety.
Source: ACES mining and energy employees survey. Short-term health problems were reportedly higher amongst workers who said that, all other things being equal, they would probably prefer to give up working shifts and get a day-time job (an average of 1.86 self-reported short term illnesses) than amongst those who would probably not prefer to get a day-time job (1.62 illnesses). They were higher amongst workers who low satisfaction with their free time, as measured by a 0 to 10 scale measuring responses to the question ‘how satisfied are you with the amount of free time you have). Those scoring 0 to 3 (dissatisfied with amount of free time) self-reported an average of 1.95 short-term illnesses, compared to 1.58 illnesses for those scoring 7 to 10 (satisfied). Self-reported short-term health problems were also higher amongst those who said they slept quite or extremely
12
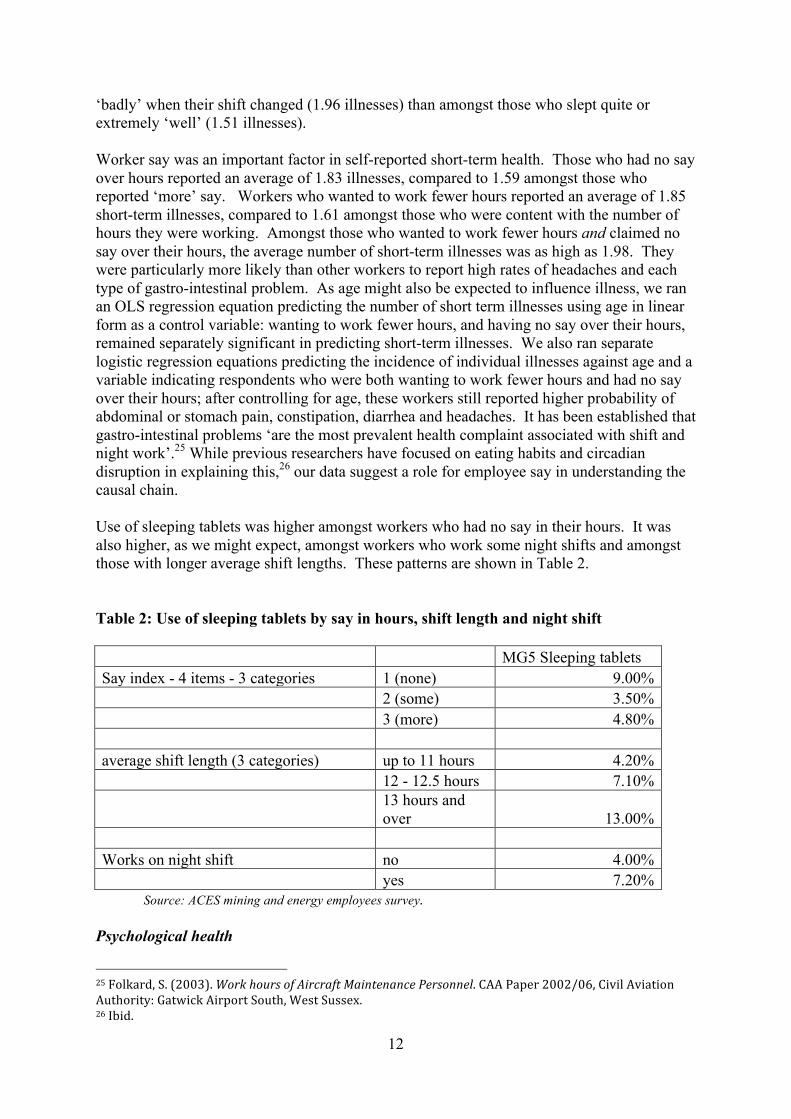
‘badly’ when their shift changed (1.96 illnesses) than amongst those who slept quite or extremely ‘well’ (1.51 illnesses). Worker say was an important factor in self-reported short-term health. Those who had no say over hours reported an average of 1.83 illnesses, compared to 1.59 amongst those who reported ‘more’ say. Workers who wanted to work fewer hours reported an average of 1.85 short-term illnesses, compared to 1.61 amongst those who were content with the number of hours they were working. Amongst those who wanted to work fewer hours and claimed no say over their hours, the average number of short-term illnesses was as high as 1.98. They were particularly more likely than other workers to report high rates of headaches and each type of gastro-intestinal problem. As age might also be expected to influence illness, we ran an OLS regression equation predicting the number of short term illnesses using age in linear form as a control variable: wanting to work fewer hours, and having no say over their hours, remained separately significant in predicting short-term illnesses. We also ran separate logistic regression equations predicting the incidence of individual illnesses against age and a variable indicating respondents who were both wanting to work fewer hours and had no say over their hours; after controlling for age, these workers still reported higher probability of abdominal or stomach pain, constipation, diarrhea and headaches. It has been established that gastro-intestinal problems ‘are the most prevalent health complaint associated with shift and night work’.25 While previous researchers have focused on eating habits and circadian disruption in explaining this,26 our data suggest a role for employee say in understanding the causal chain. Use of sleeping tablets was higher amongst workers who had no say in their hours. It was also higher, as we might expect, amongst workers who work some night shifts and amongst those with longer average shift lengths. These patterns are shown in Table 2. Table 2: Use of sleeping tablets by say in hours, shift length and night shift
MG5 Sleeping tablets
Say index - 4 items - 3 categories 1 (none) 9.00%
2 (some) 3.50%
3 (more) 4.80%
average shift length (3 categories) up to 11 hours 4.20%
12 - 12.5 hours 7.10%
13 hours and over 13.00%
Works on night shift no 4.00%
yes 7.20%
Source: ACES mining and energy employees survey. Psychological health
25 Folkard, S. (2003). Work hours of Aircraft Maintenance Personnel. CAA Paper 2002/06, Civil Aviation Authority: Gatwick Airport South, West Sussex. 26 Ibid.
13
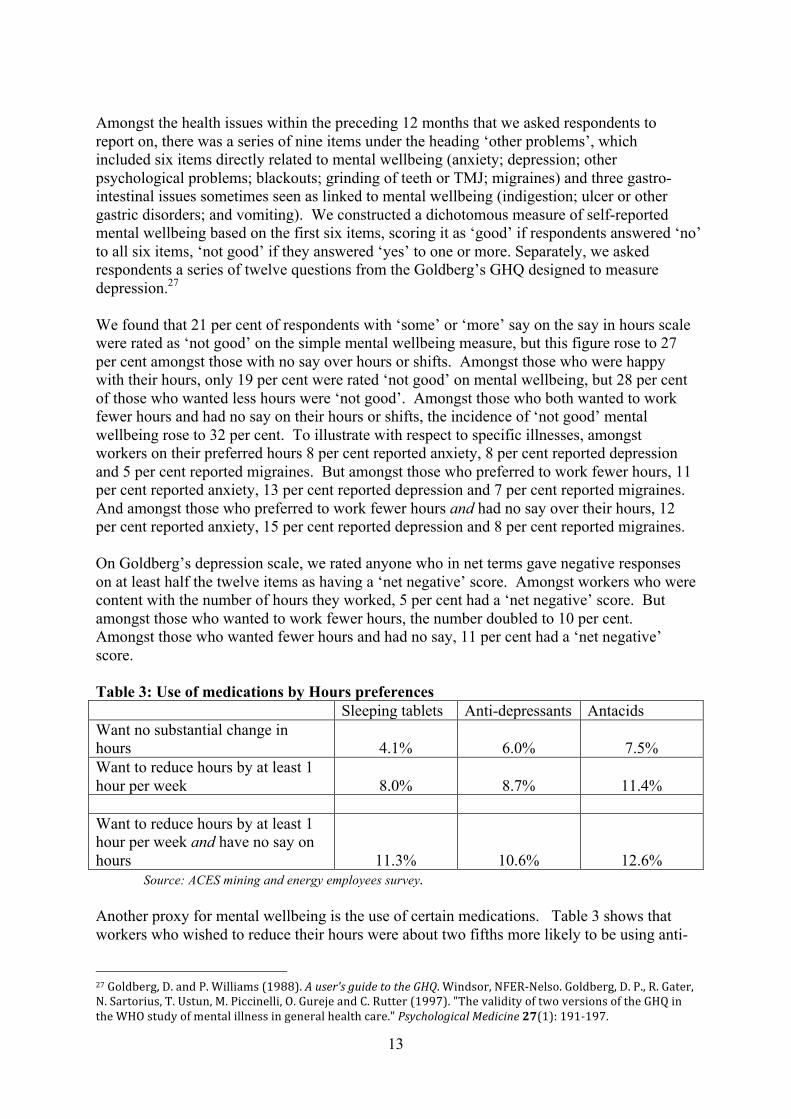
Amongst the health issues within the preceding 12 months that we asked respondents to report on, there was a series of nine items under the heading ‘other problems’, which included six items directly related to mental wellbeing (anxiety; depression; other psychological problems; blackouts; grinding of teeth or TMJ; migraines) and three gastro-intestinal issues sometimes seen as linked to mental wellbeing (indigestion; ulcer or other gastric disorders; and vomiting). We constructed a dichotomous measure of self-reported mental wellbeing based on the first six items, scoring it as ‘good’ if respondents answered ‘no’ to all six items, ‘not good’ if they answered ‘yes’ to one or more. Separately, we asked respondents a series of twelve questions from the Goldberg’s GHQ designed to measure depression.27 We found that 21 per cent of respondents with ‘some’ or ‘more’ say on the say in hours scale were rated as ‘not good’ on the simple mental wellbeing measure, but this figure rose to 27 per cent amongst those with no say over hours or shifts. Amongst those who were happy with their hours, only 19 per cent were rated ‘not good’ on mental wellbeing, but 28 per cent of those who wanted less hours were ‘not good’. Amongst those who both wanted to work fewer hours and had no say on their hours or shifts, the incidence of ‘not good’ mental wellbeing rose to 32 per cent. To illustrate with respect to specific illnesses, amongst workers on their preferred hours 8 per cent reported anxiety, 8 per cent reported depression and 5 per cent reported migraines. But amongst those who preferred to work fewer hours, 11 per cent reported anxiety, 13 per cent reported depression and 7 per cent reported migraines. And amongst those who preferred to work fewer hours and had no say over their hours, 12 per cent reported anxiety, 15 per cent reported depression and 8 per cent reported migraines. On Goldberg’s depression scale, we rated anyone who in net terms gave negative responses on at least half the twelve items as having a ‘net negative’ score. Amongst workers who were content with the number of hours they worked, 5 per cent had a ‘net negative’ score. But amongst those who wanted to work fewer hours, the number doubled to 10 per cent. Amongst those who wanted fewer hours and had no say, 11 per cent had a ‘net negative’ score. Table 3: Use of medications by Hours preferences Sleeping tablets Anti-depressants Antacids Want no substantial change in hours 4.1% 6.0% 7.5% Want to reduce hours by at least 1 hour per week 8.0% 8.7% 11.4% Want to reduce hours by at least 1 hour per week and have no say on hours 11.3% 10.6% 12.6%
Source: ACES mining and energy employees survey. Another proxy for mental wellbeing is the use of certain medications. Table 3 shows that workers who wished to reduce their hours were about two fifths more likely to be using anti-
27 Goldberg, D. and P. Williams (1988). A user's guide to the GHQ. Windsor, NFER-‐Nelso. Goldberg, D. P., R. Gater, N. Sartorius, T. Ustun, M. Piccinelli, O. Gureje and C. Rutter (1997). "The validity of two versions of the GHQ in the WHO study of mental illness in general health care." Psychological Medicine 27(1): 191-‐197.
14
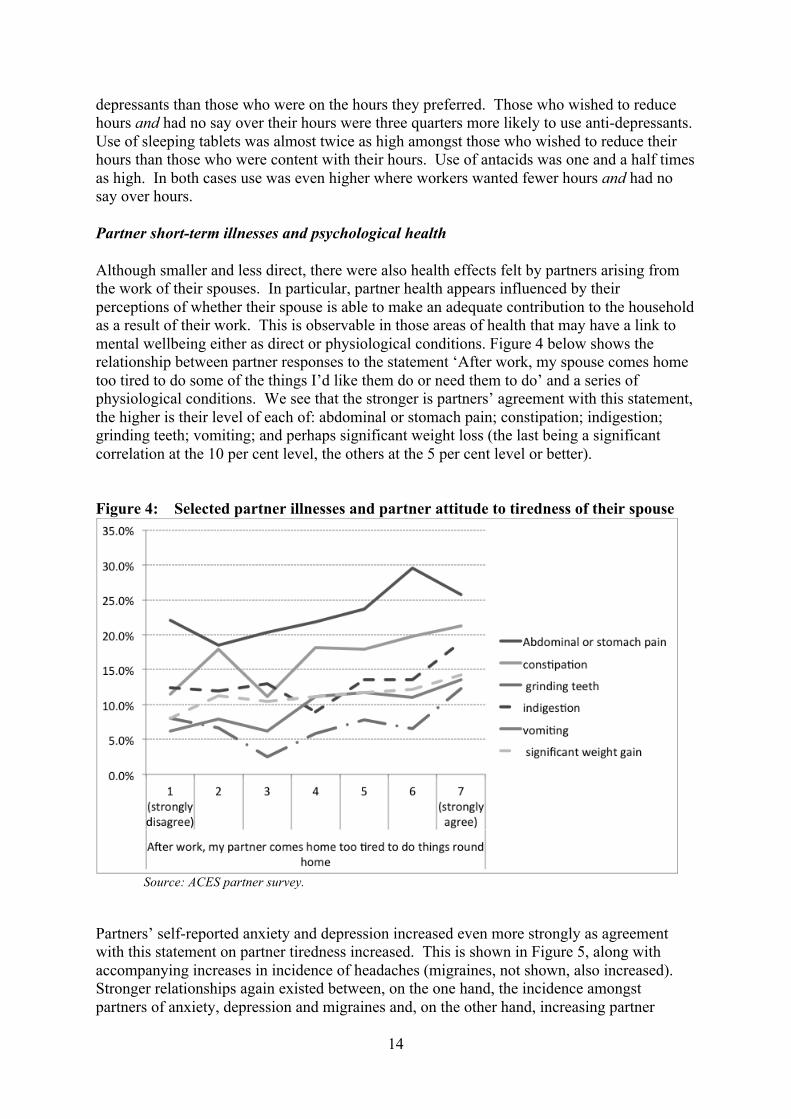
depressants than those who were on the hours they preferred. Those who wished to reduce hours and had no say over their hours were three quarters more likely to use anti-depressants. Use of sleeping tablets was almost twice as high amongst those who wished to reduce their hours than those who were content with their hours. Use of antacids was one and a half times as high. In both cases use was even higher where workers wanted fewer hours and had no say over hours. Partner short-term illnesses and psychological health Although smaller and less direct, there were also health effects felt by partners arising from the work of their spouses. In particular, partner health appears influenced by their perceptions of whether their spouse is able to make an adequate contribution to the household as a result of their work. This is observable in those areas of health that may have a link to mental wellbeing either as direct or physiological conditions. Figure 4 below shows the relationship between partner responses to the statement ‘After work, my spouse comes home too tired to do some of the things I’d like them do or need them to do’ and a series of physiological conditions. We see that the stronger is partners’ agreement with this statement, the higher is their level of each of: abdominal or stomach pain; constipation; indigestion; grinding teeth; vomiting; and perhaps significant weight loss (the last being a significant correlation at the 10 per cent level, the others at the 5 per cent level or better). Figure 4: Selected partner illnesses and partner attitude to tiredness of their spouse
Source: ACES partner survey.
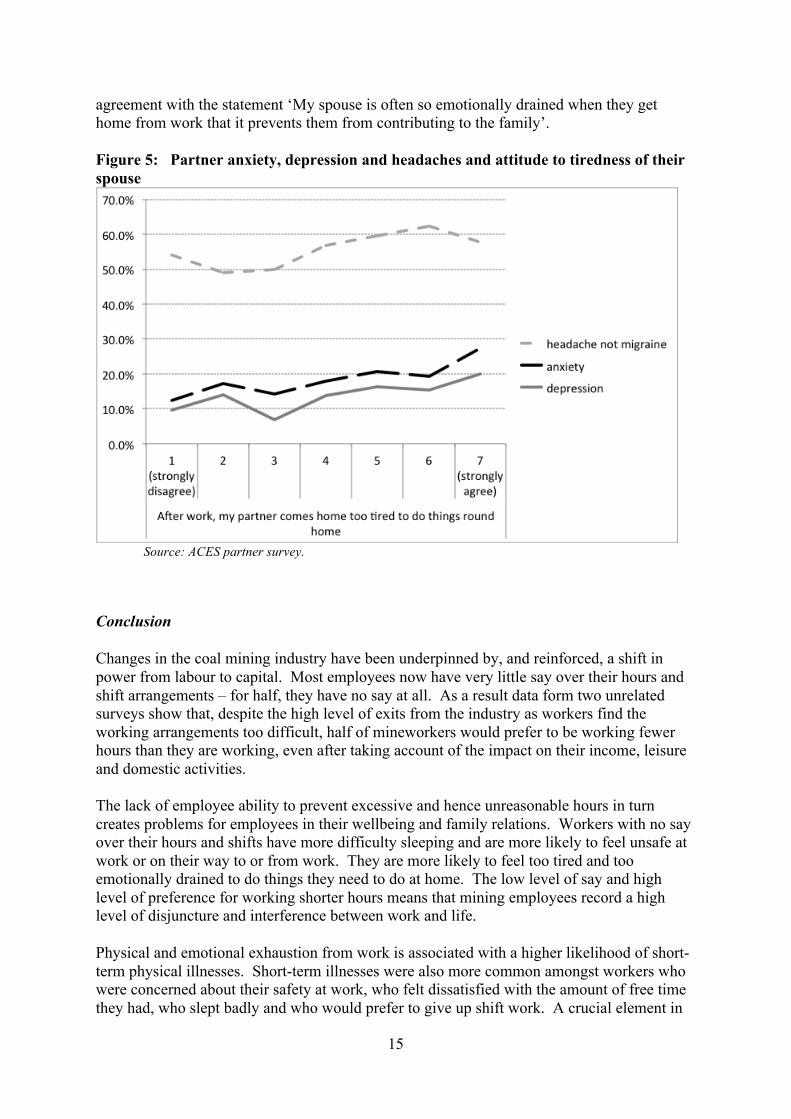
Partners’ self-reported anxiety and depression increased even more strongly as agreement with this statement on partner tiredness increased. This is shown in Figure 5, along with accompanying increases in incidence of headaches (migraines, not shown, also increased). Stronger relationships again existed between, on the one hand, the incidence amongst partners of anxiety, depression and migraines and, on the other hand, increasing partner
15
agreement with the statement ‘My spouse is often so emotionally drained when they get home from work that it prevents them from contributing to the family’. Figure 5: Partner anxiety, depression and headaches and attitude to tiredness of their spouse
Source: ACES partner survey.
Conclusion Changes in the coal mining industry have been underpinned by, and reinforced, a shift in power from labour to capital. Most employees now have very little say over their hours and shift arrangements – for half, they have no say at all. As a result data form two unrelated surveys show that, despite the high level of exits from the industry as workers find the working arrangements too difficult, half of mineworkers would prefer to be working fewer hours than they are working, even after taking account of the impact on their income, leisure and domestic activities. The lack of employee ability to prevent excessive and hence unreasonable hours in turn creates problems for employees in their wellbeing and family relations. Workers with no say over their hours and shifts have more difficulty sleeping and are more likely to feel unsafe at work or on their way to or from work. They are more likely to feel too tired and too emotionally drained to do things they need to do at home. The low level of say and high level of preference for working shorter hours means that mining employees record a high level of disjuncture and interference between work and life. Physical and emotional exhaustion from work is associated with a higher likelihood of short-term physical illnesses. Short-term illnesses were also more common amongst workers who were concerned about their safety at work, who felt dissatisfied with the amount of free time they had, who slept badly and who would prefer to give up shift work. A crucial element in
16
this was worker say. The incidence of short term illnesses – particularly headaches and gastro-intestinal problems – was particularly high amongst workers with no say over their hours who would prefer to be working fewer hours per week, even after controlling for age effects. Psychological health also appears lower amongst workers who wanted to work fewer hours and who had no say over their hours. They reported higher incidences of anxiety and depression and appeared more likely to have a ‘net negative’ score under Goldman’s (1997) ‘depression’ scale. They appeared more likely to be using sleeping tablets, antacids and anti-depressants. The effects of lack of say on work-life interference are experienced not just by mineworkers but also by their partners, who are also more likely to report their spouses as too tired or emotionally drained to function properly in the household. As their agreement with these statements increased so too did the incidence of a number of self-reported short-term illnesses, as did their self-reporting of anxiety and depression. A sense of efficacy or control is important for personal wellbeing and our work indicates that this is no less so when it comes to control at work. The shifts in power and hence working arrangements in the coal industry have withheld that sense of efficacy from many workers and a number of pathologies appear to have arisen in consequence. References Adan, A. and H. Almirall (1991). "Horne & Östberg morningness-eveningness questionnaire:
A reduced scale." Personality and Individual differences(12): 3. Allen, C., R. Loudon and D. Peetz (2005). "influences on work/non work conflict." Journal
of Sociology 43: 219-239. Australian Bureau of Statistics (4102.0). Towns of the mineral boom. Australian Social
Trends 2008, . Canberra. Australian Bureau of Statistics (6306.0). Employee Earnings and Hours, Australia. Canberra. Barton, J., E. Spelten, P. Totterdell, L. Smith, S. Folkard and G. Costa (1995). "The Standard
Shiftwork Index: a battery of questionnaires for assessing shiftwork-related problems." Work & Stress 9(1): 4-30.
De Jong, W. H., R. Pieters, K. A. Baken, R. J. Vandebriel, J. W. Van Der Laan and H. Van Loveren (2009). "Profiling Adverse Immune Effects." Hit and Lead Profiling: 439-469.
Di Milia, L. and B. Bowden (2007). "Unanticipated safety outcome drive in and drive out workforces in Queensland Bowen Basin " Asia Pacific Journal of Human Resources 45: 110-115.
European Values Study Group and World Values Survey Association (2006). European and World Values Surveys: Four Wave Integrated Data File, 1981-2004,. v.20060423.
Folkard, S. (2003). Work hours of Aircraft Maintenance Personnel. CAA Paper 2002/06, Civil Aviation Authority: Gatwick Airport South, West Sussex.
Goldberg, D. and P. Williams (1988). A user's guide to the GHQ. Windsor, NFER-Nelso.
17
Goldberg, D. P., R. Gater, N. Sartorius, T. Ustun, M. Piccinelli, O. Gureje and C. Rutter (1997). "The validity of two versions of the GHQ in the WHO study of mental illness in general health care." Psychological Medicine 27(1): 191-197.
Goodman, R. (1997). "The Strengths and Difficulties Questionnaire: A Research Note." Journal of Child Psychology and Psychiatry 38(5): 581-86.
Gutek, B. A., S. Searle and L. Klepa (1991). "Rational versus gender role explanations for work-family conflict." Journal of Applied Psychology 76(4 ): 560.
Hunsley, J., M. Best, M. Lefebvre and D. Vito (2001). "The seven-item short form of the Dyadic Adjustment Scale: Further evidence for construct validity." American Journal of Family Therapy 29(4): 325-335.
Murray, G. and D. Peetz (2010). Women of the Coal Rushes. Sydney, University of NSW Press.
Peetz, D. and G. Murray (2011). "'You Get Really Old, Really Quick': Involuntary Long Hours in the Mining Industry." Journal of Industrial Relations 53(1): 13-29.
Peetz, D., K. Townsend, R. Russell, C. Houghton, A. Fox and C. Allan (2003). "Race Against Time: Extended Hours in Australia." Australian Bulletin of Labour 29(2): 126-142.
Pocock, B. and N. Skinner (2009). The Australian Work and Life Index (AWALI), Centre for Work + Life,, U. o. S. Australia. <http://www.unisa.edu.au/hawkeinstitute/cwl/default.asp%3E.
Pocock, B., N. Skinner and R. Ichii (2009). Work, Life & Workplace Flexibility: The Australian Work and Life Index 2009, Centre for Work + Life, University of South Australia: Adelaide.
Price, K. D. (2010). "Bacterial infections in cynomolgus monkeys given small molecule immunomodulatory antagonists." Journal of Immunotoxicology 7(2): 128-137.
Skinner, N. and B. Pocock (2008). Work, Life & Workplace Culture: The Australian Work and Life Index 2008, Centre for Work + Life, University of South Australia: Adelaide.
Waring, P. and M. Barry (2001). "The changing frontier of control in coal: evidence from a decade of enterprise bargaining in the Australian black coal mining industry." Australian Bulletin of Labour 27(3): 216-237.
Watson, D. and J. W. Pennebaker (1989). "Health complaints, stress, and distress: Exploring the central role of negative affectivity." Psychological review 96(2): 234.
Watson, N. and M. Wooden (2002). The Household, Income and Labour Dynamics in Australia (HILDA) Survey: Wave 1 Survey Methodology. HILDA Project Technical Paper Series No. 1/02, Melbourne Institute of Applied Economic and Social Research, University of Melbourne.