THE IMPACT OF WINE COMPONENTS ON THE CHEMICAL
135
THE IMPACT OF WINE COMPONENTS ON THE CHEMICAL AND SENSORY PROPERTIES OF WINES By REMEDIOS R. VILLAMOR A dissertation submitted in partial fulfillment of the requirements for the degree of DOCTOR OF PHILOSOPHY WASHINGTON STATE UNIVERSITY School of Food Science MAY 2012
Transcript of THE IMPACT OF WINE COMPONENTS ON THE CHEMICAL

THE IMPACT OF WINE COMPONENTS ON THE CHEMICAL
AND SENSORY PROPERTIES OF WINES
By
REMEDIOS R. VILLAMOR
A dissertation submitted in partial fulfillment of
the requirements for the degree of
DOCTOR OF PHILOSOPHY
WASHINGTON STATE UNIVERSITY
School of Food Science
MAY 2012

ii
To the Faculty of Washington State University:
The members of the Committee appointed to examine the dissertation of
REMEDIOS R. VILLAMOR find it satisfactory and recommend that it be accepted.
________________________________________
Carolyn F. Ross, Ph.D., Chair
________________________________________
Charles G. Edwards, Ph.D.
________________________________________
James F. Harbertson, Ph.D.
________________________________________
Marc A. Evans, Ph.D.
iii
DEDICATION
Soli Deo gloria
iv
ACKNOWLEDGMENTS
I would like to express my deepest gratitude to my advisor, Dr. Carolyn F. Ross, who gave
me this rare opportunity to work on wine research project. I am grateful for her sincere
commitment in offering invaluable support, advice and motivation during the course of the study.
Deepest gratitude is also due to the members of my committee, Dr. Charles G. Edwards, Dr.
James F. Harbertson and Dr. Marc A. Evans, without whose helpful technical assistance, this
study would not have been completed.
Special thanks go to the faculty members of the School of Food Science, for always being
available for consultation: Dr. Jeffri Bohlscheid, Dr. Joseph Powers, and Dr. Boon Chew to name
a few. I would also like to convey thanks to the administrative and program staff for their patience
in dealing with my seemingly endless educational and research policy inquiries: Jodi Anderson,
Carolee Armfield, Marsha Appel, Rich Hoeft, and Barbara Smith.
I would also like to thank my Sensory Lab family for helping me accomplish my research
work in one way or another and most importantly, for the friendship: Karen Weller, Tina Plotka-
Rodriguez, Andrea Chauvin, Ozlem Ladd, Maria Rosales, Beata Vixie, Laura Hill, Luan Weekes,
Melissa Sanborn, Josie Landon, Luis Castro, Clifford Hoye, Allison Beall, Sarah Michaux, Emily
Goodstein, Nissa Molestad, Anne Secor, Megan Waldrop, and Allison Baker. Thanks to Andrea,
Ozlem and Anne, for being one-of-a kind officemates.
The moral support of all my Filipino friends in Pullman is also gratefully acknowledged.
Finally, I wish to express my love and gratitude to my husband, Dan Edward Villamor,
and to my beloved family, my dad, Raul Rivera, my mom, Levina Rivera, and my siblings, Rio
Gonzales, Rea Solomon and Ramil Rivera, for their simple acts of charity as they constantly
prayed for the successful completion of this dissertation.

v
THE IMPACT OF WINE COMPONENTS ON THE CHEMICAL
AND SENSORY PROPERTIES OF WINES
Abstract
By Remedios R. Villamor, Ph.D.
Washington State University
May 2012
Chair: Carolyn F. Ross
The wine matrix includes a variety of compounds that influence wine quality. The overall
objective of this study was to examine the relationship between the matrix components and
sensory attributes of wine. To address the issue on wine quality as related to tannin and polymeric
pigments, the effect of initial tannin concentration, storage time and temperature on chemical and
sensory properties of young bottled Cabernet Sauvignon and Merlot wines was studied. In
general, storage treatment resulted in a significant increase in small polymeric pigment (SPP)
with a decrease in anthocyanin (p ≤ 0.05). Tannin concentration was directly related to large
polymeric pigment (LPP) and correlated with perceived astringency. Increased perceived
bitterness was associated with storage at 32ºC for 70 days. In addition to tannin content, further
experiments investigated the interaction of tannin with ethanol and fructose concentrations on the
headspace concentration of eight odorants in model wine. In general, increased tannin
concentration exhibited an enhancement effect while fructose induced a retention effect, both of
which were largely dependent upon ethanol concentration. The net magnitude effect was a
reduction in the odorants’ headspace concentration dominated by ethanol. Odor detection
thresholds increased between 2 and 10,000-fold, lowering the odor unit values (OUV). The
impact of ethanol, tannin and fructose concentrations on the sensory properties of model red

vi
wines was also evaluated. Principal component analysis (PCA) differentiated the model wines
based on PC 1 (floral, fruity and caramel), PC 2 (earthy and herbaceous) and PC 3 (sulfur, spicy,
woody, and bitterness). Analysis of variance (ANOVA) results showed a significant impact of
ethanol concentration on these principal components (p ≤ 0.05). Tannin and fructose, and all
interaction effects were not significant. These results highlighted the influence of major wine
components and their interactions on sensory perception. Viticulturists and winemakers are
suggested to consider the information obtained in this research when making decisions to
optimize wine quality.

vii
TABLE OF CONTENTS
DEDICATION . . . . . . . . . . . . . . . . . . . . . . . . . . . . . . . . . . . . . . . . . . . . . . . . . . . . . . . . . . . . . . . . iii
ACKNOWLEDGMENTS . . . . . . . . . . . . . . . . . . . . . . . . . . . . . . . . . . . . . . . . . . . . . . . . . . . . . . . .iv
ABSTRACT . . . . . . . . . . . . . . . . . . . . . . . . . . . . . . . . . . . . . . . . . . . . . . . . . . . . . . . . . . . . . . . . . . .v
LIST OF TABLES . . . . . . . . . . . . . . . . . . . . . . . . . . . . . . . . . . . . . . . . . . . . . . . . . . . . . . . . . . . . . .x
LIST OF FIGURES . . . . . . . . . . . . . . . . . . . . . . . . . . . . . . . . . . . . . . . . . . . . . . . . . . . . . . . . . . . . .xi
CHAPTER I. INTRODUCTION . . . . . . . . . . . . . . . . . . . . . . . . . . . . . . . . . . . . . . . . . . . . . . . . . . . 1
Literature Cited . . . . . . . . . . . . . . . . . . . . . . . . . . . . . . . . . . . . . . . . . . . . . . . . . . . . . . . . . . 5
CHAPTER II. LITERATURE REVIEW . . . . . . . . . . . . . . . . . . . . . . . . . . . . . . . . . . . . . . . . . . . . .8
Wine Quality . . . . . . . . . . . . . . . . . . . . . . . . . . . . . . . . . . . . . . . . . . . . . . . . . . . . . . . . . . . . 8
Wine Components and Wine Quality . . . . . . . . . . . . . . . . . . . . . . . . . . . . . . . . . . . . . . . . . 9
Phenolic compounds . . . . . . . . . . . . . . . . . . . . . . . . . . . . . . . . . . . . . . . . . . . . . . . . . 9
Sugars . . . . . . . . . . . . . . . . . . . . . . . . . . . . . . . . . . . . . . . . . . . . . . . . . . . . . . . . . . . .11
Polysaccharides . . . . . . . . . . . . . . . . . . . . . . . . . . . . . . . . . . . . . . . . . . . . . . . . . . . . 11
Proteins . . . . . . . . . . . . . . . . . . . . . . . . . . . . . . . . . . . . . . . . . . . . . . . . . . . . . . . . . . 13
Acids . . . . . . . . . . . . . . . . . . . . . . . . . . . . . . . . . . . . . . . . . . . . . . . . . . . . . . . . . . . . .14
Volatile compounds . . . . . . . . . . . . . . . . . . . . . . . . . . . . . . . . . . . . . . . . . . . . . . . . . 15
Studies on Wine Matrix Effects on Wine Volatiles . . . . . . . . . . . . . . . . . . . . . . . . . . . . . 25
Effect of ethanol . . . . . . . . . . . . . . . . . . . . . . . . . . . . . . . . . . . . . . . . . . . . . . . . . . . . 25
Effect of phenolic compounds . . . . . . . . . . . . . . . . . . . . . . . . . . . . . . . . . . . . . . . . . 29
Effect of polysaccharides . . . . . . . . . . . . . . . . . . . . . . . . . . . . . . . . . . . . . . . . . . . . . 32
Higher Order Interaction Effects Between Wine Components and
Aroma Compounds . . . . . . . . . . . . . . . . . . . . . . . . . . . . . . . . . . . . . . . . . . . . . . . . . . . . . .34
Literature Cited . . . . . . . . . . . . . . . . . . . . . . . . . . . . . . . . . . . . . . . . . . . . . . . . . . . . . . . . .36
CHAPTER III. INFLUENCE OF TANNIN CONCENTRATION, STORAGE
TEMPERAURE, AND TIME ON CHEMICAL AND SENSORY PROPERTIES
OF CABERNET SAUVIGNON AND MERLOT WINES . . . . . . . . . . . . . . . . . . . . . . . . . . . . . . 48
Abstract . . . . . . . . . . . . . . . . . . . . . . . . . . . . . . . . . . . . . . . . . . . . . . . . . . . . . . . . . . . . . . .48
Introduction . . . . . . . . . . . . . . . . . . . . . . . . . . . . . . . . . . . . . . . . . . . . . . . . . . . . . . . . . . . .49
Materials and Methods . . . . . . . . . . . . . . . . . . . . . . . . . . . . . . . . . . . . . . . . . . . . . . . . . . . 50
Wine samples and procedures . . . . . . . . . . . . . . . . . . . . . . . . . . . . . . . . . . . . . . . . . .50
Chemical analyses . . . . . . . . . . . . . . . . . . . . . . . . . . . . . . . . . . . . . . . . . . . . . . . . . . .51

viii
Sensory training and evaluation . . . . . . . . . . . . . . . . . . . . . . . . . . . . . . . . . . . . . . . . 53
Data analysis . . . . . . . . . . . . . . . . . . . . . . . . . . . . . . . . . . . . . . . . . . . . . . . . . . . . . . 55
Results . . . . . . . . . . . . . . . . . . . . . . . . . . . . . . . . . . . . . . . . . . . . . . . . . . . . . . . . . . . . . . . 55
Anthocyanins . . . . . . . . . . . . . . . . . . . . . . . . . . . . . . . . . . . . . . . . . . . . . . . . . . . . . . 55
Small polymeric pigments . . . . . . . . . . . . . . . . . . . . . . . . . . . . . . . . . . . . . . . . . . . . 58
Large polymeric pigments . . . . . . . . . . . . . . . . . . . . . . . . . . . . . . . . . . . . . . . . . . . .58
Tannin . . . . . . . . . . . . . . . . . . . . . . . . . . . . . . . . . . . . . . . . . . . . . . . . . . . . . . . . . . . 61
Titratable acidity and pH . . . . . . . . . . . . . . . . . . . . . . . . . . . . . . . . . . . . . . . . . . . . . 61
Sensory analyses . . . . . . . . . . . . . . . . . . . . . . . . . . . . . . . . . . . . . . . . . . . . . . . . . . . 61
Relationships between chemical and sensory variables . . . . . . . . . . . . . . . . . . . . . .66
Discussion . . . . . . . . . . . . . . . . . . . . . . . . . . . . . . . . . . . . . . . . . . . . . . . . . . . . . . . . . . . . 68
Conclusion . . . . . . . . . . . . . . . . . . . . . . . . . . . . . . . . . . . . . . . . . . . . . . . . . . . . . . . . . . . . 69
Acknowledgments . . . . . . . . . . . . . . . . . . . . . . . . . . . . . . . . . . . . . . . . . . . . . . . . . . . . . . 70
Literature Cited . . . . . . . . . . . . . . . . . . . . . . . . . . . . . . . . . . . . . . . . . . . . . . . . . . . . . . . . 70
CHAPTER IV. EFFECTS OF ETHANOL, TANNIN AND FRUCTOSE ON THE
HEADSPACE CONCENTRATION AND POTENTIAL SENSORY SIGNIFICANCE
OF ODORANTS IN MODEL WINES . . . . . . . . . . . . . . . . . . . . . . . . . . . . . . . . . . . . . . . . . . . . . 73
Abstract . . . . . . . . . . . . . . . . . . . . . . . . . . . . . . . . . . . . . . . . . . . . . . . . . . . . . . . . . . . . . . 73
Introduction . . . . . . . . . . . . . . . . . . . . . . . . . . . . . . . . . . . . . . . . . . . . . . . . . . . . . . . . . . . 73
Materials and Methods . . . . . . . . . . . . . . . . . . . . . . . . . . . . . . . . . . . . . . . . . . . . . . . . . . .76
Chemicals and reagents . . . . . . . . . . . . . . . . . . . . . . . . . . . . . . . . . . . . . . . . . . . . . . 76
Model wine preparation . . . . . . . . . . . . . . . . . . . . . . . . . . . . . . . . . . . . . . . . . . . . . .76
HS-SPME/ GC-MS analysis . . . . . . . . . . . . . . . . . . . . . . . . . . . . . . . . . . . . . . . . . . 78
Odor threshold and odor unit value (OUV) determination . . . . . . . . . . . . . . . . . . . 79
GC-O analysis . . . . . . . . . . . . . . . . . . . . . . . . . . . . . . . . . . . . . . . . . . . . . . . . . . . . . 79
Statistical data analysis . . . . . . . . . . . . . . . . . . . . . . . . . . . . . . . . . . . . . . . . . . . . . . 80
Results and Discussion . . . . . . . . . . . . . . . . . . . . . . . . . . . . . . . . . . . . . . . . . . . . . . . . . . 81
Matrix effects . . . . . . . . . . . . . . . . . . . . . . . . . . . . . . . . . . . . . . . . . . . . . . . . . . . . . .81
PCA analysis . . . . . . . . . . . . . . . . . . . . . . . . . . . . . . . . . . . . . . . . . . . . . . . . . . . . . . 96
Effects on threshold and odor unit values . . . . . . . . . . . . . . . . . . . . . . . . . . . . . . . . 96
Acknowledgments . . . . . . . . . . . . . . . . . . . . . . . . . . . . . . . . . . . . . . . . . . . . . . . . . . . . . 101
Literature Cited . . . . . . . . . . . . . . . . . . . . . . . . . . . . . . . . . . . . . . . . . . . . . . . . . . . . . . . 101
ix
CHAPTER V. SENSORY IMPACT OF INTERACTIONS AMONG ETHANOL,
TANNIN AND FRUCTOSE IN A MODEL RED WINE . . . . . . . . . . . . . . . . . . . . . . . . . . . . . .105
Abstract . . . . . . . . . . . . . . . . . . . . . . . . . . . . . . . . . . . . . . . . . . . . . . . . . . . . . . . . . . . . . 105
Introduction . . . . . . . . . . . . . . . . . . . . . . . . . . . . . . . . . . . . . . . . . . . . . . . . . . . . . . . . . . 106
Materials and Methods . . . . . . . . . . . . . . . . . . . . . . . . . . . . . . . . . . . . . . . . . . . . . . . . . .107
Model wine samples . . . . . . . . . . . . . . . . . . . . . . . . . . . . . . . . . . . . . . . . . . . . . . . .107
Sensory evaluation . . . . . . . . . . . . . . . . . . . . . . . . . . . . . . . . . . . . . . . . . . . . . . . . .108
Statistical analysis . . . . . . . . . . . . . . . . . . . . . . . . . . . . . . . . . . . . . . . . . . . . . . . . . 111
Results and Discussion . . . . . . . . . . . . . . . . . . . . . . . . . . . . . . . . . . . . . . . . . . . . . . . . . 112
Correlation and principal component analysis (PCA) . . . . . . . . . . . . . . . . . . . . . . 112
Impact of ethanol, tannin and fructose . . . . . . . . . . . . . . . . . . . . . . . . . . . . . . . . . .115
Conclusions . . . . . . . . . . . . . . . . . . . . . . . . . . . . . . . . . . . . . . . . . . . . . . . . . . . . . . . . . . 118
Acknowledgments . . . . . . . . . . . . . . . . . . . . . . . . . . . . . . . . . . . . . . . . . . . . . . . . . . . . . 119
Literature Cited . . . . . . . . . . . . . . . . . . . . . . . . . . . . . . . . . . . . . . . . . . . . . . . . . . . . . . . 119
CHAPTER VI. CONCLUSIONS AND RECOMMENDATIONS. . . . . . . . . . . . . . . . . . . . . . . .121

x
LIST OF TABLES
Page
Table 1. Composition of Cabernet Sauvignon and Merlot wines at bottling . . . . . . . . . . . . . . . 52
Table 2. F-values from the analysis of variance (ANOVA) of protein
precipitation assay data in Cabernet Sauvignon and Merlot wines . . . .. . . .. . . . . . . . .56
Table 3. F-values from the analysis of variance (ANOVA) of the trained
panel data for astringency, bitterness and alcohol burn sensory
perceptions in Cabernet Sauvignon and Merlot wines . . . . . . . . .. . . . . . . . . . . . . . . . 63
Table 4. Correlation coefficients between wine chemical and
sensory characteristics . . . . . . . . . . . . . . . . . . . . . . . . . . . . . . . . . . . . . . . . . . . . . . . . . 67
Table 5. Physicochemical and sensory properties of eight odorants
used in the study . . . . . . . . . . . . . . . . . . . . . . . . . . . . . . . . . . . . . . . . . . . . . . . . . . . . . .77
Table 6. Statistical significance of the influence of interactions
of ethanol, tannin, fructose . . . . . . . . . . . . . . . . . . . . . . . . . . . . . . . . . . . . . . . . . . . . . .82
Table 7. Odor thresholds of aroma compounds in different
model wine solutions . . . . . . . . . . . . . . . . . . . . . . . . . . . . . . . . . . . . . . . . . . . . . . . . . . 88
Table 8. Log odor unit values (OUV) of aroma compounds in
different model wine solutions . . . . . . . . . . . . . . . . . . . . . . . . . . . . . . . . . . . . . . . . . .100
Table 9. Physico-chemical and sensory properties of odorants
used in the study . . . . . . . . . . . . . . . . . . . . . . . . . . . . . . . . . . . . . . . . . . . . . . . . . . . . 109
Table 10. Aroma, flavor, taste and mouthfeel reference standards and
their corresponding intensity ratings used during panel training . . . . . . . . . . . . . . . .110
Table 11. Significant correlations found between sensory descriptors . . . . . . . . . . . . . . . . . . . 113
Table 12. F-ratios, probability values and mean square error from the
analysis of variance (ANOVA) results for the factor scores data of
the three principal components (PC) . . . . . . . . . . . . . . . . . . . . . . . . . . . . . . . . . . . . . 116

xi
LIST OF FIGURES
Page
Figure 1. Mean concentration of anthocyanins in heat-treated, low and high tannin
content wines stored for 40, 55 and 70 days: (a) Cabernet Sauvignon,
n=24 and (b) Merlot, n=24 .. . . . . . . . . . . . . . . . . . . . . . . . . . . . . . . . . . . . . . . . . . . . . 57
Figure 2. Mean concentration of small polymeric pigment (SPP) in heat-treated, low
and high tannin content wines stored for 40, 55 and 70 days: (a) Cabernet
Sauvignon, n=24 and (b) Merlot, n=24 ... . . . . . . . . . . . . . . . . . . . . . . . . . . . . . . . . . . 59
Figure 3. Mean concentration of large polymeric pigment (LPP) in heat-treated, low
and high tannin content wines stored for 40, 55 and 70 days: (a) Cabernet
Sauvignon, n=24 and (b) Merlot, n=24 ... . . . . . . . . . . . . . . . . . . . . . . . . . . . . . . . . . . 60
Figure 4. Changes in tannin concentration following heat treatment at either 27C or
32C and storage for 40, 55 and 70 days: (a) Cabernet Sauvignon, n=24
and (b) Merlot, n=24 . . . . . . . . . . . . . . . . . . . . . . . . . . . . . . . . . . . . . . . . . . . . . . . . . . 62
Figure 5. Perceived astringency ratings (on a 15-cm line scale) of heat-treated, low
and high tannin wines after storage for 40, 55 and 70 days evaluated by
the trained panel, n=21: (a) Cabernet Sauvignon and (b) Merlot . . . . . . . . . . . . . . . .64
Figure 6. Concentrations of 3-methyl-1-butanol from model wines with different
ethanol, tannin and fructose concentrations (a) low fructose (b) high
fructose, extracted using headspace SPME with a PDMS/DVB coated
fiber . . . . . . . . . . . . . . . . . . . . . . . . . . . . . . . . . . . . . . . . . . . . . . . . . . . . . . . . . . . . . . . 84
Figure 7. Concentrations of dimethyl disulfide from model wines with different
ethanol, tannin and fructose concentrations (a) low fructose (b) high
fructose, extracted using headspace SPME with a PDMS/DVB coated
fiber . . . . . . . . . . . . . . . . . . . . . . . . . . . . . . . . . . . . . . . . . . . . . . . . . . . . . . . . . . . . . . . 86
Figure 8. Concentrations of 1-hexanol from model wines with different ethanol,
tannin and fructose concentrations (a) low fructose (b) high fructose,
extracted using headspace SPME with a PDMS/DVB coated fiber . . . . . . . . . . . . . . 87
Figure 9. Concentrations of 1-octen-3-one from model wines with different ethanol,
tannin and fructose concentrations (a) low fructose (b) high fructose,
extracted using headspace SPME with a PDMS/DVB coated fiber ... . . . . . . . . . . . . 88
Figure 10. Concentrations of 2-methoxyphenol from model wines with different
ethanol, tannin and fructose concentrations (a) low fructose (b) high
fructose, extracted using headspace SPME with a PDMS/DVB coated
fiber . . . . . . . . . . . . . . . . . . . . . . . . . . . . . . . . . . . . . . . . . . . . . . . . . . . . . . . . . . . . . . . 90

xii
Page
Figure 11. Concentrations of 2-phenylethanol from model wines with different
ethanol, tannin and fructose concentrations (a) low fructose (b) high
fructose, extracted using headspace SPME with a PDMS/DVB coated
fiber . . . . . . . . . . . . . . . . . . . . . . . . . . . . . . . . . . . . . . . . . . . . . . . . . . . . . . . . . . . . . . . 91
Figure 12. Concentrations of eugenol from model wines with different ethanol,
tannin and fructose concentrations (a) low fructose (b) high fructose,
extracted using headspace SPME with a PDMS/DVB coated fiber . . . . . . . . . . . . . . 92
Figure 13. Concentrations of β-dmascenone from model wines with different ethanol,
tannin and fructose concentrations (a) low fructose (b) high fructose,
extracted using headspace SPME with a PDMS/DVB coated fiber ... . . . . . . . . . . . . 94
Figure 14. Principal component analysis showing the relationships among odorants
and model wines . . . . . . . . . . . . . . . . . . . . . . . . . . . . . . . . . . . . . . . . . . . . . . . . . . . . . 97
Figure 15. Principal component analysis plot of model red wine sensory attributes
projected on PC 1 and 2, and PC 1 and 3 with VARIMAX rotation .. . . . . . . . . . . . 114
Figure 16. Impact of ethanol concentration on the sensory attributes of model red
wines grouped as PC 1 (floral, fruity, caramel notes), PC 2 (earthy,
herbaceous notes) and PC 3 (sulfur, spicy, woody notes, bitterness) ... . . . . . . . . . . 117

1
CHAPTER I
INTRODUCTION
Over the last three decades, the production and consumption of United States (US) wines
have demonstrated a consistent growth. The total economic impact of the wine industry reached
estimated 4.7 billion dollars with Washington State contributing more than 3 billion dollars
(MKF Research LLC 2007). However, despite this satisfactory performance, the demand to
maintain production of wines with consistent quality continues to be one increasingly important
challenge for the producers. Given the fast changing global wine trends and highly competitive
market today, there is a pressing need to invest even more on focused research to meet this
challenge.
From the point of view of the wine industry, the perception of wine quality is generally
easier to recognize than it is to define. It is often related to the intrinsic aspects of wine, which
are consequences of the grape, grape growing and winemaking conditions. The numerous
applications of chemical and analytical sensory methods geared towards establishing quality
parameters of wine have brought valuable knowledge to understanding perceived quality. In
general, the sensory approach includes the evaluation of stylistic purity, visual appeal, subtlety
and complexity, aging potential, personality, length, finish, harmony and balance amongst all the
components (aroma, taste, flavor and mouthfeel) (Amerine and Roessler 1976, Jackson 2000),
all of which are inevitably linked to wine chemical composition.
Wine is a complex alcoholic beverage, which contains numerous compounds, capable of
influencing perceived quality of wine. The phenolics are major non-volatile compounds widely
known as essential components of red wine quality. Among the phenolic compounds, tannins are
of particular importance in red wine (Harbertson et al. 2003). They contribute to perceived

2
astringency (Landon et al. 2008, Fischer and Noble 1994, Gawel 1998), which is the drying,
puckering mouthfeel that results from increased friction between the tongue and the surfaces
inside the mouth (Lea and Arnold 1978). However, previous studies have shown that tannin
concentration alone is not enough to explain the variation of astringency perception in wines
(Ishikawa and Noble 1995, Landon 2007). During aging, anthocyanins react with tannins to
form polymeric pigments or pigmented tannins (Somers 1968, Somers 1971, Remy et al. 2000),
which are thought to have different protein-binding properties than tannin, thus contributing to
the reduction of astringency (Singleton 1992). Storage conditions that enhance aging of wine and
production of polymeric pigments may allow investigation of the effects of the polymeric
pigments on perceived astringency. A modified protein precipitation assay and bisulfate
bleaching method to fractionate these polymeric pigments into large polymeric pigments (LPP)
and small polymeric pigments (SPP) developed by Harbertson et al. (2003) may be applied.
The volatile composition of the wine is also one of the important factors determining
wine quality. Recent studies indicated that the nature of the wine matrix affects the concentration
of various odorants in the headspace, which are responsible for the aroma and flavor of wine.
Ethanol, the most abundant volatile compound has been shown to decrease the partition
coefficient of various classes of volatile compounds by increasing the solubility of volatile
compounds in model wine systems (Whiton and Zoecklein 2000, Hartmann et al. 2002). The
suppression effect of ethanol on aroma was demonstrated to correspond to the increase in odor
detection threshold in the presence of ethanol (Grosch 2001). This in effect could impact the
contribution of aroma volatiles to the overall characteristic of wine aroma and perception. Other
sensory investigations on the impact of ethanol on wine aroma perception revealed an increased
overall fruity and flowery/floral intensity (Escudero et al. 2007, Guth 1998). An additive effect

3
of ethanol on fruity and woody aroma intensity was also reported in a simple model solution (Le
Berre et al. 2007).
The phenolic compounds have been also reported to affect the release of aroma
compounds to some extent. Decreased volatility was observed for 2-methylpyrazine and
ethylbenzoate in 1% ethanol/water and aqueous solution, respectively due to gallic acid
(Aronson and Ebeler 2004) whereas the same monomeric phenol had no impact on 3-alkyl-2-
methoxypyrazines (Hartmann et al. 2002). Jung & Ebeler (2003) evaluated the effect of catechin
on flavor volatility and showed a significant reduction in the ion response for hexanal and
ethylhexanoate when compared to water but not for heptanone. The addition of tannin was found
to have no significant effect on perceived aroma in Cabernet Sauvignon and Chardonnay wines
although headspace analyses revealed reduction in odorant volatility (Aronson and Ebeler 2004).
In Malbec wines, the perception of fruity, citrus, strawberry, cooked fruit and floral aromas was
observed higher in wines with higher polyphenol content (Goldner et al. 2011).
Although studies on the direct influence of some chemical components on sensory
properties had been previously reported, little research has focused on the interaction effects of
major wine components. Wine is a complex alcoholic beverage, which contains numerous
components that may interact with odorants and alter the quantity of volatile compounds
available for perception. Robinson et al. (2009) found a significant reduction of peak areas for
most volatiles due to increased ethanol concentration, which was slightly increased in the
presence of glucose in model solutions. Jones et al. (2008) showed interaction effects of wine
proteins, alcohol and glycerol concentration at the lower volatile concentration. Conversely,
overall aroma intensity was not impacted by glycerol or ethanol at higher volatile concentration.
In another study, perceived bitterness increased with increased ethanol, catechin and to some

4
extent pH, with the largest effect induced by ethanol. On the other hand, the masking effects of
ethanol on sourness were evident only at pH 3.2 while catechin produced no significant effect
(Fischer and Noble, 1994). Vidal et al. (2004) showed that the perception of astringency
increased with tannin concentration but decreased in the presence of rhamnogallacturonan II.
Thus, the overall research objective was to examine the relationship between the wine
matrix components and the sensory and chemical attributes of wine. Specific objectives and
hypotheses were:
1. To determine the influence of initial tannin concentration, storage temperature and time on the
chemical and sensory properties of Cabarnet Sauvignon and Merlot wines. We hypothesize that
higher tannin concentration, storage temperature and longer storage time will induce chemical
and sensory changes in the wines;
2. To determine the effects of ethanol, tannin and fructose concentrations and their interactions
on the headspace concentration of selected odorants and their aroma contribution in a model
wine. We hypothesize that the headspace concentration and aroma contribution of odorants will
vary with ethanol, tannin and fructose concentrations, and the interactions among these matrix
components, in the model wine solutions;
3. To determine the effects of ethanol, tannin and fructose concentrations and their interactions
on the aroma, taste, flavor and mouthfeel properties of model wine. We hypothesize that
perceived aroma, taste, flavor and mouthfeel ratings of model wines will be different depending
on ethanol, tannin, and fructose concentrations and interactions.
This dissertation is divided into 6 chapters. Following this introductory chapter is a
review of literature on wine quality and composition, and their effects on wine sensory properties
presented in Chapter II. The manuscript entitled “The influence of initial tannin concentration,

5
storage temp and time on the chemical and sensory properties of Cabarnet Sauvignon and Merlot
wines” which was published in the American Journal of Enology and Viticulture in 2009 is
provided in Chapter III. Chapter IV includes the second manuscript submitted recently to the
Journal of Agricultural and Food Chemistry entitled “Effects of ethanol, tannin and fructose on
the headspace concentration and potential sensory significance of odorants in a model wine”.
The third manuscript entitled “Sensorial impact of ethanol, tannin and fructose concentrations in
a model wine” is presented in Chapter V, and will be submitted to American Journal of Enology
and Viticulture. Finally, a summary of conclusions and recommendations is presented in Chapter
VI.
Literature Cited
Amerine, M.A., and E.B. Roessler. 1976. Wines: Their Sensory Evaluation. W. H. Freeman &
Company, New York.
Aronson, J., and S.E. Ebeler. 2004. Effect of polyphenol compounds on the headspace volatility
of flavors. Am. J. Enol. Vitic. 55:13-21.
Escudero, A., E. Campo, L. Fariña, J. Cacho, and V. Ferreira. 2007. Analytical characterization
of the aroma of five premium red wines. Insights into the role of odor families and the concept of
fruitiness of wines. J. Agric. Food Chem. 55:4501-4510.
Fischer, U., and A.C. Noble. 1994. The effect of ethanol, catechin concentration, and pH on
sourness and bitterness of wine. Am. J. Enol. Vitic. 45:6-10.
Gawel, R. 1998. Red wine astringency: a review. Aust. J. Grape Wine Res. 4:74-95.
Goldner, M.C., P. de Leo Lira, C. van Baren, and A. Bandoni. 2011. Influence of polyphenol
levels on the perception of aroma in Vitis vinifera cv. Malbec wines. S. Afr. J. Enol. Vitic. 32:21-
27.
Grosch, W. 2001. Evaluation of the key odorants of foods by dilution experiments, aroma
models and omission. Chem. Senses 26:533-545.
Guth, H. 1998. Comparison of different white wine varieties in odor profiles by instrumental
analysis and sensory studies. In Chemistry of Wine Flavor. A. L. Waterhouse and S. E. Ebeler
(eds), pp. 39-53. ACS Symp. Ser. 714, Am. Chemical Society, Washington, D. C.

6
Harbertson, J.F., E.A. Picciotto, and D.O. Adams. 2003. Measurement of polymeric pigments in
grape berry extracts and wines using a protein precipitation asay combined with bisulfite
bleaching. Am. J. Enol. Vitic. 54:301-306.
Hartmann, P.J., H.M. Mc Nair, and W. Zoecklein. 2002. Measurements of 3-alkyl-2-
methoxypyrazine by headspace solid phase microextraction in spiked model wines. Am. J. Enol.
Vitic. 53:285-288.
Ishikawa, T., and A C. Noble. 1995. Temporal perception of astringency and sweetness in red
wine. Food Qual. Pref. 6:27-33.
Jackson, R.S. 2000. Wine Science Principles, Practice, Perception. 2nd ed. Academic Press,
California.
Jones, P.R., R. Gawel, I.L. Francis, and E.J. Waters. 2008. The influence of interactins between
major white wine components on the aroma, flavour and texture of model white wine. Food
Qual. Prefer. 19:596-607.
Jung, D.M., and S.E. Ebeler. 2003. Headspace solid-phase microextraction method for the study
of the volatility of selected flavor compounds. J. Agric. Food Chem. 51:200-205.
Landon, J. 2007. Chemical and sensory assessment of astringency in Washington State red
wines. Thesis, Washington State University, Pullman.
Landon, J.L., K. Weller, J.F. Harbertson, and C.F. Ross. 2008. Chemical and sensory evaluation
of astringency in Washington State red wines. Am. J. Enol. Vitic. 59:153-158.
Lea, A.G.H., and G.M. Arnold. 1978. The phenolics of ciders: Bitterness and astringency. J.
Agric. Food Chem. 29:478-483.
Le Berre, E., B. Atanosova, D. Langlois, P. Etievant, and T. Thomas-Danguin. 2007. Impact of
ethanol on the perception of wine odorant mixtures. Food Qual. Prefer. 18:901-908.
MKF Research, 2007. The impact of wine, grapes and grape products on the American economy
2007, MKF Research LLC, St. Helena, CA (accessed on March, 2012).
http://ngwi.org/files/documents/Economic_Impact_on_National_Economy_2007.pdf
Remy, S., H. Fulcrand, B. Labarbe, V. Cheynier, and M. Moutounet. 2000. First confirmation in
red wine of products resulting from direct anthocyanin-tannin reactions. J. Sci. Food Agric.
80:745–751.
Robinson, A.L., S.E. Ebeler, H. Heymann, P.K. Boss, P.S. Solomon, and R.D. Trengover. 2009.
Interactions between wine volatile compounds and grape and wine matrix components influence
aroma compound headspace partitioning. J. Agric. Food Chem. 57:10313-10322.

7
Singleton, V.L. 1992. Tannins and the qualities of wines. In Plant Polyphenols. R.W.
Hemingway and P.E. Laks (eds.), pp. 859–880. Plenum Press, New York.
Somers, T.C. 1968. Pigment profiles of grapes and of wines. Vitis 7:303–320.
Somers, T.C. 1971. Polymeric nature of wine pigments. Phytochem. 10:2175–2186.
Vidal, S., P. Courcoux, L. Francis, M. Kwiatkowski, R. Gawel, P. Williams, E. Waters, and V.
Cheynier. 2004. Use of an experimental design approach for evaluation of key wine components
on mouth-feel perception. Food Qual. Pref. 15:209-217.
Whiton, R. S., and B.W. Zoecklein. 2000. Optimization of headspace solid-phase
microextraction for analysis of wine aroma compounds. Am. J. Enol. Vitic. 51:379-382.

8
CHAPTER II
LITERATURE REVIEW
Wine Quality
From an enological point of view, the term “wine” is defined as “the drink resulting from
the fermentation by the yeast-cells, and also in certain cases by the cells of lactic bacteria, of the
juice from the crushing or maceration of grape-cells” (Peynaud 1984). Of the grape genus Vitis,
the species V. vinifera is often cultivated for wine production. This alcoholic beverage contains
numerous chemical components varying in composition and proportions due to many factors
such as the quality of raw material (grape), conditions of winemaking, storage and transport.
Wine components include water, alcohols, acids, sugars, phenolics, nitrogenous compounds,
vitamins and various volatile compounds, with each constituent capable of contributing unique
aromas, tastes and oral sensations to the wine and ultimately, affecting its perceived quality.
The issue of quality has become increasingly important to the wine industry over the past
several decades. Worldwide, an oversupply situation has prevailed, consequently pulling down
wine prices and decreasing profitable margins for producers. It has been suggested that the wine
industry must vigilantly attend to wine quality, in conjunction to marketing efforts in order to
lead the competition (Summer et al. 2010). This raises important question as to what is meant by
quality regarding wine.
Quality may be understood in different ways. Generally, quality in foods and beverages
is defined as the ability of a set of inherent characteristics of a product, system or process to
fulfill requirements of customers and other interested parties (ISO 2000). From the perspective of
marketing, with reference to wine, there exist two quality dimensions based on the consumer
experiences according to Charters and Pettigrew (2007): the external (grapes, production and
9
marketing) and the internal (pleasure, appearance, gustatory, paradigmatic and potential) quality,
the latter being more significant in evaluating the overall wine quality during consumption.
However, some marketing studies have defined the concept of quality as a one-dimensional
judgment. As cited by Charters and Pettigrew (2007), these studies suggest that perceived quality
is a broad overview and exists on a continuum.
Meanwhile, in the wine industry, wine quality is more recognized as related to the
intrinsic aspects of wine. The numerous applications of analytical sensory methods geared
toward establishing quality parameters of wine have brought valuable knowledge in
understanding perceived quality. The sensory evaluation approach includes the evaluation of
stylistic purity, visual appeal, subtlety and complexity, aging potential, personality, length,
finish, harmony and balance among all components (Amerine and Roessler 1976, Jackson 2000).
It was noted that there is hardly an exact definition of each of these terms while a common
explanation to describe some terms can be derived from the literature. The “complexity and
subtlety” are often referred to as highly valued attributes of the richness of aroma and flavor of
wine while the “development or length” refers to changes in the intensity and aromatic character
of the wine after pouring. “Balance and harmony” are described in wine having a smooth taste
(where one taste does not dominate another) and mouthfeel combined to produce an acceptable
overall pleasurable sensation (Jackson 2000, Peynaud 1996).
Wine Components and Wine Quality
Phenolic compounds
The phenolic compounds are major non-volatile components in wines, which are widely
recognized as an essential component of wine quality. They provide color (Somers 1971, Somers
and Evans 1986), astringency (Landon et al. 2008) and bitterness (Fischer and Noble 1994) to

10
wine. The phenolic composition of the finished wines depends on the grape and winemaking
practices. Polyphenols are unstable compounds, with their reactions starting as soon as the grape
is crushed or pressed, continuing throughout winemaking and aging. These reactions may
involve interaction or binding with aroma compounds, thus influencing aroma release and
perception (Clarke and Bakker 2004).
White wines are essentially composed of phenols found in flesh of the grapes such as
gallic acid, hydroxynammic acid esters, catechin, epicatechin, gallocatechin gallate, procyanidin
and catechin gallate. The content varies and normally found in few mg/L units. On the other
hand, red wines are mainly composed of several closely related chemical groups: flavonol-3
group (catechin), flavane(3,4)diol group (leucocyanidin), flavonol-3 (quercetin), anthocyanins
and tannins, in addition to those phenolic compounds found in white wines (Margalit 2004;
Peynaud 1984).
Among the phenolic compounds, tannins are of particular importance in red wine.
Tannins, the most abundant class of phenolics in grapes contribute to perceived astringency.
Astringency is an important attribute in wine influencing consumer acceptability. It is often
described as the drying, roughing and puckering feeling (ASTM 1989) attributed to the
precipitation of a non-covalent complex between salivary-mucoproteins and proline-rich proteins
and tannins in the mouth (Noble 1998, Gawel 1998). The cross-linking of mucoproteins results
in its precipitation and consequently, reduction in lubrication and increased friction in the mouth
(Green 1993) while the proline-rich proteins bind favorably with tannin (Hagerman et al. 1998).
The sensory properties of tannins are thought to be dependent upon their structure,
molecular size and concentration. Tannins may be bitter and/or astringent. Bitterness is restricted
to small molecules with particular structural features enabling them to enter the receptor and

11
activate the signal transduction process, whereas astringency depends on the number of protein
interaction sites in the molecule (Cheynier et al. 2006). The low molecular weight flavanols are
both bitter and astringent (Robichaud and Noble 1990). Tannins become gradually less bitter but
more astringent as the molecular weight increases to about 10 units. The perception of
astringency was also observed to significantly increase as tannin concentration increased, with a
tendency to mask perceived bitterness (Arnold and Noble 1978).
Sugars
Glucose and fructose account for the sweet taste of some wines with recognition
thresholds equivalent to 16 g/L and 9.5 g/L, respectively (Margalit 2004). Dry wines generally
contain less than 1.5 g/L of these residual sugars dominated by fructose, thus are not perceived as
sweet. In contrast, ice wines, which are typically produced from Vidal and Riesling grape
varieties contain 140 to 280 g/L range of sugar in the finished wines and are sweet and aromatic
(Cliff et al. 2002).
The influence of other components such as ethanol, acids, and tannins on the perception
of sweetness has been accounted previously. The sweet sensation has a mitigating effect on
perceived sourness and bitterness. In addition, sugar concentration was also reported to increase
the volatility of aromatic compounds (Jackson 2000). At the level of sugar in model white wines
increased (80 to 250 g/L), approximate equal to that of ice wine, both the perceived density and
viscosity increased (Nurgel and Pickering 2006).
Polysaccharides
Polysaccharides in wine occur in wines at concentrations of 500 to 1500 mg/L (Will et al.
1991). These wine macromolecules originate from grape primary cell walls and autolysis of
microorganisms such as yeasts used in winemaking or Botrytis cinerea, a parasitic mold of the

12
vine. Those polysaccharides derived from grape cell walls include the arabinogalactan-proteins
(AGP) and rhamnogallacturonan II while those from yeast cell walls are mainly mannoproteins.
These polysaccharides are classified based on acidity and protein contents, either as neutral or
acidic pectic polysaccharides (Pellerin et al. 1993, Pellerin et al. 1995, Pellerin et al. 1996). The
interaction between polysaccharides and other wine constituents has been recently investigated.
An AGP fraction and a Saccharomyces cell wall mannoprotein were reported to contribute to a
reduction in protein haze (Waters et al. 1994a, Waters et al. 1994b). The rate of crystallization of
potassium hydrogen tartrate was influenced by the presence of wine polysaccharides, specifically
the rhamnogallacturonans, which bind to crystal growth sites (Gerbaud et al. 1997).
The role of wine polysaccharides on wine sensory properties has been investigated to a
lesser extent. Vidal et al. (2004) evaluated two wine polysaccharides (a mixture of
arabinogalactan proteins, mannoproteins and rhamnogalacturonan II) and found that both
polysaccharide fractions significantly increased the fullness sensation of the wine. The
rhamnogalacturonan II fraction significantly decreased the perceived intensity of astringency
whereas the neutral wine polysaccharide fraction had less of an effect on reducing the ratings of
these attributes. These results confirmed that the role of polysaccharides on the mouthfeel
properties can be either direct, through the impact on mellowness, or indirect, through
modulation of tannin astringency. The importance of polysaccharides (yeast mannoproteins) in
the enhanced perception of sweetness and roundness was also reported recently in Tempranillo
wines (Guadalupe et al. 2007). The ability of yeast macromolecules to bind aroma compounds
affecting aroma perception has been evaluated (Chalier et al. 2007, Dufour and Bayonove
1999a). Nevertheless, more studies are needed to better clarify their overall sensorial impact on
wine.

13
Proteins
Protein nitrogen in wine is only about 2% of the total nitrogen content. Almost all amino
acids are included in proteins. Most abundant amino acids are alanine, aspartic acid, glutamic
acid, glycine, serine and threonine (each between 9-17% of the total amino acids). In general,
there is an occasional increase in protein content in wine compared to its must content that is
attributable to the yeast during and after fermentation (Margalit 2004). However, recent
investigation revealed that the majority of the polypeptides present in wine originated from grape
pulp (Ferreira et al. 2000). Proteins have been reported to have average molecular weights in the
10, 000-30,000 Dalton range, with low iso-electronic points (4.1<pI<5.8 (Margalit 2004,
Brissonnet and Maujean 1993, Ferreira et al. 2000)).
Wine proteins have been known to be the cause of clouding or haze in wines. Bentonite
fining appears the most promising clarifying technique to remove proteins in wine (Sanborn et
al. 2010). However, some evidence have indicated that wine turbidity cannot be attributed
exclusively to the presence of wine proteins (Waters et al. 1991, Waters et al. 1992) but also to a
number of other factors, that are of non-protein in origin such as ethanol and pH (Lagace and
Bisson 1990), polysaccharides and polyphenols (Vernhet et al. 1996). It has been suggested that
the interaction between proteins and other wine components on wine stability should be the focus
of future research on wine proteins.
The proteins in wine are also beneficial to winemakers, particularly those involved in the
production of sparkling and champagne wines owing to their role in foam formation and foam
stability (Brissonnet and Maujean 1993).
14
Acids
Important non-volatile, fixed acids in wine include tartaric, malic, citric and succinic
acids. They are mostly formed during photosynthesis, growth and ripening of grapes. Titratable
acidity (TA) in grapes normally ranges from 5 to 16 g/L whereas in wine, lower values are
observed at about 5 to 7 g/L range (Zoecklein et al. 1995).
The actual sour taste of a wine depends on the absolute and relative amounts of the
various acids, the proportion of acids present in undissociated form or as acid salts, factors that
affect the pH of the wine, the sugar and ethanol concentrations. At the same level of acidity,
perceived sourness of the common wine acids proceeds in the order as follows: malic >
tartaric>citric>lactic (Amerine et al. 1965, Fischer and Noble 1994).
Acids not only elicit sour taste, but they also modify the perception of other taste and
mouthfeel sensations. This is especially noticeable in a diminished perception of sweetness
demonstrated in a recent study of sourness-sweetness interactions in water, wine and alcohol
mixture (Zamora et al. 2006). In particular, Zamora and others (2006) observed a suppressive
effect of tartaric acid (solutions adjusted to pH 3.0, 3.4 and 3.8) on the perceived sweetness of
fructose. However, in general, sweeteners suppress sourness, and the amount of sourness
suppression depends on both components’ levels (Schifferstein and Frijters 1990, Bonnans and
Noble 1993). In addition to sour taste perception, acids also have astringent properties that have
been directly related to pH (Sowalsky and Noble, 1998).
The perception of acidic character of wine is described by as a function of palate balance
according to the relationship (Zoecklein et al. 1995):
Sweet ↔ acidity + astringency and bitterness

15
The role of acids in maintaining a low pH is crucial to the color stability of red wines. As
the pH rises, anthocyanins lose their color and may eventually turn blue above pH 4, and then
fade to yellow in neutral or alkaline medium (Ribereau-Gayon et al. 2006). Acidity also affects
ionization of phenolic compounds. The ionized form of phenols (phenolate) is more readily
oxidized than is the nonionized form (protonated phenol). Accordingly, wines of high pH (≥3.9)
are very susceptible to oxidation and loss of their fresh aroma and young color (Singleton 1987).
Acids are also involved in the precipitation of pectins and proteins that otherwise could cloud a
finished wine. Conversely, acids can solubilize copper and iron, which can induce haziness
(Jackson 2000).
Volatile compounds
Wine aroma is extremely complex. It is the cumulative effect of a diverse group of
volatile compounds, which are typically detected at very low concentrations between 10-4
and 10-
12 g/L (Guadagni et al. 1963). These volatile compounds generally include alcohols, esters,
aldehydes, ketones, acids, terpenes, phenols and sulfur compounds present in varying
concentrations. Wide differences in the proportions and characteristics of aromas can be greatly
influenced by both viticultural (including climate, soil, water, cultivar, grape-growing practices.)
(Jackson and Lombard 1993) and enological (condition of grapes, fermentation, postfermentation
treatments) (Francis and Newton 2005, de Revel et al. 1999, Voilley et al. 1990) factors. Maarse
and Vischer (1989) have estimated more than 800 volatile compounds present in wine.
However, only a few compounds were reported to be present at concentrations above the
perception threshold and thus, responsible for characteristic odors (Cullere et al. 2004, Li et al.
2008, Guth 1997, Zhang et al. 2007). The total content of aroma compounds in wine is
approximately 0.8-1.2 g/L (Rapp 1998, Rapp and Mandery 1986).

16
The volatile compounds that are detected by the olfactory receptors and responsible for
the perception of wine aroma and flavor are described below. These compounds have relatively
low threshold levels and are commonly reported to be present in substantial amounts. According
to different sources, volatile compounds are classified as: 1) primary aroma or aroma arising
directly from the grapes and modifications during grape processing, 2) secondary aroma or
aroma produced by fermentation, or 3) tertiary aroma or the bouquet resulting from the
transformation of the aroma during aging (Rapp and Mandery 1986). Each of these types of
aromas is discussed in greater detail below.
The grape-derived components responsible for the primary aroma or varietal character of
wines are predominantly localized in the exocarp (skin) tissue. The majority of these compounds
are stored as sugar or amino acid conjugates in the exocarp cell vacuoles while some compounds
are present as free volatiles. The compounds stored as conjugates are released through the action
of glycosidases and peptidases introduced at the time of crushing, pressing and during
fermentation thereby increasing the amounts available for perception in the wine (Lund and
Bohlmann 2006). Volatile compounds associated with varietal aroma of grapes are comprised of
terpenes, norisoprenoids, pyrazines, and carbonyl compounds.
Floral, rose-like aroma in Muscat (Muscat d’Alexandrie, Morio Muscat, and Muscat
blanc), grapes (Weisser Riesling, Bukettraube, Guwürztraminer, Fernao Pires and Scheurebe)
and wine is due mainly to the presence of monoterpenes such as linalool, geraniol, nerol, α-
terpineol and hotrienol occurring in complex combinations (Marais 1983). Differences in the
concentrations are dependent on the cultivar, climatic conditions, grape maturity, pH, enzymes,
storage time, extraction and winemaking procedures (Marais 1983). While the majority of
monoterpenes were detected at high concentrations, their perception thresholds were observed to

17
be lower in the presence of other terpene compounds than in isolation (Ribereau-Gayon et al.
1975).
Other grape aroma-active compounds structurally related to terpenes are the C13-
norisoprenoids, which are responsible for the typical aroma of some grape varieties. They are
also considered important in both white and red wines due to their very low odor thresholds (de
Pinho et al. 2001, Aznar et al. 2004, Ferreira et al. 2000, Guth 1997). Winterhalter et al. (1999)
showed that norisoprenoids in Riesling wines originated from several precursors and were stored
as glycoconjugates. Enzymatic oxidation and cleavage of β-carotene (other carotenoids)
substances during crushing of grapes and “in-bottle” ageing are thought to produce a diverse
group of norisoprenoids (Ribereau-Gayon et al. 2000). These compounds include β-ionone
(aroma of viola), damascenone (aroma of exotic fruits), β-damascone (aroma of rose and fruits),
β-ionol (aroma of fruit and flowers), 3-oxo-β-ionone (tobacco smell), and vitispirane (aroma of
fresher flowery-fruity and/ or exotic flowers and earthy-woody undertone) among others as
reviewed by Mendes-Pinto (2009).
The pyrazine compound, 2-methoxy-3-isobutylpyrazine (MIBP), is considered the most
important contributor of vegetative aroma character to Sauvignon Blanc and Cabernet Sauvignon
grapes and wines. It represents about 80% of the total pyrazines found in wine (Allen and Lacey
1997) and exists at concentrations above its detection threshold (2 ng/L in wine) (Etievant 1991).
Descriptive analysis of Cabernet Sauvignon wines has shown that higher intensities of bell
pepper and vegetative character aromas were found in wines produced from younger vines
compared to older vines (Heymann and Noble 1987). The extent of accumulation was also
reported to depend on climatic conditions, with higher levels of pyrazines in wines obtained from
grapes grown under warmer conditions (Lacey et al. 1991).

18
The volatile compounds that contribute to secondary aromas in wine are predominantly
by-products of fermentation present at the highest concentration. Fermentation produces ethanol,
fusel oil substances (aliphatic alcohols, ethers, acids, aldehydes, etc) and esters, which provide a
background to the aroma of any wine (Pisarnitskii 2001). Depending on the fermentation
conditions and yeast strains used, the concentrations of these compounds may vary.
Ethanol odor is described as sweet and has a concentration ranging from 7 to 14% in
commercial table wines, with a low threshold between 0.01-0.05% v/v (in water) (Williams
1972). It is considered an important matrix component that may have physicochemical and
perceptual effects on other volatile compounds. Meanwhile, the higher chain alcohols, fusel fuels
have a characteristic pungent odor generally present at concentrations above their threshold. The
most important are 3-methyl-1-butanol (whiskey, malt, burnt aroma), 2-methyl-1-butanol
(lemon, orange aroma) and 2-methyl-1-propanol (wine, solvent, bitter aroma). These compounds
contribute desirable complexity to wine at concentrations below 300 mg/L (Rapp and Mandery
1986). Factors affecting the production of each alcohol include yeast strain, yeast growth,
ethanol production, fermentation temperature, must pH, aeration, level of solids, grape variety,
maturity and skin contact time (Fleet and Heard 1993).
The characteristic fruity aromas in wine can be largely attributed to numerous acetate
esters and ethyl esters of fatty acids formed from the reaction between an organic acid and
alcohol during fermentation. Esters formation depends upon the fermentation temperature and
alcohol concentration (Killian and Ough 1979). The presence of high amino acids concentration
in must was also shown to enhance the production of more volatile esters (Guitart et al. 1999).
During wine aging, the concentration of esters increased with time (Marais and Pool 1980).
Esters with lower detection threshold include ethyl acetate (pineapple aroma), isoamyl acetate

19
(banana aroma), ethyl octanoate (fruit, fat aroma), ethyl hexanoate (apple peel, fruit aroma),
ethyl butanoate (apple aroma) and 2-phenethyl acetate (rose, honey, tobacco aroma) (Baumes et
al. 1986).
Changes in the aroma properties associated with oxidation can be related to the formation
of aldehydes. Aldehydes are important to the aroma of wines due to their low threshold levels. In
a study of the role of oxidation-related aldehydes in wine aroma, sensory experiments revealed a
suppression effect of (E)-2-alkenals on flavor while branched aldehydes enhanced dried fruit
aromas and masked the effect of (E)-2-alkenals (Cullere et al. 2007). Ketones are also produced
during fermentation, although in small amounts. Yeasts produce diacetyl, estimated to be
between 0.2-0.3 mg/L in wine and contribute to buttery aroma. The action of spoilage lactic acid
bacteria during winemaking may increase the concentration of diacetyl to 1-4 mg/L to produce
an off-odor (Sponholz 1993).
Wine contains between 500-1000 mg/L volatile acids, of which more than 90% consist of
acetic acid (Henschke and Jiranek 1993). Acetic acid is formed during yeast fermentation as a
result of the oxidation of acetaldehyde. In addition, high levels of acetic acid may be due to the
presence of acetic and lactic acid bacteria acid. This vinegary, pungent compound is regarded as
objectionable at concentrations above 0.7-1.1 g/L, depending on the style of wine, with an
optimal value of 0.4 g/L (Henick-Kling 1993).
The off-odors often described as animal, stable, horse sweat and medical can be
attributed to volatile phenols in wine present above their threshold levels. Volatile phenols may
result from the decarboxylation of coumaric and ferulic acid esters from the grapes and
subsequent reduction reactions during malolactic fermentation or in the presence of
Brettanomyces sp. (Chatonnet et al. 1992). Vinylphenols (4-vinylguaiacol, 4-vinylphenol) and

20
ethylphenols (4-ethylguaiacol, 4-ethylphenol) are considered significant in this group of
compounds, with concentration ranges in wine found to be between 0-2.8 mg/L (Castro-Meijas
et al. 2003).
Most important sulfur compounds in wines can be found at µg/L levels while thresholds
may be at ng/L levels. For instance, hydrogen sulfide may be present at 370 µg/L and impart
rotten egg odor. Its perception threshold in wine was observed at concentrations between 1 ng/L
and 150 µg/L (Mestres et al. 2000). Other sulfur compounds that have an impact on wine aroma
include some thioesters, thiols, thiolanes, esters of sulfur containing acids, thiazols, a mercaptal
and an acetamide with a range of descriptors from asparagus, cabbage, corn, molasses, onion to
rubber aroma (Goniak and Noble 1987, Rapp and Mandery 1986). Their formation is closely
linked to yeast metabolism (Rauhut 1993).
During wine ageing, the loss of the grape and fermentation-derived characters of the
young wine is replaced by the development of an aged bouquet (“tertiary aroma”). Depending on
storage conditions, several chemical reactions may influence the aroma profile of the mature
wine. Different processes involved in aroma evolution during aging of red wines in oak barrels
and stainless steel, were previously described by Jarauta and co-workers (2005). These authors
demonstrated that in addition to wood extraction, important changes in volatile concentration
during storage may arise from reactions such as oxidation of wine alcohols and amino acids,
formation of ethyl phenols by microorganisms, sorption processes, and condensation of
acetaldehyde with polyphenols.
Among the compounds released from wood, the cis-β-methyl-γ-octalactones are observed
to be most important. In a study relating evolution of volatile compounds during red wine (60%
Tempranillo, 20% Cabernet Sauvignon and 20% Garnacha) maturation in twice-used French oak

21
barrels, it was found that the cis-oak lactone reached highest level at 119 µg/L after 18 months of
storage (Garde-Cerdan et al. 2002). This concentration exceeds the threshold of natural cis
isomer of 24 µg/L and 57 µg/L in white and red wine, respectively (Brown et al. 2006). Previous
sensory study in barrel-aged wines showed a positive correlation between the cis-isomer lactone
concentration and aroma descriptors such as ‘coconut’ in Chardonnay, and ‘coconut’, ‘vanilla’,
‘dark chocolate’ and ‘berry’ in Cabernet Sauvignon (Spillman et al. 2004).
Medicinal and horsey aroma characteristics of barrel-aged wines due to accumulation of
4-ethylphenol are often associated with yeast contamination. Some studies showed that the
concentration of 4-ethylphenol increased with aging at levels above the threshold limit of 620
µg/L commonly found in used barrels (Chatonnet et al. 1992). Wines (blend of Tempranillo,
41% and Cabernet Sauvignon, 59%) aged for one year in used American and French oak barrels
(for 5 years) reached an average 4-ethylphenol concentration of 1400 µg/L and 1657 µg/L,
respectively (Garde-Cerdan et al. 2002). In another study, 4-ethylphenol was also found in wines
(blend of Tempranillo (60%), Cabernet Sauvignon (20%), Garnacha (20%)) aged in twice-used
French oak barrels. At the end of 18 months storage in the barrels, the highest concentration of 4-
ethylphenol was observed at 1064 µg/L.
Acetaldehyde is responsible for the pungent, ethereal character of Sherry wines produced
by long biological or oxidative ageing in oak casks (5-12 years). The chromatographic analysis
of aroma fractions of Sherry wines made under different ageing conditions showed the highest
concentrations of acetaldehyde in the Fino (545 mg/L), followed by Amontillado (183 mg/L),
and Oloroso (126 mg/L) Sherry-type wines (Zea et al. 2001, Moreno et al. 2005). All of these
concentrations exceeded the reported threshold of 100 mg/L in wine, suggesting its important
contribution to pungent aroma particularly in Fino wines (Etievant 1991).

22
The isoprenoid degradation product, 1,1,6-trimethyl-1,2-dihydronaphthalene (TDN)
contributes to the bottle-aging character of Riesling wines. Simpson & Miller (1983) evaluated
varietal grape juices exposed to high temperature to simulate quick wine ageing and found TDN
concentrations particularly in Riesling grape juice to be higher (28-65 µg/L) than the published
threshold level of 20 µg/L (Simpson 1978). As suggested by Winterhalter et al. (1999), the level
of TDN can be used as to estimate the aging potential of Riesling wine. TDN has a characteristic
kerosene-like odor when it accumulates above the threshold value (Simpson 1978).
Increased levels of dimethyl sulfide (DMS) in wines during bottle aging were associated
with reduction of DMSO (dimethyl sulfoxide) acting as precursor (de Mora et al. 1993). In aged
wines, DMS is often present above the published perception threshold (25 µg/L in white wine)
(Goniak and Noble 1987) and can have a negative effect on the quality of wines (Spedding and
Raut 1982, Simpson 1979). Higher concentrations of DMS in white wines were associated with
asparagus, corn, and molasses aromas (Goniak and Noble 1987), with possible quince and
metallic notes in aged port wines (Silva-Ferreira et al. 2003).
Understanding the complexity of wine aroma has been a challenge to wine researchers
for the past 70 years. Since the first wine aroma studies conducted in the 1940’s as cited by Rapp
and Mandery (1986), a considerable amount of research have been performed to expand the
knowledge of wine aroma. Advances in the aroma extraction, concentration, separation, and
detection methods applied in wine volatile analysis in general, have been reviewed by several
authors (Munoz-Gonzalez et al. 2011, Ebeler 2001, Ebeler and Thorngate 2009). These methods
have brought numerous compounds to be identified, characterized and quantified in wines, with
the majority of compounds having little to no sensory impact. The following section will discuss

23
some analytical approaches used to determine the relationships among composition and content
of volatile compounds and aroma properties of wines.
For many years, gas chromatography-olfactometry (GC/O) has been a valuable analytical
tool used by wine researchers to provide a hierarchal list of aroma compounds according to their
potential aroma significance in wines. GC-O combines instrumental and descriptive sensory
techniques to determine the odor activity (present at concentration below or above sensory
detection threshold), description (smell), and time of odor activity and intensity of the odor of
volatile compounds. The quality of information obtained generally depends on the volatile
compound isolation or extraction procedure and the quantitative methods used, as previously
described in the literature (Zellner et al. 2008, Plutowska and Wardencki 2008, Delahunty et al.
2006).
GC-O methods that have been developed and applied in wine volatile analysis can be
divided into the three categories of dilution to threshold, direct intensity, and detection frequency
methods. These techniques have been employed to characterize odor active compounds in
Cabernet Sauvignon (Falcao et al. 2008), Grenache (Ferreira et al. 1998), Spanish aged red
(Cullere et al. 2004), Pinot Noir (Fang and Qian 2005) and Riesling (Komes et al. 2006) wines.
In addition, GC-O analyses have been applied extensively to identify differences among wines
(Botelho et al. 2007, Ferreira et al. 2001, Gorbuz et al. 2006, Lopez et al. 1999, Bernet et al.
2002, Kotseridis et al. 2000, Kotseridis and Baumes 2000).
The combined use of GC-O and odor activity values (OAV) has also been explored in
estimating the relative importance of component odorants. Following GC-O screening for
impact odorants, the OAV of each compound may be calculated by dividing the concentration of
a compound by its odor threshold to estimate the odor activity and relative strength. In line with

24
this approach, Ong and Acree (1998, 1999) employed GC-O techniques to determine the odor-
active compounds in Gewürztraminer wines and lychee fruits (fresh and canned). GC-O results
of both wine and fruit showed 12 common odorants with higher activity, which authors indicated
to be responsible for the lychee aroma of Gewürztraminer wine. Subsequently, OAV’s were
calculated to determine the relative potency of the odorants. Among these compounds, they
found that cis-rose oxide, β-damascenone, linalool, furaneol, ethyl isohexanoate, and geraniol to
be more potent compounds based on calculated OAV’s (>1) (Ong and Acree 1999). Further
investigation using headspace solid phase microextraction (SPME) technique revealed the
significance of cis-rose oxide, linalool, and geraniol, which were present at high concentrations
in Gewürztraminer wines (Ong and Acree 1999). However, similar with other GC-O studies
mentioned above, no sensory studies were carried out to validate the results.
Until recently, few wine research studies have included sensory validation of GC-O data
and/or OAV to determine the real impact of key odorants taking into account synergistic,
enhancement or suppression effects of different odorants as well as other wine matrix
components. Such studies include preparation of aroma recombination models by addition of the
target odorants selected according to their high OAV’s or dilution factors (FD) in base wine or in
various combinations of water/ethanol mixtures. The aroma models are then compared to the
original wine for similarity or difference by triangle or duo-trio tests (Pineau et al. 2009, Aznar et
al. 2001). Other studies have included omission or addition experiments evaluating aroma
models in terms of changes in odor by omission (Ferreira et al. 2002, Guth 1997, Guth 1998) or
addition (Escudero et al. 2004) of individual odor compounds. Interestingly, while most studies
found satisfactory results in evaluating the importance of individual odorants in mixtures using
OAV’s and FD’s, Escudero and co-workers (2004) observed no change in the aroma of dry,

25
young wine after the addition of compounds high in OAV. They explained that the results were
in part due to the buffering capacity of wine in the presence of relatively high concentrations of
ethanol, ethyl esters, fusel alcohols, volatile phenols, β-damascenone and fatty acids with
relatively similar aroma properties.
Studies on Wine Matrix Effects on Wine Volatiles
Effect of ethanol
Ethanol, one of the alcohols produced during fermentation, represents a major component
of the wine matrix after water with concentrations ranging between 8.5 and 15% in table wines
(Robinson 1999). It is the most abundant volatile component capable of moderating the taste and
mouthfeel properties of wines (Fischer and Noble 1994, Nurgel and Pickering 2006).
Many studies have been undertaken to understand the effect of ethanol on wine aroma by
altering the solubility of aroma compounds in simple model wine systems. Preliminary analytical
studies focused on the measurement of the activity and partition coefficient of volatile
compounds using the static headspace technique, coupled with gas chromatography for analysis.
In one study, the volatile compounds, isoamyl acetate, ethyl hexanoate, n-hexanol and β-ionone
were found to have lower activity coefficient in the artificial wine composed of organic acids
(0.4% tartaric acid, 0.3% malic acid and 0.01% acetic acid), salts (0.0025% magnesium sulfate
and 0.01% potassium sulfate) and 10% ethanol than in water (Voilley et al. 1991). In another
study, decreases of 30-35% in the partition coefficient of volatile compounds were found when
ethanol concentration was increased from 5 to 80 mL/L in a model wine (10 g/L glycerol, 1 g/L
potassium at pH 3.2) (Fischer et al. 1997). Later on, Conner and coworkers (1998) showed a log-
linear decrease in the activity coefficients of ethyl esters as the ethanol concentration increased
from 17 to 80% in MilliQ water. At ethanol concentration below 17%, the activity coefficient of

26
these same compounds did not change. These authors related the results to structural changes in
ethanol/water mixture from an ethanol-monodispersed-in-water system to water-monodispersed-
in-ethanol system. At ethanol concentrations above 17%, the aggregation of ethanol molecules
reduced the hydrophobic hydration of the alkyl chain, thus increasing the solubility of esters.
Hartmann and associates (2002) studied pyrazine compounds extracted with a divinylbenzene
(DVB)/carboxen/polydimethylsiloxane (PDMS) SPME fiber in model solutions (with 0, 5, 10,
15 and 20% ethanol/water mixture and 2 g/L potassium bitartrate) and found a significant
reduction in the recovery of volatile compounds. A ten-fold decrease in recovery was observed
for isopropyl-, sec-butyl-and isobutyl-pyrazines when ethanol concentration was increased from
0 to 20%. Similarly, a consistent decrease in the extraction yield of terpenoids was observed with
increasing ethanol contents from 0 to 18% in water with tartaric acid (5 g/L), particularly for the
most polar compounds such as nerolidol, β-ionone, geraniol and α-ionone (Camara et al. 2006).
In another study using SPME-GC for the analysis of aroma compounds representing alcohols,
acids, esters, norisoprenoids, and phenolics spiked in ethanol/water mixture with 1 mM tartaric
acid, an increase of ethanol concentration from 11 to 14% was sufficient to decrease the relative
response of the analytes by at least 20%, except for 3-methyl-1-butanol (Whiton and Zoecklein
2000).
Aznar et al. (2004) measured the effect of ethanol on the headspace partitioning of 11
compounds using their optimized atmospheric pressure chemical ionization-mass spectrometry
(APCI-MS) methods. They reported that the hydrophobicity of the compound, normally
expressed in logP values was also a determining factor influencing the partition of volatiles in
the headspace of ethanolic solutions. In 12% ethanol/water solutions, these authors observed a
linear correlation between the decrease in volatile headspace concentration and the logP values

27
but only to some extent. For non-polar molecules such as ethyl octanoate and limonene (logP>
3), decrease in the headspace concentration was not apparent as compared with polar compounds
(logP ≤ 3) such as diacetyl, furfuryl alcohol, c-3-hexenol, 3-methyl butanol, ethyl butyrate, ethyl
isovalerate, linalool, 1-octen-3-one, and octanal.
Meanwhile, there were few studies reported in the literature that focused on the dynamic
volatile headspace analysis to evaluate the effect of ethanol on volatile delivery. Tsachaki et al.
(2005) observed a constant ethanol headspace concentration above 0.01, 4, and 12%
ethanol/water solutions during headspace dilution analysis. Further investigation on the dynamic
headspace dilution profile of target carbonyl compounds, alcohols, esters and terpenes showed a
relatively higher absolute headspace concentration of these volatiles in the presence of 12%
ethanol than in water, in contrast with results in static equilibrium studies. According to the
authors, the impact of ethanol on volatiles under non-equilibrium conditions can be explained by
a phenomenon referred to as the Marangoni Effect. Following the Marangoni Effect, the
destabilization of the ethanol/water system caused by ethanol evaporation, results in a continuous
transfer of ethanol and aroma compounds form the bulk phase to the interface maintaining the
volatile headspace concentration during the dilution process. In a subsequent physical modeling
study, Tsachaki et al. (2008) found that that the enhanced delivery and preservation of high
headspace concentration of volatiles was due primarily to the increase in mass transfer in the
liquid phase by ethanol.
Many sensory investigations on the impact of ethanol on wine aroma perception also
have been published. In reconstructed model wines with characteristic aroma of Güwerztraminer
wines, reduction in the amounts of ethanol (100 to 0 g/L) resulted in an increased overall fruity
and flowery/floral intensity (1.5 to 3) as scored by 6 trained panelists in a scale ranging from 0 to

28
3, with 0=none and 3=strong (Guth 1998). Consistent with their results, Escudero et al. (2007)
observed that increasing concentrations of ethanol from 0 to 14.5% dramatically suppressed the
perception of fruitiness in the synthetic wines (mixtures of water/ethanol at different levels with
5 g/L tartaric acid adjusted at pH 3.5) with 9 fruity compounds added. At 0% ethanol in the
mixture, the aroma was described as strong and apple-like and this decreased in intensity as
ethanol concentration approached 12%. At 14.5% ethanol, the fruity aroma was no longer
detected. In a study on more complex Malbec wines, the aroma intensity decreased with
increasing ethanol level except for the herbaceous attribute. The sensory perception of the aroma
at low ethanol concentration (10.0 to 12.0%) was described as fruity while at higher ethanol
(14.5-17.2%), the odor was defined as herbaceous (Goldner et al. 2009). However, in much
simpler mixtures evaluated by Le Berre et al. (2007), an additive effect of ethanol on fruity and
woody aroma intensity was reported in model solutions containing only isoamylacetate and
whiskey lactone. The panelists (n=15) in the study perceived greater intensity of these odors in
the ethanol/water solution (12%, v/v) than in MilliQ water.
The suppression effect of ethanol on aroma was demonstrated to correspond to the
changes in odor detection threshold in the presence or absence of ethanol. Odor detection
threshold is the lowest concentration at which the panelist can perceive or detect an aroma
sensation. For a given aroma compound existing at higher quantities in a food product, a low
detection threshold would indicate a potential stronger impact in the product aroma. As
reviewed by Grosch (2001), GC-O results showed a dramatic increase in threshold values
(suppression effect) in the presence of ethanol (55.6 mg/L) compared to aqueous solution (with
no ethanol). The increase in odor threshold ranges between factors of 10 for ethylhexanoate and

29
312 for methylpropanol. This in effect could impact the contribution of aroma volatiles to
overall characteristic of wine aroma and perception.
Finally, increased alcohol content in the wines (3-14%) has also been shown to increase
the maximum perceived viscosity intensity (Imax) of white wine (Pickering et al. 1998) which
may indirectly affect aroma perception. The Imax value for viscosity at 3% ethanol was found to
be statistically different from the values obtained for 7, 10, 12, and 14% ethanol. However, a
recent study on the main effect of ethanol (11.6, 12.6, and 13.6% v/v) on perceived viscosity,
aroma and flavor intensity of Riesling wines was found not significant (Gawel et al. 2007). The
lack of agreement on the results can be due in part to the wider difference in alcohol range used
in the two studies.
Effect of phenolic compounds
The phenolic composition of the finished wines depends on the grape and winemaking
practices. Polyphenols are unstable compounds, with their reactions starting as soon as the grape
is crushed or pressed, continuing throughout winemaking and aging. These reactions may
involve interaction or binding with aroma compounds influencing aroma release and perception.
Experiments using both exponential dilution techniques and nuclear magnetic resonance (1H
NMR) spectroscopy showed a hydrophobicity-driven, weak bimolecular aroma-phenolic
compound interaction (Dufour and Bayonove 1999b). Increased concentrations of catechin and
epicatechin results in higher affinity for benzaldehyde, than for 3, 5 dimethoxyphenol (Dufour
and Bayonove 1999b). Additional NMR analyses confirmed that aroma-phenolic interaction was
due to the presence of π-π stacking between galloyl ring and the aromatic ring of aroma
compounds, of which stability was provided by hydrogen bonding (Jung et al. 2000). In addition,
Jung et al. (2000) observed that the chemical structure of the aroma and phenolic compounds

30
influenced the strength of interaction. Based on the evaluation of thermodynamic parameters and
spatial orientation of aroma/phenol complexes, gallic acid displayed a higher binding affinity for
the aromatic compounds, vanillin, 2-methylpyrazine, and ethylbenzoate than for naringin.
However, in terms of binding capacity of aroma compounds with the phenolic compounds, 2-
methylpyrazine and vanillin had stronger interactions with gallic acid and naringin, than did
ethylbenzoate.
Few studies using HS-SPME/GC-MS technique demonstrated different effects of
monomeric phenols on the partitioning of aroma compounds. Gallic acid (10 mM) significantly
decreased the headspace concentration of 2-methylpyrazine and ethyl benzoate in 1%
ethanol/water and aqueous solution, respectively (Aronson and Ebeler 2004) while in another
study, gallic acid (1 g/L) had no impact on 3-alkyl-2-methoxypyrazines (Hartmann et al. 2002).
Jung and Ebeler (2003) evaluated the effect of catechin (10 g/L of water) on flavor volatility by
using a similar technique (combined HS-SPME and GC-MS). Their results showed a significant
reduction in the ion response for hexanal and ethylhexanoate (~10-20%) when compared to
water but not for heptanone, wherein a 15% increase in volatility was observed.
Information on the effect of interactions between aroma compounds and condensed
tannins is limited. One study by Dufour and Bayonove (1999b) investigated the influence of
wine condensed tannins on volatility of some volatiles using dynamic headspace technique.
Addition of tannin (0-5 g/L) to a 10% ethanol/aqueous tartrate solution (v/v, with 2 g/L) plus
volatile compounds resulted in increased volatility (“salting out”) of limonene. In contrast,
benzaldehyde volatility slightly decreased, whereas isoamylacetate and ethylhexanoate were not
affected.

31
Recently, sensory approaches were employed to explore the changes in aroma perception
due to the action of polyphenols. Aronson and Ebeler (2004) prepared model solutions of ethyl
benzoate (2-16 mg/L of 1% ethanol/water mixture) and 2-methylpyrazine (60-300 mg/L of
water) to study their interactions with gallic acid (10 mM) and naringin (2 mM). Based on the
sensory data from 10 trained assessors, they found that both gallic acid and naringin decreased
the perceived aroma intensity of 2-methylpyrazine while naringin had a greater negative effect
on ethyl benzoate, in agreement with the results of HS-SPME/GC-MS analysis. The interaction
effects between aroma and polyphenols were also studied by adding extracted tannins (1500
mg/L) to Cabernet Sauvignon and Chardonnay wines. In contrast, the same assessorss were not
able to differentiate the wines with or without tannin based on aroma via the duo-trio test even
though a significant decrease in flavor volatility was determined using headspace analysis.
Authors pointed out a limitation of insufficient panel training. Furthermore, the different results
obtained in model and real wines may be attributed to a large difference in the ethanol content in
the wines (13.2 % - 14.5%) when compared to model solutions (1% ethanol content).
Lund et al. (2009) conducted sensory difference tests (R- index methodology) to evaluate
the effect of polyphenols on the perception of key aroma compounds found in New Zealand
Sauvignon Blanc wines. For each aroma compound, difference threshold (the lowest
concentration at which a panel could perceive a significant difference for any increase in the
concentration of the aroma compounds) values were determined with or without addition of
polyphenol. Results from the 15 trained panelists showed a suppression effect (increase in the
threshold) on the perception of isobutyl methoxypyrazine, 3-mercaptohexanol and
ethyldecanoate after addition of catechin (12 mg/L), caffeic acid (102 mg/L) and quercetin (10
mg/L) in dilute base wine (6.25% ethanol, 4 g/L residual sugar, 3.25 g/L titratable acidity, at pH

32
3.2). Caffeic acid was found to enhance (decrease the threshold) the perception of 3-
mercaptohexanol while catechin had a slight enhancing effect on the mercaptohexanol acetate
perception.
Most recent documentation on the assessment of the effect of polyphenols on aroma
perception was a study conducted on unadulterated Malbec wines (Goldner et al. 2011). In
comparison with previous works, their study evaluated wines which had naturally low (1.4-3.2
g/L) and high (5.4-7.2 g/L) polyphenol concentrations. Significant results were obtained with
lower panelist perception of fruity, citrus, strawberry, cooked fruit and floral aromas in wines
containing high polyphenols compared to the low polyphenol content, indicating a matrix effect.
However, the accompanying headspace SPME GC-MS data provided no significant difference
between wines. Authors stated that the contradictory results may be due to an incomplete
extraction of aroma compounds by PDMS SPME fiber.
Effect of polysaccharides
Polysaccharides present in wine originate from the primary cell walls of grapes
(arabinogalactan-proteins and RG-I and II) and microorganisms such as yeasts (mainly
mannoproteins (MP) used in winemaking (Vidal et al. 2003). Owing to its variety of sources,
wine polysaccharides differ in composition and structure. Based on acidity and protein content,
wine polysaccharides can be classified as: neutral pectic substances (type II arabinogalactans
(AGs), arabinogalactan-proteins (AGPs), branched (1,5-α-L-arabinans and type I
arabinogalactans) or acidic pectic polysaccharides (homogalacturonans and
rhamnogalacturonans), as reported by Dufour and Bayonove (1999a). The presence of high
concentration of polysaccharides in wine (500 to 1500 mg/L) (Will et al. 1991) has many
consequences including interaction with wine volatile compounds.

33
The influence of different polysaccharides on the aroma of wine has been investigated to
a lesser extent. Lubbers et al. (1994) evaluated the effect of interaction between polysaccharide-
rich yeast cell walls and volatile compounds using an artificial model wine. Headspace analysis
data revealed a decrease in concentration of all the test compounds- isoamyl alcohol, octanal,
ethyl hexanoate and ethyl octanoate. When the equilibrium dialysis method was employed to
determine the extent of binding of volatiles on yeast walls, results showed greater binding
capacity of a more hydrophobic volatile, β-ionone, as compared to ethyl hexanoate. The authors
suggested that the degree of binding is of a hydrophobic nature.
In another study, Dufour and Bayonove (1999a) found effects of different
polysaccharides on two esters using exponential dilution technique. These authors investigated
the effect of AGPs, monomeric and dimeric RG-II, and MPs isolated from a red wine on the
activity coefficient of isoamyl acetate and ethyl hexanoate. No significant difference was found
on the volatility induced by the wine polysaccharides (5-20 g/L) in model wines (11.8%
ethanol/aqueous tartrate solution with 2 g/L potassium hydrogen tartrate). However, at higher
concentrations of polysaccharides (30 g/L), they found slight retention (decreased activity) of
these volatiles in the presence of protein-rich polysaccharides, AGPs and MPs and a weak
salting-out effect (increased activity) due to uronic acid rich fractions AGP4, monomeric RG-II
and dimeric RG-II.
The effect of interactions between aroma compounds and mannoproteins was further
assessed using combined dynamic and static headspace, and sensory techniques (Chalier et al.
2007). In this study, the authors attempted to use a lower concentration of mannoproteins (0.15
g/L) to avoid formation of mannoprotein aggregates, which were hypothesized to decrease
access to binding sites available for the volatiles (Landy et al. 1995). In general, their results
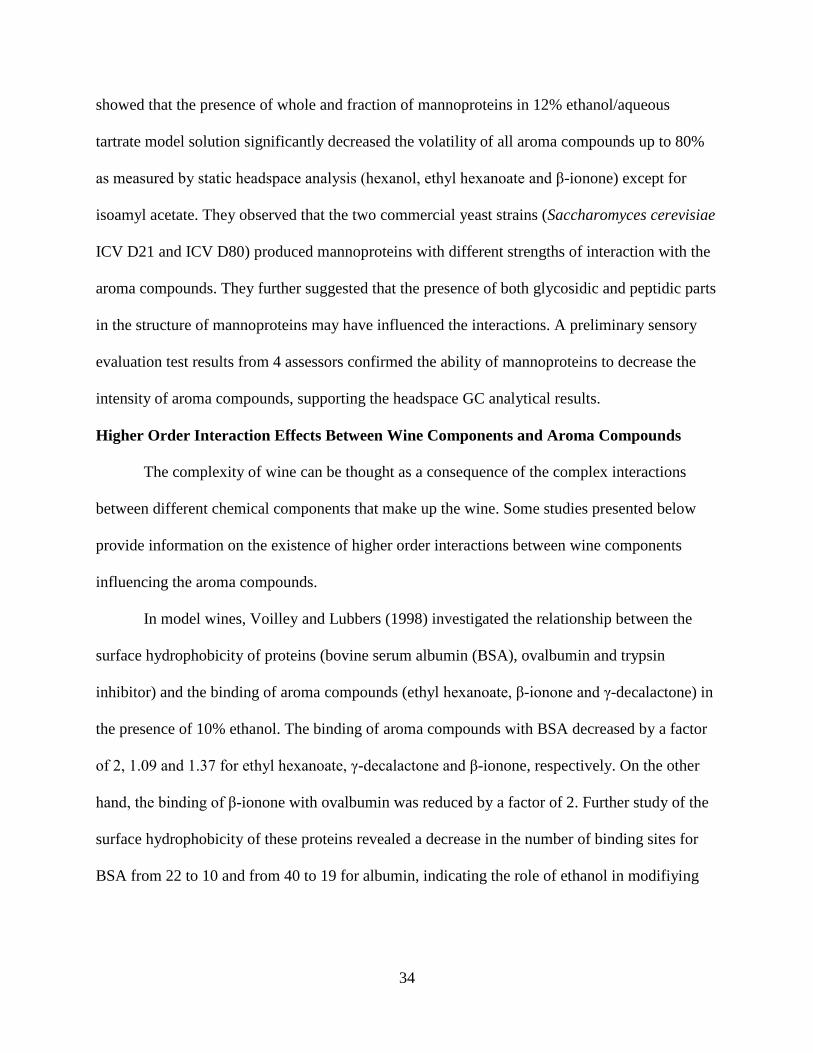
34
showed that the presence of whole and fraction of mannoproteins in 12% ethanol/aqueous
tartrate model solution significantly decreased the volatility of all aroma compounds up to 80%
as measured by static headspace analysis (hexanol, ethyl hexanoate and β-ionone) except for
isoamyl acetate. They observed that the two commercial yeast strains (Saccharomyces cerevisiae
ICV D21 and ICV D80) produced mannoproteins with different strengths of interaction with the
aroma compounds. They further suggested that the presence of both glycosidic and peptidic parts
in the structure of mannoproteins may have influenced the interactions. A preliminary sensory
evaluation test results from 4 assessors confirmed the ability of mannoproteins to decrease the
intensity of aroma compounds, supporting the headspace GC analytical results.
Higher Order Interaction Effects Between Wine Components and Aroma Compounds
The complexity of wine can be thought as a consequence of the complex interactions
between different chemical components that make up the wine. Some studies presented below
provide information on the existence of higher order interactions between wine components
influencing the aroma compounds.
In model wines, Voilley and Lubbers (1998) investigated the relationship between the
surface hydrophobicity of proteins (bovine serum albumin (BSA), ovalbumin and trypsin
inhibitor) and the binding of aroma compounds (ethyl hexanoate, β-ionone and γ-decalactone) in
the presence of 10% ethanol. The binding of aroma compounds with BSA decreased by a factor
of 2, 1.09 and 1.37 for ethyl hexanoate, γ-decalactone and β-ionone, respectively. On the other
hand, the binding of β-ionone with ovalbumin was reduced by a factor of 2. Further study of the
surface hydrophobicity of these proteins revealed a decrease in the number of binding sites for
BSA from 22 to 10 and from 40 to 19 for albumin, indicating the role of ethanol in modifiying

35
the protein conformation consequently changing the binding capacity of proteins with aroma
compounds (Voilley and Lubbers 1998).
In a recent study, the effects of ethanol (14%), glucose (240 g/L), glycerol (10 g/L),
proline (2 g/L) and catechin (50 mg/L) on the volatility of 20 aroma compounds were evaluated
using a full factorial design (Robinson et al. 2009). Significant two-way interactions between
ethanol and glucose, ethanol and glycerol, and glycerol and catechin on the volatility of aroma
compounds were reported. Results obtained from the interaction between ethanol and glucose
showed that the relative peak area for all volatile compounds except limonene was reduced by
increasing ethanol concentration while peak area increased in the presence of glucose. A
significant interaction effect between ethanol and glycerol was also observed for 2-isobutyl-3-
methoxypyrazine, linalool, nerol, 2-phenethyl acetate, β-damascenone, α-ionone, β-ionone and
eugenol. The enhancement effect of glycerol the relative peak areas of the volatile compounds
was only observed in the absence of ethanol. The interaction effect between catechin and
glycerol although statistically significant, the magnitude of the effect was low (4-7% difference
in relative peak areas) (Robinson et al. 2009).
Higher order wine matrix interactions occurring in model wine system was also explored
through sensory methods of analysis. Jones et al. (2008) applied a multi-factorial design to assess
the influence of interactions among selected levels of wine proteins (0 and 112 mg/L),
polysaccharides (0 and 170 mg/L), volatile compound mixture (30 and 70%, v/v), glycerol (0
and 10 g/L) and ethanol (11 and 13%, v/v) on perceived aroma intensity. Their results showed
that overall aroma and individual aroma attributes, estery and floral were dependent on the
concentration of the volatiles, glycerol and ethanol. At lower volatile concentrations, ethanol had
a suppressing effect in the absence of glycerol. Conversely, at higher volatile concentration,

36
overall aroma intensity was not impacted by glycerol nor ethanol. While authors mentioned
Weber’s psychophysical law to explain the effects due to volatile concentration, they were not
able to elucidate the rationale behind interacting roles by ethanol and glycerol. These two factors
were also implicated in either polysaccharides, volatiles or protein (three-way interaction), with
the lowest overall aroma observed in the presence of polysaccharides and glycerol at the lowest
alcohol level.
Literature Cited
Allen, M.S., and M.J. Lacey. 1997. Stable isotope dilution gas chromatography mass
spectrometry for determination of methoxypyrazines "green" aromas in wine. In Modern
methods of plant analysis, H.F. Linskens, J.F. Jackson (eds), pp. 259. Springer Verlag, Berlin.
Amerine, M.A., and E.B. Roessler. 1976. Wines: Their Sensory Evaluation. W. H. Freeman and
Company, New York.
Amerine, M.A., E.B. Roessler, and C.S. Ough. 1965. Acids and the acid taste. I. The effect of pH
and titratable acidity. Am. J. Enol. Vitic. 16:29-37.
Arnold, R.A., and A.C. Noble. 1978. Bitterness and astringency of grape seed phenolics in a
model wine solution. Am. J. Enol. Vitic. 29:150-52.
Aronson, J., and S.E. Ebeler. 2004. Effect of polyphenol compounds on the headspace volatility
of flavors. Am. J. Enol. Vitic. 55:13-21.
ASTM, 1989. Standard definition of terms relating to sensory evaluation of materials and
products. In Annual Book of ASTM. American Society of Testing and
Materials, Philadelphia, USA.
Aznar, M., R. Lopez, J.F. Cacho, and V. Ferreira. 2001. Identification and quantification of
impact odorants of aged red from Rioja. GC-Olfactometry, quantitative GC-MS, and odor
evaluation of HPLC fractions. J. Agric. Food Chem. 49:2924-2929.
Aznar, M., M. Tsachaki, R.S.T. Linforth, V. Ferreira, and A.J. Taylor. 2004. Headspace analysis
of volatile organic compounds from ethanolic systems by direct APCI-MS. Int. J. Mass
Spectrom. 239:17-25.
Baumes, R., R. Cordonnier, S. Nitz , and F. Drawert. 1986. Identificaion and determination of
volatile constituents in wines from different vine cultivars. J. Sci. Food Agric. 37:927-943.

37
Bernet, C., N. Dirninger, P. Claudel, P. Etievant, and A. Schaeffer. 2002. Application of finger
span cross modality matching method (FSCM) by naive assessors for olfactometric
discrimination of Gewurztraminer wines. Food Sci. Technol. 35:244-253.
Bonnans, S., and A.C. Noble. 1993. Effect of sweetener type and of sweetener and acid levels on
temporal perception of sweetness, sourness and fruitiness. Chem. Senses 18:273-283.
Botelho, G., I. Caldeira, A. Mendes-Faia, and M.C. Climaco. 2007. Evaluation of two
quantitative gas chromatography-olfactometry methods for clonal red wines differentiation.
Flavour Fragr. J. 22:414-420.
Brissonnet, F., and A. Maujean. 1993. Characterization of foaming proteins in a champagne base
wine. Am. J. Enol.Vitic. 44:297-301.
Brown, R.C., M.A. Sefton, D.K.Taylor, and M.E. Gordon. 2006. An odour detection threshold
determination of all four possible stereoisomers of oak lactone in a white and a red wine. Austr.
J. Grape Wine Res. 12:115-118.
Camara, J.S., M. Arminda Alves, and J.C. Marques. 2006. Development of headspace solid-
phase microextraction-gas chromatography-mass spectrometry methodology for analysis of
terpenoids in Madeira wines. Anal. Chim. Acta. 555:191-200.
Castro-Meijas, R., R. Natera-Marin, M. de Valme Garcia-Moreno, and C. Garcia-Barroso. 2003.
Optimisation of headspace solid-phase microextraction for the analysis of volatile phenols in
wine. J. Chrom. A. 995:11-20.
Chalier, P., B. Angot, D. Delteil, T. Doco, and Z. Gunata. 2007. Interactions between aroma
compounds and whole mannoprotein isolated from Saccharomyces cerevisiae strains. Food
Chem. 100:22-30.
Charters, S., and S. Pettigrew. 2007. The dimensions of wine quality. Food Qual. Prefer. 18:997-
1007.
Chatonnet, P., D. Dubourdie, J. Boidron, and M. Pons. 1992. The origins of ethylphenols in
wines. J. Sci. Food Agric. 60:165-178.
Cheynier, V., M. Duenas-Paton, E. Salas, C. Maury, J. Souquet, P. Sarni-Manchado, and H.
Fulcrand. 2006. Structure and properties of wine pigments and tannins. Am. J. Enol. Vitic.
57:298-305.
Clarke, R.J., and J. Bakker. 2004. Wine Flavour Chemistry. Blackwell Publishing Ltd., Oxford.
Cliff M., D. Yuksel, B. Girard, and M. King. 2002. Characterization of Canadian icewines by
sensory and compositional analyses. Am. J. Enol. Vitic. 53:46-53.

38
Conner, J.M., L. Birkmyre, A. Paterson, and J.R. Piggott. 1998. Headspace concentrations of
ethyl esters at different alcoholic strengths. J. Sci. Food Agric. 77:121-126.
Cullere, L., J. Cacho, and V. Ferreira. 2007. An assessment of the role played by some oxidation-
related aldehydes in wine aroma. J. Agric. Food Chem. 55:876-881.
Cullere, L., A. Escudero, J. Cacho, and V. Ferreira. 2004. Gas chromatography-olfactometry and
chemical quantitative study of the aroma of six premium quality Spanish aged red wines. J.
Agric. Food Chem. 52:1653-1660.
de Mora, S.J., P. Lee, D. Shooter, and R. Eschenbruch. 1993. The analysis and importance of
dimethylsulfoxide in wine. Am. J. Enol. Vitic. 44:327-332.
de Pinho, P.G., A. Silva Ferreira, M. Mendes Pinto, J. Gomez Benitez, and T.A. Hogg. 2001.
Determination of carotenoid profiles in grapes, musts and fortified wines from Douro varieties of
Vitis vinifera. J. Agric. Food Chem. 49:5484-5488.
de Revel, G., N. Marti, L. Pripis-Nicolau, A. Lonvaud-Funel, and A. Bertrand. 1999.
Contribution to the knowledge of malolactic fermentation influence on wine aroma. J. Agric.
Food Chem. 47:4003-4008.
Delahunty, C.M., G. Eyres, and J.P. Dufour. 2006. Gas chromatography-olfactometry. J. Sep.
Sci. 29:2107-2125.
Dufour, C., and C.L. Bayonove. 1999a. Influence of wine structurally different polysaccharides
on the volatility of aroma substances in a model system. J. Agric. Food Chem. 47:671-677.
Dufour, C., and C.L. Bayonove. 1999b. Interactions between wine polyphenols and aroma
substances. An insight at the molecular level. J. Agric. Food Chem. 47:678-684.
Ebeler, S. 2001. Analytical chemistry: unlocking the secrets of wine flavor. Food Rev. Int.
17:45-64.
Ebeler, S., and J. Thorngate. 2009. Wine chemistry and flavor: looking into the crystal glass. J.
Agric. Food Chem. 57:8098-8108.
Escalona, H., J.R. Piggott, J.M. Conner, and A. Paterson. 1999. Effect of ethanol strength on the
volatility of higher alcohols and aldehydes. Ital. J. Food Sci. 11:241-248.
Escudero, A., E. Campo, L. Farina, J. Cacho, and V. Ferreira. 2007. Analytical characterization
of the aroma of five premium red wines. Insights into the role of odor families and the concept of
fruitiness of wines. J. Agric. Food Chem. 55:4501-4510.
Escudero, A., B. Gogorza, M.A. Melus, N. Ortin, J. Cacho, and V. Ferreira. 2004.
Characterization of the aroma of a wine from Maccabeo. Key role played by compounds with
low odor activity values. J. Agric. Food Chem. 52:3516-3524.

39
Etievant, P.X. 1991. Wine. In Volatile Compounds in Foods and Beverages. H. Maarse (ed), pp.
483-546. Dekker, New York, USA.
Falcao, L., G. de Revel, J. Rosier, and M.T. Bordignon-Luiz. 2008. Aroma impact components
of Brazilian Cabernet Sauvignon wines using detection frequency analysis (GC-olfactometry).
Food Chem. 107:497-505.
Fang, Y., and M. Qian. 2005. Aroma compounds in Oregon Pinot noir wine determined by
aroma extract dilution analysis (AEDA). Flavour Fragr. J. 20:22-29.
Ferreira, V., M. Aznar, R. Lopez, and J.F. Cacho. 2001. Quantitative gas chromatography carried
out at different dilutions of an extract. Key differences in the odor profiles of four high-quality
Spanish aged red wines. J. Agric. Food Chem. 49:4818-4824.
Ferreira, V., R. Lapez, and J.F. Cacho. 2000. Quantitative determination of the odorants of
young red wines from different grape varieties. J. Sci. Food Agric. 80:1659-1667.
Ferreira, V., R. Lopez, A. Escudero, and J.F. Cacho. 1998. The aroma of Grenache red wine:
Hierarchy and nature of its main odorants. J. Sci. Food Agric. 77:259-267.
Ferreira, R.B., S. Monteiro, M.A. Picarra-Pereira, M.C. Tanganho, V.B. Loureiro, and A.R.
Teixeira. 2000. Characterization of the proteins from grapes and wines by immunological
methods. Am. J. Enol. Vitic. 51:2-28.
Ferreira, V., N. Ortin, A. Escudero, R. Lopez, and J. Cacho. 2002. Chemical characterization of
the aroma Grenache rose wines: aroma extract dilution analysis, quantitative determination, and
sensory reconstitution studies. J. Agric. Food Chem. 50:4048-4054.
Fischer, C., U. Fischer, and L. Jakob. 1997. Impact of matrix variables ethanol, sugar, glycerol,
pH and temperature on the partition coefficient of aroma compounds in wine and their kinetics of
volatilization. In Proceedings for the Fourth Internatinal Symposium on Cool Climate Enology
and Viticulture. T. Henick-Kling et al. (eds), pp. 42-46. New York State Agricultural Experiment
Station, Geneva.
Fischer, U., and A.C. Noble. 1994. The effect of ethanol, catechin concentration, and pH on
sourness and bitterness of wine. Am. J. Enol. Vitic. 45:6-10.
Fleet, G.H., and G.M. Heard. 1993. Yeasts: growth during fermentation. In Wine Microbiology
and Biotechnology. G.H. Fleet (ed), pp. 27-54. Harwood Academic Publishers, Chur,
Switzerland.
Francis, I., and J. Newton. 2005. Determining wine aroma from compositional data. Aust. J.
Grape Wine Res. 11:114-126.
Garde-Cerdan, T., S. Rodriguez-Mozaz, and C. Ancin-Azpilicueta. 2002. Volatile composition
of aged wine in used barrels of French oak and of American oak. Food Res. Intl. 35:603-610.

40
Garde-Cerdan, T., D. Torrea-Goni, and C. Ancin-Azpilicueta. 2002. Changes in the
concentration of volatile oak compounds and esters in red wine stored for 18 months in re-used
French oak barrels. Aust. J. Grape Wine Res. 8:140-145.
Gawel, R. 1998. Red wine astringency: A review. Aust. J. Grape Wine Res. 4:74-95.
Gawel, R., S. Van Sluyter, and E.J. Waters. 2007. The effects of ethanol and glycerol on the
body and other sensory characteristics of Riesling wines. Aust. J. Grape Wine Res. 13:38-45.
Gerbaud, V., N. Gabas, J. Blouin, P. Pellerin, and M. Moutounet.1997. Influence of wine
polysaccharides and polyphenols on the crystallization of potassium hydrogen tartrate. J. Int. Sci.
Vigne Vin. 31:65-83.
Goldner, M.C, P. di Leo Lira, C. van Baren, and A. Bandoni. 2011. Influence of polyphenol
levels on the perception of aroma in Vitis vinifera cv. Malbec wines. S. Afr. J. Enol. Vitic. 32:21-
27.
Goldner, M.C., M.C. Zamora, P. di Leo Lira, H. Gianninoto, and A. Bandoni. 2009. Effect of
ethanol level in the perception of aroma attributes and the detection of volatile compounds in red
wine. J. Sens. Stud. 24:243-257.
Goniak, O.J., and A.C. Noble. 1987. Sensory study of selected volatile sulfur compounds in
white wine. Am. J. Enol. Vitic. 38:223-227.
Gorbuz, O., J.M. Rouseff, and R.L. Rouseff. 2006. Comparison of aroma volatiles in commercial
Merlot and Cabernet Sauvignon wines using gas chromatography-olfactometry and gas
chromatography-mass spectometry. J. Agric. Food Chem. 54:3990-3996.
Green, B.G. 1993. Oral astringency: a tactile component of flavor. Acta Psychol. 84:119-125.
Grosch, W. 2001. Evaluation of the key odorants of foods by dilution experiments, aroma
models and omission. Chem. Senses 26:533-545.
Guadagni, D.G., R.G. Buttery, and S. Okano. 1963. Odour threshold of some organic compounds
associated with food flavors. J. Sci. Food Agric. 14:761-765.
Guadalupe, Z., A. Palacios, and B. Ayestaran. 2007. Maceration enzymes and mannoproteins: a
posible strategy to increase colloidal stability and color extraction in red wines. J. Agric. Food
Chem. 55:4854-4862.
Guitart, A., P. Hernandez Orte, V. Ferreira, C. Pena, and J. Cacho. 1999. Some observations
about the correlation between the amino acid content of must and wines of Chardonnay variety
and their fermentation aromas. Am. J. Enol. Vitic. 50:253-258.
Guth, H. 1997. Quantitation and sensory studies of character impact odorants of different white
varieties. J. Agric. Food Chem. 45:3027-3032.

41
Guth, H. 1998. Comparison of different white wine varieties in odor profiles by instrumental
analysis and sensory studies. In Chemistry of Wine Flavor. A.L. Waterhouse and S.E. Ebeler
(eds), pp. 39-52. Oxford University Press, Washington, D. C., USA.
Hagerman, A.E., and L.G. Butler. 1978. Protein precipitation method for the quantitative
determination of tannins. J. Agric. Food Chem. 26:809-812.
Hagerman, A.E., M.E. Rice, and N.T. Ritchard. 1998. Mechanisms of protein precipitation for
two tannins, pentagalloyl glucose and epicatechin 16 (4-8) catechin (procyanidin). J. Agric. Food
Chem. 46:2590-2595.
Hartmann, P.J., H. Mc Nair, and W. Zoecklein. 2002. Measurements of 3-alkyl-2-
methoxypyrazine by headspace solid phase microextraction in spiked model wines. Am. J. Enol.
Vitic. 53:285-288.
Henick-Kling, T. 1993. Malolactic fermentation. In Wine Microbiology and Biotechnology,
G.H. Fleet (ed), pp. 289-326. Harwood Academic Publishers, Chur, Switzerland.
Henschke, P.A., and V. Jiranek. 1993. Yeasts: Growth during fermentation. In Wine
microbiology and biotechnology, G.H. Fleet (ed), pp. 27-54. Harwood Academic Publishers,
Chur, Switzerland.
Heymann, H., and A. C. Noble. 1987. Descriptive analysis of commercial Cabernet Sauvignon
wines from California USA. Am. J. Enol. Vitic. 38:41-44.
ISO 2000. Quality management systems: fundamentals and vocabulary. 29 pp.
Jackson, R.S. 2000. Wine Science Principles, Practice, Perception. Academic Press, California.
Jackson, D.I., and P.B. Lombard. 1993. Environmental and management practices affecting
grape composition and wine quality - A review. Am. J. Enol. Vitic. 44:409-429.
Jarauta, I., J. Cacho, and V. Ferreira. 2005. Concurrent phenomena contributing to the formation
of the aroma of wine during aging in oak wood: an analytical study. J. Agric. Food Chem.
53:4166-4177.
Jones, P.R., R. Gawel, I.L. Francis, and E.J. Waters. 2008. The influence of interactions between
major white wine components on the aroma, flavour and texture of model white wine. Food
Qual. Prefer. 19:596-607.
Jung, D.M., J.S. de Ropp, and S.E. Ebeler. 2000. Study of interactions between food phenolics
and aromatic flavors using one- and two-dimensional H NMR spectroscopy. J. Agric. Food
Chem. 48:407-412.

42
Jung, D.M., and S.E. Ebeler. 2003. Headspace solid-phase microextraction method for the study
of the volatility of selected flavor compounds. J. Agric. Food Chem. 51:200-205.
Killian, E., and C.S. Ough. 1979. Fermentation esters-formation and retention as affected by
fermentation temperature. Am. J. Enol. Vitic. 30:301-305.
Komes, D., D. Ulrich, and T. Lovric. 2006. Characterization of odor-active compounds in
Croatian Rhine Riesling wine, subregion Zagorje. Eur. Food Res. Technol. 222:1-7.
Kotseridis, Y., and R. Baumes. 2000. Identification of impact odorants in Bordeaux red grape
juice, in the commercial yeast used for its fermentatiom, and in the produced wine. J. Agric.
Food Chem. 48:400-406.
Kotseridis, Y., A. Razungles, A. Bertrand, and R. Baumes. 2000. Differentiation of the aromas of
Merlot and Cabernet Sauvignon wines using sensory and instrumental analysis. J. Agric. Food
Chem. 48:5383-5388.
Lacey, M.J., M.S. Allen, and R.L.N. Harris. 1991. Methoxypyrazines in Sauvignon blanc grapes
and wines. Am. J. Enol. Vitic. 42:103-108.
Lagace, L.S., and L.F. Bisson. 1990. Survey of yeast acid proteases for effectiveness of wine
haze reduction. Am. J. Enol. Vitic. 41:147-155.
Landon, J.L., K. Weller, J.F. Harbertson, and C.F. Ross. 2008. Chemical and sensory evaluation
of astringency in Washington State red wines. Am. J. Enol. Vitic. 59:153-158.
Landy, P., C. Druaux, and A. Voilley. 1995. Retention of aroma compounds by proteins in
aqueous solution. Food Chem. 54:387-392.
Lattey, K.A., B.R. Bramley, I.L. Francis, M.J. Herderich, and S. Pretorus. 2007. Wine quality
and consumer preferences: understanding consumer needs. Wine Ind. J. 22:31-39.
Lawless, H.T., and H. Heymann. 1999. Sensory evaluation of food. 2nd ed. Aspen Publishers,
Inc., New York.
Le Berre, E., B. Atanosova, D. Langlois, P. Etievant, and T. Thomas-Danguin. 2007. Impact of
ethanol on the perception of wine odorant mixtures. Food Qual. Prefer. 18:901-908.
Li, H., Y.S. Tao, and H. Wang. 2008. Impact odorants of Chardonnay dry white wine. Eur. Food
Res. Technol. 227:287-292.
Lopez, R., V. Ferreira, P. Hernandez, and J.F. Cacho. 1999. Identification of impact odorants of
young red wines made with Merlot, Cabernet Sauvignon and Grenache grape varieties: a
comparative study. J. Sci. Food Agric. 79:1461-1467.

43
Lubbers, S., C. Charpentier, M. Feuillat, and A. Voilley. 1994. Influence of yeast walls on the
behaviour of aroma compounds in a model wine. Am. J. Enol. Vitic. 45:30-33.
Lund, C.M., L. Nicolau, R.C. Gardner, and P.A. Kilmartin. 2009. Effect of polyphenols on the
perception of key aroma compounds from Sauvignon Blanc wine. Aust. J. Grape Wine
Res.15:18-26.
Lund, S., and J. Bohlmann. 2006. The molecular basis for wine grape quality. Sci. 311:804-805.
Maarse, H., and C.A. Vischer. 1989. Volatile compounds in food. Alcoholic beverages.
Qualitative and quantitative data. TNO-CIVO Food Analysis Institute, Zeist.
Marais, J. 1983. Terpenes in the aroma of grapes and wines: A review. S. Afr. J. Enol. Vitic.
4:49-59.
Marais, J., and H.J. Pool. 1980. Effect of storage time and temperature on the volatile
composition of dry white table wine. Vitis 19:151-164.
Margalit, Y. 2004. Concepts in Wine Chemistry. Wine Appreciation Guild, San Francisco.
Mendes-Pinto, M.M. 2009. Carotenoid breakdown products the-norisoprenoids-in wine aroma.
Arch. Biochem. Biophys. 483:236-245.
Mestres, M., O. Busto, and J. Guasch. 2000. Analysis of organic sulfur compounds in wine. J.
Chrom. A. 881:569-581.
Moreno, J.A., L. Zea, L. Moyano, and M. Medina. 2005. Aroma compounds as markers of the
changes in sherry wines subjected to biological ageing. Food Control. 16:333-338.
Munoz-Gonzalez, C., J.J. Rodriguez-Bencomo, M.V. Moreno-Arribas, and M.A. Pozo-Bayon.
2011. Beyond the characterization of wine aroma compounds: looking for analytical approaches
in trying to understand aroma perception during wine consumption. Anal. Bioanal. Chem.
401:1497-1512.
Noble, A.C. 1998. Why do wines taste bitter and feel astringent? In Chemistry of Wine Flavor.
A.L. Waterhouse and S.E. Ebeler (eds), pp. 156-165. Oxford University Press, Washington, D.
C., USA.
Nurgel, C., and G.J. Pickering. 2006. Modeling of sweet, bitter and irritant sensations and their
interactions elicited by model white wines. J. Sens. Stud. 21:505-519.
Ong, P.K., and T.E. Acree. 1998. Gas chromatography/olfactory analysis of lychee (Litchi
chinesis Sonn.). J. Agric. Food Chem. 46:2282-2286.
Ong, P.K., and T.E. Acree. 1999. Similarities in the aroma chemistry of Gewurztraminer variety
wines and lychee (Litchi chinesis Sonn.) fruit. J. Agric. Food Chem. 47:665-670.
44
Pellerin, P., T. Doco, S. Vidal, P. Williams, J.M. Brillouet, and M.A. O'Neill. 1996. Structural
characterization of red wine rhamnogalacturonan II. Carbohydr. Res. 290:183-197.
Pellerin, P., S. Vidal, P. Williams, and J.M. Brillouet. 1995. Characterization of five type II
arabinogalactan-protein fractions from red wine of increasing uronic content. Carbohydr.
277:135-143.
Pellerin, P., E. Waters, and J.M. Brillouet. 1993. Characterization of two arabinogalactan-
proteins from red wine. Carbohydr. Polym. 22:187-192.
Peynaud, E. 1984. Knowing and Making Wine. John Wiley & Sons, Inc., New York.
Peynaud, E. 1996. The Taste of Wine. John Wiley & Sons, Inc., New York.
Pickering, G.J, D.A. Heatherbell, L.P. Vanhanen, and M.F. Barnes. 1998. The effect of ethanol
concentration on the temporal perception of viscosity and density in white wine. Am. J. Enol.
Vitic. 49:306-318.
Pineau, B., J.C. Barbe, C. Van Leeuwen, and D. Dubourdieu. 2009. Examples of perceptive
interactins involved in specific "red-" and "black-berry" aromas in red wines. J. Agric. Food
Chem. 57:3702-3708.
Pisarnitskii, A.F. 2001. Formation of wine aroma: tones and imperfections caused by minor
components. Applied Biochem. Microbiol. 37:552-560.
Plutowska, B., and W. Wardencki. 2008. Application of gas chromatography-olfactometry
(GCO) in analysis and quality assessment of alcoholic beverages - A review. Food Chem.
107:449-463.
Rapp, A. 1998. Volatile flavour of wine: Correlation between instrumental analysis and sensory
perception. Nahrung. 42:351-363.
Rapp, A., and H. Mandery. 1986. Wine aroma. Experientia 42:873-884.
Rauhut, D. 1993. Yeasts - Production of sulfur compounds. In Wine Microbiology and
Biotechnology, G.H. Fleet (ed), pp. 183-223. Harwood Academic Publishers, Chur, Switzerland.
Ribereau-Gayon, P., J.N. Boidron, and A. Terrier. 1975. Aroma of Muscat grape varieties. J.
Agric. Food Chem. 23:1042-1047.
Ribereau-Gayon, P., Y. Glories, A. Maujean, and D. Dubordieu. 2000. Handbook of Enology.
John Wiley & Sons Ltd., Chichester.
Ribereau-Gayon, P., Y. Glories, A. Maujean, and D. Dubourdieu. 2006. Phenolic compounds. In
Handbook of Enology. The Chemistry of Wine Stabilization and Treatments. pp. 141-204. John
Wiley & Sons Ltd., West Sussex, England.

45
Robichaud, J.L., and A.C. Noble. 1990. Astringency and bitterness of selected phenolics in wine.
J. Sci. Food Agric. 53:343-353.
Robinson, A.L., S.E. Ebeler, H. Heymann, P.K. Boss, P.S. Solomon, and R.D. Trengover. 2009.
Interactions between wine volatile compounds and grape and wine matrix components influence
aroma compound headspace partitioning. J. Agric. Food Chem. 57:10313-10322.
Robinson, J. 1999. The Oxford Companion to Wine. Oxford University Press Inc., New York.
Sanborn, M., C.G. Edwards, and C.F. Ross. 2010. Impact of fining on chemical and sensory
properties of Washington State Chardonnay and Gewurztraminer wines. Am. J. Enol. Vitic.
61:31-41.
Schifferstein, H.N.J., and J.E.R. Frijters. 1990. Sensory integration in citric acid/sucrose
mixtures. Chem. Senses 15: 87-109.
Silva-Ferreira, A.C., P. Rodrigues, T. Hogg, and P.G. de Pinho. 2003. Influence of some
technological parameters on the formation of dimetyl sulfide, 2-mercaptoethanol, methionol, and
dimethyl sulfone in port wines. J. Agric. Food Chem. 51:727-732.
Simpson, R.F. 1978. 1,1,6-trimethyl-1,2-dihydronaphthalene: an important contributor to the
bottle aged bouquet of wine. Chem. Ind. 1:37.
Simpson, R.F. 1979. Aroma composition of bottle aged white wine. Vitis 18:148-154.
Simpson R.F., and G.C. Miller. 1983. Aroma composition of aged Riesling wine. Vitis 22:50-63.
Singleton, V.L. 1987. Oxygen with phenols and related reactions in must, wines and model
systems, observation and practical implications. Am. J. Enol. Vitic. 38:69-77.
Somers, T.C. 1971. Polymeric nature of wine pigments. Phytochem. 10:2175-2186.
Somers, T.C., and M.E. Evans. 1986. Evolution of red wines. Ambient influences on color
composition during early maturation. Vitis 25:31-39.
Sowalsky, R.A., and A.C. Noble. 1998. Comparison of the effects of concentration, pH and
anion species on astringency and sourness of organic acids. Chem. Senses 23:343-349.
Spedding, D., and P. Raut. 1982. The influence of dimethyl disulphide and carbon disulphide in
the bouquet of wines. Vitis 21:240-246.
Spillman, P.J., M.A. Sefton, and R. Gawel. 2004. The contributionof volatile compounds derived
during oak barrel maturation to the aroma of a Chardonnay and Cabernet Sauvignon wine. Aust.
J. Grape Wine Res. 10:227-235.

46
Sponholz, W.R. 1993. Wine spoilage by microorganisms. In Wine Microbiology and
Biotechnology, G.H. Fleet (ed), pp. 395-420. Harwood Academic Publishers, Chur, Switzerland.
Summer, D.A., K. Anderson, E. Montaigne, and J. Lapsely. 2010. Special Issue: The world of
wine: economic issues and outlook. Agric. Resource Econ. Update. 13:1-15.
Tsachaki, M., A.L. Gady, M. Kalopesas, R.S.T. Linforth, V. Athes, M. Marin, and A.J. Taylor.
2008. Effect of ethanol, temperature, and gas flow rate on volatile release from aqueous solutions
under dynamic headspace dilution conditions. J. Agric. Food Chem. 56:5308-5315.
Tsachaki, M., R.S. Linforth, and A.J. Taylor. 2005. Dynamic headspace analysis of the release of
volatile organic compounds from ethanolic systems by direct APCI-MS. J. Agric. Food Chem.
53:8328-8333.
Vernhet, A., P. Pellerin, C. Prieur, J. Osmianski, and M. Moutounet. 1996. Charge properties of
some grape and wine polysaccharide and polyphenolic fractions. Am. J. Enol .Vitic. 47: 25-29.
Vidal, S., P. Williams, T. Doco, M. Moutoutnet, and P. Pellerin. 2003. The polysaccharides of
red wine: total fractionation and characterization. Carbohydr. Polym. 54:439-447.
Vidal, S., P. Courcoux, L. Francis, M. Kwiatkowski, R. Gawel, P. Williams, E. Waters, and V.
Cheynier. 2004. Use of an experimental design approach for evaluation of key wine components
on mouth-feel perception. Food Qual. Pref. 15:209-217.
Voilley, A., V. Beghin, C. Charpentier, and D. Peyron. 1991. Interactions between aroma
substances and macromolecules in a model wine. Food Sci. Technol. 24:469-472.
Voilley, A., C. Lamer, P. Dubois, and M. Feuillat. 1990. Influence of macromolecules and
treatments on the behavior of aroma compounds in model wine. J. Agric. Food Chem. 38:248-
251.
Voilley, A., and S. Lubbers. 1998. Flavor-matrix interactions in wine. In Chemistry of Wine
Flavor. A.L. Waterhouse and S.E. Ebeler (eds.), pp. 217-229. American Chemical Society,
Washington, D.C., USA.
Waters, E.J., P. Pellerin, and J.M. Brillouet. 1994a. A wine arabinogalactan-protein that reduces
heat-induced wine protein haze. Biosci. Biotechnol. Biochem. 58:43-48.
Waters, E.J., P. Pellerin, and J.M. Brillouet. 1994b. Saccharomyces mannoprotein that protects
wine from protein haze. Carbohydr. Polym. 23:185-191.
Waters, E.J., W. Wallace, and P.J. Williams. 1991. Heat haze characteristics of fractionated wine
proteins. Am. J. Enol. Vitic. 42:123-127.
Waters, E.J., W. Wallace, and P.J. Williams. 1992. The identification of heat-unstable wine
proteins and their resistance to peptidases. J. Agric. Food Chem. 40:1514-1519.

47
Whiton R.S., and B.W. Zoecklein. 2000. Optimization of headspace solid-phase microextraction
for analysis of wine aroma compounds. Am. J. Enol. Vitic. 51:379-382.
Will, F., W. Pfeifer, and H. Dietrich. 1991. The importance of colloids for wine quality. Vitic.
Enol. Sci. 46:78-84.
Williams, A.A. 1972. Flavour effects of ethanol in alcoholic beverages. Flavour Ind. 3:604-607.
Winterhalter, P., M.A. Sefton, and P.J. Williams. 1999. Volatile C13-norisoprenoid compounds in
Riesling wine are generated from multiple precursors. Am. J. Enol. Vitic. 41:277-283.
Zamora, M.C., M.C. Goldner, and M.V. Galmarini. 2006. Sourness-sweetness interactions in
different media: white wine, ethanol and water. J. Sens. Stud. 21:601-611.
Zea, L., L. Moyano, J. Moreno, B. Cortes, and M. Medina. 2001. Discrimination of the aroma
fraction of Sherry wines obtained by oxidative and biological ageing. Food Chem. 75:79-84.
Zellner, B.D.A., P. Dugo, G. Dugo, and M. Luigi. 2008. Gas chromatography-olfactometry in
food flavour analysis. J. Chromatogr. A. 1186:123-143.
Zhang, M., Q. Xu, C. Duan, W. Qu, and Y. Wu. 2007. Comparative study of aromatic
compounds in young red wines from Cabernet Sauvignon, Cabernet Franc, and Cabernet
Gernischet varieties in China. J. Food Sci. 72:248-252.
Zoecklein, B.W., K.C. Fugelsang, B.H. Gump, and F.S. Nury. 1995. Wine Analysis and
Production. Chapman & Hall, New York.

48
CHAPTER III
INFLUENCE OF TANNIN CONCENTRATION, STORAGE TEMPERAURE, AND
TIME ON CHEMICAL AND SENSORY PROPERTIES OF
CABERNET SAUVIGNON AND MERLOT WINES
Abstract
Storage conditions that may influence the chemical and sensory properties of young
bottled Cabernet Sauvignon and Merlot wines were studied. Low and high tannin wines (≤400
mg/L and ≥800 mg/L catechin equivalents, respectively) stored at 23°C for 0 day (baseline) and
at either 27°C or 32°C for 40, 55, and 70 days were used for chemical and sensory analysis. In
both low and high tannin wines, storage at 32°C resulted in significant increase in small
polymeric pigment (SPP) (p ≤ 0.05) with a corresponding decrease in anthocyanin
concentrations over time, which was more pronounced in Cabernet Sauvignon. In both varieties,
high tannin wines contained more large polymeric pigment (LPP) than the low tannin wines (p ≤
0.05). Generally, titratable acidity and pH were not affected by storage treatments. A trained
sensory panel (n = 21) gave higher astringency ratings to high tannin wines than low tannin
wines for both varieties, which remained constant throughout the study. An increased perception
of bitterness was associated with storage at 32°C storage for 70 days, while alcohol burn
intensity was comparable in Cabernet Sauvignon. No significant differences in bitterness and
alcohol burn intensity were found in Merlot. Results indicate that storage temperature and
storage time contributed to changes in the chemical composition of typically aging red wines but
did not impact perceived astringency. Tannin concentration was positively correlated with
perceived astringency (r = 0.882) in Cabernet Sauvignon, while SPP and LPP had lower
correlation with perceived astringency for both varieties.

49
Introduction
Phenolics are widely recognized as an essential component of red wine quality. They
contribute to astringency, one of the key sensory attributes influencing consumer acceptability of
red wine (Lattey et al. 2007). Astringency is a complex of sensations that involves shrinking,
drawing, or puckering of the epithelium after exposure to substances such as alums or tannins
(ASTM 2004). Among phenolic compounds, the polymeric flavan-3-ols, or condensed tannins,
are the most important class because of their significant contribution in perception of wine
astringency (Fischer and Noble 1994, Gawel 1998, Lea and Arnold 1978).
Previous studies have shown that tannin concentration is not sufficient to explain the
variation of astringency perception in wines (Ishikawa and Noble 1995, Landon 2007).
Polyphenols associated with astringency have molecular weights between 500 and 3000 Da
(Bakker 1998, Lesschaeve and Noble 2005). However, low molecular weight compounds have
also been found to elicit astringency, including 5-O-caffeoylquinic acid and flavan-3-ol
monomers (Naish et al. 1993, Peleg et al. 1999).
In young red wines, color is enhanced through copigmentation, the complex formation
between self-associations of anthocyanins and colorless cofactors (Levengood and Boulton 2004,
Boulton 2001). During aging, anthocyanins react with tannins to form polymeric pigments or
pigmented tannins (Somers 1968, Somers 1971, Remy et al. 2000), which are thought to have
different protein-binding properties than tannin, and thus may contribute to reduction of
astringency (Singleton 1992).
Storage conditions that decrease anthocyanin content increase polymeric pigment (Dallas
and Laureano 1994, Somers 1971). In Shiraz and Grenache wines, a higher storage temperature
(25°C versus 3°C) for 100 days greatly influenced the rapid formation of polymeric pigments

50
(Somers and Evans 1986). In another study, anaerobic heat treatment (42–45°C) of Shiraz wines
promoted changes in wine color and phenolic composition and reduced astringency after 10 days
(Somers and Pocock 1990).
The objective of this study was to clarify the factors that influence perceived astringency
during aging of Cabernet Sauvignon and Merlot wines. Specifically, this work determined the
influence of initial tannin concentration, storage temperature, and storage time on the chemical
composition and sensory properties of young bottled wines. We used a protein precipitation
assay and bisulfate bleaching method to fractionate polymeric pigments into large polymeric
pigments (LPP) and small polymeric pigments (SPP) (Harbertson et al. 2003). In a preliminary
study, storage at 35°C for 21 days altered polymeric pigment content of Cabernet Sauvignon
wines while tannin levels remained the same (Landon 2007). In addition, wine precipitate was
observed. Trained panelists found significant difference in astringency among low, medium, and
high tannin wines, both heat treated and not treated. However, trained panelists found no
significant difference in astringency between the heat-treated and untreated wines of the same
tannin content (Landon 2007). To better understand the impact of polymeric pigment on wine
sensory characteristics, our current study examined the storage of wines for 40, 55, and 70 days
at either 27°C ± 1 or 32°C ± 1 and allowing for differentiation of wines with the same tannin
content but varying polymeric pigment content. Lower heating temperatures were selected to
minimize precipitation. A trained panel was used to examine the relationship among polymeric
pigment, anthocyanin, and tannin and perceived astringency, bitterness, and alcohol burn.
Materials and Methods
Wine samples and procedures
Merlot (2007) and Cabernet Sauvignon (2007) wines made from grapes grown in

51
Columbia Valley were obtained from Snoqualmie Winery (Prosser, WA). Wines were prepared
according to typical commercial practices, and wine chemical characteristics for each variety at
the time of bottling are shown (Table 1). Within each variety, 14 bottles (750 mL) of low tannin
(≤400 mg/L catechin equivalents) and 14 bottles (750 mL) of high tannin (≥800 mg/L catechin
equivalents) wine were used. Two bottles of each concentration were held at room temperature
(23°C) and served as baseline. The remaining bottles were stored under two temperature
conditions that would allow formation of polymeric pigments, which are stable to degradation
and precipitation: 12 bottles were stored at 27°C ± 1 and 12 bottles were stored at 32°C ± 1. All
wines were stored horizontally with cork, in the dark. Chemical and sensory analyses were
conducted at room temperature (23°C ± 1) at 0 day (baseline) and after storage for 40, 55, and 70
days.
Chemical analyses
Tannin (mg/L catechin equivalents) and SPP and LPP (absorbance units at 520 nm)
measurements were conducted as previously described (Hagerman and Butler 1978) with
modifications (Harbertson et al. 2003). Anthocyanins (mg/L malvidin-3-glucoside equivalents)
were measured using a previous method (Picciotto 2002).
Bovine serum albumin (BSA, Fraction V powder), sodium dodecyl sulfate (SDS, lauryl
sulfate, sodium salt), triethanolamine (TEA), ferric chloride hexahydrate, potassium
metabisulfite, and (+)-catechin were purchased from Sigma (St. Louis, MO). The materials used
for preparing buffers were purchased from J.T. Baker (Phillipsburg, NJ) and included
hydrochloric acid, malic acid, sodium chloride, sodium hydroxide, 100% ethanol, quinine
sulfate, and glacial acetic acid. A Genesys 10 UV scanning spectrophotometer (Thermo Electron
Corporation, Madison, WI) was used, together with a Vortex-Genie 2 (Scientific Industries,

52
Table 1. Composition of Cabernet Sauvignon and Merlot wines at bottling.
aCE = catechin equivalents
bM-3-GE = malvidin-3-glucoside equivalents
cAU = absorbance units
Parameters Cabernet Sauvignon Merlot
Low
Tannin
High
Tannin
Low
Tannin
High
Tannin
pH 3.71 3.79 3.75 3.61
Titratable acidity (g/L) 0.59 0.54 0.58 0.60
Free SO2 (mg/L) 56 47 42 35
Total SO2 (mg/L) 65 61 54 46
Reducing sugars (%) 0.12 0.12 0.13 0.11
Alcohol (% vol) 13.9 13.8 13.9 13.8
Tannin (mg/L CE)a 203 800 185 844
Anthocyanin (mg/L M-3-GE)b
452.4 491.6 333.8 452.0
Small Polymeric Pigment (AU)c 1.56 1.62 1.18 1.08
Large Polymeric Pigment(AU)c 0.45 1.08 0.53 1.63

53
Bohemia, NY), and Galaxy 140 centrifuge (VWR, Bridgeport, NJ). Titratable acidity was
measured by titrating 0.1 N NaOH into 5 mL sample (pH 8.4 endpoint), while pH was obtained
using a digital pH meter (Fisher Scientific, Waltham, MA). All measurements were performed in
triplicate.
Sensory training and evaluation
Twenty-one (9 males and 12 females) volunteer wine drinkers between 22 and 61 years
formed the trained sensory panel. Panelists were recruited from Washington State University and
the Pullman community and all consumed red wine at least once a week. Panelists were screened
for taste disorders that could influence their responses by measuring their responses to astringent
and bitter standards to determine sensitivity (see below). The panelists received minimum
background information about the study to reduce potential bias and were simply informed they
would be evaluating red wines over a two-month period. All panelists signed an informed
consent form and received nonmonetary incentive after each training and evaluation session. The
project was approved by the Washington State University Institutional Review Board for human
subject participation.
Panelists completed a total of eight one-hour training sessions over a two-month period,
including review sessions before each formal sensory evaluation session. Astringency and
bitterness were defined to establish a common knowledge about the parameters and avoid
confusion. Astringency was defined as the drying, puckery feeling that results from increased
friction between the tongue and the surfaces inside the mouth (Lea and Arnold 1978), while
bitterness was described as the sensation perceived at the back of the tongue.
Training was conducted through presentation of standard solutions prepared in base wine
(Livingston Red Rosé, Gallo, Modesto, CA). Astringency standards used were 0.6 g tannic acid

54
and 0.25 g/L alum (low), 2.1 g tannic acid and 0.875 g/L alum (medium), and 3.6 g tannic acid
and 1.5 g/L alum (high). Bitterness standards used were 5 mg/750 mL quinine sulfate (low), 20
mg/750 mL quinine sulfate (medium), and 35 mg/750 mL quinine sulfate (high). Merlot and
Cabernet Sauvignon wines of varying tannin levels were also used for training. Based on panelist
suggestion, alcohol burn (the extent of hot, chemical burning mouth feel sensation) was added
for evaluation. Standards used for low and high alcohol burn intensity were base wine (9.5%
alcohol) and Cabernet Sauvignon wine (13.5% alcohol), respectively.
For each variety, four sensory evaluation sessions were conducted on separate days
within a period of two months: after bottling and after 40, 55, and 70 days of storage. In each
session, panelists were presented with reference and eight samples consisting of two wines for
each level of tannin and storage temperature. The base wine used during training served as the
reference for medium astringency and bitterness intensity and low alcohol burn, provided for
tasting before evaluation. The wine samples were labeled with three-digit codes and presented to
panelists one at a time in a randomized serving order. Panelists rated the perception of intensity
of astringency, bitterness, and alcohol burn sensations on a 15-cm structured line scale: 0 to 5 cm
for low, 5.1 to 10 cm for medium, and 10.1 to 15 cm for high intensity. The 25-mL wine samples
were served at 23°C in an ISO/INAO (International Standards Organization) tasting glass and
covered with a petri dish for one hour before testing. Panelists were given a forced 20-sec break
time between samples while rinsing their mouth with distilled water and eating unsalted crackers
and were given another 2-min forced break after the fourth sample to refresh their palate.
Evaluations were done in individual booths under red lights to mask color differences among
samples. All instructions, scale presentations, and data collection were carried out using a
computerized sensory software program (Compusense 5, Guelph, Canada).

55
Data analysis
A three-way analysis of variance (ANOVA) and Tukey’s multiple comparisons of means
were used to analyze both chemical and sensory data with SAS statistical software (SAS
Institute, Cary, NC). The ANOVA performed on chemical data used a fixed effects model with
tannin, temperature, and time as fixed effects. The ANOVA performed on sensory data used a
mixed effects model, assuming panelists as random effect, and tannin, temperature, and time as
fixed effects. Pearson’s correlation test was used to describe the relationship between sensory
and chemical data (XLSTAT, Addinsoft, Paris). Significance level was defined as p ≤ 0.05.
Results
F ratios were obtained from the three-way ANOVA model (Table 2). The data show that
tannin concentration, storage temperature, and time effects were significant (p ≤ 0.05) for all
phenolic compounds in Cabernet Sauvignon and Merlot, except temperature for LPP. The
interaction effects tannin-by-temperature, tannin-by-time, and temperature-by-time were also
significant for majority of the compounds and varied depending on the variety. From this point,
subsequent interpretation of results was based on significant interaction effects.
Anthocyanins
For both wines, high tannin wines had higher anthocyanin concentrations than low tannin
wines (Figure 1). For both low and high tannin wines, storage at 27°C resulted in significantly
higher anthocyanin concentrations than storage at 32°C, except at 40 days of storage for
Merlot. In Merlot, at 70 days of storage, the high tannin wines had significantly lower
anthocyanin compared with the low tannin wine stored at the same temperature (32°C),
whereas storage at 27°C resulted in no significant difference between the low and high tannin
wines. Anthocyanin concentration generally decreased in both Cabernet Sauvignon and

56
Tan
nin
Mer
lot
33562.9
**
61.5
**
61.5
**
0.9
52.2
**
16.0
**
0.9
3080.6
Cab
ernet
Sau
vig
non
7966.0
**
233.1
**
8.3
**
15.6
**
2.7
7.5
**
1.8
750.5
*, ** i
ndic
ate
signif
ican
ce a
t p ≤
0.0
5 a
nd p
≤ 0
.01
, re
spec
tivel
y.
Lar
ge
Poly
mer
ic
Pig
men
t (L
PP
)
Mer
lot
1430.1
**
0.0
3
42.0
**
4.4
4.4
*
0.5
0.2
139.0
Cab
ernet
Sau
vig
non
234.2
**
1.5
50.8
**
3.1
44.9
**
5.2
*
5.9
*
41.1
Sm
all
Poly
mer
ic
Pig
men
t (S
PP
)
Mer
lot
31.8
**
129.8
**
15.9
**
15.3
**
3.4
9.4
0.6
21.4
Cab
ernet
Sau
vig
non
54.6
**
245.8
**
1.9
1.1
5.1
*
2.4
0.4
29.2
Anth
ocy
anin
s
Mer
lot
155.7
**
730.2
**
209.5
**
50.1
**
53.4
**
153.1
**
1.0
161.4
Cab
ernet
Sau
vig
non
2041.7
**
1441.7
**
122.7
**
19.4
**
2.6
60.2
**
2.3
352.6
Sourc
es o
f var
iati
on
Tan
nin
Tem
per
atu
re
Tim
e
Tan
nin
x
Tem
per
atu
re
Tan
nin
x T
ime
Tem
per
atu
re x
Tim
e
Tan
nin
x
Tem
per
atu
re x
Tim
e
MS
E
(a)
Tab
le 2
. F
-val
ues
fro
m t
he
anal
ysi
s of
var
iance
(A
NO
VA
) o
f pro
tein
pre
cipit
atio
n a
ssay
dat
a in
Cab
ernet
Sau
vig
non a
nd M
erlo
t w
ines
(n =
24
).
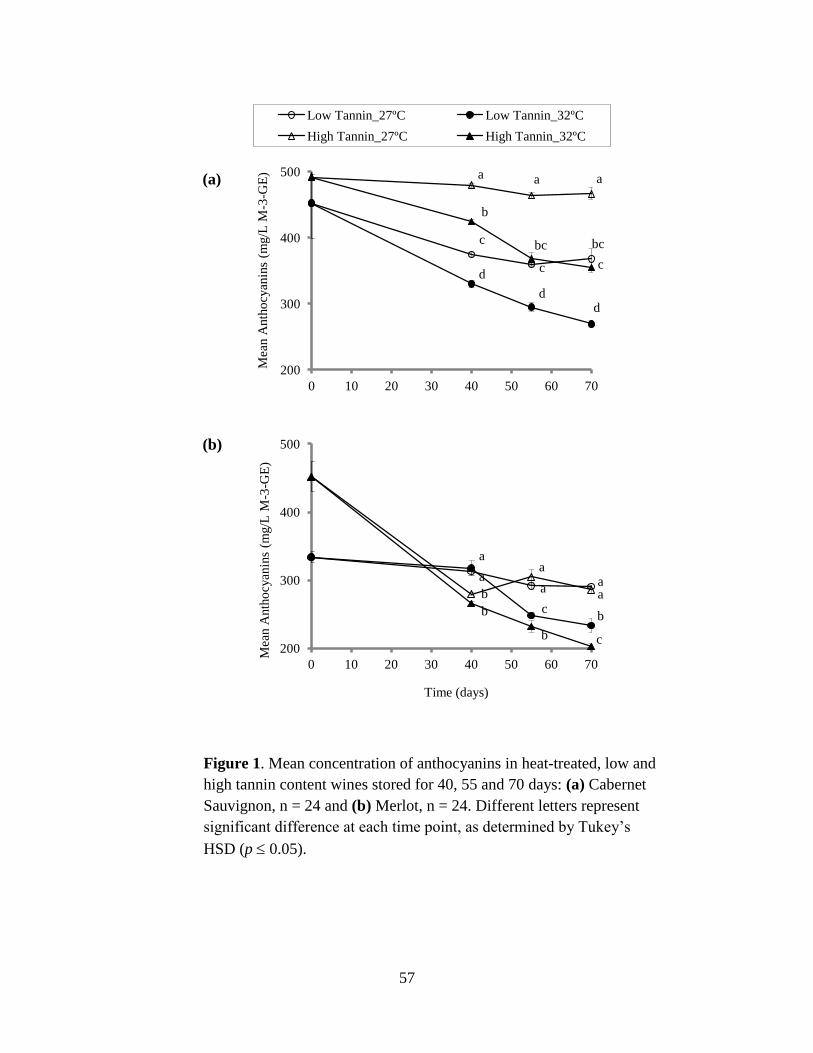
57
Figure 1. Mean concentration of anthocyanins in heat-treated, low and
high tannin content wines stored for 40, 55 and 70 days: (a) Cabernet
Sauvignon, n = 24 and (b) Merlot, n = 24. Different letters represent
significant difference at each time point, as determined by Tukey’s
HSD (p 0.05).
c
c
bc
d
d d
a a a
b
bc
c
200
300
400
500
0 10 20 30 40 50 60 70
Low Tannin_27ºC Low Tannin_32ºC
High Tannin_27ºC High Tannin_32ºC
Mea
n A
nth
ocy
anin
s (m
g/L
M-3
-GE
)
a a
a
a
b
b
b
a a
b c
c 200
300
400
500
0 10 20 30 40 50 60 70
Mea
n A
nth
ocy
anin
s (m
g/L
M-3
-GE
)
Time (days)
(a)
(b)

58
Merlot wine as storage time increased.
Small polymeric pigments
Storage at 32°C resulted in significantly higher SPP formed than at 27°C (Figure 2). In
Cabernet Sauvignon wines with low tannin content, SPP increased from 0 to 40 days by 12.2%
and 19.9% for wines stored at 27°C and 32°C, respectively. High tannin wines stored at 27°C
had a slight increase in SPP (0.6%), while storage at 32°C resulted in a 10.5% increase. After 40
days, there was no significant change in SPP until 70 days of storage (p > 0.05). In Merlot wines
stored at 27°C, SPP levels increased from baseline values to 40 days of storage (27%), after
which time they did not significantly change (p > 0.05). However, wines stored at 32°C had
41.8% more SPP at 40 days than the baseline, followed by a decrease at 55 days of storage (p ≤
0.05).
Large polymeric pigments
Initial LPP content in Cabernet Sauvignon and Merlot wines was higher in high tannin
wines than in low tannin wines (Figure 3). With storage at both 27°C and 32°C, LPP content of
the high tannin wines increased. In Cabernet Sauvignon, at 70 days, high tannin wines stored at
27°C were significantly higher in LPP than wines stored at 32°C. However, no significant
differences in LPP were observed between the low tannin wines stored at either 27°C or 32°C for
40, 55, or 70 days. In Merlot, LPP content of wines stored at 27°C was not significantly different
from the wines stored at 32°C (p > 0.05). However, storage time significantly influenced LPP
content of low and high tannin wines stored at both temperatures, with LPP showing a significant
increase with storage time (p ≤ 0.05).

59
Figure 2. Mean concentration of small polymeric pigment (SPP) in
heat-treated, low and high tannin content wines stored for 40, 55 and
70 days: (a) Cabernet Sauvignon, n = 24 and (b) Merlot, n = 24.
Different letters represent significant difference at each time point,
as determined by Tukey’s HSD (p 0.05).
1.4
1.5
1.6
1.7
1.8
1.9
2.0
0 10 20 30 40 50 60 70
Low Tannin_ 27ºC Low Tannin_ 32ºC
High Tannin_27ºC High Tannin_32ºC
Mea
n S
PP
(A
bso
rban
ce u
nit
s)
a
ab
b
c
a
a
b
b
a
ab
b
c
1.0
1.1
1.2
1.3
1.4
1.5
1.6
1.7
1.8
0 10 20 30 40 50 60 70
Mea
n S
PP
(A
bso
rban
ce u
nit
s)
b
ab
a a
b
ab
ab a
c
b
ab
a
Time (days)
(a)
A
(b)

60
Figure 3. Mean concentration of large polymeric pigment (LPP) in
heat-treated, low and high tannin content wines stored for 40, 55 and
70 days: (a) Cabernet Sauvignon, n = 24 and (b) Merlot, n = 24.
Different letters represent significant difference at each time point,
as determined by Tukey’s HSD (p 0.05).
0.0
0.5
1.0
1.5
2.0
2.5
3.0
0 10 20 30 40 50 60 70
Low Tannin_27ºC Low Tannin_32ºC
High Tannin_27ºC High Tannin_32ºC
Mea
n L
PP
(A
bso
rban
ce u
nit
s)
ab
a
b
ab
b
a
ab
ab
a
b
c c
0.0
0.5
1.0
1.5
2.0
2.5
3.0
0 10 20 30 40 50 60 70
Mea
n L
PP
(A
bso
rban
ce u
nit
s)
b
b
b
b
a
a
a
a
b
b
a
a
Time (days)
(a)
(b)

61
Tannin
At all storage times, the high tannin wines had significantly higher tannin concentration
than the low tannin wines (p ≤ 0.05) (Figure 4). Generally, within each wine (low or high), the
tannin levels of wines stored at 27°C were significantly higher than those stored at 32°C. Tannin
levels of low and high tannin wines at either 27°C or 32°C decreased from the baseline but did
not significantly change from 40 to 70 days (p > 0.05).
Titratable acidity and pH
In Cabernet Sauvignon, titratable acidity was not significantly different at either the low
or high tannin levels or at any of the storage temperatures or storage times (p > 0.05). However,
higher pH values were found in high tannin wines (pH 3.82) than in low tannin wines (pH 3.70).
In Merlot, lower titratable acidity values were found in low tannin wines (0.54) than in high
tannin wines (0.58), while a higher pH was observed in low tannin (3.68) compared to high
tannin wines (3.61) (p ≤ 0.05) (data not shown).
Sensory analyses
From the trained panel data, F values were determined from the analysis of variance data
for astringency, bitterness, and alcohol burn sensory perceptions in wines (Table 3). In Cabernet
Sauvignon wines, the panelist, tannin concentration, storage temperature, storage time, and
interaction between tannin concentration and storage time significantly impacted the perception
of astringency (p ≤ 0.05). Mean astringency ratings of low tannin wines were lower than ratings
of high tannin wines (Figure 5a), consistent with findings reported elsewhere (Landon et al.
2008, Peleg et al. 1999). At each storage time, panelists gave consistently higher astringency
scores to wines stored at 27°C than wines stored at 32°C, regardless of tannin level. However,
the difference was not significant. At 40 days, there was no clear distinction between the

62
Figure 4. Changes in tannin concentration following heat treatment at
either 27C or 32C and storage for 40, 55 and 70 days: (a) Cabernet
Sauvignon, n = 24 and (b) Merlot, n = 24. Different letters represent
significant difference at each time point, as determined by Tukey’s
HSD (p 0.05).
100
200
300
400
500
600
700
800
900
0 10 20 30 40 50 60 70
Low Tannin_27ºC Low Tannin_32ºC
High Tannin_27ºC High Tannin_32ºC
Mea
n T
annin
(m
g/L
CE
)
d
c
b
a
c
c
b
a
d
c
b
a
100
200
300
400
500
600
700
800
900
0 10 20 30 40 50 60 70
Mea
n T
annin
(m
g/L
CE
)
c
b
a
c c
b
a
b
b
a
a
c
Time (days)
(a)
A
(b)

63
Table 3. F-values from the analysis of variance (ANOVA) of the trained panel data (n = 21) for
astringency, bitterness and alcohol burn sensory perceptions in Cabernet Sauvignon and Merlot
wines.
Sources of variation Astringency Bitterness Alcohol Burn
Cabernet
Sauvignon
Merlot Cabernet
Sauvignon
Merlot Cabernet
Sauvignon
Merlot
Panelist 4.84** 2.44** 6.32* 3.54** 12.8** 10.9**
Tannin 86.8** 75.3** 0.05 1.66 0.55 1.06
Temperature 9.14** 10.8** 5.75* 0.96 0.75 0.09
Time 3.27* 1.11 11.0** 0.23 3.96* 0.22
Tannin x
Temperature
0.88 1.15 1.21 0.64 0.48 0.71
Tannin x Time 3.75* 19.1** 0.28 0.13 0.07 0.27
Temperature x Time 0.76 20.2** 1.23 2.74 0.21 0.07
Tannin x
Temperature x Time
2.56 1.36 0.39 0.93 0.03 0.19
MSE 6.88 7.13 5.05 2.63 8.61 7.13
*, **indicate significance at p ≤ 0.05 and p ≤ 0.01, respectively.
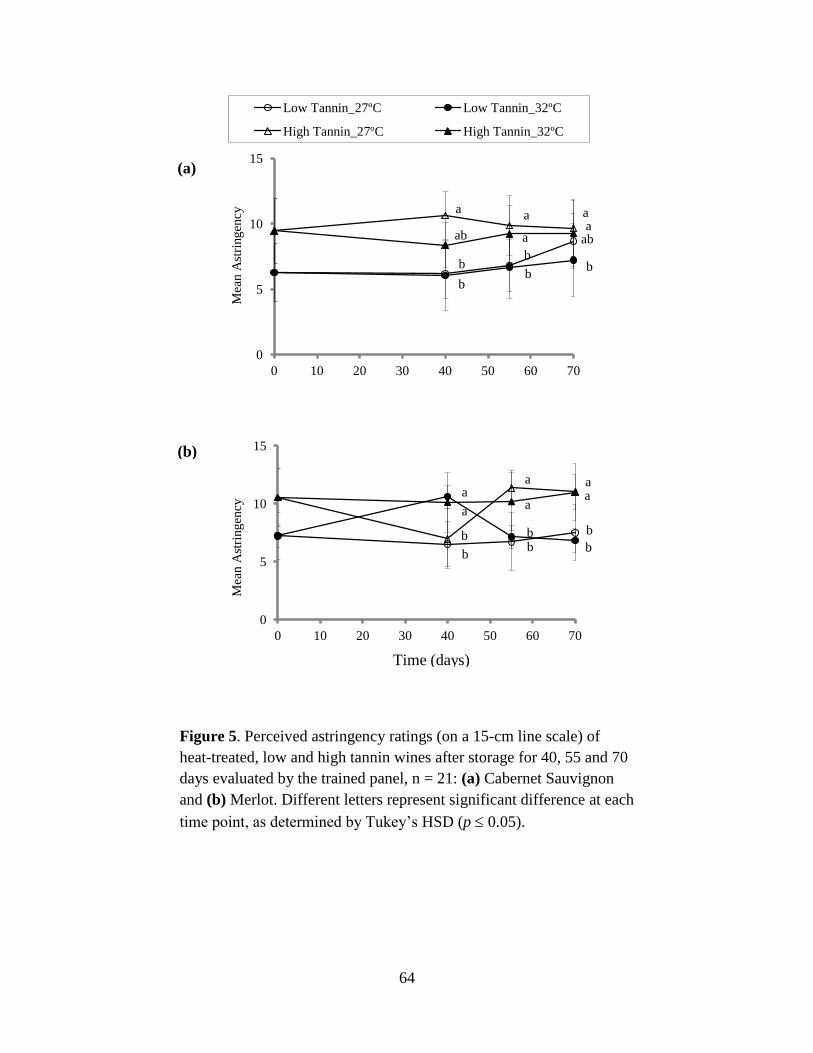
64
Figure 5. Perceived astringency ratings (on a 15-cm line scale) of
heat-treated, low and high tannin wines after storage for 40, 55 and 70
days evaluated by the trained panel, n = 21: (a) Cabernet Sauvignon
and (b) Merlot. Different letters represent significant difference at each
time point, as determined by Tukey’s HSD (p 0.05).
0
5
10
15
0 10 20 30 40 50 60 70
Low Tannin_27ºC Low Tannin_32ºC
High Tannin_27ºC High Tannin_32ºC
Mea
n A
stri
ngen
cy
b
ab a a
b
b
a
a
b
b
ab
a
0
5
10
15
0 10 20 30 40 50 60 70
Mea
n A
stri
ngen
cy
b
b
a a
b b
a
a
b
b
a
a
Time (days)
(a)
(b)

65
astringency ratings of low and high tannin wines. Significant difference was found at 55 days
between low and high tannin wines stored at 27°C or 32°C. As storage time increased, perceived
astringency increased significantly in the low tannin wines stored at 27°C, while at 32°C storage
the perceived astringency of wines of the same tannin concentration was comparable. In high
tannin wines, no significant change in astringency perception was observed over time. Thus,
storage at either 27°C or 32°C for 40 to 70 days did not significantly impact perceived
astringency.
In Merlot wines, the panelist, tannin concentration, storage temperature, and storage time
and interactions between tannin concentration and storage time and between storage temperature
and storage time significantly influenced the perception of astringency (p ≤ 0.05) (Figure 5b). At
40 days of storage, the panelists were able to distinguish between astringency of wines stored at
27°C and 32°C. Low and high tannin wines stored at 27°C were rated significantly lower in
perceived astringency compared to low and high tannin wines stored at 32°C. However, the low
tannin wines stored at 27°C or 32°C for 55 and 70 days were perceived as significantly less
astringent than the high tannin wines.
Panelist, storage temperature, and storage time significantly affected bitterness sensation
in Cabernet Sauvignon wines (p ≤ 0.05), with no significant tannin concentration and interaction
effects observed (p > 0.05). Significantly higher mean bitterness scores (10.68) were observed in
higher temperature wines (32°C) than the wines stored at 27°C (10.01), which tended to increase
with storage from 40 to 70 days. For alcohol burn, the panelist and storage time effects were both
significant (p ≤ 0.05). The mean panelist ratings of alcohol burn significantly increased when
evaluating wines stored for 40, 55, and 70 days (7.39, 7.61, and 8.26, respectively). However,
these ratings were relatively similar corresponding to medium alcohol burn intensity based on

66
the 15-cm line scale. Tannin concentration, storage temperature, and interaction effects were not
significant.
In Merlot, only the panelist effect on bitterness and alcohol burn was significant (p ≤
0.05). Overall, results showed that at each storage time and storage temperature, the panelists
were not able to detect significant difference between the wines of different tannin
concentrations or storage temperature conditions based on perceived bitterness or alcohol burn
sensations.
Relationships between chemical and sensory variables
To determine whether phenolic components could explain the sensory characteristics of
the wine and vice versa, Pearson’s correlation analysis was performed (Table 4). For both
varieties, perceived astringency was positively correlated with tannin and LPP concentration,
consistent with a previous report (Landon et al. 2008). Bitterness and alcohol burn perception
had relatively low degrees of association with SPP, LPP, anthocyanin, and tannin content.
The examination of the relationship between the wine chemical and sensory properties
also revealed marked differences between varieties. In Cabernet Sauvignon, a strong positive
correlation was observed between anthocyanin and astringency, while in Merlot these parameters
were negatively correlated. However, significant correlation was only found in Cabernet
Sauvignon (p ≤ 0.01), perhaps partly because of the magnitude difference in the anthocyanin
content between varieties across all treatments and the unclear trend in the changes in
anthocyanins in Merlot. The limited number of wines used in this study may have contributed to
the few significant correlations observed.

67
Table 4. Correlation coefficients between wine chemical and sensory characteristics.
Astringency Bitterness Alcohol Burn
Cabernet
Sauvignon
Merlot Cabernet
Sauvignon
Merlot Cabernet
Sauvignon
Merlot
Small Polymeric Pigment -0.543 0.470 0.498 -0.404 -0.276 0.326
Large Polymeric Pigment 0 .619* 0.677* 0.243 -0.377 0.583* 0.509
Anthocyanin 0.738** -0.091 -0.530 0.095 0.140 -0.361
Tannin 0.882** 0.685* -0.156 -0.408 0.230 0.548
*, ** indicate significance at p ≤ 0.05 and p ≤ 0.01, respectively.

68
Discussion
Previous research has indicated the strong influence of storage factors such as light and
oxygen on wine during aging (Somers and Evans 1986, Recamales et al. 2006). The present
study examined storage of wines in corked bottles in the absence of light; thus, the effects
observed could be attributed to initial tannin concentration, storage temperature, and time.
The influence of tannin concentration, storage temperature, and storage time on the chemical
composition and sensory properties of wines varied with variety. The differences between
Cabernet Sauvignon and Merlot wines were not surprising given the inherent difference in the
genetic composition of the grapes from which the wines were made (Ribéreau-Gayon et al.
2000). While differences were observed, similar trends were apparent that could be further
examined and validated in other wine varietals.
Results of this study showed that, as expected, anthocyanin concentrations gradually
decreased in wines while SPP and LPP were being formed. The anthocyanins were progressively
transformed into more stable oligomeric and polymeric pigments, typical of young wines
undergoing maturation and aging (Somers and Pocock 1990). Data showed that the difference in
anthocyanin level was a function of storage temperature, with more anthocyanin participating in
condensation reactions at an elevated temperature, thus resulting in less anthocyanin remaining
in the wines. Different mechanisms have been proposed by many authors involving anthocyanin
reactions to form the oligomeric and polymeric pigments (Somers 1971, Bakker and Timberlake
1997). A recent study showed that LPP were more favorably formed than SPP during bottle
aging for three years (Adams et al. 2004). However, the present results indicate there was not a
great difference in LPP content before and after the storage treatment compared with SPP

69
content, possibly because significant levels of anthocyanin may have been converted to LPP
before treatment application.
The storage temperatures that were used differentiated wines of the same tannin
concentration. Storage at 32°C resulted in significantly lower tannin concentration than storage
at 27°C. Heat treatment may have caused some modification in the tannin or pigments formed,
which have a more bitter taste than the parent compound. The loss of high molecular weight
tannins is believed to be a result of the acid-catalyzed C-C bond-breaking process in the wines,
forming low molecular weight species (Vidal et al. 2002). In Cabernet Sauvignon, the shorter
chain-length products of this reaction may account for increased bitterness perception observed
in this study.
While the conversion of tannin and formation of polymeric pigments occurred in the
wines, the expected reduction in perceived astringency was not achieved. Previous work in our
laboratory showed that trained panelists were able to distinguish between the low and medium
and low and high tannin wines. The present study shows that polymeric pigment and tannin
concentrations were significantly different between wines; however, the magnitude of difference
may have been below the detection limit of the panelists and thus was not great enough to result
in differences in perceived astringency. Clearly, the presence of higher tannin and LPP found in
both varieties contributed to higher perceived astringency.
Conclusion
This research showed that aging reactions in Merlot and Cabernet Sauvignon wines,
which increased the level of SPP while decreasing anthocyanins, were primarily due to higher
temperature of storage (32°C versus 27°C). Increase in LPP was influenced more by tannin
concentration than by storage time or temperature. In Cabernet Sauvignon, sensory perception of

70
bitterness increased with storage time at 32°C. While perceived astringency decreased over the
aging period in both wine varieties, the change was not great enough to impact perceived
astringency. Our results support earlier studies that show the usefulness of tannin concentration
to predict perceived astringency. Future work may focus on determining the optimum storage
time and temperature to investigate further changes in SPP, LPP, and tannin content and their
influence on perceived astringency.
Acknowledgments
The authors are grateful to Washington Wine Commission for funding this research and
Snoqualmie Winery for their wine donations.
Literature Cited
Adams, D.O., J.F. Harbertson, and E.A. Picciotto. 2004. Fractionation of red wine polymeric
pigments by protein precipitation and bi-sulfite bleaching. In Red Wine Color: Exploring the
Mysteries. A.L. Waterhouse and J.A. Kennedy (eds.), pp. 275-288. ACS Symp. Ser. 886. Am.
Chemical Society, Washington, DC.
ASTM. 2004. Standard definitions of terms relating to sensory evaluation of materials and
products. In Annual Book of ASTM Standards. American Society for Testing and Materials,
Philadelphia.
Bakker, J. 1998. Astringency: A matter of taste. Biologist 45:104-107.
Bakker, J., and C.F. Timberlake. 1997. Isolation, identification, and characterization of new
color-stable anthocyanins occurring in some red wines. J. Agric. Food Chem.45:35-43.
Boulton, R. 2001. The copigmentation of anthocyanins and its role in the color of red wine: A
critical review. Am. J. Enol. Vitic. 52:67-87.
Dallas, C., and O. Laureano. 1994. Effects of pH, sulfur dioxide, alcohol content, temperature
and storage time on colour composition of a young Portuguese red table wine. J. Sci. Food Agric.
65:477-485.
Fischer, U., and A.C. Noble. 1994. The effect of ethanol, catechin concentration, and pH on
sourness and bitterness of wine. Am. J. Enol. Vitic. 45:6-10.
Gawel, R. 1998. Red wine astringency: A review. Aust. J. Grape Wine Res. 4:74-95.

71
Hagerman, A.E., and L.G. Butler. 1978. Protein precipitation method for the quantitative
determination of tannins. J. Agric. Food Chem. 26:809-812.
Harbertson, J.F., E.A. Picciotto, and D.O. Adams. 2003. Measurement of polymeric pigments in
grape berry extracts and wines using a protein precipitation assay combined with bisulfite
bleaching. Am. J. Enol. Vitic. 54:301-306.
Ishikawa, T., and A.C. Noble. 1995. Temporal perception of astringency and sweetness in red
wine. Food Qual. Pref. 6:27-33.
Landon, J. 2007. Chemical and sensory assessment of astringency in Washington State red
wines. M.S. thesis, Washington State University, Pullman.
Landon, J.L., K. Weller, J.F. Harbertson, and C.F. Ross. 2008. Chemical and sensory evaluation
of astringency in Washington State red wines. Am. J. Enol. Vitic. 59:153-158.
Lattey, K.A., B.R. Bramley, I.L. Francis, M.J. Herderich, and S. Pretorius. 2007. Wine quality
and consumer preferences: Understanding consumer needs. Aust. N.Z. Wine Ind. J. 22:31-39.
Lea, A.G.H., and G.M. Arnold.1978. The phenolics of ciders: Bitterness and astringency. J. Sci.
Food Agric. 29:478-483.
Lesschaeve, I., and A.C. Noble. 2005. Polyphenols: Factors influencing their sensory properties
and their effects on food and beverage preferences. Am. J. Clin. Nutr. 81:330-335.
Levengood, J., and R. Boulton. 2004. The variation in the color due to copigmentation in young
Cabernet Sauvignon wines. In Red Wine Color: Revealing the Mysteries. A.L. Waterhouse and
J.A. Kennedy (eds.), pp. 35-52. Am. Chemical Society, Washington, DC.
Naish, M., M.N. Clifford, and G.G. Birch. 1993. Sensory astringency of 5-O-caffeoylquinic acid,
tannic acid and grape seed tannin by a time intensity procedure. J. Sci. Food Agric. 61:57-64.
Peleg, H., K. Gacon, P. Schlich, and A.C. Noble. 1999. Bitterness and astringency of flavan-3-ol
monomers, dimers and trimers. J. Sci. Food Agric. 79:1123-1128.
Picciotto, E.A. 2002. An investigation of polymeric pigments in red wine by means of a
biochemical assay and synthesis. M.S. thesis, University of California, Davis.
Recamales, A.F., A. Sayago, M.L. González-Miret, and D. Hernanz. 2006. The effect of storage
conditions on the phenolic composition and colour of white wine. Food Res. Int. 39:220-229.
Remy, S., H. Fulcrand, B. Labarbe, V. Cheynier, and M. Moutounet. 2000. First confirmation in
red wine of products resulting from direct anthocyanin-tannin reactions. J. Sci. Food Agric.
80:745-751.

72
Ribéreau-Gayon, P., D. Dubourdieu, B. Donèche, and A. Lonvaud. 2000. Handbook of Enology.
Vol 1. The Microbiology of Wine and Vinifications, pp. 248-252. Wiley & Sons, Chichester,
UK.
Singleton, V.L. 1992. Tannins and the qualities of wines. In Plant Polyphenols. R.W.
Hemingway and P.E. Laks (eds.), pp. 859-880. Plenum Press, New York.
Somers, T.C. 1968. Pigment profiles of grapes and of wines. Vitis 7:303-320.
Somers, T.C. 1971. Polymeric nature of wine pigments. Phytochemistry 10:2175-2186
Somers, T.C., and M.E. Evans. 1986. Evolution of red wines I. Ambient influence on colour
composition during early maturation. Vitis 25:31-39.
Somers, T.C., and K.F. Pocock. 1990. Evolution of red wines III. Promotion of the maturation
phase. Vitis 29:109-121.
Vidal, S., D. Cartalade, J.M. Souquet, H. Fulcrand, and V. Cheynier. 2002. Changes in
proanthocyanidin chain-length in winelike model solutions. J. Agric. Food Chem. 50:2261-2266.

73
CHAPTER IV
EFFECTS OF ETHANOL, TANNIN AND FRUCTOSE ON THE HEADSPACE
CONCENTRATION AND POTENTIAL SENSORY SIGNIFICANCE OF
ODORANTS IN MODEL WINES
Abstract
The effects of ethanol, tannin and fructose concentrations on the headspace concentration
of eight selected odorants were investigated using headspace solid phase microextraction (HS-
SPME) and gas chromatography- mass spectrometry (GC-MS). The results showed significant
three-way interaction effects for the majority of odorants (p ≤ 0.05). In general, increased tannin
concentration exhibited an enhancement effect while fructose induced a retention effect, both of
which were largely dependent upon ethanol. The net magnitude effect was a substantial
reduction in the headspace concentration of odorants with the dominant contribution from
ethanol. Reduction in odorant recovery was determined to be a function of molecular weight.
Subsequent gas chromatography-olfactometry (GC-O) analysis revealed differences in the
estimated odor thresholds of odorants in model wines. Threshold values increased between 2 and
10,000-fold consequently, lowering the odor unit values (OUV) of odorants. These results
highlighted the significant impact that wine matrix interactions can have on wine aroma quality.
Introduction
Wine aroma is one of the major determining factors influencing consumer acceptance.1-2
As with other food products, the perception of wine aroma is related predominantly to the nature
and concentration of aroma compounds in the gaseous phase above the wine. More than 800
volatile compounds have been estimated to be present in wine3 while only a few compounds
exist at concentrations above the sensory perception threshold.4-7

74
Several studies conducted to understand wine aroma perception have focused on the main
effects of the wine matrix composition using static headspace solid phase microextraction (HS-
SPME) and dynamic headspace analytical techniques. Ethanol, a major component of the wine
matrix has been shown to decrease the partition coefficient of various classes of volatile
compounds by increasing the solubility of volatile compounds in model wine systems.8-12
Aznar
et al.13
measured the effect of ethanol on the headspace partitioning of 11 compounds and
reported that the hydrophobicity of the compound was also a determining factor influencing the
partition of volatile compounds in the headspace of ethanolic solutions. The suppression effect of
ethanol on aroma was determined to correspond to the changes in odor detection threshold in the
presence or absence of ethanol. As reviewed by Grosch,14
GC-O results showed a dramatic
increase in threshold values (suppression effect) in the presence of ethanol (55.6 mg/L). The
increase in odor threshold ranged between factors of 10 for ethylhexanoate to a factor of 312 for
methylpropanol.14
Investigations using both exponential dilution techniques and nuclear magnetic resonance
(1H NMR) spectroscopy showed a hydrophobicity-driven, weak bimolecular aroma-phenolic
compound interaction.15
Additional NMR analyses confirmed that the aroma-phenolic interaction
was due to the presence of π-π stacking between a galloyl ring and the aromatic ring of aroma
compounds, of which stability was provided by hydrogen bonding.16
Few studies using HS-
SPME/GC-MS technique demonstrated different effects of monomeric phenols on the
partitioning of odorants.17-18
Dufour & Bayonove15
investigated the influence of wine condensed
tannins on the volatility of some volatile compounds using a dynamic headspace technique. The
authors found that addition of tannin (0-5 g/L) resulted in increased volatility of limonene and a
slight increase in benzaldehyde volatility but had no effect on isoamylacetate and

75
ethylhexanoate. Lund et al.19
conducted sensory difference tests (R- index methodology) to
evaluate the effect of polyphenols on the perception of key odorants found in New Zealand
Sauvignon Blanc wines. The results showed an increase in the threshold of isobutyl
methoxypyrazine, 3-mercaptohexanol and ethyldecanoate after the addition of catechin (12
mg/L), caffeic acid (102 mg/L) and quercetin (10 mg/L) in a dilute base wine. In another study,
panelist found lower perception of fruity, citrus, strawberry, cooked fruit and floral aromas in
Malbec wines containing high polyphenols (5.4-7.2 g/L) compared to the low polyphenol
content (1.4-3.2 g/L), indicating a matrix effect.20
However, few interaction effects among wine components have been described in the
literature. Wine is a complex alcoholic beverage, which contains numerous components that may
interact with odorants and alter the quantity of volatile compounds available for perception.
Robinson et al.21
found a significant reduction of peak areas for most volatiles due to ethanol,
and this effect was slightly increased in the presence of glucose in model solutions. In another
study using model white wine, Jones et al.22
demonstrated the influence of interactions among
major wine components on perceived aroma intensity. Their results showed more evident
interaction effects of wine proteins, alcohol and glycerol concentration at the lower volatile
concentration. Ethanol and glycerol were also shown to be involved in either polysaccharides or
protein interactions, with the lowest overall aroma observed when polysaccharides and glycerol
were present at lower ethanol concentration (11%, v/v).
Thus, the aim of the present study was to investigate the possibility of higher order
interaction effects among the wine components, ethanol, tannin and fructose, which may impact
the headspace concentration of selected odorants and their relative potential significance to the
aroma of model wine.

76
Materials and Methods
Chemicals and reagents
All odorants including the internal standards (IS) were purchased from Sigma-Aldrich
(St. Louis, MO): 1-octen-3-one (50 wt. % in 1-octen-3-ol), β-damascenone (1.1-1.3 wt. % in 190
proof ethanol), 2-phenylethanol (≥99 %), 3-methyl-1butanol, dimethyl disulfide, 1-hexanol, 2-
methoxyphenol, eugenol, 1-pentanol (IS) and 1-dodecanol (IS) (≥98 %). Pure ethanol (100%)
was obtained from Decon Labs, Inc. (King of Prussia, PA) while grape tannin, Biotan, was
provided by Laffort Company (Sonoma, CA). D-(-)-fructose, L-(+)-tartaric acid, NaCl and
NaOH were procured from Sigma-Aldrich (St. Louis, Mo). Milli-Q water used was purified
(Millipore, Bedford, MA).
Model wine preparation
Thirty (30) different model wine solutions replicated five times were prepared based on a
full-factorial design used to assess the effect of ethanol (8, 10, 12, 14, and 16 %, v/v), grape
tannin, Biotan (500, 1000 and 1500 mg/L) and fructose (200 mg/L and 2000 mg/L). All model
wines contained tartaric acid (5000 mg/L) and were spiked with eight selected odorants of
different physico-chemical and aroma properties commonly found in red wines: 50 mg/L 3-
methyl-1butanol, (caramel/cooked), 4 mg/L dimethyl disulfide (chemical/sulfury), 2 mg/L 1-
hexanol (herbaceous/green), 1 mg/L 1-octen-3-one (earthy/mushroom), 4 mg/L methoxyphenol
(woody/medicinal), 14 mg/L 2-phenylethanol (floral/rose), 0.5 mg/L eugenol (spicy/clove), and
2 mg/L β-damascenone (fruity) (Table 5). The above concentrations of odorants were selected as
they are within the range present in wines that could be analyzed by gas chromatography. For
each odorant, a stock solution was prepared every two weeks in 50 % ethanol/Milli Q (v/v) water
and stored at 5 °C in a 5 mL amber vial sealed with a PTFE/Silicone septum until the solution

77
Table 5. Physicochemical and sensory properties of eight odorants used in the study.
Compound CAS
Registry
No.
MW BP (°C) Log P
valuea
Aroma
Descriptorsb
Aroma
Categoryc
3-methyl-1-butanol 123-51-3 88.15 131.1 1.16 whiskey,
malt, burnt
caramel
dimethyl disulfide 624-92-0 94.19 109.8 1.77 onion,
cabbage
chemical
1-hexanol 111-27-3 102.2 157.6 2.03 green,
flower
herbaceous
1-octen-3-one 4312-99-6 126.2 162.0 2.37 mushroom,
metal
earthy
2-methoxyphenol 90-05-1 124.1 205.0 1.32 smoke,
medicine
woody
2-phenylethanol
60-12-8 122.2 218.2 1.36 honey,
spice, rose
floral
eugenol 97-53-0 164.2 253.2 2.27 clove,
honey
spicy
β-damascenone 23726-93-4 190.3 265.1 4.21 apple, rose,
honey
fruity
aHydrophobic constant
32
b Flavornet
33
cNoble et al.
34

78
was used. Prior GC-MS analysis results showed no change in odorant concentration within two
weeks of storage. The pH of the model wines was adjusted to 3.4 with 1 M NaOH.
HS-SPME/ GC-MS analysis
The volatiles were isolated and concentrated using the headspace solid-phase
microextraction (HS-SPME) technique. A sample consisting of two (2) milliliter of each model
wine was spiked with the odorants and then introduced into a 10-mL amber vial sealed with a
magnetic stainless steel screw cap (PTFE/silicone septum). All samples were saturated with
32.5% (w/v) (0.65g) NaCl and volatiles were extracted using a CTC Combi-PaL autosampler
(Zwingen, Switzerland). The optimized parameters wherein optimum odorant concentration was
obtained for a reasonable extraction time were: pre-incubation time for 5 min, incubation
temperature at 30°C, agitator speed at 250 rpm, agitator-on time for 5 s, agitator-off time for 2 s,
extraction time at 30 min and desorption time for 5 min. Prior to use, a
polydimethysiloxane/divinylbenzene (PDMS/DVB) coated- fiber (65 µm) was conditioned at
250°C for 30 min.
Samples were then analyzed using a GC 6890N chromatograph coupled with a mass
spectrometer (MS 5975) (Agilent technologies, Avondale, PA) functioning in the EI mode. The
following GC column was used: HP-5MS (30.0 m x 250 µm x 0.25 µm). The injection was done
in splitless mode at 200°C for 5 min. Helium carrier flow was set at the rate of 1 mL/min. The
detector temperature was 250°C. The GC oven was programmed as follows: 35°C for 3 min;
0.50°C/min ramp to 60°C; 2°C/min ramp to 120°C; 10°C/min ramp to 210°C; 20°C/min ramp to
230°C; and held at 230°C for 10 min. Data were collected in scan mode (33 to 300 m/z).
Compounds were identified by comparison of each mass spectra with those of pure reference

79
compounds and confirmed using the NIST mass spectra library provided by the Chemstation
software (version E.02.00.493).
The quantitation was performed by internal standard calibration procedure using 10 mg/L
1-pentanol and 0.25 mg/L 1-dodecanol as internal standards (IS). A five-point standard curve
covering the concentration range at which the odorants were detected was constructed for each
odorant in each model system by linear regression analysis. The unknown concentration of the
odorant was determined from the standard curves by examining the ratio of the target odorant
concentration to the IS concentration that corresponded to the ratio of their integrated total ion
chromatogram (TIC) peak areas multiplied by the IS concentration. Analyses were conducted in
triplicate.
Odor threshold and odor unit value (OUV) determination
The detection threshold of the eight aroma compounds considered in the study was
measured in the selected eight different model wines by using a combination of the HS-
SPME/gas chromatography- olfactometry (HS-SPME/GC-O) technique. Odorants were diluted
for 5 to 6 times by a factor of 10 in the prepared model wine solutions. The model wine solutions
varied in concentrations of ethanol (10 and 14%, v/v), tannin (500 and 1,500 mg/L) and fructose
(200 and 2000 mg/L). Tartaric acid was added at 5,000 mg/L and the pH was adjusted to 3.4
with 1 M NaOH.
GC-O analysis
The volatile compounds were extracted and concentrated using a 65µm PDMS/DVB
fiber, following the optimized condition parameters described previously for the SPME/GC-MS
analysis. The samples were analyzed using the same GC column and GC-MS instrument
equipped with an olfactometry port connected by a flow splitter to the column exit.

80
Chromatographic conditions were identical to those used for the GC-MS analysis with slight
modification of the GC temperature program as follows: initial temperature at 35º C; 6ºC/min
ramp to 200ºC; 30ºC ramp to final temperature at 230ºC. The final temperature was held for 2
min with a total GC run of 35 min.
Four assessors (1 male and 3 females) between 21 and 51 years old, and who had
previous experience in descriptive analysis of the same model wines, participated in the study.
All judges were trained during the preliminary sessions (3, one-hr sessions) to identify and detect
the target eight compounds by sniffing the GC effluents coming out of the olfactory port for 25
min. During the formal evaluation, model solutions were analyzed with odorants prepared at
decreasing concentrations. The assessors were asked to record the odor description of each
odorant perceived. Individual best estimate threshold values were determined for each panelist
by obtaining the geometric mean of the highest concentration missed and the next higher
concentration.23
The geometric mean of the individual best estimate threshold values was
calculated and reported as the group threshold. The OUV for each odorant compound was
computed as the ratio of its concentration to its odor threshold as cited by Buttery et al.24
in
respective model wine matrices.
Statistical data analysis
Three-way analysis of variance (ANOVA) (ethanol, tannin and fructose) and Tukey’s
HSD multiple comparisons of means were performed on the GC-MS data using XLSTAT
statistical software (XLSTAT version 2011; 2.01). Significance was defined as p < 0.05. Mean
odorant recovery in each type of wine was determined and principal component analysis (PCA)
was applied to explore the relationship among odorants and model wines with different
concentrations of ethanol, tannin and fructose (SAS Institute, Cary NC).

81
Results and Discussion
The present study assessed the effects of ethanol, tannin and fructose, and their
corresponding interactions on the headspace partitioning of eight wine-impact odorants in a
model system using HS- SPME/GC-MS analysis. Ethanol levels used in this investigation
reflected the concentration range found in commercial red wines. The low (500 mg/L), medium
(1000 mg/L), and high (1500 mg/L) grape tannin, Biotan concentrations were selected based in
part on the groupings established previously for the low, medium and high tannin commercially
available red wines25
. Fructose concentrations used were within the range present in wines
considered as “dry”.26
The recovery of odorants in the headspace of model solutions was quantified using an
internal standard calibration method as described in the materials and methods section. For each
odorant, 30 calibration curves were obtained from 30 different model solution matrices
constructed by linear regression analysis. The effect of sample matrix on the headspace SPME
during compound quantification was previously noted12
and thus, for this study, calibration
standards were prepared in the model solution similar to the sample matrix. The calibration
curves were linear with mean determination coefficients across all model wine matrices as
follows: for 3-methyl-1-butanol, r2 = 0.9303; for dimethyl disulfide, r
2 = 0.9593; for 1-hexanol,
r2 = 0.9579, for 1-octen-3-one, r
2 = 0.9135; for 2-methoxyphenol, r
2 = 0.9670; for 2-
phenylethanol, r2 = 0.9502; for eugenol, r
2 = 0.9672; and for β-damascenone, r
2 = 0.9729.
Matrix effects.
Table 6 presents a summary of the ANOVA results showing statistical significance of the
observed effects from ethanol, tannin and fructose variables. As expected, all of the selected

82
Pro
bab
ilit
y (
p)
val
ues
β-d
amas
-
cenone
<0.0
001
0.5
34
<0.0
001
0.7
07
<0.0
001
<0.0
001
<0.0
001
eugen
ol
<0.0
001
<0.0
001
<0.0
001
0.0
02
<0.0
001
<0.0
001
<0.0
001
2-p
hen
yl-
ethan
ol
<0.0
001
0.0
8
<0.0
001
<0.0
001
<0.0
001
0.0
02
0.0
01
2-
met
hoxy-
phen
ol
<0.0
001
<0.0
001
<0.0
001
0.0
11
<0.0
001
<0.0
001
<0.0
001
1-o
cten
-3-
one
<0.0
001
0.0
001
0.7
8
0.3
08
<0.0
001
<0.0
001
0.1
64
1-h
exan
ol
<0.0
001
0.0
13
<0.0
001
<0.0
001
<0.0
001
<0.0
001
<0.0
001
p v
alues
≤ 0
.05 a
re s
ignif
ican
t d
imet
hyl
dis
ulf
ide
<0.0
001
0.6
5
<0.0
001
0.0
001
0.0
92
0.0
001
0.0
11
3-m
ethyl-
1-
buta
nol
<0.0
001
<0.0
001
0.0
44
<0.0
001
<0.0
001
<0.0
001
0.1
54
df 4
2
1
8
4
2
8
Sourc
es o
f
var
iati
on
Eth
anol
(Et)
Tan
nin
(T
)
Fru
ctose
(F
)
Et
x T
Et
x F
T x
F
Et
x T
x F
Tab
le 6
. S
tati
stic
al s
ignif
ican
ce o
f th
e in
fluen
ce o
f in
tera
ctio
ns
of
ethan
ol,
tan
nin
, fr
uct
ose
.

83
eight odorants in the model wines studied were affected by ethanol, tannin and fructose to
varying degrees.
The odorant, 3-methyl-1-butanol was significantly influenced by the concentration of
ethanol (p < 0.001), tannin (p < 0.001) and fructose (p < 0.05). In addition, all two-way
interactions were significant (p < 0.001). Upon closer inspection of these interactions, tannin
concentration showed no significant effect on odorant recovery at higher ethanol concentrations
(14 and 16%). However, at lower ethanol concentration (8, 10 and 12%), significantly higher
recovery of odorant was obtained in the presence of low tannin than in medium or high tannin
concentration (Figure 6a and 6b). Increasing tannin level resulted in decreased odorant
concentration but only at the low level of fructose. At the high fructose level, the recovery of 3-
methyl-1-butanol decreased as tannin was reduced from low to medium and then increased again
as tannin increased from medium to high tannin. On the other hand, odorant recovery
significantly decreased as ethanol increased at high fructose concentration. At the low fructose
level, reduction of odorant recovery was less pronounced with increased ethanol concentration.
Both ethanol and fructose had significant main effects on decreasing the headspace
concentration of dimethyl disulfide (p < 0.001) although both factors were also implicated in
two-way interactions with tannin. In addition, a higher order interaction was also found
involving ethanol, tannin and fructose (p < 0.05). The low tannin model wines had lower
dimethyl disulfide recoveries than the high tannin wines at either 10% or 14% ethanol at high
fructose concentration. This effect was reversed when ethanol concentration reached 16%
(Figure 7a and 7b). In general, the suppression of ethanol on volatile compound recovery was
more pronounced when fructose concentration was high. The lowest concentration of dimethyl
disulfide was seen in the presence of high tannin and fructose at the highest alcohol level (16%).

84
0
10
20
30
40
50
60
70
8 10 12 14 16
3 m
eth
yl-
1-b
uta
no
l (m
g/L
)
500 1000 1500 Tannin (mg/L)
0
10
20
30
40
50
60
70
8 10 12 14 16
3-m
ethyl-
1-b
uta
no
l (
mg/L
)
Ethanol (%)
Figure 6. Concentrations of 3-methyl-1-butanol from model wines
with different ethanol, tannin and fructose concentrations (a) low
fructose, 200 mg/L (b) high fructose, 2000 mg/L, extracted using
headspace SPME with a PDMS/DVB coated fiber. Error bars
denote standard deviations (n = 3 to 5).
(a)
(b)

85
0
1
2
3
4
5
6
8 10 12 14 16
dim
ethyl
dis
ulf
ide
(mg/L
)
500 1000 1500 Tannin (mg/L)
0
1
2
3
4
5
6
8 10 12 14 16
dim
ethyl
dis
ulf
ide
(mg/L
)
Ethanol (%)
Figure 7. Concentrations of dimethyl disulfide from model wines with
different ethanol, tannin and fructose concentrations (a) low fructose, 200
mg/L (b) high fructose, 2000 mg/L, extracted using headspace SPME with a
PDMS/DVB coated fiber. Error bars denote standard deviations (n = 3 to 5).
(a)
(b)

86
The effects of ethanol, tannin and fructose and their interactions on the recovery of 1-
hexanol were all statistically significant (predominantly p < 0.001). The concentration of 1-
hexanol in model wines decreased at lower ethanol concentrations (8 and 10%) when tannin
levels increased. However, at a higher concentration of ethanol (12 and 14%), increasing tannin
resulted in a slight increase in recovery of the odorant (Figure 8a and 8b). Generally, at the
same level of ethanol, higher concentrations of the 1-hexanol were recovered in the presence of
low fructose than in high fructose.
Ethanol and tannin were the factors with an observed main effect on the headspace
concentration of 1-octen-3-one (p < 0.001 and p = 0.001, respectively). However, these factors
were also implicated in two-way interactions with fructose. Further examination of the ethanol x
fructose data showed that at the lower ethanol concentrations (8 and 10%), a significantly higher
concentration of 1-octen-3-one was recovered when the fructose level was low. In contrast, at
12% ethanol, a higher recovery of 1-octen-3-one was obtained from model wines containing high
compared to low fructose levels. At the higher level of ethanol (14 and 16%), no effect of
fructose was observed. No clear effect was observed from the interaction between tannin and
fructose (Figure 9a and 9b).
As with 1-octen-3-one, the main and all interaction effects on 2-methoxyphenol involving
ethanol, tannin and fructose were significant (p < 0.001). In general, a sharp reduction of odorant
recovery was observed with increasing ethanol and fructose. This depressive effect was more
apparent at high fructose concentrations (Figure 10b). At low fructose and lower ethanol content
(8% and 10%), odorant concentrations in low and high tannin content model wines were
comparable. The suppression effect of tannin was clearly demonstrated when the ethanol content
reached 12% ethanol (Figure 10a).

87
0.0
0.5
1.0
1.5
2.0
2.5
3.0
8 10 12 14 16
1-h
exan
ol
(mg/L
)
500 1000 1500 Tannin (mg/L)
0.0
0.5
1.0
1.5
2.0
2.5
3.0
8 10 12 14 16
1-h
exan
ol
(mg/L
)
Ethanol (%)
Figure 8. Concentrations of 1-hexanol from model wines with
different ethanol, tannin and fructose concentrations (a) low
fructose, 200 mg/L (b) high fructose, 2000 mg/L, extracted using
headspace SPME with a PDMS/DVB coated fiber. Error bars denote
standard deviations (n = 3 to 5).
(a)
(b)

88
0.0
0.5
1.0
1.5
2.0
8 10 12 14 16
1-o
cten
-3-o
ne
(mg/L
)
500 1000 1500 Tannin (mg/L)
0.0
0.5
1.0
1.5
2.0
8 10 12 14 16
1-o
cten
-3-o
ne
(mg/L
)
Ethanol (%)
Figure 9. Concentrations of 1-octen-3-one from model wines with
different ethanol, tannin and fructose concentrations (a) low fructose,
200 mg/L (b) high fructose, 2000 mg/L, extracted using headspace
SPME with a PDMS/DVB coated fiber. Error bars denote standard
deviations (n = 3 to 5).
(a)
(b)

89
0
2
4
6
8
8 10 12 14 16
2-m
etho
xyp
heno
l (m
g/L
)
500 1000 1500 Tannin (mg/L)
0
2
4
6
8
8 10 12 14 16
2-m
etho
xyp
heno
l (m
g/L
)
Ethanol (%)
Figure 10. Concentrations of 2-methoxyphenol from model wines with
different ethanol, tannin and fructose concentrations (a) low fructose,
200 mg/L (b) high fructose, 2000 mg/L, extracted using headspace
SPME with a PDMS/DVB coated fiber. Error bars denote standard
deviations (n = 3 to 5).
(a)
(b)

90
Ethanol and fructose were the only factors exerting a main effect on the recovery of 2-
phenylethanol (p < 0.001). However, a higher order interaction between ethanol, fructose, and
tannin was also observed (Figure 11a and 11b). The general trend was that increasing ethanol
led to a reduction in 2-phenylethanol recovery, with lower recovery of the odorant at a high
fructose level. With few exceptions, the difference in recoveries due to tannin concentration was
not significant (p > 0.05). A significant tannin effect was found at 12 and 14% ethanol and low
fructose concentration, wherein higher tannin resulted in higher odorant recovery (p < 0.05).
The concentration of eugenol was highly influenced by all factors and their interactions
(predominantly, p < 0.001). Increasing ethanol concentration from 8 to 16% negatively impacted
the recovery of the odorant but only at the low fructose level (Figure 12a). At high fructose
level, this trend was only evident when the tannin concentration was high (Figure 12b). Also, at
the high fructose level, high tannin concentration enhanced the recovery of the odorant when
ethanol concentrations were at 8, 10 and 12% in model wines.
β-damascenone was highly affected by the main effects of ethanol and fructose (p <
0.001). Two-way and three-way interactions were also significant except for the ethanol and
tannin interaction (p > 0.05). Higher ethanol level significantly decreased the concentration of β-
damascenone extracted from the model wines. The negative impact of ethanol on the recovery of
the odorant was more influenced by the high amount of fructose than the tannin counterpart
(Figure 13a and 13b). Tannin concentration did not show significant effects on the recovery of
the odorant except when fructose was low and ethanol was at its lowest concentration (8%).
Under this condition, odorant recovery increased with an increase in tannin concentration from
low to medium. A further increase in tannin concentration resulted in a significantly lower

91
0
5
10
15
20
25
30
8 10 12 14 16
2-p
hen
yle
than
ol
(mg/L
)
500 1000 1500 Tannin (mg/L)
0
5
10
15
20
25
30
8 10 12 14 16
2-p
hen
yle
than
ol
(mg/L
)
Ethanol (%)
Figure 11. Concentrations of 2-phenylethanol from model wines with
different ethanol, tannin and fructose concentrations (a) low fructose,
200 mg/L (b) high fructose, 2000 mg/L, extracted using headspace
SPME with a PDMS/DVB coated fiber. Error bars denote standard
deviations (n = 3 to 5).
(a)
(b)

92
0.0
0.2
0.4
0.6
0.8
1.0
8 10 12 14 16
eugen
ol
(mg/L
)
500 1000 1500 Tannin (mg/L)
0.0
0.2
0.4
0.6
0.8
1.0
8 10 12 14 16
eugen
ol
(mg/L
)
Ethanol (%)
Figure 12. Concentrations of eugenol from model wines with different
ethanol, tannin and fructose concentrations (a) low fructose, 200 mg/L
(b) high fructose, 2000 mg/L, extracted using headspace SPME with a
PDMS/DVB coated fiber. Error bars denote standard deviations (n = 3 to 5).
(a)
(b)
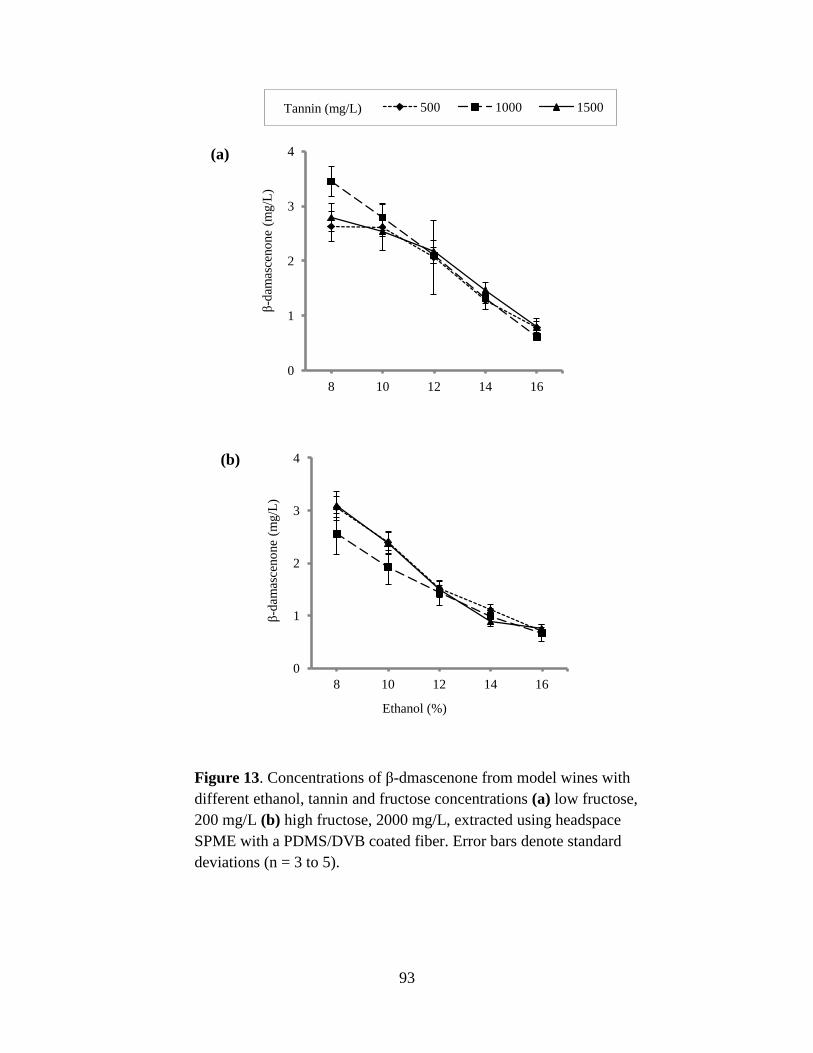
93
0
1
2
3
4
8 10 12 14 16
β-d
amas
ceno
ne
(mg/L
)
500 1000 1500 Tannin (mg/L)
0
1
2
3
4
8 10 12 14 16
β-d
amas
ceno
ne
(mg/L
)
Ethanol (%)
Figure 13. Concentrations of β-dmascenone from model wines with
different ethanol, tannin and fructose concentrations (a) low fructose,
200 mg/L (b) high fructose, 2000 mg/L, extracted using headspace
SPME with a PDMS/DVB coated fiber. Error bars denote standard
deviations (n = 3 to 5).
(a)
(b)

94
recovery, which was comparable with the recovery of β-damascenone in the presence of low
tannin.
The above ANOVA results showed that the impact of interactions among ethanol, tannin
and fructose on volatile compound partitioning varied with the odorant, suggesting the influence
of some physicochemical nature of the individual compound. A linear relationship between
percent relative reduction in odorant concentration due to ethanol, tannin and fructose
concentrations and compound molecular weight was found. The percent reduction in odorant
recovery at the highest ethanol, tannin and fructose concentration relative to the recovery at the
lowest level of these factors was observed to be higher for the larger, less volatile compounds
such as in 1-octen-3-one (72.4%, MW=126.20), 2-methoxyphenol (74.3%, MW=124.12), 2-
phenylethanol (74.9%, MW=122.16), eugenol (70.7%, MW=164.20), and β-damascenone
(75.5%, MW=190.28). A decrease in volatile recovery was less pronounced on the low
molecular weight, more volatile compounds such as 3-methyl-1-butanol (57.2%, MW=88.15),
dimethyl disulfide (58.0%, MW=94.20) and 1-hexanol (61.7%, MW=102.17). The greater
retention observed with higher molecular weight compounds may be due to their lower rate of
diffusion through the matrix as compared to the lower molecular weight compounds.
Consequently, this might lead to an unbalanced perception of aroma with mainly smaller
compounds dominating the headspace, a possibility that requires further sensory investigation.
Overall, these findings clearly indicate the complex interactions between odorants and
wine components. Results of ANOVA showed that ethanol concentration was consistently
implicated in the main effects for all odorants and compared with the other factors, displayed the
largest impact on the headspace recovery of volatile compounds. Fructose and tannin factors
were also implicated in the main effects but to a lesser extent than ethanol. However, all the

95
factors studied were generally involved in a significant three-way interaction, indicating that the
impact on odorant recovery should be explained in terms of the combined effects of ethanol,
tannin and fructose.
A general view of the combined effects of ethanol, tannin and fructose on the headspace
recovery of odorants can be described. Ethanol demonstrated a suppression effect which can be
attributed by its ability to act as co-solvent with water, enhancing the solubility of the odorants.27
Higher fructose concentration also reduced odorant recovery. The greater retention of odorants in
the solution driven by the increase in fructose may have been due to the hydration of more
fructose molecules, which depleted the available water molecules. This possibly increased the
effective concentration of ethanol and resulted in more of the odorants kept in solution.
In contrast, tannin displayed an enhancement effect, which allowed a greater release of
the odorants into the headspace, but this was limited by the ethanol concentration. At 8, 10 and
12% ethanol concentrations, the salting-out effect was more enhanced. It is possible that at
relatively lower ethanol concentrations, more incidence of tannin self-aggregation occurred,28-29
which led to a decrease in the potential binding sites for odorants. As the ethanol concentration
increased, self-association of tannins decreased28
thereby increasing hydrophobic interactions
between tannin and odorants. This resulted in a reduction in the headspace recovery of odorants
as observed.
Considering all the possible mechanisms involved, the net magnitude effect from the
increase in ethanol, tannin and fructose was a strong reduction in headspace concentration of all
odorants with the dominant contribution arising from ethanol as observed. Since the perception
of wine aroma and flavor is dependent predominantly on the concentration of odorants in the

96
headspace above the wines, the treatment effects imply a considerable reduction of impact
among these compounds on the perceived wine aroma and flavor during consumption.
PCA analysis
The relationship between odorants to each other and among model wine samples were
further analyzed using PCA (Figure 14). The effect of ethanol concentration was found to be
larger than the effect of tannin and fructose concentrations and in agreement with the trends
found using ANOVA. The first principal component (PC 1) separated the model wines as a
function of ethanol (85% variation) whereas the second principal component (PC 2)
distinguished the wines by fructose and to a lesser extent by tannin concentration (6% variation).
Model wines with lower ethanol concentrations (8 and 10%) were characterized by higher
headspace recovery of 2-phenylethanol, 2-methoxyphenol, dimethyl disulfide, 1-hexanol, 1-
octen-3one, and β-damascenone. At higher fructose concentration, the recovery of eugenol
decreased while 3-methyl-1-butanol increased. The increase in tannin concentration showed less
effect on odorant recovery in model wines with higher ethanol (14 and 16%) than those with
lower ethanol content (8, 10 and 12%).
Effects on threshold and odor unit values
The odor threshold values obtained for all odorants determined in different model wine
solutions were generally higher than the values previously reported (Table 7). The suppression
effect of the combination of ethanol, tannin and fructose observed on the headspace recovery of
odorants indeed contributed to the increase in odor threshold values. At either 10% or 14%
ethanol, high tannin and high fructose concentrations resulted in higher odor thresholds for the
majority of odorants. The highest threshold value was found in the model wines containing 14%
ethanol, high tannin (1500 mg/L) and high fructose (2000 mg/L). The threshold value increased

97
8LTHF
8MTHF
8HTHF
10LTHF
10MTHF
10HTHF
12LTHF
12MTHF
12HTHF
14LTHF
14MTHF 14HTHF
16LTHF 16MTHF
16HTHF
8LTLF
8MTLF
8HTLF
10LTLF
10MTLF
10HTLF
12LTLF
12MTLF
12HTLF
14LTLF
14MTLF
14HTLF
16LTLF
16MTLF
16HTLF
3methyl1butanol
dimethyl disulfide
1-hexanol 1-octen-3-one
2methoxyphenol 2phenylethanol
eugenol
Bdamascenone
-1.5
-0.5
0.5
-15 -10 -5 0 5 10 15
PC
2 (
6.4
%)
PC 1 (85.0 %)
Figure 14. Principal component analysis showing the relationships among odorants and
model wines. 8, 10, 12, 14, and 16 = percent ethanol (v/v), LT=Low tannin, MT=Medium
tannin, HT=High tannin, LF=Low fructose, HF=High fructose.
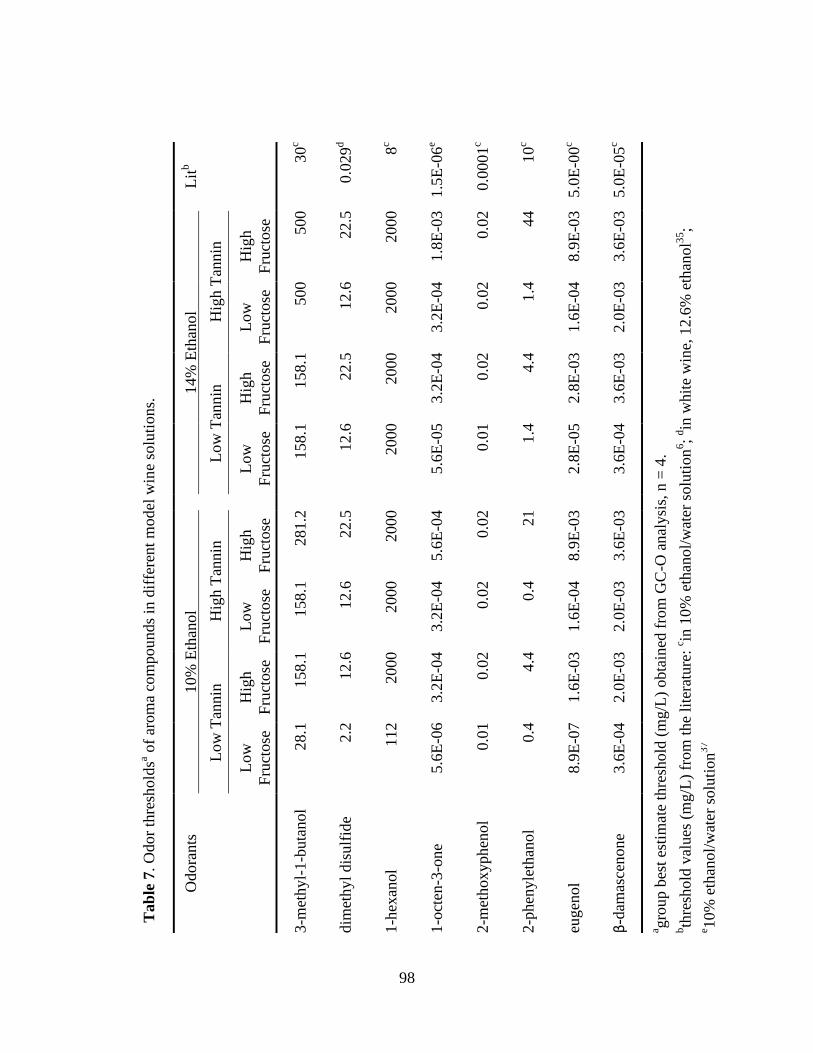
98
Lit
b
30
c
0.0
29
d
8c
1.5
E-0
6e
0.0
001
c
10
c
5.0
E-0
0c
5.0
E-0
5c
a gro
up b
est
esti
mat
e th
resh
old
(m
g/L
) obta
ined
fro
m G
C-O
anal
ysi
s, n
= 4
. bth
resh
old
val
ues
(m
g/L
) fr
om
the
lite
ratu
re:
c in 1
0%
eth
anol/
wat
er s
olu
tion
6;
din
whit
e w
ine,
12.6
% e
than
ol3
5;
e 1
0%
eth
anol/
wat
er s
olu
tion
37
14%
Eth
anol Hig
h T
annin
Hig
h
Fru
ctose
500
22.5
2000
1.8
E-0
3
0.0
2
44
8.9
E-0
3
3.6
E-0
3
Low
Fru
ctose
500
12.6
2000
3.2
E-0
4
0.0
2
1.4
1.6
E-0
4
2.0
E-0
3
Low
Tan
nin
Hig
h
Fru
ctose
158.1
22.5
2000
3.2
E-0
4
0.0
2
4.4
2.8
E-0
3
3.6
E-0
3
Low
Fru
ctose
158.1
12.6
2000
5.6
E-0
5
0.0
1
1.4
2.8
E-0
5
3.6
E-0
4
10%
Eth
anol Hig
h T
annin
Hig
h
Fru
ctose
281.2
22.5
2000
5.6
E-0
4
0.0
2
21
8.9
E-0
3
3.6
E-0
3
Low
Fru
ctose
158.1
12.6
2000
3.2
E-0
4
0.0
2
0.4
1.6
E-0
4
2.0
E-0
3
Low
Tan
nin
Hig
h
Fru
ctose
158.1
12.6
2000
3.2
E-0
4
0.0
2
4.4
1.6
E-0
3
2.0
E-0
3
Low
Fru
ctose
28.1
2.2
112
5.6
E-0
6
0.0
1
0.4
8.9
E-0
7
3.6
E-0
4
Odora
nts
3-m
ethy
l-1-b
uta
nol
dim
ethyl
dis
ulf
ide
1-h
exan
ol
1-o
cten
-3-o
ne
2-m
etho
xyphen
ol
2-p
hen
yle
than
ol
eugen
ol
β-d
amas
cenone
Tab
le 7
. O
dor
thre
shold
sa of
arom
a co
mpounds
in d
iffe
rent
model
win
e so
luti
ons.

99
by 2-fold for 2-methoxyphenol, 10-fold for dimethyl disulfide and β-damascenone, 18-fold for 1-
hexanol and 3-methyl-1-butanol. Other compounds had larger increases in the threshold value
such as in the case of 2-phenylethanol, 1-octen-3-one and eugenol, which increased by 110-fold,
321-fold and 10,000-fold, respectively.
The effect of the wine matrix on the potential contribution of individual odorants in
aroma perception was also evaluated. Previous studies showed changes in the odor qualities of
mixtures resulting from modifications in matrix composition.30-31
Table 8 provides the log odor
unit values U₀ of each compound present in the specified wine matrix. A more positive value
(log U₀ > 0) indicates a higher degree of likelihood of contributing to the aroma profile while a
negative value (log U₀ < 0) would imply an unlikely contribution. Results showed that model
wines containing 10% ethanol, low tannin and low fructose had the highest OUV’s for all
odorants. These model wines can be characterized with strong “spicy/clove” and
“earthy/mushroom” contributed by eugenol and 1-octen-3-one (log U₀ >5.0), respectively.
However, the addition of high tannin and high fructose at either 10% or 14% ethanol resulted in
a lowering of the calculated odor unit values, indicating a reduction in the contribution of
odorants to the overall aroma of a model wine. Based on the OUV’s, the model wines containing
higher concentrations of wine components had a different aroma profile contributed mainly by 1-
octen-3-one (earthy), 3-methyl-1-butanol (caramel/cooked) and β-damascenone (fruity) (log U₀
>2.0).
In conclusion, the study highlighted the significant interaction effects of ethanol, tannin
and fructose concentrations on the headspace recovery of odorants and in turn, on their sensory
significance. The interactions are complex and thus, future work should focus on investigations
at the molecular level to improve understanding of the chemical nature of interactions. In
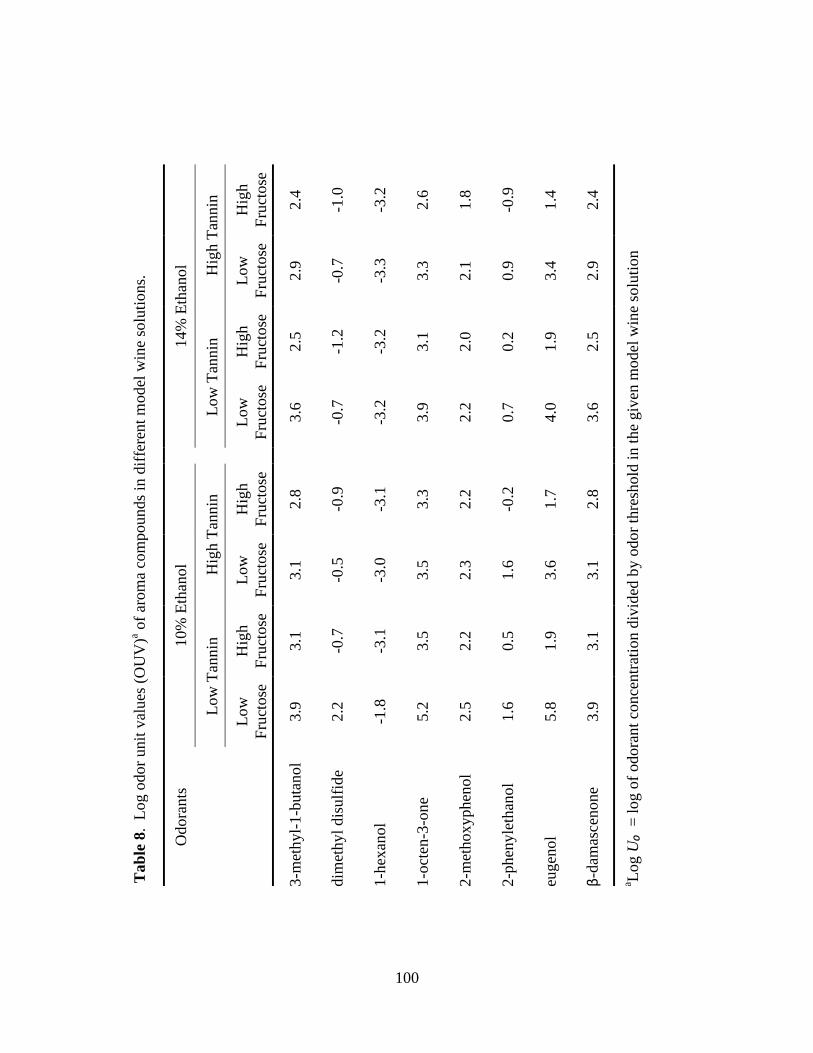
100
14%
Eth
anol Hig
h T
annin
Hig
h
Fru
ctose
2.4
-1.0
-3.2
2.6
1.8
-0.9
1.4
2.4
a Log U
₀ =
log o
f odora
nt
conce
ntr
atio
n d
ivid
ed b
y o
dor
thre
shold
in t
he
giv
en m
odel
win
e so
luti
on
Low
Fru
ctose
2.9
-0.7
-3.3
3.3
2.1
0.9
3.4
2.9
Low
Tan
nin
Hig
h
Fru
ctose
2.5
-1.2
-3.2
3.1
2.0
0.2
1.9
2.5
Low
Fru
ctose
3.6
-0.7
-3.2
3.9
2.2
0.7
4.0
3.6
10%
Eth
anol Hig
h T
annin
Hig
h
Fru
ctose
2.8
-0.9
-3.1
3.3
2.2
-0.2
1.7
2.8
Low
Fru
ctose
3.1
-0.5
-3.0
3.5
2.3
1.6
3.6
3.1
Low
Tan
nin
Hig
h
Fru
ctose
3.1
-0.7
-3.1
3.5
2.2
0.5
1.9
3.1
Low
Fru
ctose
3.9
2.2
-1.8
5.2
2.5
1.6
5.8
3.9
Odora
nts
3-m
ethyl-
1-b
uta
nol
dim
ethyl
dis
ulf
ide
1-h
exan
ol
1-o
cten
-3-o
ne
2-m
ethoxyphen
ol
2-p
hen
yle
than
ol
eugen
ol
β-d
amas
cenone
Tab
le 8
. L
og o
dor
unit
val
ues
(O
UV
)a of
arom
a co
mpounds
in d
iffe
rent
model
win
e so
luti
ons.

101
general, tannin had an enhancement effect while fructose induced a retention effect, both of
which were largely dependent on ethanol concentration. High ethanol, tannin and fructose
concentrations caused greater losses of odorants particularly the larger compounds, which may
lead to an imbalance in perceived aroma quality during consumption. A marked increase in the
aroma threshold values and decrease in the potential aroma contribution of odorants supported
the negative impact of these wine parameters. Considering these consequences on wine aroma
quality arising from wine matrix interactions may assist viticulturists and winemakers to make
necessary adjustments in their practices as needed.
Acknowledgments
We are grateful for the financial support from the Washington State Grape and Wine
Research Commission and the Northwest Center for Small Fruits Research. Dr. Charles Edwards
is thanked for the helpful and motivating discussions.
Literature Cited
(1) Jover, A. J. V.; Llorens Montes, F. J.; Fuentes Fuentes, M. d. M. Measuring perceptions
of quality in food products: the case of red wine. Food Qual. Pref. 2004, 15, 453-469.
(2) Charters, S.; Pettigrew, S. The dimensions of wine quality. Food Qual. Prefer. 2007, 18,
997-1007.
(3) Maarse, H.; Vischer, C. A. Volatile compounds in food. Alcoholic beverages. Qualitative
and quantitative data; TNO-CIVO, Food Analysis Institute: Zeist The Netherlands, 1989.
(4) Cullere, L.; Escudero, A.; Cacho, J.; Ferreira, V. Gas chromatography-olfactometry and
chemical quantitative study of the aroma of six premium quality Spanish aged red wines. J.
Agric. Food Chem. 2004, 52, 1653-1660.
(5) Li, H.; Tao, Y. S.; Wang, H. Impact odorants of Chardonnay dry white wine. Eur. Food
Res. Technol. 2008, 227, 287-292.
(6) Guth, H. Quantitation and sensory studies of character impact odorants of different white
varieties. J. Agric. Food Chem. 1997, 45, 3027-3032.

102
(7) Zhang, M.; Xu, Q.; Duan, C.; Qu, W.; Wu, Y. Comparative study of aromatic compounds
in young red wines from Cabernet Sauvignon, Cabernet Franc, and Cabernet Gernischet varieties
in China. J. Food Sci. 2007, 72, 248-252.
(8) Voilley, A.; Beghin, V.; Charpentier, V.; Charpentier, C.; Peyrond, D. Interactions
between aroma substances and macromolecules in a model wine. Food Sci. Technol. 1991, 24,
469-472.
(9) Conner, J. M.; Birkmyre, L.; Paterson, A.; Piggott, J. R. Headspace concentrations of
ethyl esters at different alcoholic strengths. J. Sci. Food Agric. 1998, 77, 121-126.
(10) Hartmann, P. J.; Mc Nair, H. M.; Zoecklein, W. Measurements of 3-alkyl-2-
methoxypyrazine by headspace solid phase microextraction in spiked model wines. Am. J. Enol.
Vitic. 2002, 53, 285-288.
(11) Camara, J. S.; Arminda Alves, M.; Marques, J. C. Development of headspace solid-
phase microextraction-gas chromatography-mass spectrometry methodology for analysis of
terpenoids in Madeira wines. Anal. Chim. Acta 2006, 555, 191-200.
(12) Whiton, R. S.; Zoecklein, B. W. Optimization of headspace solid-phase microextraction
for analysis of wine aroma compounds. Am. J. Enol. Vitic. 2000, 51 (4), 379-382.
(13) Aznar, M.; Tsachaki, M.; Linforth, R. S. T.; Ferreira, V.; Taylor, A. J. Headspace
analysis of volatile organic compounds from ethanolic systems by direct APCI-MS. Int. J. Mass
Spectrom. 2004, 239, 17-25.
(14) Grosch, W. Evaluation of the key odorants of foods by dilution experiments, aroma
models and omission. Chem. Senses 2001, 26, 533-545.
(15) Dufour, C.; Bayonove, C. L. Interactions between wine polyphenols and aroma
substances. An insight at the molecular level. J. Agric. Food Chem. 1999, 47, 678-684.
(16) Jung, D. M.; de Ropp, J. S.; Ebeler, S. E. Study of interactions between food phenolics
and aromatic flavors using one- and two-dimensional H NMR spectroscopy. J. Agric. Food
Chem. 2000, 48, 407-412.
(17) Aronson, J.; Ebeler, S. E. Effect of polyphenol compounds on the headspace volatility of
flavors. Am. J. Enol. Vitic. 2004, 55, 13-21.
(18) Jung, D. M.; Ebeler, S. E. Headspace solid-phase microextraction method for the study
of the volatility of selected flavor compounds. J. Agric. Food Chem. 2003, 51, 200-205.
(19) Lund, C. M.; Nicolau, L.; Gardner, R. C.; Kilmartin, P. A. Effect of polyphenols on the
perception of key aroma compounds from Sauvignon Blanc wine. Aust. J. Grape Wine Res.
2009, 15, 18-26.

103
(20) Goldner, M. C.; di Leo Lira, P.; van Baren, C.; Bandoni, A. Influence of polyphenol
levels on the perception of aroma in Vitis vinifera cv. Malbec wines. S. Afr. J. Enol. Vitic. 2011,
32 (1), 21-27.
(21) Robinson, A. L.; Ebeler, S. E.; Heymann, H.; Boss, P. K.; Solomon, P. S.; Trengover, D.
Interactions between wine volatile compounds and grape and wine matrix components influence
aroma compound headspace partitioning. J. Agric. Food Chem. 2009, 57, 10313-10322.
(22) Jones, P. R.; Gawel, R.; Francis, I. L.; Waters, E. J. The influence of interactins between
major white wine components on the aroma, flavour and texture of model white wine. Food
Qual. Prefer. 2008, 19, 596-607.
(23) Meilgaard, M.; Civille, G. V.; Carr, B. T. Sensory Evaluation Techniques, 4th ed.; CRC
Press: Fl, 2007.
(24) Buttery, R. G.; Teranishi, R.; Ling, L. C. Fresh tomato volatiles: a quantitative study. J.
Agric. Food Chem 1987, 35, 540-544.
(25) Landon, J. L.; Weller, K.; Harbertson, J. F.; Ross, C. F. Chemical and sensory
evaluation of astringency in Washington State red wines. Am. J. Enol. Vitic. 2008, 59, 153-158.
(26) Zoecklein, B. W.; Fugelsang, K. C.; Gump, B. H.; Nury, F. S. Wine analysis and
production; Chapman & Hall: New York, 1995.
(27) Fischer, C.; Fischer, U.; Jakob, L. Impact of matrix variables ethanol, sugar, glycerol,
pH and temperature on the partition coefficient of aroma compounds in wine and thier kinetics of
volatilization. Proceedings for the 4th international symposium on cool climate viticulture and
enology. T. Henick-Kling, E. Wolf and E. M. Harkness (eds.); New York State Agricultural
Experiment Station: Geneva, USA, 1996; pp 42-46.
(28) Poncet-Legrand, C.; Cartalade, D.; Putaux, J. L.; Cheynier, V.; Vernhet, A. Flavan-3-ol
aggregation in model ethanolic solutions: incidence of polyphenol structure, concentration,
ethanol content, and ionic strength. Langmuir 2003, 19, 10563-10572.
(29) Zanchi, D.; Vernhet, A.; Poncet-Legrand, C.; Cartalade, D.; Tribet, C.; Schweins, R.;
Cabane, B. Colloidal dispersions of tannins in water-ethanol solutions. Langmuir 2007, 23,
9949-9959.
(30) Guth, H. Comparison of different white wine varieties in odor profiles by instrumental
analysis and sensory studies. In Chemistry of Wine Flavor; Waterhouse, A. L., Ebeler, S. E.,
Eds.; ACS Symposium Series; American Chemical Society: Washington, D. C., 1998; pp 39-53.
(31) Goldner, M. C.; Zamora, M. C.; Lira, P. d. L.; Gianninoto, H.; Bandoni, A. Effect of
ethanol level in the perception of aroma attributes and the detection of volatile compounds in red
wine. J. Sens. Stud. 2009, 24, 243-257.

104
(32) US EPA. Estimation Programs Interface Suite™ for Microsoft® Windows, v 4.10
version. United States Environmental Protection Agency, Washington, DC, USA. URL
(http://www.epa.gov/oppt/exposure/pubs/episuite.htm)(accessed October 2011)
(33) Acree, T., and Arn, H. Flavornet and human odor space. URL
(http://www.flavornet.org/flavornet.html)(accessed December 2011).
(34) Noble, A. C.; Arnold, R. A.; Buechsenstein, J.; Leach, E. J.; Schmidt, J. O.; Stern, P. M.
Modification of a standardized system of wine aroma terminology. Am. J. Enol. Vitic. 1987, 36,
143-146.
(35) Goniak, O. J.; Noble, A. C. Sensory study of selected volatile sulfur compounds in white
wine. Am. J. Enol. Vitic. 1987, 38, 223-227.
(36) Cullere, L.; Cacho, J.; Ferreira, V. Validation of an analytical method for the solid phase
extraction, in cartridge derivatization and subsequent gas chromatographic-ion trap tandem mass
spectrometric determination of 1-octen-3-one in wines at ng/L-1 level. Anal. Chimic. Acta 2006,
563, 51-57.

105
CHAPTER V
SENSORY IMPACT OF INTERACTIONS AMONG ETHANOL, TANNIN AND
FRUCTOSE IN A MODEL RED WINE
Abstract
The impact of ethanol (0, 8, 10, 12, 14 and 16% v/v), tannin (500, 1000 and 1500 mg/L)
and fructose (200 and 2000 mg/L) concentrations on the sensory properties of model red wines
was investigated. Using a trained panel (n = 12), the intensity of aroma, flavor, taste and
mouthfeel characteristics of the different wines (n = 36) were determined. Significant (p ≤ 0.05)
positive correlations were found between an aroma and its flavor counterpart descriptor, fruity (r
= 0.76), woody (r = 0.69), caramel (r = 0.75), sulfur (r = 0.64), herbaceous (r = 0.83), earthy (r =
0.81), floral (r = 0.79), and spicy (r = 0.76). When principal component analysis (PCA) of the
ratings was applied, model wines were differentiated based on PC 1 (floral, fruity and caramel),
PC 2 (earthy and herbaceous) and PC 3 (sulfur, spicy, woody, and bitterness). The analysis of
variance (ANOVA) results showed a significant impact of ethanol concentration on these
principal components (p ≤ 0.05) while tannin and fructose concentration effects, and all
interaction effects were not significant. Model wines with lower ethanol concentration (0, 8 and
10%) had higher floral, fruity, caramel aroma and flavor scores than those with 16%. Higher
scores for earthy and herbaceous aroma and flavor were observed with 0, 8, 10, 12% ethanol
concentration compared to those containing 14 and 16%. In contrast, sulfur, spicy, woody aroma
and flavor, and perceived bitterness were lowest with 0 and 8% ethanol, with higher sensations
detected as the ethanol concentration increased from 8 to 16%. These results showed the
importance of ethanol in modulating the sensory perception and resulting quality.

106
Introduction
Wine is a complex alcoholic beverage containing both volatile and non-volatile
components, which may interact with each other and influence the perception of its intrinsic
quality. The combination of factors such as grape variety, climate, sites, viticutural and
enological practices has been shown to alter the concentration and distribution of these
components in the wine matrix and ultimately, the overall quality of wine produced (Jackson and
Lombard 1993).
The assessment of wine components that influence the sensory properties of wines has
been the focus of recent wine research studies. Ethanol, the most abundant volatile wine
constituent was shown to modify the taste (sweetness, bitterness), mouthfeel (hotness, fullness,
viscosity) (Fischer and Noble 1994, Nurgel and Pickering 2006, Nurgel and Pickering 2005),
aroma and flavor sensations (Guth et al. 2007). On the other hand, the colour quality, perceived
bitterness and astringency in red wines have been attributed to the non-volatile component,
phenolic compounds. In addition, the influence of polyphenols on odorants contribution to
aroma perception was also demonstrated (Lund et al. 2009, Goldner et al. 2011). Other wine
macromolecules, the polysaccharides, particularly the mannoproteins, were thought to contribute
to the fullness and decreased astringency of red wines (Vidal et al. 2004) as well as in the
suppression of perceived intensity of aroma compounds (Chalier et al. 2007).
Few research studies directed towards studying the interaction effects among wine
components have shown the extent to which individual compounds can influence the sensory
aspects of wine in the presence or absence of another compound. Jones et al. (2008) reported
that the overall aroma, ester and floral aroma intensity were dependent on the concentration of
volatiles, glycerol and ethanol. At lower volatile concentration, ethanol had a suppressing effect

107
but only when glycerol was absent. Conversely, at higher volatile concentration, overall aroma
intensity was impacted by neither glycerol nor ethanol. In another study, perceived bitterness
increased with increased ethanol, catechin and to some extent pH, with the largest effect induced
by ethanol. However, the masking effects of ethanol on sourness were evident only at pH 3.2
while catechin produced no significant effect (Fischer and Noble 1994). Vidal et al. (2004)
showed that the perception of astringency increased with tannin concentration but decreased in
the presence of rhamnogallacturonan II.
The current study aimed to investigate the effects of ethanol, tannin and fructose and their
interactions that may affect the aroma, taste, flavor and mouthfeel properties of wine. The
concentrations of the ethanol, tannin and fructose were selected to cover the range found in red
wines. A descriptive sensory analysis of model wines with varied concentrations of these
components was carried out using a full factorial design. To assist in the interpretation of sensory
data, a correlation-based principal component analysis (PCA) was initially applied followed by
the analysis of variance (ANOVA) to discriminate among the model wines.
Materials and Methods
Model wine samples
Thirty-six (36) synthetic-based model wines were prepared with 0, 8, 10, 12, 14, and 16%
v/v ethanol (Decon Labs, Inc., PA), 500, 1000 and 1500 mg/L tannin (Biotan, Laffort Company,
CA), and 200 and 2000 mg/L fructose (Sigma-Aldrich, CA). Tartaric acid (500 mg/L, Sigma-
Aldrich, CA) was added to all wines prior to adjustment to pH 3.4 with 1 M NaOH (AAA
Chemicals, Inc., TX). Eight selected odorants (Sigma-Aldrich, CA), were spiked at fixed
concentrations: 250 mg/L 3-methyl-1-butanol (caramel), 0.002 mg/L dimethyl disulfide (sulfur),
1 mg/L 1-hexanol (herbaceous), 0.0001 mg/L 1-octen-3-one (earthy), 0.02 mg/L methoxyphenol

108
(woody), 30 mg/L 2-phenylethanol (floral), 0.5 mg/L eugenol (spicy), and 0.03 mg/L β-
damascenone (fruity) (Table 9). For each odorant, stock solution was initially prepared every
week in 50% ethanol/Milli Q (v/v) water and stored at 5°C in 5 mL amber vial sealed with
PTFE/Silicone septum until ready to use. Previous gas chromatography-mass spectrometry
analysis results showed no change in odorant concentration within two weeks of storage. Each
replicated preparation of all the 36 model wines was prepared and stored in a 1 L screw cap glass
bottle (Pyrex®, Corning, Inc.) in a dark room at 23°C for at least 12 hours prior to sensory
analysis.
Sensory evaluation
Twelve students and staff from the Washington State University (4 females and 8 males,
aged 21 to 55) participated in the sensory evaluation. Panelists were recruited based on interest,
availability, frequency of wine consumption (at least a week) and sensitivity to aroma and flavor
of wines.
Prior to formal evaluations, trainings (10, one-hr sessions) were conducted to ensure that
panelists evaluate the wines in a similar, reproducible manner. During the training sessions,
panelists were exposed to solutions with similar characteristics as the experimental model wine
samples. Panelists developed skills to recognize 8 aroma and flavor, and 2 taste and mouthfeel
attributes. They were also trained how to evaluate intensities of each attribute by utilizing a 15-
cm unstructured line scale on paper ballots, and on the computer during practice sessions in
individual booths under red lighting. The sensory descriptive terms, references standards and the
corresponding intensity ratings used were shown in Table 10. The intensity ratings for each
prepared standard were agreed upon by consensus. Taste and mouthfeel descriptors were defined

109
Table 9. Physico-chemical and sensory properties of odorants used in the study.
Compound CAS Registry
No.
MW BP (°C) Log P
valuea
Aroma
Descriptorsb
Aroma
Categoryc
3-methyl-1-butanol 123-51-3 88.15 131.1 1.16 whiskey, malt,
burnt
caramel
dimethyl disulfide 624-92-0 94.19 109.8 1.77 onion,
cabbage
chemical
1-hexanol 111-27-3 102.2 157.6 2.03 green,
flower
herbaceous
1-octen-3-one 4312-99-6 126.2 162.0 2.37 mushroom,
metal
earthy
2-methoxyphenol 90-05-1 124.1 205.0 1.32 smoke, sweet,
medicine
woody
2-phenyl ethanol
60-12-8 122.2 218.2 1.36 honey, spice,
rose, lilac
floral
eugenol 97-53-0 164.2 253.2 2.27 clove,
honey
spicy
β-damascenone 23726-93-4 190.3 265.1 4.21 apple, rose,
honey
fruity
aHydrophobic constant obtained from Estimation Program Interface (EPI) Suite Software
TM
(U.S. Environmental Protection Agency) bFlavornet (www.flavornet.org)
cNoble et al. (1987)

110
Table 10. Aroma, flavor, taste and mouthfeel reference standards and their corresponding
intensity ratings used during panel training.
Attributes Reference standard Ratinga
Aroma and flavor
caramel 90 mg/L 3-methyl-1-butanol 10.0
sulfur 0.1 mg/L dimethyl disulfide
10.0
herbaceous 24 mg/L 1-hexanol
10.0
earthy 0.01 mg/L 1-octen-3-one
13.0
fruity 0.1 mg/L β-damascenone
12.5
floral 40 mg/L 2-phenylethanol
10.0
woody 0.1 mg/L 2-methoxyphenol
12.5
spicy 0.1 mg/L eugenol
10.0
Taste
sourness 2 g tartaric acid/L milliQ water 15.0
bitterness 0.1 g quinine sulfate/L milliQ water 15.0
Mouthfeel
drying 2 g tannic acid + 0.875 g alum/0.75L milliQ water 15.0
heat 20% ethanol/milliQ water (v/v) 15.0
aMean observations for each attribute of aroma, flavor, taste and mouthfeel on a 15-cm
intensity line scale (n=12)
111
to avoid confusion. Perceived sourness and bitterness were described as the sensation
predominantly perceived along the sides of the tongue and at the back of the tongue,
respectively. The term drying was defined as the feeling of lack of lubrication in the mouth
whereas heat was referred to as either warm (parching) or hot (numbing) sensation. Panel
performance was monitored by calculating the standard deviations of each individual panelist
and the panel as whole. Feedback regarding the results of practice evaluation in the booths (two,
30-minute sessions) in the form of computerized graphs was provided to each panelist on the
next training session.
The trained panelists evaluated the 36 wines in duplicate during the formal evaluation
sessions. Each sample was assigned a 3-digit number and served in an ISO/INAO (International
Standards Organization) tulip-shaped wine tasting glasses, covered with petri dish at ambient
temperature (approximately 23ºC). Samples were individually presented to all panelists under
red lights in a balanced, random order. Panelists evaluated 6 model wines per session, with a
forced 1-min break after each wine and a 10-min break after every three wines to reduce sensory
fatigue. They were given unsalted crackers and milliQ water for cleansing and rinsing their
palates between each sample. Each panelist attended 12 sessions to complete the evaluation
of 72 samples. The panelists rated intensities of the 20 attributes on computer using Compusense
software, version 5.0 (Guelph, Canada).
Statistical analysis
Pearson’s correlation analysis was carried out on individual intensity ratings to determine
the relationships among sensory descriptors. Subsequently, factor analysis (principal components
method) was applied to explore the underlying factors responsible for the covariation among the
observed variables in model wines using three factors with varimax rotation. A fixed-effect

112
analysis of variance (ANOVA) was performed to determine the impact of panelist, ethanol,
tannin and fructose concentrations and their interactions on the three principal components.
Multiple comparisons of treatment means for significant factors were done using Fischer’s LSD.
All data analyses were carried out using SAS (Statistical Analysis Systems, Cary, NC) with
significance defined at p ≤ 0.05.
Results and Discussion
Correlation and principal component analysis (PCA)
The Pearson’s correlation analysis among sensory descriptors revealed strong, high
associations between aroma attributes and the appropriate flavor counterpart descriptor (p ≤
0.05) (Table 11). These results were in agreement with Pierce and Halpern (1996), who reported
that the orthonasal and retronasal responses to an odorant could be similar since the orthonasal
and retronasal olfaction share a common olfactory pathway.
A correlation-based PCA was applied to the intensity ratings of a trained panel on 20
sensory attributes measured on 36 model wines. The analysis generated 6 principal components
(PC) with Eigen value > 1, however only three (3) PCs were retained, which accounted for 49%
of the total variance. Further extraction of more than three components did not provide
substantial benefits to the explained variability. The retained components were subjected to
VARIMAX rotation to bring them into closer alignment with the original variables (Lawless and
Heymann 1999). Figure 15 shows projections of correlations between the PC and the original
attribute measurements. Sensory attributes with loadings > 0.5 on a particular PC was considered
to have a strong influence on that PC and thus, were used for data interpretation. PC 1 was
positively loaded with floral, fruity and caramel aroma and flavor and contributed 28.0% of
variation. PC 2 with positive loadings for earthy and vegetal aroma and flavor contributed 12.0%
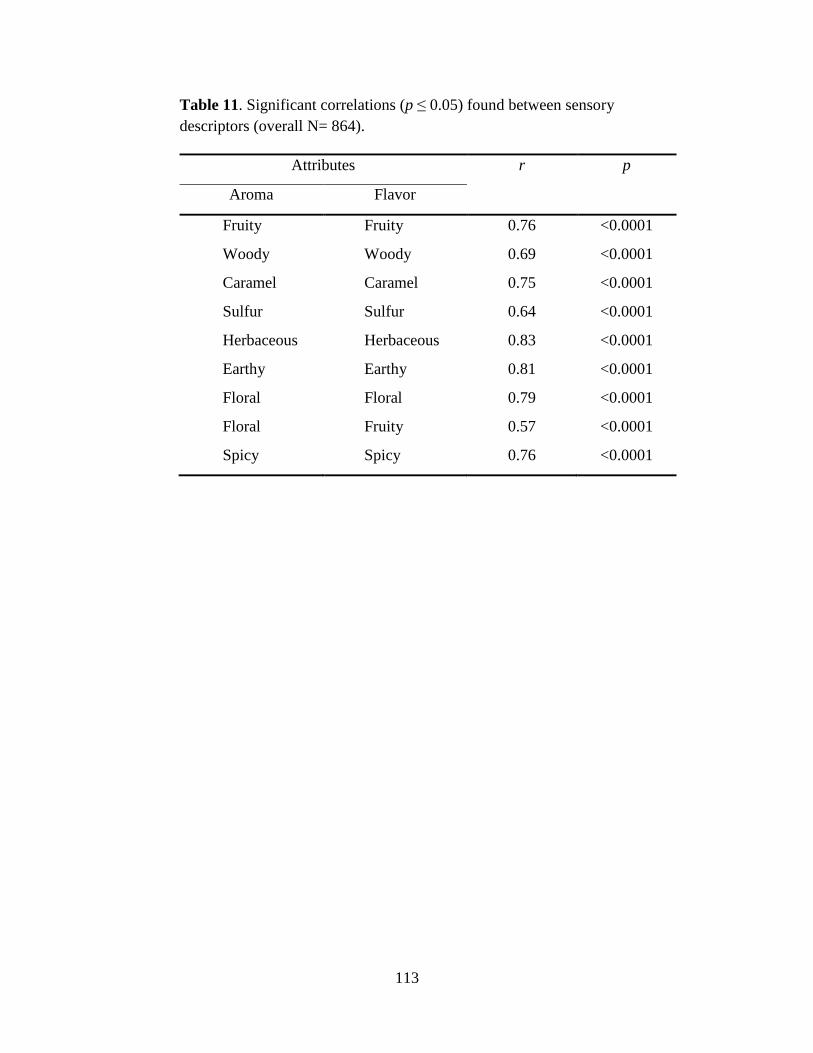
113
Table 11. Significant correlations (p ≤ 0.05) found between sensory
descriptors (overall N= 864).
Attributes r p
Aroma Flavor
Fruity Fruity 0.76 <0.0001
Woody Woody 0.69 <0.0001
Caramel Caramel 0.75 <0.0001
Sulfur Sulfur 0.64 <0.0001
Herbaceous Herbaceous 0.83 <0.0001
Earthy Earthy 0.81 <0.0001
Floral Floral 0.79 <0.0001
Floral Fruity 0.57 <0.0001
Spicy Spicy 0.76 <0.0001

114
Figure 15. Principal component analysis plot of model red wine sensory attributes
projected on PC 1 and 2 (above), and PC 1 and 3 (below) with VARIMAX rotation.
Fruity aroma Woody aroma
Caramel aroma
Sulfur flavor
Herbaceous aroma Earthy flavor
Floral aroma
Spicy aroma Fruity flavor
Woody flavor
Caramel flavor
Sulfur aroma
Herbaceous flavor Earthy aroma
Floral flavor Spicy flavor
Sourness
Bitterness
Heat
Drying
-0.4
-0.2
0
0.2
0.4
0.6
0.8
1
-0.4 -0.2 0 0.2 0.4 0.6 0.8 1
PC
2 (
12
.0%
)
PC1 (28.0%)
Fruity aroma
Woody aroma
Caramel aroma
Sulfur flavor
Herbaceous aroma
Earthy flavor
Floral aroma
Spicy aroma
Fruity flavor
Woody flavor
Caramel flavor
Sulfur aroma
Herbaceous flavor Earthy aroma Floral flavor
Spicy flavor
Sourness
Bitterness
Heat
Drying
-0.4
-0.2
0
0.2
0.4
0.6
0.8
1
-0.4 -0.2 0 0.2 0.4 0.6 0.8 1
PC
3 (
9.3
%)
PC 1 (28.0%)

115
of variation. PC 3 was positively related to sulfur, woody, spicy aroma and flavor and perceived
bitterness contributing 9.3% of variation among model wines.
Impact of ethanol, tannin and fructose
The analysis of variance (ANOVA) results was carried out on the factor scores for the
retained principal components to determine the significance of the effects of ethanol, tannin and
fructose and their interactions on the PCs (Table 12). A significant panelist effect was noted for
the PCs indicating that panelists may have used different parts of the intensity scale for rating the
attributes, which is commonly found even for supposedly highly trained panel (Lawless and
Heymann 1999). The effect of ethanol was significant for PC 1 (p = 0.001), PC 2 (p = 0.001) and
PC 3 (p < 0.000). However, neither tannin nor fructose main effects were found significant (p >
0.05). The observed effects of these wine components may not be sufficiently large to be
perceived by the panel.
A graphical representation of the effect of ethanol concentration on the scores loaded for
the three PCs is presented in Figure 16. Generally, PC 1 and PC 2 were negatively impacted by
the increase in ethanol concentration. Model wines with 0, 8 and 10% ethanol had significantly
higher floral, fruity, caramel aroma and flavor (PC 1) than those with 12, 14 and 16% ethanol
concentration. Considering the earthy and vegetal aroma and flavor (PC 2), significantly higher
scores were obtained from wines with 0, 8, 10, 12% ethanol concentration than with 14 and 16%.
The suppression effect of ethanol on the perception of fruitiness observed in the present study
supported previous studies (Guth 1998, Escudero et al. 2007, Grosch 2001). Higher ethanol
content (14.5 to 17.2%) was also demonstrated to decrease the fruity aromas; however, this was
accompanied by increasing herbaceous notes in red wines (Goldner et al. 2009).

116
Table 12. F-ratios, probability values and mean square error (estimated variance) from the
analysis of variance (ANOVA) results for the factor scores data of the three principal
components (PC) (overall N= 864).
Sources of
variation
df PC 1 PC 2 PC 3
F ratio p F ratio p F ratio p
Panelist 11 129.93 <0.0001 141.16 <0.0001 26.65 <0.0001
Ethanol (Et) 5 4.34 0.001 4.43 0.001 55.02 <0.0001
Tannin (T) 2 2.71 0.067 1.06 0.346 0.45 0.635
Fructose (F) 1 1.53 0.216 1.23 0.267 1.04 0.405
Et x T 10 0.92 0.517 0.74 0.688 0.53 0.468
T x F 2 1.73 0.178 0.67 0.513 0.29 0.918
Et x F 5 1.26 0.280 1.29 0.268 0.50 0.604
Et x T x F 10 1.21 0.277 0.80 0.631 0.98 0.456
MSE 0.37 0.36 0.612
p values ≤ 0.05 are significant
PC 1 represents floral, fruity, caramel aroma and flavor
PC 2 represents earthy, herbaceous aroma and flavor
PC 3 represents sulfur, spicy, woody aroma and flavor, bitterness

117
a a a
a ab
b
a ab ab
bc bc
c
a a
b
c
c
d
-1.0
-0.8
-0.6
-0.4
-0.2
0.0
0.2
0.4
0.6
0.8
1.0
0 8 10 12 14 16
Fac
tor
sco
res
Ethanol (% v/v)
PC 1 PC 2 PC 3
Figure 16. Impact of ethanol concentration on the sensory attributes of
model red wines grouped as PC 1 (floral, fruity, caramel aroma and flavor),
PC 2 (earthy, herbaceous aroma and flavor) and PC 3 (sulfur, spicy, woody
aroma and flavor, bitterness).

118
On the other hand, ethanol concentration was observed to positively impact sulfur, spicy,
woody aroma and flavor as well as perceived bitterness (PC 3). Lowest scores were obtained
from model wines with 0 and 8% ethanol, which tended to increase with increasing ethanol
concentration. At 16% ethanol, highest scores for these descriptors were found.
Above results demonstrated the changes in the perceived intensity of aroma and flavor of
model wines due to increased ethanol concentration. At lower ethanol concentrations (8 and 10
%), the model wines were described as more fruity, floral, caramel, vegetal and earthy. However,
at higher concentrations (14 and 16%), these were characterized with more sulfur, spicy and
woody characteristics. These observations may be explained in part by the perceptual
interactions between odorant compounds responsible for the aroma and flavor (Laing and Wilcox
1983), which were mediated by the ethanol effect. In addition, results showed that the perceived
bitterness was enhanced with increased ethanol concentration. Several authors have indicated the
same effect of ethanol on bitterness in wines (Fischer et al. 1994) and wine-like solutions
(Fontoin et al. 2008, Vidal et al. 2004).
Conclusions
Changes in the sensory perception of model wines particularly the aroma and flavor, and
bitterness were largely impacted by ethanol concentration, indicating the importance of
controlling ethanol during the winemaking process to improve quality. The suppression and
enhancement effect of increasing ethanol concentration on the perceived intensity of sensations
varied depending on the attribute. Tannin and fructose concentrations had no significant sensory
impact. Findings suggest further sensory investigations on real wines to validate these results.

119
Acknowledgments
We thank the Washington State Grape and Wine Research Commission and the
Northwest Center for Small Fruits Research for funding this research.
Literature Cited
Chalier, P., B. Angot, D. Delteil, T. Doco, and Z. Gunata. 2007. Interactions between aroma
compounds and whole mannoprotein isolated from Saccharomyces cerevisiae strains. Food
Chem. 100:22-30.
Escudero, A., E. Campo, L. Farina, J. Cacho , and V. Ferreira. 2007. Analytical characterization
of the aroma of five premium red wines. Insights into the role of odor families and the concept of
fruitiness of wines. J. Agric. Food Chem. 55:4501-4510.
Fischer, U., R.B. Boulton, and A.C. Noble. 1994.Physiological factors contributing to the
variability of sensory assessments: relationship between salivary flow rate and temporal
perception of gustatory stimuli. Food Qual. Pref. 5:55-64.
Fischer, U., and A.C. Noble. 1994. The effect of ethanol, catechin concentration, and pH on
sourness and bitterness of wine. Am. J. Enol. Vitic. 45:6-10.
Fontoin, H., C. Saucier, P.L. Teissedre, and Y. Glories. 2008. Effect of pH, ethanol and acidity
on astringency and bitterness of grape seed tannin oligomers in model wine solution. Food Qual.
Pref. 19:286-291.
Goldner, M.C., P. di Leo Lira, C. van Baren, and A. Bandoni. 2011. Influence of polyphenol
levels on the perception of aroma in Vitis vinifera cv. Malbec wines. S. Afr. J. Enol. Vitic. 32:21-
27.
Goldner, M.C., M.C. Zamora, P. di Leo Lira, H. Gianninoto, and A. Bandoni. 2009. Effect of
ethanol level in the perception of aroma attributes and the detection of volatile compounds in red
wine. J. Sens. Stud. 24:243-257.
Grosch, W. 2001. Evaluation of the key odorants of foods by dilution experiments, aroma
models and omission. Chem. Senses 26:533-545.
Guth, H. 1998. Comparison of different white wine varieties in odor profiles by instrumental
analysis and sensory studies. In Chemistry of Wine Flavor. A.L. Waterhouse and S.E. Ebeler
(eds), pp. 39-52. Oxford University Press, Washington, D. C., USA.
Jackson, D.I., and P.B. Lombard. 1993. Environmental and management practices affecting
grape composition and wine quality - A review. Am. J. Enol. Vitic. 44:409-429.

120
Jones, P.R., R. Gawel, I.L. Francis, and E.J. Waters. 2008. The influence of interactins between
major white wine components on the aroma, flavour and texture of model white wine. Food
Qual. Prefer. 19:596-607.
Laing, D. G., and M. E. Wilcox. 1983. Perception of components in binary odor mixtures. Chem.
Senses 7:294-264.
Lawless, H.T., and H. Heymann. 1999. Sensory Evaluation of Food. 2nd ed. Aspen Publishers,
Inc., New York.
Le Berre, E., B. Atanosova, D. Langlois, P. Etievant, and T. Thomas-Danguin. 2007. Impact of
ethanol on the perception of wine odorant mixtures. Food Qual. Prefer. 18:901-908.
Lund, C.M., L. Nicolau, R.C. Gardner, and P.A. Kilmartin. 2009. Effect of polyphenols on the
perception of key aroma compounds from Sauvignon Blanc wine. Aust. J. Grape Wine
Res.15:18-26.
Noble, A.C., R.A. Arnold, J. Buechsenstein, E.J. Leach, J.O. Schmidt, and P.M. Stern. 1987.
Modification of a standardized system of wine aroma terminology. Am. J. Enol. Vitic. 36:143-
146.
Nurgel, C., and G.J. Pickering. 2006. Modeling of sweet, bitter and irritant sensations and their
interactions elicited by model white wines. J. Sens. Stud. 21:505-519.
Nurgel, C., and G.J. Pickering. 2005. Contribution of glycerol, ethanol and sugar to the
perception of viscosity and density elicited by model white wines. J. Text. Stud. 36:303-323.
Pierce, J., and B.P. Halpern. 1996. Orthonasal and retronasal odorant identification based upon
vapor phase input from common substances. Chem. Senses 21:529-543.
Vidal, S., P. Courcoux, L. Francis, M. Kwiatkowski, R. Gawel, P. Williams, E. Waters, and V.
Cheynier. 2004. Use of an experimental design approach for evaluation of key wine components
on mouth-feel perception. Food Qual. Pref. 15:209-217.

121
CHAPTER VI
CONCLUSIONS AND RECOMMENDATIONS
The impact of selected wine components on the sensory and chemical properties of wine
was studied. This information may be used to assist viticulturists and winemakers to assess their
current practices and make adjustments as needed to improve wine quality. The significance of
the study in the field of wine research and in the wine industry was described in Chapter I
whereas an overview of the different wine components known to affect the chemical and sensory
properties of wines and specific studies on wine matrix interactions reported in the literature
were presented in Chapter II. Results of the three separate studies as well as the detailed
discussions were provided in Chapters III, IV, and V.
In the first study, the strong correlation between tannin concentration and perceived
astringency supported previous studies indicating that tannin content in the wine remains a good
predictor of perceived astringency. The observed changes in SPP and LPP due to storage
treatments were not large enough to influence the perception of astringency. Future work may
focus on determining the optimum storage conditions needed to elicit changes in SPP and LPP
and clarify their influence on perceived astringency.
Moving beyond studying only polymeric pigments, the subsequent studies examined the
overall impact of wine matrix on wine chemical and sensory properties. Findings indicated the
presence of higher order interactions between odorants and wine components using static
headspace analysis. The combined effects of high ethanol, tannin and fructose were significant in
reducing the headspace concentration of odorants potentially available for perception. Among
the wine components studied, ethanol concentration had the largest impact on the odorants,
mediating the effects of tannin and fructose. The evaluation of the impact of ethanol, tannin and

122
fructose on the odor unit values was successfully achieved through the combination of GC-MS
and GC-O techniques, allowing a more reliable estimation of the potential strength of the odorant
relative to the wine matrix. For all odorants, the odor detection thresholds increased as the
ethanol, tannin and fructose concentrations increased, suggesting the lowering of the potential
contribution of each individual odorant in aroma perception. Study on the exact nature of
interactions to understand the mechanisms of interactions between wine constituents may be
further explored.
Finally, the sensory work in the third study described the significant impact of ethanol on
the sensory perception of model wines, particularly how ethanol disturbed the balance in the
aroma and flavor, and bitterness attributes. In contrast to the analytical study, tannin and fructose
concentrations and their interactions with ethanol had no significant sensory impact. It would be
interesting to extend this research and confirm these results in more complex wines, by
comparing the aromas of those, which have naturally low and high ethanol and tannin
concentrations.
In addition, investigations of the effect of interactions of volatile matrix components in
the wine other than ethanol should also provide more information on the perceptual changes
occurring during wine consumption. Previous studies have indicated that odorant-odorant
interactions can be additive or suppressive or with masking effects. Future studies may focus on
addition or omission tests to determine changes in aroma by adding or removing target group of
related wine aroma compounds (similar structure and odor) into/from the selected wine matrix,
thus looking beyond the contribution of individual compounds. This is based on the current
knowledge that wine aroma (e.g. fruity, floral note) is a cumulative effect of nuances elicited by
several compounds (esters, monoterpenes).

123
Considering the significant impact of ethanol particularly on the wine aroma and flavor
perception, future studies should include evaluating the effect of its interaction with other wine
components. The sensory impact of the polysaccharides, another major macromolecule in wine,
has been given less attention. These polysaccharides from either yeasts secretions during
alcoholic fermentation or yeast autolysis during lees ageing may have many consequences in the
wine, including interaction with wine aroma compounds. It would be interesting to determine the
extent of the combined effects of ethanol and polysaccharides in modifying aroma and flavor
perception.