THE IMPACT OF TRADE OPENNESS ON ECONOMIC GROWTH · investigate the exact impact of trade openness...
32
1 Erasmus School of Economics THE IMPACT OF TRADE OPENNESS ON ECONOMIC GROWTH Evidence in Developing Countries MASTER THESIS Master: Economics and Business Specialization: International Economics Author: Vasiliki Pigka-Balanika Thesis supervisor: Maarten Bosker
Transcript of THE IMPACT OF TRADE OPENNESS ON ECONOMIC GROWTH · investigate the exact impact of trade openness...

1
Erasmus School of Economics
THE IMPACT OF TRADE OPENNESS ON ECONOMIC
GROWTH
Evidence in Developing Countries
MASTER THESIS
Master: Economics and Business
Specialization: International Economics
Author: Vasiliki Pigka-Balanika
Thesis supervisor: Maarten Bosker

2
Abstract
Many economists generally agree that openness accelerates economic development. This
study explores the relationship between trade openness and economic growth using a sample
of 71 developing countries over the period 1990 – 2005. Incorporating an augmented Solow
growth model in a panel data analysis, both fixed and two-way fixed effects specifications
indicate that trade liberalization has a positive and significant effect on economic growth.
However, the Sub-Saharan Africa region does appear to be different; high natural barriers to
trade, export dependence on primary commodities and poor overland infrastructures to distant
large markets can explain why increased trade openness does not contribute to economic
growth.
Keywords: Trade openness, economic growth, neoclassical economic model, developing
countries, Sub-Saharan African region.
3
Contents
I. Introduction……………………………………………………………4
II. Trade openness: What does it really mean?........................................5
III. Literature Review………………………………………………………6
IV. Theoretical Part……………………………………………………......10
V. Data and Methodology………………………………………………...15
VI. Empirical Results………………………………………………………18
VII. Conclusion………………………………………………………………22
References………………………………………………………24
Appendix………………………………………………………..28

4
I. Introduction
How trade openness affects economic growth is a topic that has amassed a large amount of
research. Many economists support that protectionism may induce faster economic growth
while liberal analysts argue that a higher degree of openness leads to a better economic
performance. After all, does trade openness really contribute to economic growth? Few
questions have been more strongly debated in the history of economic thought. Restricting my
attention to 71 developing countries and collecting data from the World Databank, I
investigate the exact impact of trade openness on economic growth. Developing countries
render a remarkable example as in recent decades; many of them have embarked on programs
of external economic liberalization.
Using the framework of a neoclassical Solow model, whose central predictions concern the
impact of investments and population growth on real income, I expand it by adding trade
openness as the key variable which proxy for the level of technology, with an altering set of
controls as well. Incorporating it in a panel data analysis over the period 1990-2005, I
examine how differently trade openness affects economic growth by gradually increasing the
number of my explanatory variables. Fixed effects model found that trade openness
significantly and positively contribute to economic growth after controlling for important
causal factors like the initial GDP per capita. The same picture is delivered by a two way
fixed effects specification that leads me to more consistent and accurate results, as the country
specific heterogeneity is minimized, increasing the explanatory power of my model.
However, as I move forward in the course of my survey, I come across evidence showing
that the benefits of openness have shrunk for the poorest developing countries of my sample.
Isolating the 30 Sub Saharan African countries of my initial sample, I found that there is no
relationship between trade openness and economic growth, even though I control for omitted
variables bias. This outcome comes in contrast with the main hypothesis that trade openness
is a good growth promoting policy and I suppose that for some regions, so structurally
different from the rest of the world, such as the SSA region, global comparisons are
particularly meaningless. The factors and conditions that can explain why SSA counties are
not benefiting from an open trade regime is the next focus of my research.
Albeit, the rest of the paper is structured as follows: section II analytically refers to how
trade openness is defined, section III briefly reviews the theoretical and empirical literature of
the openness-growth nexus and section IV sets out my model specification and variables’
description. As for section V, it bears details of data and methodology and empirical results
are presented in section VI. Finally, section VII concludes.

5
II. Trade openness: What does it really mean?
It is widely accepted that open economies grow faster compared to closed ones. The
globalization movement, which accelerated especially in the 1980s, enforced this situation to
come into view more clearly. According to Fischer (2003), globalization is defined as the
“ongoing process of greater economic interdependence among countries reflected in the
increasing amount of cross-border trade in goods and services, the increasing volume of
international financial flows and increasing flows of labor”. During most of the 20th century,
import substitution strategies (ISI)1 played a dominant role in most developing countries’
development strategies. But, while developing countries in Latin America, following ISI
strategies, achieved lower growth rates, East Asian countries that enacted export promotion
policies, experienced a higher economic performance. This possibly explains the growing
interest of many researchers to investigate the relationship between trade liberalization and
economic performance since the late 1970s.
Before analyzing the existing theoretical and empirical literature on the relationship
between economic growth and trade openness and my own contribution on this specific field
of research, I will try to shed light on an important problem facing researchers today; the lack
of a clear definition of “trade liberalization” or “openness”. The two concepts while closely
related are not identical. Trade liberalization includes policy measures to increase trade
openness while increased trade openness is usually considered as an increase in the size of a
country’s traded sectors in relation to total output. Increased openness can, but need not, be
the result of trade liberalization. Recently, the meaning of “openness” has become identical to
the idea of “free trade” that is a system where all trade distortions are eradicated. Pritchett
(1996) simply defines “openness” as an economy’s trade intensity. However, according to
Kyrre Stenses (2006), it would be more precise to define openness in relation to barriers to
international trade imposed by governments.
New economic geography models (NEG)2 specifically define international trade openness
as low international trade cost which is an abstraction of transport cost, tariffs, subsidies taxes
and non-tariffs barriers. Yanikkaya (2003) mentions that this definition has changed over time
from one extreme to another. On the one hand, Krueger (1978) argues that trade liberalization
can be attained by implementing policies that lower the biases against the exports sector, for
instance subsidizing exports or encouraging exports schemes, while on the other hand,
Harrison (1996), supports that trade openness could be synonymous with the idea of
1 Strategies which replace foreign imports with domestic production.
2 Study about the location, the distribution and the spatial organization of economic activities across
the world.
6
neutrality, the indifference between earning a unit of foreign exchange by exporting and
saving a unit of foreign exchange through import substitution. It is crucial to understand this
definition problem as there are several openness measures that are differently linked to
economic growth. However, the purpose of my research is to provide a description of the
growth enhancing potential of trade openness and I will continue my analysis in this direction.
III. Literature review
International trade and economic growth have been explained through “old” and “new”
trade and growth theories that explicate why countries trade among each other. Neoclassical
trade theories include comparative advantage and Heckscher-Ohlin Samuelson theories in
order to explain the basis for trade. In the Ricardian model, as trade becomes more open, any
country specializes in producing goods in which it has a comparative productivity advantage,
which arises due to differences in technologies or natural resources and not in factor
endowments, increasing its welfare gains and benefits from trade. On the other hand, the
Heckscher-Ohlin Samuelson model analyzes the welfare gains in a two countries, two factors
model that each country exports the good which uses its abundant factor (capital or labor)
more intensively. As a result, both countries, with different comparative costs and different
terms of trade, are better off under international trade rather than in an autarky situation.
In models of economic growth, there is not a clear relationship between trade and the rate
of economic growth. In the early growth models, such as the Harrod-Domar model, where
capital is the sole factor of production, a trade liberalization episode has positive growth
effects (Srinivansan, 1999). This is possible under the assumption that the marginal product of
capital (MPK) is bounded under a positive number3. In neoclassical models for closed
economies, such as the Solow model (1957), growth is exogenously determined. The
remarkable feature of Solow model is that, under the assumption of diminishing returns to
scale, there is a steady state level of per capita GDP (gross domestic product) to which
developing countries can converge. This implies that two countries with similar saving,
depreciation and population rates can converge to similar standards of living in the long run
(Ray, 1998). Moreover, Harrison (1994) supports that international trade openness, according
to Solow model, creates inflows of capital goods and technology which broaden industrial
activity and trade in manufactured products and expand economic growth.
New trade theory is now entering to deal with some of the realities of trade in a more
complex manner by incorporating a fuller range of factors. New models that attempt to
3 If the MPK declines to zero, opening the economy to trade has only temporary effects on the growth
rate of output (Solow model).

7
endogenize growth have been approved. Theories relating trade openness to long run growth
are mainly based on models of endogenous technological change. According to these models,
developing countries can achieve a long term economic growth which is now endogenously
and not exogenously, as neoclassical growth theory predicts, determined. This is possible
under the assumption of increasing returns to scale.
Chen and Gupta (2006) support that economies can continually grow, due to the assumption
of increasing returns to scale and argue that international trade openness causes knowledge
spillovers, augments productivity and improves human capital. In the same line, Romer
(1990) suggests that openness provides domestic producers with a broader variety of capital
and intermediate goods, enlarging the base of productive knowledge and generating faster
productivity growth. Grossman and Helpman (1990), developing endogenous growth theory,
indicate that openness and foreign direct investments (FDI) inflows spur economic growth.
Technology diffusion provokes technological change which stimulates growth. However,
Baldwin et al (2001) introduce a contradictory view of endogenous growth implication on
economic growth. They prove that market opening causes global divergence, in which the
North industrializes and grows faster diverging from the South.
To sum up, according to the traditional neoclassical theories, growth originates from trade.
What endogenous theory does is to show how countries, through the channels of openness,
can work with the process of globalization to find complementary activities like education or
job training which help them to survive and develop. Overall, it is apparent that neoclassical
and new trade theories differ in many points but agree that international trade openness
stimulates economic growth among developing countries.
Trade openness - Economic growth
International trade openness is a channel through which FDI, capital inputs, goods and
services flow to host countries or regions. These are sources of economic growth to
developing countries. The relationship between trade openness and economic growth has
been an issue of controversy and verification by academics and researchers in recent years.
This section presents the literature and empirical review of the above relationship.
Ever since Adam Smith (1937) and David Ricardo (1973), economists have acknowledged
the positive role of openness to trade on economic growth. Trade can directly increase per
capita income when countries specialize in producing goods in which they have a
comparative advantage but it also can indirectly encourage development via other channels
such as technology transfer, product diversity, increasing scale economies, efficient allocation
and distribution of resources within the economy and interaction with trading partners.
8
However, it should be mentioned that in cases where trading partners are asymmetric
countries, with significantly different technologies and endowments, economic integration,
even if it increases the worldwide growth rates, may unfavorably affect individual countries4.
Numerous studies have reported the importance of trade in the long run. Macro econometric
evidence finds that open economies enjoy faster economic growth while micro econometric
evidence supports that firms that experience faster growth, are those which have already
entered the export market. Openness raises imports and exports of goods and services and
improves domestic technology. Hence, production process is more effective and productivity
rises. As a result, economies open to world trade; grow faster than closed ones and increasing
openness is assumed to have a positive impact on growth. For this reason, Ben-David and
Loewy (1998) proposed that trade barriers should be decreased for an economy to grow. The
greater the growth effects, the more countries enact trade barriers reduction policies.
However, Adhikary (2011) mentions that a liberalized trade regime results in larger exchange
rate depreciation which decreases the aggregate supply of inputs by increasing the prices of
the imported inputs used in the production. As a consequence, domestic output tends to be
reduced and domestic market becomes less competitive.
According to many empirical studies, the growth rate of GDP is positively related to the
growth rate of trade openness (Edwards (1992), Wacziarg (2001), Sinha D. and Sinha T.
(2000)). However, not everyone agrees that openness to trade is of outstanding importance.
Rodriguez and Rodrik (1999) show that the positive correlation between openness and growth
is not robust as a result of problems in openness measures or lack of the appropriate control
variables. For instance, Rodrik et al. (2002) demonstrate that the strong effect of trade on
growth, in both Alcala and Ciccone (2002) and Dollar and Kraay (2003), comes from their
choice of measuring openness by using “real openness”5, instead of the conventional
measures of openness6, which always results in positive biased estimations of openness on
growth. In addition to this, it is possible that omitted variables may create a positive
relationship between openness and growth (Rodriguez and Rodrik (2001); Hallak and
Levinsohn (2004)). If one includes a geography measure or a measure of institutional quality,
then the effect of openness on growth is mitigated and becomes less significant.
Another group of literature supports that trade openness effectively fosters economic
growth, only by the improvement of particular policies and sectors or by the existence of
4 See Grossman and Helpman (1991), Lucas (1998), Rivera-Batiz and Xie (1993) and Young (1991).
5 Nominal trade divided by GDP adjusted for purchasing power parity.
6 Nominal trade divided by nominal GDP.

9
specific preconditions. For international trade openness contribution to be strong in
developing countries, Rodrik (1997) proposed the accumulation of human capital, physical
infrastructures, macroeconomic stability, private sector development and the rule of law. In
addition to this, Abramovitz (1986) and Howitt (2000) support that host economies should
have a sufficiently high level of “social capability” in order to successfully implement
technology developed in more advanced economies. Finally, the adoption of technology also
depends on the “absorptive capacity” of a country which is determined by human capital and
R&D investment. The lack of investment in human capital and R&D prevent less developed
countries from fully exploiting technology transfers, and hence confines productivity growth.
Even though technological spillovers, international transmission of knowledge and
allocative efficiency are more easily achieved with an open trade regime, there are many
studies which support that trade openness negatively affects economic growth. According to
Alessandro De Matteis (2004), trade liberalization sets exogenous constraints to economic
growth. This is specifically detrimental to young economies, since it contributes to enforce
their dependence on international demand and to increase their vulnerability to the
fluctuations of international markets. In addition to this, Rodrik (1992) mentions that
openness may cause macroeconomic instability by augmenting inflation, depreciating
exchange rates and leading to balance payment crisis while Levine and Renelt (1992) claim
that a higher degree of openness negatively affects domestic investments. Finally, Battra and
Slottje (1993) and Leamer (1995) suggest that free trade can be a primary source of economic
downturn. Trade liberalization implies lower tariffs, making imports more attractive than
domestic production. In this case, the domestic economy may suffer a loss.
To sum up, in view of the studies within the literature, it can be stated that no certain
agreement has been achieved on the effect of trade openness on economic growth. Despite the
strong theoretical support that growth in trade generates continuous economic growth; many
times, the failure of the empirical literature to consistently deliver the same picture is a fact.
One part of the explanation for this lack of conclusive evidence is due to the inappropriate
way in which trade, defined in terms of trade openness, is measured. Additionally, data and
methodology quality are reasons that existing studies have been criticized for.
Do countries with lower policy induced barriers to international trade grow faster? This is
the central question of my survey. I will try to investigate the exact impact of trade openness
on economic growth, in a panel of developing countries, by altering the set of my control
variables. The reason I am doing this, is in order to see whether my results significantly
change when I change my control variables. For instance, how does the relationship between
the trade share of GDP and economic growth change, when the initial GDP per capita enters
10
the growth equation? Subsequently, I will examine again the openness growth nexus, by
focusing only on the thirty Sub-Saharan African countries of my initial sample. SSA countries
are shown to be a long way from the major economic markets in Europe, North America and
East Asia than most other regions in the world. This is one of the reasons that motivated me
for this further analysis.
IV. Theory
The objective of this research is to investigate the exact effect of international trade
openness on economic growth in a survey of 71 developing countries, using cross sectional
panel data for the period 1990-2005. The phenomenal differences among the growth rates of
East Asian, Latin American and Sub-Saharan African countries motivated me to include
developing countries from all over the world, with different economic, political, geographical
and institutional features, exploring how trade liberalization influences their economic
performance. Data availability was an additional crucial factor to my final choice. In the
course of my research I come across evidence that the benefits of openness have weakened
for the poorer developing countries, particularly during the onset of the third wave of
globalization around 1980. SSA region consists of 47 countries, 34 of which are ranked as the
world’s poorest countries. This motivated me to continue my survey by isolating the thirty
SSA countries of my initial sample and examine again the effect of trade openness on their
economic performance.
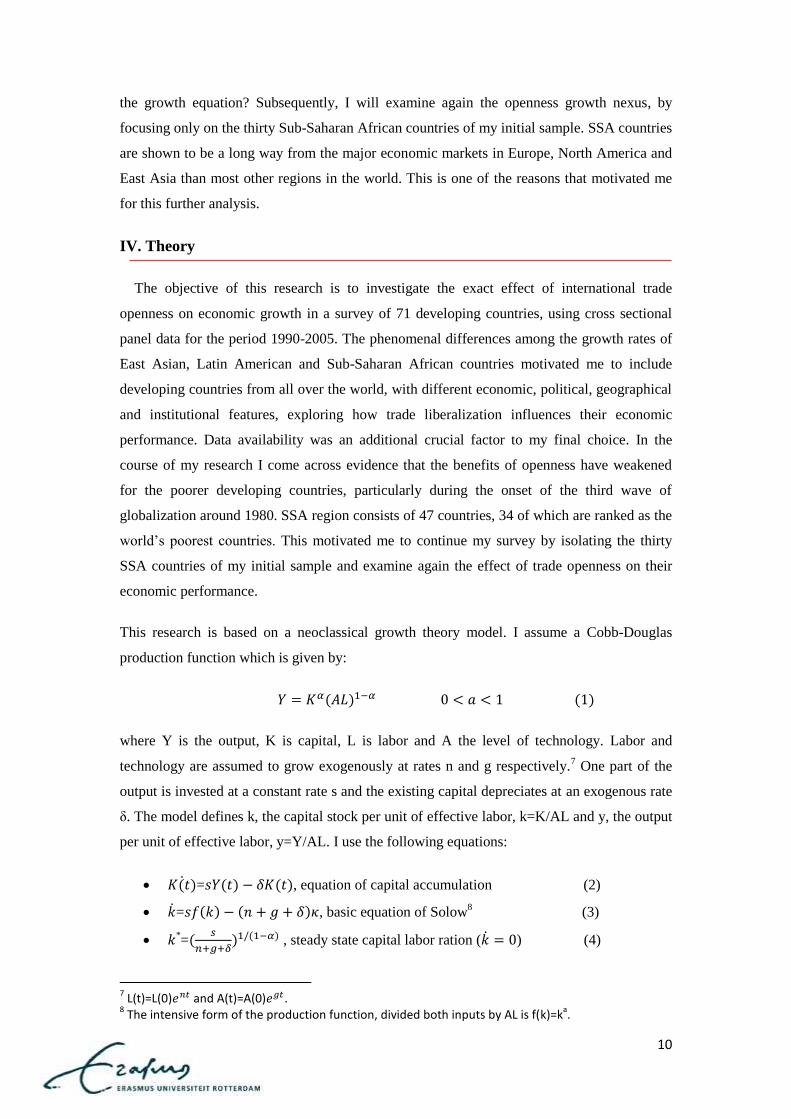
This research is based on a neoclassical growth theory model. I assume a Cobb-Douglas
production function which is given by:
where Y is the output, K is capital, L is labor and A the level of technology. Labor and
technology are assumed to grow exogenously at rates n and g respectively.7 One part of the
output is invested at a constant rate s and the existing capital depreciates at an exogenous rate
δ. The model defines k, the capital stock per unit of effective labor, k=K/AL and y, the output
per unit of effective labor, y=Y/AL. I use the following equations:
= , equation of capital accumulation (2)
= , basic equation of Solow8 (3)
*=
, steady state capital labor ration ( ) (4)
7 L(t)=L(0) and A(t)=A(0) .
8 The intensive form of the production function, divided both inputs by AL is f(k)=k
a.

11
Substituting equation (4) into the production function and taking logs, I take the steady state
income per capita (empirical specification):
=
(5)
By making the above analysis, I come across evidence that the central predictions of Solow
model concern the impact of investments (s) and population growth (n) on real income.
Hence, these two variables are included in my basic empirical specification. However, the
focus of my research is on economic growth, the growth rate of GDP per capita and not the
steady state income level. For this reason, taking the natural log of the Cobb-Douglas
production function and then the derivatives with respect to time, I derive the growth rates of
my variables and find the following equation:
(
)
(6)
A more detailed description of the above equations is cited in the Appendix (part 1).
I assume that g and δ are constant across countries. According to Mankiw, Romer and Weil
(1992), g reflecting the advancement of knowledge, is not country specific and depreciation
rates do not vary greatly across countries. For this reason, I construct my model by focusing
on population growth and the fraction of output which is invested. Measuring n as the rate of
population growth and s as the investment share of GDP (including domestic investments), I
gradually augment the model, by incorporating: a) trade shares of GDP, as a measure of
international trade openness which proxies for the level of technology. Trade openness allows
for technology diffusion across countries exposing them to new ideas and more advanced
methods of production b) the initial GDP per capita, the growth literature emphasizes the
importance of the initial values in explaining subsequent growth rates that are captured by the
initial value of GDP c) control variables. I select the set of control variables considering both
their importance as growth determinants per se and their potential for affecting the growth
response of trade openness. Hence, my final empirical specification can be specified as
follows:
(7)
The key variable of this study is trade openness. A brief discussion of this variable is provided
below:

12
Trade openness
It is a remarkable fact that while for some, South Korea has been an open and outward
economy (Greenaway and Nam, 1988), for others it is an example of a semi-closed economy
in which the government highly intervenes (Wade, 1994). For a long time, economists have
attempted to find comparative measures of trade openness but this has proven to be
controversial and difficult. To investigate measurement, we acknowledge that openness is a
multidimensional concept. However, some studies choose openness measures due to data
availability and some other researchers have constructed indices that measure the degree one
country exports and imports goods, such as Leamer (1998), Dollar (1992) and Sachs and
Warner (1995).
Trade openness has been measured in various ways in the hundreds of studies investigating
the issue. Firstly, the most basic measure of openness is trade shares (outcome openness
measure), which is exports plus imports divided by GDP, used by a large number of studies
that find a positive and strong relationship with growth. The second category includes
measures of trade barriers (policy openness measures), such as average tariff rates, export
taxes, taxes on international trade and indices of non-tariff barriers (NTBs) which measure the
trade restrictiveness of countries. Tariffs, defined as the ratio of tariff revenues to import
values, directly measure trade restrictions but their impact on growth is a quite controversial
issue.9 Due to data limitations and the existence of measurement errors, most of these
measures are highly ignored in the empirical literature.
Exchange rates are another group of measures. Black market premium is the most widely
used measure in this group and indicates the severity of trade restrictions. Nevertheless, it is
argued that the black market premium, reflecting general poor economic management, is a
good proxy for the overall degree of external sector distortions rather than being a measure of
trade policy, due to its high correlation with a number of “bad” policies, such as high inflation
or high degree of corruption. Finally, various indices of trade orientation have been
constructed to examine the impact of openness on growth. Sachs and Warner (SW) openness
index is a binary measure, which ranks countries as closed, if they meet any of the following
five criteria: average tariff rates of 40% or more, NTBs covering 40% or more, a socialist
economy, a black- market exchange rate depreciated by 20% or more relative to the official
exchange rate on average during 1970 or 1980s and a state monopoly on major exports. This
index is not often utilized due to its restrictive nature. It only classifies countries as fully
liberalized or closed to trade, without estimating the depth of international trade.
9 Lee (1993), Harisson (1996) and Edwards (1998) proved a significant and negative relationship
between trade and growth while Barro Sala I Martin (1997) and Clemens and Williamson (2001) found that this relationship is weak.

13
Taking into consideration all the above literature, trade shares of GDP, measured as exports
plus imports divided by each country’s GDP, (X+M/GDP), is used as the key variable in my
research, to proxy for the level of trade between the economy and the rest of the world,
shedding light on the significance of trade volumes in enhancing economic growth in
developing countries. But, why an outcome openness measure and not a policy indicator or a
measure of effective protection?
Outcome measures describe the volume of trade or its components. In simple words, the
higher the trade share for a particular country, the more open its economy is to trade benefits.
Even though this type of indicator is most subject to endogeneity problems with respect to
growth (Frankel and Romer, 1999), it focuses on the effects of actual exposure to
international markets on economic growth, accounting well for the effective level of
interaction in regional and international level.10
This dimension captures the importance of
trade to a particular country. An important advantage of using trade shares of GDP is that they
are not contrived.11
Trade outcomes are clearly defined, well measured and more easily
obtainable from objective data sources. All the aboves explain why the majority of empirical
studies use trade shares for the hypothesis testing. Nevertheless, a striking anomaly arises
when countries are ranked by this measure. Trade shares of GDP take into account only the
relative position of a country’s trade performance compared with its domestic economy. This
results in the ranking of some countries such as Japan, as relatively closed economies.12
Overall, as I mentioned before, increased trade openness can result in magnified gains
owing to large knowledge spillovers, greater level of competition, product variety and
technology transfer. Higher exports increase real output while higher imports mitigate
production cost.13
As a result, it is commonly accepted that a high degree of trade openness is
a growth enhancing policy tool.
Main Hypothesis: Trade openness is an engine for economic growth. Actually, I expect a
positive and statistically significant relationship between them.
10
Trade interaction within and between countries. 11
This is in contrast to various indices of trade orientation, constructed by many researchers, such as the arbitrary binary (0, 1) measure proposed by Sachs and Warner (1995). 12
They are closed in the sense that their trade share of total economic activity is quite low by world standards. 13
According to the theory of comparative advantage, international trade leads to a more efficient use of a country’s resources through the imports of goods and services that otherwise are too costly to produce within the country.

14
Control Variables:
Population growth: Economic theory offers no consensus to policymakers on the
relationship between population and economic growth. The supporters of endogenous
growth theory claim that population growth stimulates technological advancement
while classical economists argue that a rampant population growth possibly
deteriorates GDP per capita. Thus, population growth could be beneficial or
detrimental to economic growth.
Investments: In my research the investments variable includes domestic investments
which can increase the level of productivity in the economy by improving the quality
and quantity of human capital. A positive and statistically significant relationship
between growth and investments is expected.
Inflation: Inflation is used as a proxy for macroeconomic stability, but a high value
of this variable is assumed to have a negative impact on growth since it confines
output growth, savings and the quality of investments.
Domestic credit: Domestic credit by the banking sector as a share of GDP is the
financial support that is offered to the private sector as an engine of economic growth.
Enacting policies that develop one country’s the financial sector would be expected to
expand economic growth.
Industry: This is the industrial share of GDP, used to proxy for industrialization
processes and technological capacity or depth in developing countries. Along with
trade variables, industrial value added works as an impetus affecting economic
growth positively.
A more detailed description of control variables is cited in Appendix, part 2.

15
V. Data and methodology
In this section, I start to undertake an empirical investigation of the main hypothesis that
trade is a good growth promoting policy tool. The dataset used in this research, is an
unbalanced panel data consisting of 71 developing countries (Appendix, part 4) covering the
years 1990-2005. I chose a relatively long time period14
in order to examine the specific
effects that trade openness has on growth and isolate the influence of other factors. Then, I
will try to identify, in the context of the openness-growth relationship, factors that can
account for the poor growth performance of sub-Saharan African countries (SSA). Thus, I
isolate the thirty SSA countries of my initial sample (Appendix, part 5), and I examine again
the main hypothesis. The data15
has been collected by the World Data Bank.
Particularly, for economic growth, I choose GDP annual growth rates per capita and for my
major independent variable, trade openness, I take exports plus imports divided by GDP. As a
proxy of investments and population growth, gross capital formation as a share of GDP16
and
annual population growth rates are included in my regression, as the Solow model predicts.
Also, GDP deflator, domestic credit and industrial value added, as a share of GDP are used to
proxy for macroeconomic stability, financial development and industrialization process
respectively.
In each model, I run several regressions controlling one different set of variables at a time.
The reason I am doing this is in order to see whether my results significantly change when I
change my control variables. Using OLS specification leads me to invalid results. OLS
regressions of per capita income on the ratio of exports plus imports and other variables may
not indicate the effect of trade on growth due to endogeneity of trade shares. Does trade cause
growth or growth cause trade? Countries, whose incomes are already high, for reasons not
related to trade, may have higher trade ratios. Also, OLS is likely to be inefficient since it
does not control for unobservable individual effects. For the above reasons, I continue to a
panel data analysis which includes both random effects (RE) and fixed effects (FE) models.
There are several reasons for the increasing interest in panel data models. An important one is
that they capture, compared with time series or cross sectional data sets, both inter country
and inter temporal variation giving us the possibility to reveal dynamics and information
which are difficult to detect with other estimation techniques. Finally, the large number of
14
According to Sachs and Warner (1995), Edwards (1998) and Rodrik and Rodriquez(2001), 16 years are considered as a long time period 15
All the observations of my explanatory variables are annual. 16
Gross capital formation (formerly gross domestic investments consists of outlays on additions to the fixed assets of the economy plus net changes in the level of inventories (World data bank).

16
observations is an additional advantage which increases the degrees of freedom and the
variability of our model, making it more accurate.
My first model can be specified as follows:
(8)
The equation (8) shows the Random effects (RE) model. Due to the fact that economic
growth in a current period t also depends on the values of my explanatory variables in a
previous period (t-1), the lags of independent variables are used. , where is
time invariant, denoting unobservable individual effects, and denotes the remainder
disturbance. In this approach, consistent estimation imposes that is uncorrelated with the
regressors.
However, in many applications the assumption that the observable regressors are
uncorrelated with the unobservable characteristics is considered not realistic, as there are
reasons to believe that E { ≠ 0 or E { . That is, the unobserved
heterogeneity in , correlated with one or more of my explanatory variables. For instance,
countries’ geographical characteristics, such as landlockdness, are highly correlated with
trade openness and influence its effect on growth. For this reason, many researchers like
Dollar and Kraay (2001) and Frankel and Romer (1999), use geographical variables in order
to obtain instrumental variables estimates of trade effects on income. The term includes
time invariant variables like geographical or climate characteristics. Hence, the possible
existence of correlation between unobservable effects and trade openness possibly explains
why Random effects model is not the appropriate one for my research and leads me to
inconsistent and biased results due to omitted variables. Finally, the Hausman17
test verifies
the above conclusion.
For all the above reasons, I use the fixed effects specification for all the sets of my
regressions. In a fixed effects model, the intercept varies across individuals (countries in my
survey) and therefore it relies on variation within individuals and not between them.
17
The Hausman test, tests the null hypothesis that unobservable individual effects are uncorrelated with the explanatory variables against the alternative hypothesis that the unobservable characteristics are correlated with the explanatory variables.

17
My model is specified as follows:
(9)
where captures all the unobservable heterogeneity across individuals that panel data
analysis renders a major attraction for researchers. In this approach, consistent estimation
does not impose that is uncorrelated with the explanatory variables.
Further, I extend my analysis, by using the two-way fixed effects model. This specification
leads me to even better results than fixed effects model, since it not only captures the
unobservable individual effects but also the unobservable time effects, by adding in
equation 9 an additional intercept .
The two way fixed effects specification is specified as follows:
(10)
where is the individual unobservable effects which varies across countries and is fixed over
time, is the timed unobservable effects that varies by year and is fixed across countries and
is the remainder stochastic error term.
18
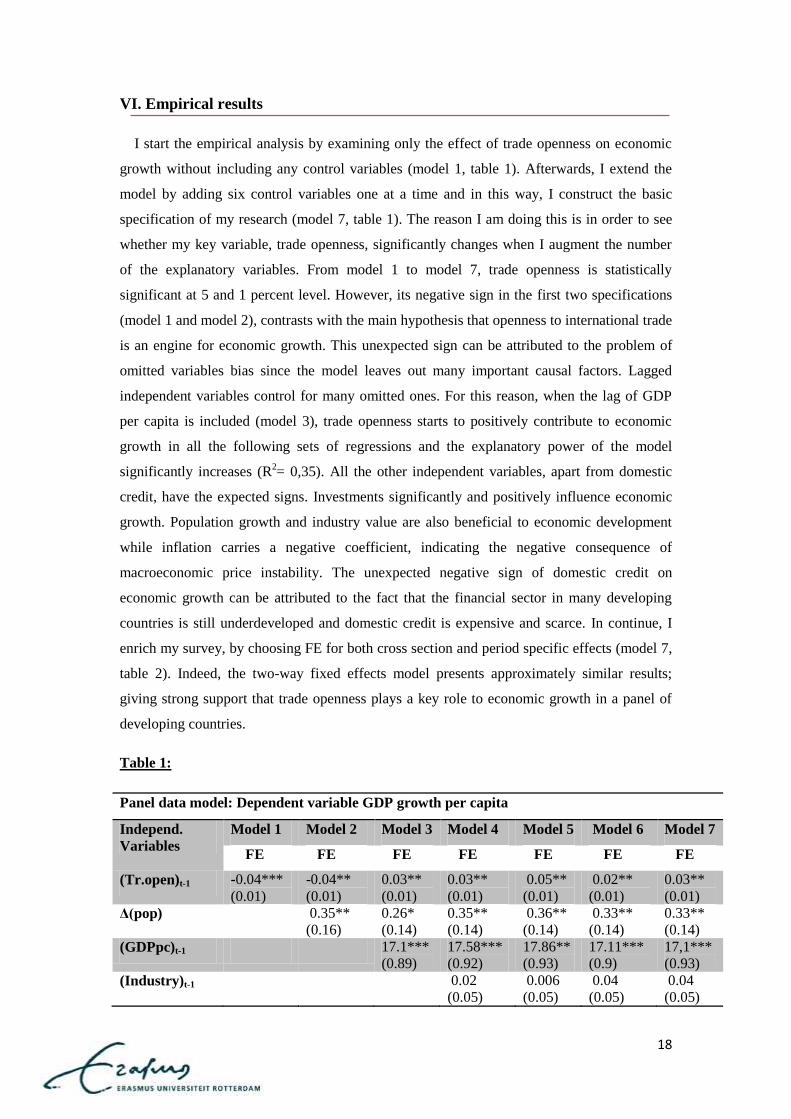
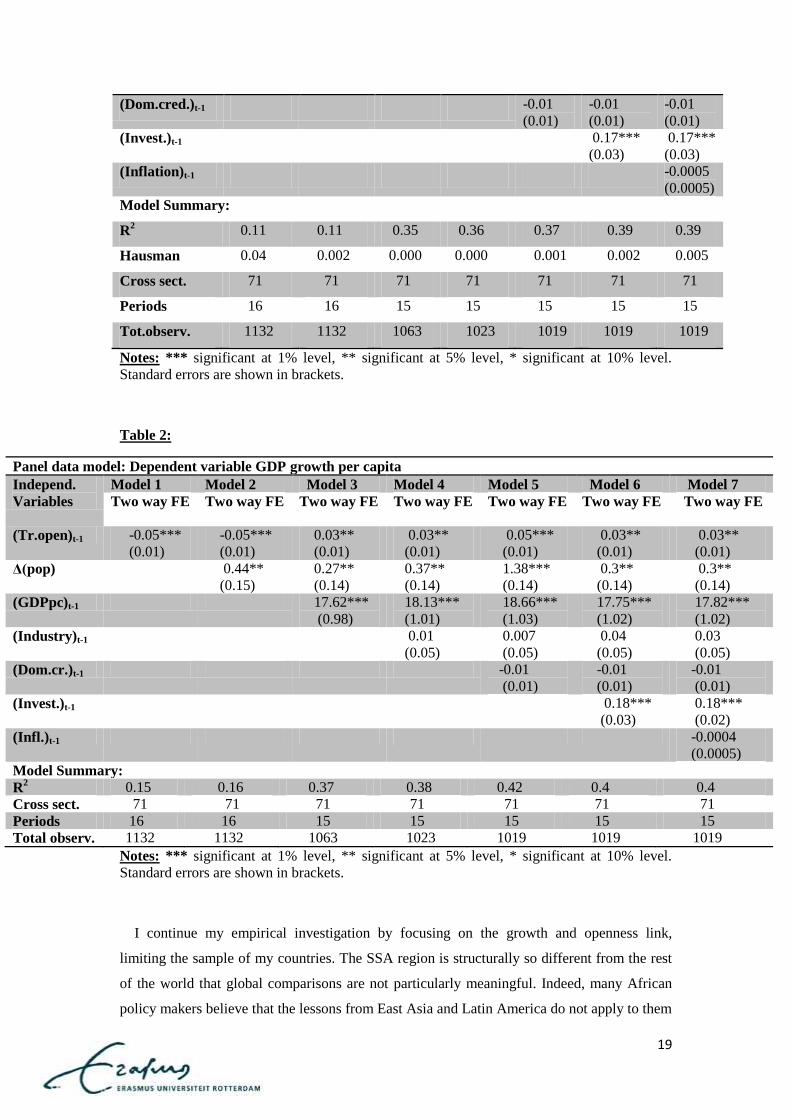
VI. Empirical results
I start the empirical analysis by examining only the effect of trade openness on economic
growth without including any control variables (model 1, table 1). Afterwards, I extend the
model by adding six control variables one at a time and in this way, I construct the basic
specification of my research (model 7, table 1). The reason I am doing this is in order to see
whether my key variable, trade openness, significantly changes when I augment the number
of the explanatory variables. From model 1 to model 7, trade openness is statistically
significant at 5 and 1 percent level. However, its negative sign in the first two specifications
(model 1 and model 2), contrasts with the main hypothesis that openness to international trade
is an engine for economic growth. This unexpected sign can be attributed to the problem of
omitted variables bias since the model leaves out many important causal factors. Lagged
independent variables control for many omitted ones. For this reason, when the lag of GDP
per capita is included (model 3), trade openness starts to positively contribute to economic
growth in all the following sets of regressions and the explanatory power of the model
significantly increases (R2= 0,35). All the other independent variables, apart from domestic
credit, have the expected signs. Investments significantly and positively influence economic
growth. Population growth and industry value are also beneficial to economic development
while inflation carries a negative coefficient, indicating the negative consequence of
macroeconomic price instability. The unexpected negative sign of domestic credit on
economic growth can be attributed to the fact that the financial sector in many developing
countries is still underdeveloped and domestic credit is expensive and scarce. In continue, I
enrich my survey, by choosing FE for both cross section and period specific effects (model 7,
table 2). Indeed, the two-way fixed effects model presents approximately similar results;
giving strong support that trade openness plays a key role to economic growth in a panel of
developing countries.
Table 1:
Panel data model: Dependent variable GDP growth per capita
Independ.
Variables
Model 1 Model 2 Model 3 Model 4 Model 5 Model 6 Model 7
FE FE FE FE FE FE FE
(Tr.open)t-1 -0.04***
(0.01)
-0.04**
(0.01)
0.03**
(0.01)
0.03**
(0.01)
0.05**
(0.01)
0.02**
(0.01)
0.03**
(0.01)
Δ(pop) 0.35**
(0.16)
0.26*
(0.14)
0.35**
(0.14)
0.36**
(0.14)
0.33**
(0.14)
0.33**
(0.14)
(GDPpc)t-1 17.1***
(0.89)
17.58***
(0.92)
17.86**
(0.93)
17.11***
(0.9)
17,1***
(0.93)
(Industry)t-1 0.02
(0.05)
0.006
(0.05)
0.04
(0.05)
0.04
(0.05)
19
(Dom.cred.)t-1 -0.01
(0.01)
-0.01
(0.01)
-0.01
(0.01)
(Invest.)t-1 0.17***
(0.03)
0.17***
(0.03)
(Inflation)t-1 -0.0005
(0.0005)
Model Summary:
R2 0.11 0.11 0.35 0.36 0.37 0.39 0.39
Hausman 0.04 0.002 0.000 0.000 0.001 0.002 0.005
Cross sect. 71 71 71 71 71 71 71
Periods 16 16 15 15 15 15 15
Tot.observ. 1132 1132 1063 1023 1019 1019 1019
Notes: *** significant at 1% level, ** significant at 5% level, * significant at 10% level.
Standard errors are shown in brackets.
Table 2:
Panel data model: Dependent variable GDP growth per capita
Independ.
Variables
Model 1 Model 2 Model 3 Model 4 Model 5 Model 6 Model 7
Two way FE
Two way FE Two way FE Two way FE Two way FE Two way FE Two way FE
(Tr.open)t-1 -0.05***
(0.01)
-0.05***
(0.01)
0.03**
(0.01)
0.03**
(0.01)
0.05***
(0.01)
0.03**
(0.01)
0.03**
(0.01)
Δ(pop) 0.44**
(0.15)
0.27**
(0.14)
0.37**
(0.14)
1.38***
(0.14)
0.3**
(0.14)
0.3**
(0.14)
(GDPpc)t-1 17.62***
(0.98)
18.13***
(1.01)
18.66***
(1.03)
17.75***
(1.02)
17.82***
(1.02)
(Industry)t-1 0.01
(0.05)
0.007
(0.05)
0.04
(0.05)
0.03
(0.05)
(Dom.cr.)t-1 -0.01
(0.01)
-0.01
(0.01)
-0.01
(0.01)
(Invest.)t-1 0.18***
(0.03)
0.18***
(0.02)
(Infl.)t-1 -0.0004
(0.0005)
Model Summary:
R2 0.15 0.16 0.37 0.38 0.42 0.4 0.4
Cross sect. 71 71 71 71 71 71 71
Periods 16 16 15 15 15 15 15
Total observ. 1132 1132 1063 1023 1019 1019 1019
Notes: *** significant at 1% level, ** significant at 5% level, * significant at 10% level.
Standard errors are shown in brackets.
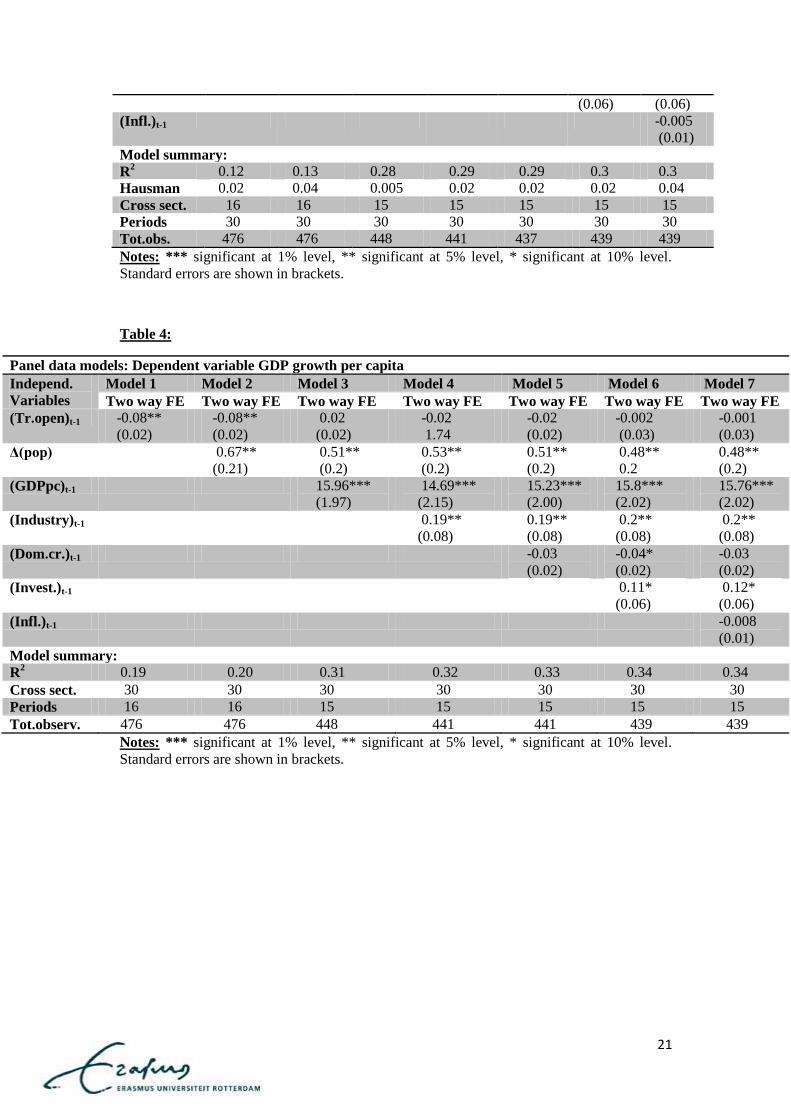
I continue my empirical investigation by focusing on the growth and openness link,
limiting the sample of my countries. The SSA region is structurally so different from the rest
of the world that global comparisons are not particularly meaningful. Indeed, many African
policy makers believe that the lessons from East Asia and Latin America do not apply to them

20
because the circumstances enormously differ. This stimulated me to isolate the thirty SSA
countries from my initial sample and to examine again the main hypothesis. I observe that, in
contrast with my previous results, even though I control for omitted variables bias, trade
openness is statistically insignificant in all the sets of regressions (table 3) which implies that
increased trade openness does not really contribute to economic growth. Various factors can
explain this result. Imports increase faster than exports in SSA countries, resulting in a
balance of payment deficit that imposes macroeconomic adjustment cost on the economy.18
Additionally, SSA countries depend more than half of their export earnings on just two
primary commodity goods which not only do they attract much gains compared to
manufactured ones, but also they are subject to weak and volatile world prices. This situation
comes in contrast with other countries with high shares of manufactures in their exports, such
as the East Asian countries that are relatively protected from non-stable export earnings, even
though they face a competitive world market. Another reason is that SSA countries face
‘natural barriers’ that raise the cost of trade. This implies that imports are more expensive and
exporting more costly. Also, many SSA countries are landlocked and many of those that are
not, have large interiors. This means that the primary products they produce should be
transported large distances to reach ports; road and rail systems tend to be inefficient and
scarce throughout SSA and sea shipping costs are relatively high. As a result, all the above
factors plus poor infrastructures, rigidities in technological and industrial capacity and an
underdeveloped financial sector can explain why increased trade openness does not enhance
economic growth for SSA countries and that the East Asian and Latin America countries of
my initial sample drive the previous significant and positive openness - growth nexus. Similar
results are presented in table 4 by using the two-way fixed effects model.
Table 3:
Panel data model: Dependent variable GDP growth per capita
Independ.
Variables
Model 1 Model 2 Model 3 Model 4 Model 5 Model 6 Model 7
FE FE FE FE FE FE FE
(Tr.open)t-1 -0.09***
(0.02)
-0.09***
(0.02)
0.02
(0.02)
-0.01
(0.01)
-0.007
(0.01)
-0.002
(0.03)
-0.002
(0.03)
Δ(pop) 0.68**
(0.21)
0.57**
(0.2)
0.59**
(0.2)
0.58**
(0.2)
0.55**
(0.2)
0.55**
0.2
(GDPpc)t-1 15.95***
(1.67)
14.23***
(1.8)
14.24***
(1.8)
15***
(1.71)
15***
(1.72)
(Industry)t-1 0.19**
(0.08)
0.19**
(0.08)
0.2**
(0.08)
0.2**
(0.08)
(Dom.cr.)t-1 -0.03
(0.02)
-0.03
(0.02)
-0.03
(0.02)
(Invest.)t-1 0.11* 0.12*
18
An example is provided by Ethiopia, where the trade deficit expanded in the 1990s as imports increase from 12 to 28 per cent of GDP but exports only rose from 6 to 15 per cent of GDP.
21
(0.06) (0.06)
(Infl.)t-1 -0.005
(0.01)
Model summary:
R2 0.12 0.13 0.28 0.29 0.29 0.3 0.3
Hausman 0.02 0.04 0.005 0.02 0.02 0.02 0.04
Cross sect. 16 16 15 15 15 15 15
Periods 30 30 30 30 30 30 30
Tot.obs. 476 476 448 441 437 439 439
Notes: *** significant at 1% level, ** significant at 5% level, * significant at 10% level.
Standard errors are shown in brackets.
Table 4:
Panel data models: Dependent variable GDP growth per capita
Independ.
Variables
Model 1 Model 2 Model 3 Model 4 Model 5 Model 6 Model 7
Two way FE Two way FE Two way FE Two way FE Two way FE Two way FE Two way FE
(Tr.open)t-1 -0.08**
(0.02)
-0.08**
(0.02)
0.02
(0.02)
-0.02
1.74
-0.02
(0.02)
-0.002
(0.03)
-0.001
(0.03)
Δ(pop) 0.67**
(0.21)
0.51**
(0.2)
0.53**
(0.2)
0.51**
(0.2)
0.48**
0.2
0.48**
(0.2)
(GDPpc)t-1 15.96***
(1.97)
14.69***
(2.15)
15.23***
(2.00)
15.8***
(2.02)
15.76***
(2.02)
(Industry)t-1 0.19**
(0.08)
0.19**
(0.08)
0.2**
(0.08)
0.2**
(0.08)
(Dom.cr.)t-1 -0.03
(0.02)
-0.04*
(0.02)
-0.03
(0.02)
(Invest.)t-1 0.11*
(0.06)
0.12*
(0.06)
(Infl.)t-1 -0.008
(0.01)
Model summary:
R2 0.19 0.20 0.31 0.32 0.33 0.34 0.34
Cross sect. 30 30 30 30 30 30 30
Periods 16 16 15 15 15 15 15
Tot.observ. 476 476 448 441 441 439 439
Notes: *** significant at 1% level, ** significant at 5% level, * significant at 10% level.
Standard errors are shown in brackets.

22
VII. Conclusion
Trade liberalization has been a prominent element of policy advice to developing countries
during the last two decades. It is claimed that economic growth is probably the most
important benefit originated from it, since increased trade openness promotes the efficient
allocation of resources, enhances competition in national and international markets and allows
for diffusion of knowledge and technology across countries. But, can this argument
confidentially be generalized?
Using an augmented production function based on the standard Solow model and
transforming it in a panel data estimation technique, I try to investigate if trade openness
plays a key role to economic growth in a sample of 71 developing countries during the period
1990-2005. Both fixed effects and two-way fixed effects models deliver the same outcome;
increased trade openness significantly and positively contributes to economic growth in a
sample of East Asian, Latin America and Sub-Saharan Africa countries, after controlling for
important growth determinants. Using the panel data analysis, I find that unobserved country
specific effects are significant and ignoring them introduces a serious omitted variables
problem. For this reason, after controlling for important causal factors, like the initial GDP
per capital, population growth, proxies for macroeconomic stability, industrialization and
financial development, I conclude to growth enhancing effects of trade openness.
Then, even though, until now I find consistent evidence that increased openness promotes
growth, when I isolate the 30 SSA countries of my initial sample and examine again the main
hypothesis, my empirical results give strong support that there is no evidence of relationship
between economic growth and trade openness. Natural barriers that raise the cost of trade,
poor overland infrastructures to distant large markets, export dependence only on two primary
goods and a low level of human capital, technological capacity and institutional quality are all
important reasons that can explain the previous empirical result.
Additionally, evidence has been raised that the relationship between openness and
economic growth is not necessarily always positive. I found that an open trade regime brings
a lot of benefits to many developing countries such as of East Asia and Latin America region,
that drive the previous positive openness-growth nexus, but not for SSA countries. As a
result, I suppose that how trade liberalization affects economic growth depends on a large set
of determinants, which account for the proposed heterogeneity across countries, including the
geographical position, the existing level of development, the macroeconomic stability or the
strength of financial sector and domestic institutions and that, many times, global
comparisons are not particularly meaningful.

23
To sum up, during my survey, I faced many difficulties in finding a widely accepted
international trade openness measure and a more concrete concept of what openness means. A
lot of controversy about these two issues has been raised. There are numerous measures of
trade openness and hence an increasing need for further research to construct an openness
measure that could capture the existing ones and would further lead to more robust empirical
results. However, using trade shares of GDP as the key variable of my research, to measure
trade openness can be considered as one of the best options, since trade outcomes are clearly
defined, well measured and more easily obtainable from objective data sources. Finally, one
possible limitation of my survey could be the fact that the empirical results may be subject to
a degree of omitted variable bias (exchange rates, measure of institutional quality).

24
References
Abramovitz M. (1986) “Catching up, Forging Ahead and Falling Behind” Journal of
Economic History, 46, 385-406.
Adhikary, B.K (2011). FDI, Trade Openness, Capital Formation, and Economic
Growth in Bangladesh: A Linkage Analysis. International Journal of Business and
Management, vol.6 No 1.
Akerlof, G. A., Dickens,W. and Perry, G. (1996). The macroeconomics of low
inflation, Brookings Papers on Economic Activity, vol. 1, 1–59.
Alcala, F. and Ciccone, A. (2002): Trade and productivity. Paper presented at the
National Bureau of Economic Research Summer Institute.
Allesandro de Matteis, Journal of International Development J. Int. Dev. 16, 575–588
(2004).
Barro, Robert, and Xavier Sala-i Martin. (1997)"Technological Diffusion,
Convergence, and Growth." Journal of Eco-nomic Growth 2(1):1-26.
Batra R. and D.J Slottje. (1993). Trade policy and poverty in the United States: theory
and evidence, 1974-1990.Review of International Economics 1:189-208.
Ben-David, B. and M. Loewy (1998), “Free Trade, Growth, and Convergence”,
Journal of Economic Growth, Vol. 3, July, pp. 143-170.
Blanchet, Didier. (1991). “On Interpreting Observed Relationships between
Population Growth and Economic Growth: A Graphical Exposition.” Population and
Development Review 17:105-114.
Boserup, Ester. (1965). The Conditions of Agricultural Growth. London: Allen and
Unwin.
Chen, P. and R. Gupta (2006), “An Investigation of Openness and Economic Growth
using Panel Estimation”, University of Pretoria, Working Paper No. 2006-22.
Clemens, M.A., Williamson, J.G., (2001). A tariff-growth paradox? Protection’s
impact the world around1875–1997. NBER Working Paper Series, No. 8549.
Dollar, D. (1992). 'Outward-oriented developing economies really do grow more
rapidly: evidence from 95 LDCs, 1976-1985', EconomicD evelopmenta nd Cultural
Change,v ol. 40 (3), pp. 523-44.
Dollar, D. and A. Kraay. (2001). Trade, Growth and Poverty, World Bank Policy
Research Department Working Paper No. 2587, Washington DC.
Dollar, D. and Kraay, A. (2003): Institutions, trade and growth. Journal of Monetary
Economics 50,133–62.
Edwards, S., (1992). Trade orientation, distortions and growth in developing
countries.Journal of Development Economics 39, 31– 57.

25
Edwards, S. (1998b). Openness, productivity and growth: What do we really know?
Economic Journal, 108(447): 383-398.
Ellahi N. et al. (2011) Analyzing empirical relationship between trade openness and
industrial value added and economic growth: A case study of Pakistan.
Interdisciplinary journal in contemporary research in business, MAY 2011, VOL.3
No 1.
Fischer, S. (2003), “Globalization and Its Challenges” American Economic Review
93(2), 1-30.
Frankel, J. and D. Romer (1999), “Does Trade Cause Growth?” The American
Economic Review, vol.89, No. 3, pp. 1-21.
Fountas, S., Karanasos, M. and Kim, J. (2006). Inflation uncertainty, output growth
uncertainty and macroeconomic performance.Oxford Bulletin of Economics and
Statistics, 68(3), 319–43.
Gillman M., Harris, M. N. and MATYAS, L. (2004). Inflation and growth: explaining
a negative effect. EmpiricalEconomics, 29(1), 149–67.
Greenaway, David and Nam, Chong H. (1988), “Industrialization and
macroeconomic performance in developing countries under alternative trade
strategies, kyklos, vol.41, no.3 pp.419-35.
Grossman, G., and E. Helpman (1990), “Trade, Innovation and Growth”, The
American Economic Review, Vol. 80, No. 2, pp. 86-91.
Grossman, G.M., Helpman, E., (1991a). Quality ladders in the theory of growth.
Review of Economic Studies 58, 43– 61.
Grossman, G.M., Helpman, E., (1991b). Endogenous product cycles. Economic
Journal 101, 1229–1241.
Hallak, J. C. and Levinsohn, J. (2004). Fooling ourselves: evaluating the globalization
and growth debate. NBER Working Paper 10244.
Harrison, A. (1994), “Openness and Growth: A Time Series, Cross Country Analysis
for Developing Countries”, Journal of Development Economics, Vol. 48, 419-447.
Harrison, A. E. (1996). “Openness and Growth: A Time Series, Cross Country
Analysis for Developing Countries.” Journal of Development Economics 48: 419-
447.
Harrod, R. F. (1939). An essay in dynamic theory. Economic Journal 49: 14–33.
D. Hodge, (2005) “Inflation and Growth in South Africa” Cambridge Journal of
Economics 2006, 30, 163–180.
Howitt P. (2000), “Endogenous Growth and Gross country Income Differences”
American Economic Review, 90 (4), 111-30.
26
Kendrick, J.W. (1993). How much does capital explain? In A. Szirmai, B. Van Ark &
D. Pilat (Eds.), Explaining Economic Growth.Essays in Honour of Angus
Maddison.Amsterdam: North Holland. 129-146.
Krueger, A.O., (1978). Liberalization Attempts and Consequences. Ballinger,
Cambridge.
Kyrre Stensnes (2006) “Trade Openness and Economic Growth, Do institutions
matter?”Norsk Utenrikspolitisk Institutt No.702-2006.
Leamer E. (1995). A trade Economist’s View of U.S Wages and Globalization, ed.
Baldwin R. Brookings Conference Proceedings.
Leamer, E.E., (1998). Measures of openness. In: Baldwin, R.E. (Ed.), Trade Policy
Issues and Empirical Analysis. The University of Chicago Press, Chicago, pp. 147–
204.
Lee, J.-W., (1993).International trade, distortions, and long-run economic
growth.IMF Staff Papers 40 (2), 299– 328.
Levine, R., &Renelt, D. (1992).A sensitivity analysis of cross-country
regressions.The American EconomicReview, 82(4), 942-963.
Lucas, R.E., (1988). On the mechanics of economic development.Journal of
Monetary Economics 22, 3 –42.
N. Gregory Mankiw; David Romer; David N. Weil.A contribution to the empirics of
economic growth.The Quarterly Journal of Economics, Vol. 107, No. 2. (May, 1992),
pp. 407-437.
Pritchett, L. (1996): ‘Measuring Outward Orientation in the LDCs: Can It Be
Done?’,Journal of Development Economics, 49: 309–55.
Ray, D. (1998), Development Economics. Princeton, New Jersey: Princeton
University Press.
Ricardo, D. 1973 (1821): The principles of political economy and taxation. London:
J.M. Dent and Sons.
Rivera-Batiz, L.A., Xie, D., (1993).Integration among unequals. Regional Science
and Urban Economics 23,337–354.
Rodrik, D. (1992). The limits of trade policy reforms in developing countries.The
Journal of EconomicPerspectives, 6(1), 87-105.
Rodrik, D. (1997), “Trade Policy and Economic Performance in Sub-Saharan
Africa”, Harvard University Working Papers, (Online Paper).
Rodrik, D., Subramanian, A. and Trebbi, F. (2002): Institutions rule: the primacy of
institutions over geography and integration in economic development.
http://ksghome. harvard.edu/_.drodrik.academic.ksg/papers. html (last accessed July
2003).
27
Rodriguez, F. and Rodrik, D. (1999): Trade policy and economic growth: a skeptic’s
guide to the cross-national evidence. NBER Working Paper 7081, Cambridge MA:
National Bureau of Economic Research.
Rodrıguez, F. and Rodrik, D. (2001). Trade policy and economic growth: a skeptic’s
guide to the cross-national evidence. NBER Macroeconomics Annual 2000 261–325.
Romer P.M.(1990),’Endogenous Technological Change’ Journal of Political
Economy, 98(5), S 1971-1102.
Sala-i-Martin, X. (1997).I just Ran Two Million Regressions.American Economic
Review.87, 178-183.
Sachs, J., A. Warner, A. Aslund and S. Fisher (1995), “Economic Reforms and the
Process of Global Integration”, Brookings Papers on Economic Activity, Vol. 1995,
No.1, pp. 1-128.
Schumpeter, J. A. (1934) “The Theory of Economic Development”.Translated by
Redvers Opie, Cambridge MA: Harvard University Press.
Sinha, D. and Sinha, T. (2000), “Openness, Investment and Economic Growth Asia”.
The Indian Economic Journal 49, No. 4, page 110-117
Solow, R. (1956). A contribution to the theory of economic growth. Quarterly Journal
of Economics 70: 65–94.
Solow, Robert M. (1957) “ Technical Change and the Aggregate Production
Function” Review of Economics and Statistics 39, August, 312-320.
Srinivasan, T. N. (1999). Trade orientation, trade liberalization, and economic
growth. In G. R. Saxonhouse and T. N. Srinivasan (eds), Development, Duality, and
the International Economic Régime. Essays in Honor of Gustav Ranis. Ann Arbor,
MI: The University of Michigan Press.
Wacziarg, R. (2001). 'Measuring the dynamic gains from trade', World Bank
Economic Review, vol. 15 (3), pp. 393-429.
Wade Robert (1994) “Is the miracle study right? Working Paper, Washington, DC,
Overseas Development Council.
Yanikkaya Halit (2003), “Trade Openness and Economic Growth: a cross country
empirical investigation”, Journal of Development Economics 72, pp. 57-89.
Young, Alwyn. (1991). "Learning by Doing and the Dynamic Effects of International
Trade." Quarterly Journal of Economics 106:369-405.
28
Appendix
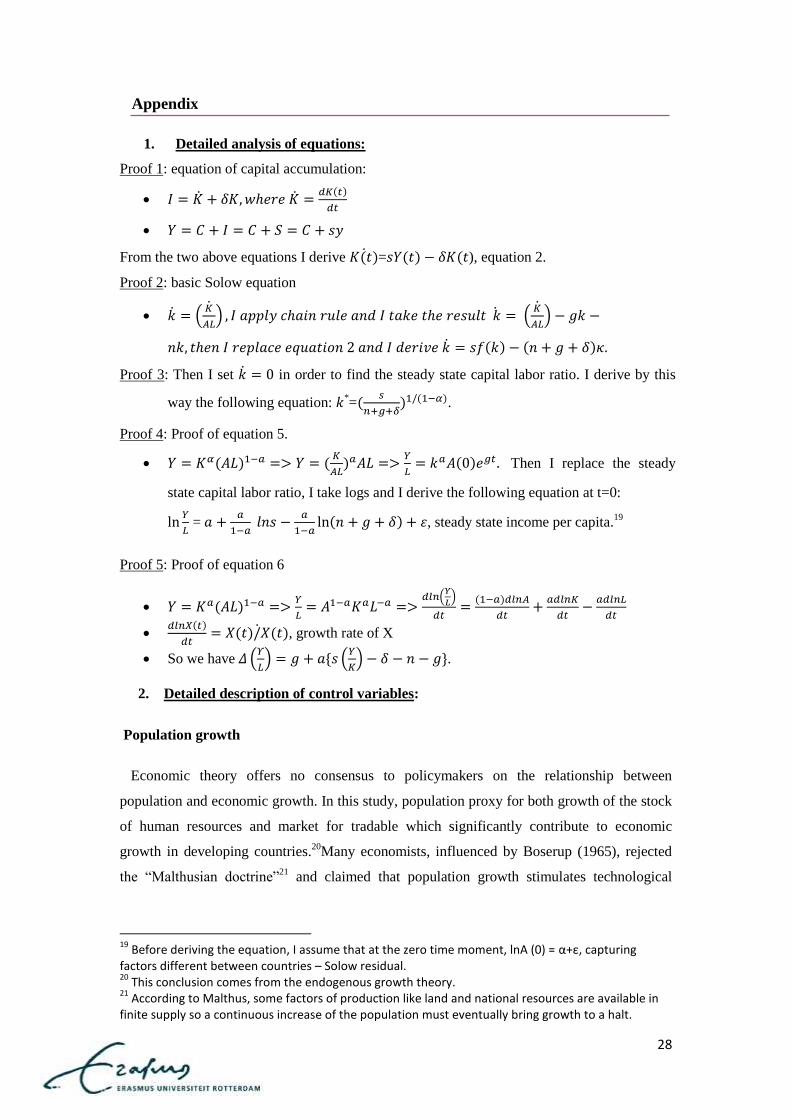
1. Detailed analysis of equations:
Proof 1: equation of capital accumulation:
From the two above equations I derive = ), equation 2.
Proof 2: basic Solow equation
(
)
(
)
Proof 3: Then I set in order to find the steady state capital labor ratio. I derive by this
way the following equation: *=
.
Proof 4: Proof of equation 5.
Then I replace the steady
state capital labor ratio, I take logs and I derive the following equation at t=0:
=
, steady state income per capita.
19
Proof 5: Proof of equation 6
(
)
, growth rate of X
So we have (
) (
) .
2. Detailed description of control variables:
Population growth
Economic theory offers no consensus to policymakers on the relationship between
population and economic growth. In this study, population proxy for both growth of the stock
of human resources and market for tradable which significantly contribute to economic
growth in developing countries.20
Many economists, influenced by Boserup (1965), rejected
the “Malthusian doctrine”21
and claimed that population growth stimulates technological
19
Before deriving the equation, I assume that at the zero time moment, lnA (0) = α+ε, capturing factors different between countries – Solow residual. 20
This conclusion comes from the endogenous growth theory. 21
According to Malthus, some factors of production like land and national resources are available in finite supply so a continuous increase of the population must eventually bring growth to a halt.

29
advancement22
, increases competition, improves investment strategies and achieves economic
growth. In addition to this, a large population expands within and between countries trade. On
the other hand, classical economists support that a rampant population growth would
negatively affect economic growth, by confining the development of savings, foreign
exchanges, capital formation and natural resources, leading to a possible deteriorating GDP
per capita. Some other researchers, however, underpin that there is no causal relationship
between economic and population growth (Blanchet, 1991). The annual population growth
rates of each country have been used in my regression.
Hypothesis 2: Population growth could be beneficial or detrimental to economic growth.
Investments
Among the most fundamental principles in economics is the principle that growth requires
investments. In my research, the investments variable includes local investments. According
to Adhikary (2011), domestic investments create new job opportunities by enlarging the
production bases, additional employment provokes higher savings which induce even more
investments; and this chain effect positively influences growth. However, Kendrick (1993)
claims that domestic investments alone do not cause growth, but the efficiency in allocating
capital from less to more productive sectors, is what leads to economic prosperity. Overall,
investments enhance the quality and quantity of human capital by enlarging local capacity in
terms of physical infrastructures and social amenities. This can increase the level of
productivity in the economy. I measure the impact of investments on a country’s economic
growth, by using gross capital formation (formerly gross domestic investment) as a share of
GDP.
Hypothesis 3: Investment is expected to positively and significantly contribute to economic
growth.
Inflation
It is widely accepted that a stable macroeconomic framework is necessary though not
sufficient for sustainable economic growth. Rapid output growth and low inflation are two of
the most common objectives of macroeconomic policy. A host of recent long run evidence
indicates that inflation causes a negative long run effect on economic growth (Gillman et al.,
2004, Fountas et al., 2006). According to Hodge (2005), inflation decreases output growth,
savings and the quality of investment, by reducing real interest rates, and results in a
22
This happens, since a growing country would have more people to rely on for innovative ideas.
30
misallocation of resources in market economies.23
Additionally, inflation negatively affects a
country’s international competiveness, undermines its export performance, by making exports
more expensive abroad, and discourages FDI. Macroeconomic stability and a business
environment without fluctuations are crucial factors in the decisions of foreign investors.
Nevertheless, many studies acknowledge that a low and positive inflation rate may help the
economy to adjust to real shocks if nominal wages and prices show downward rigidity.
Akerlof et al. (1996) support that a certain amount of inflation is “good” for economic
growth. To sum up, I use the GDP deflator as a proxy for macroeconomic stability which is a
key prerequisite to get the maximum gains from trade liberalization. Macroeconomic stability,
specifically defined as low inflation, is positively related to economic growth.
Hypothesis 4: High level of inflation has a negative and statistically significant impact on a
country’s economic growth.
Domestic credit
Domestic credit provided by the banking sector (% of GDP) includes all the credit to
various sectors on a gross basis, except for the credit to the central government, which is net.
24 In simple terms, it is the financial support that is offered to the private sector as an engine
of economic growth. The banking sector includes monetary authorities and deposit money
banks as well as other institutions. Early economists such as Schumpeter in 1911 identified
the bank’s role in facilitating technological innovation through their intermediary role.
Banking sector openness can directly increase economic growth by improving the quality of
financial services or by increasing funds available and indirectly by enhancing the efficiency
of financial intermediaries. Slow growth of investments in many developing countries can be
attributed to the absence of affordable credit to finance their expansion. Therefore, policies
that develop the financial sector would be expected to raise economic growth.
Hypothesis 5: Hence, I expect a positive value of the domestic credit’s coefficient.
Industry
This is the industrial share of GDP that comprises value added in mining, manufacturing,
construction, electricity and gas25
and is used to proxy for industrialization process and
technological capacity or depth in developing countries. The theoretical and empirical
literature regarding the openness of trade, industrial sector and economic growth, has a
23
Real resources are consumed in seeking protection or to gain advantage from high inflation and as a result they are diverted from their optimal use. 24
The source of definition: World Data Bank indicators (WDI,2008). 25
The source of definition: World Data Bank indicators (WDI,2008).

31
number of contributions by recent development economists. According to Ellahi et al. (2011),
an open trade regime causes high competition in world market which makes firms to follow
and engage in modern technologies and further augments efficiency resulting in growth. It is a
well admitted fact that along with trade variables, industrial value added works as an impetus
affecting economic growth positively.
Hypothesis 6: Industrialization is expected to be positively correlated with economic growth.
3. Statistical description of variables:
GDPpc gr. D(TO) POP gr. D(INV) D(INF.) D(D.CR.) D(IND) D(lnGDPpc)
Mean 1.57 1.13 1.97 0.13 -11 -0.2 -0.01 0.03
Median 1.9 0.96 2.07 0.23 -0.31 0.1 -0.002 0.04
Maximum 37.12 91.37 11.18 19.90 390 198 22.7 0.55
Minimum -47.28 -71.3 -7.53 -27.8 -6456 -125 -51.3 -0.97
St. deviation 4.72 9.66 1.18 3.9 294 13.6 2.99 0.14
Skewness -0.9 1.17 -0.36 -0.44 -11.19 1.25 -4.18 -1.41
Kurtosis 17.89 21.12 16.7 8.57 287 67.4 86.8 9.84
Observations 1136 1132 1136 1132 1136 1127 1090 1063
4. List of my sample countries: (classified by World Databank)
Argentina Malaysia
Bahrain Mali Bangladesh Mexico Benin Mongolia Bolivia Morocco Botswana Mozambique Brazil Namibia Bulgaria Nicaragua B. Faso Niger Burundi Oman Cameroon Pakistan Cape Verde Panama Central Afr. Rep. Papua Chad Paraguay Chile Peru Colombia Philippines Comoros Romania Costa Rica Rwanda

32
Dominique Rep. Saudi Arabia Ecuador Senegal Egypt Sierra Leone El-Salvador South Africa Ethiopia Sri-Lanka Fiji Sudan Gabon Swaziland Ghana Syria Guatemala Tanzania Guyana Thailand Honduras Togo India Tunisia Indonesia Turkey Jordan Uruguay Kenya Venezuela Lesotho Zambia Madagascar Zimbabwe Malawi
5. List of SSA countries
Benin Malawi
Botswana Mali B. Faso Mozambique Burundi Namibia Cameroon Niger Cape Verde Rwanda Central Afr. Republic Senegal Chad Sierra Leone Comoros South Africa Ethiopia Sudan Gabon Swaziland Ghana Tanzania Kenya Togo Lesotho Zambia Madagascar Zimbabwe