The Impact of the Shared Property Tax System on the ...
34
Capstone Project Fall 2012 The Impact of the Shared Property Tax System on the Localities’ Fiscal Capacity Faculty Advisor: Dr. Dwight Denison Sun Ki Kwon Martin School of Public Policy and Administration University of Kentucky
Transcript of The Impact of the Shared Property Tax System on the ...

Capstone Project
Fall 2012
The Impact of
the Shared Property Tax System
on the Localities’ Fiscal Capacity
Faculty Advisor: Dr. Dwight Denison
Sun Ki Kwon
Martin School of Public Policy and Administration
University of Kentucky
1
TABLE OF CONTENTS
Executive Summary ------------------------------------------------------------------------- 2
Background ------------------------------------------------------------------------------- 3
Property Tax in Seoul ------------------------------------------------------- 4
Fiscal Disparities in Seoul ------------------------------------------------------- 5
Definitions ------------------------------------------------------------------------- 7
Literature Review -------------------------------------------------------------------------- 9
Overview of Tax Base Sharing System in the United States --------------- 9
Twin Cities, Minnesota ---------------------------------------------------------- 11
The Shared Property Tax System in Seoul ----------------------------------- 15
Research Design -------------------------------------------------------------------------- 16
Data ------------------------------------------------------------------------------- 16
Methodology -------------------------------------------------------------------- 17
Results -------------------------------------------------------------------------------------- 20
Conclusion -------------------------------------------------------------------------------- 24
References -------------------------------------------------------------------------------- 26
Appendices ------------------------------------------------------------------------------- 29

2
Executive Summary
Seoul Metropolitan Government (SMG), South Korea, introduced the Shared
Property Tax System in 2008 in order to mitigate fiscal disparities among twenty five
autonomous districts located in its jurisdiction. The new program, introduced at the end
of a long controversy, was influenced by St. Paul-Minneapolis (Twin Cities)
Metropolitan Area Fiscal Disparities Program in Minnesota.
I examine two questions in my capstone project: (1) whether the program has
increased fiscal capacity1 of each district over the last five years as policy makers
expected, and (2) whether the program of the SMG has contributed to relieve fiscal
disparities among localities.
To examine the research questions, I utilized the Standard Financial Needs
Satisfaction Index (SNFSI)2, based upon the amount of property tax collections of
twenty five localities and the impact over ten years from FY2003 to FY2012, measuring
the program five years before and after introduction of the program, in order to assess
the outcomes of the program. The data were collected from the Budget Office, the
Administration Bureau, and the Finance Bureau of SMG via its official website or
personal contact with officials in charge. I used Ordinary Least Squares (OLS) model.
In the model, dependent variables are absolute values of the Z-scores of SFNSI and
property tax revenue of each district in each year and explanatory variables are program,
population, and total general fund.
The results of my analysis indicate that the differences in amounts of property
tax collections between twenty five localities have been reduced since the program was
introduced in 2008. In addition, the index of financial capacity, SFNSI, was improved
in poorer localities over the duration of the study. In respect to wealthier localities, net
contributors to the pool sources, the SFNSIs have decreased by a minimal amount.
1 The ability of a district government to finance resources for its spending for public services. 2 An administrative term used by the Seoul Metropolitan Government. It is used to measure localities’ financial capacity in performing basic administration.

3
Background
There are twenty five autonomous districts in the Seoul metropolitan area and
each district has a different size of jurisdiction area, population, fiscal capacity, and
political background. One of the most important financial issues of Seoul has been the
fiscal disparities among the districts (see Figure 1). The fiscal gaps have increased and
exacerbated fiscal problems in the poorer districts due to the constituents’ demand for
social welfare services.
Figure1. Local Tax Collection per capita in Seoul, 2006
Source: The Seoul Institute (2007, p.97)
A financial imbalance causes inequality in welfare and public service and
promotes an atmosphere of social disharmony between wealthy and poor regional
residents in Seoul. This impedes balanced regional development. Due to this disparity,
the city government is actively searching for remedies to promote equality in regional

4
development. One such proposed solution in the debate surrounding this issue was a
swap of tax items between taxing authorities, Seoul city, and district governments,
thereby creating a tax sharing system over a property tax, which has been present since
2006 (Lee 2012).
Seoul city government has acted continuously to eliminate or mitigate this gap
and keep the balance across the districts in its jurisdiction. This is because the city
government is responsible for providing quality public goods and services for its
citizenry regardless of their residential locations. Furthermore, the city government has
authority and accountability to adjust the fiscal status of autonomous districts by using
intergovernmental grants or special subsidies.
Property Tax in Seoul
In South Korea, property tax has traditionally been a local tax and the levy
authority of this tax belongs to only district governments, which is the lowest level of a
three-tier governmental system of the country. Even though the Korean Constitution
authorizes local governments to impose property tax, it also states that tax rates must be
prescribed through law enacted by National Assembly. Therefore, in South Korea, all
local taxes are controlled by laws enacted by the National Assembly and most of the
laws are equally applied across the country (Park, 2007).
Property tax is levied on the real estate, land, buildings, airplanes, and vessels.
Tax rates vary depending on taxable items and assessed values. As with most other
countries, the property tax is a primary source of revenue for the district governments in

5
Seoul. In the 2012 fiscal year3, the property tax revenues of all twenty five districts
totaled 1.673 trillion Korean Won (KRW)4 and accounted for 83.1 percent of tax
revenues and 21.8 percent of total general funds of all district governments.
Table1 the Components of Twenty Five-District Governments Revenues (FY2012)
(In billions, KRW)
Own Resources Intergovernmental Transfers Total
District taxes Non-Tax Revenue
Subtotal National
Government Seoul City
Government Subtotal
Property taxOther taxes
Subtotal (%)
(%) (%) (%) (%) (%) (%) (%) (%)
1,673 339 2,012 1,515 3,527 1,283 2,851 4,134 7,661
21.8% 4.4% 26.3% 19.8% 46.0% 16.7% 37.2% 54.0% 100.0%
Source: The Budget Office of Seoul Metropolitan Government (2012)
Fiscal Disparities in Seoul
Roy Bahl (1994) explains the concept of the metropolitan fiscal disparities as
“resource-requirements gap between revenues, including own sources, federal aid, and
state aid, and expenditures required to produce a ‘standard’ package of local public
services.” He explains that each level of government should play a role in achieving the
financial balance among the central cities and the other regions in the metropolitan area.
Previously, there had been a large property tax receipts gap among districts of
the city of Seoul before the introduction of the Shared Property Tax System in 2008
3 The fiscal year starts on January 1 and ends December 31 in South Korea. 4 The exchange rate of Korean won against USD is 1,087 KRW (Nov. 8, 2012). When it is converted into the USD, becomes 1.539 billion dollars.

6
(see Table 2). For example, the ratio of the annual amount of property tax receipts of the
richest Gangnam-gu district to the poorest Gangbuk-gu district was 15-1 in fiscal year
2007.
Table 2 Budget of District Governments Fiscal Year 2007
(In millions, KRW, except Budget per capita)
Average Highest Lowest
Budget 213,686 369,440 166,580
(General Funds) Gangnam-gu Geumcheon-gu
Budget/capita (in thousands, KRW)
525 1,577 384
Jung-gu Gwanak-gu
Standard Financial Needs 58.10% 197.90% 26.50%
Satisfaction Index Gangnam-gu Jungrang-gu
Financial Independence 50.50% 90.50% 28.30%
Degree Seocho-gu Gwanak-gu
Local Tax Receipts 62,136 301,425 18,304
Gangnam-gu Gangbuk-gu
Property Tax Receipts 52,593 252,484 16,984 Gangnam-gu Gangbuk-gu
Source: the Budget Office of SMG (2007)
In this sense, even though Seoul is divided into twenty five autonomous
districts, Seoul city government has supervising authority in administrative affairs
delegated to the district governments. This, in turn, places responsibility on the city
government in sharing the financial burden in the other affairs such as a free school
meal program. Moreover, Seoul city government is responsible for balanced
development and equal benefits for its citizens’ welfare regardless of their regional
districts in its metropolitan area.

7
Definitions
Standard Financial Needs Satisfaction Index (SFNSI)
The SFNSI is a measure of the fiscal power of twenty five autonomous districts
and estimated by Seoul City Government according to the Seoul Metropolitan
Government (SMG) Ordinance on Adjustment of Local Governments’ Financial
Resources. The standard financial needs of each locality are calculated by measuring
twenty one factors. The SMG uses the SFNSI as an indicator for determining the
amount of subsidies for all localities in Seoul every year.
The index is computed using the following formula:
SFNSI = Revenue for Standard Financial Needs5 ´ 100 Expenditure for Standard Financial Needs6
Shared Property Tax System of Seoul City Government
The Shared Property Taxation System was introduced in 2008 after vigorous
political dispute between wealthy and poor districts. Seoul City Government collects 50
percent of property tax revenue amassed by all the district governments and the accrued
tax revenues pooled into a single fund. In other words, the city government and a single
district government share property tax revenue equally, 50 percent respectively. Then
the city government equally redistributes the pool to twenty five district governments.
5 It includes 1) own resources, tax and non-tax revenues, 2) local subsidy from national government, and
3) local fiscal compensations from the SMG. 6 It calculated by twenty one measurements including population, aging population, the number of infants and preschoolers, road size, the number of civil servants, the number local council members, low-income families, and so forth

8
The redistributed tax revenue is regarded as its own revenue by the Local Tax Act,
which is determined by the following formula
A locality i’s Share = ∑Di 25
- ∑Di = The pool, sum of property tax revenue collected from 25 districts. The contributed
ratio of each district is 50 percent.
This system was enacted through the amendment of the Local Tax Act by the
National Assembly and it applies solely to the Seoul Metropolitan area. This act differs
from the norm in Korean law as it only applies to a specific set of districts, where the
majority of legislative mandates are implemented nationally.

9
Literature Review
There is a significant amount of literature on a tax base sharing and fiscal
disparities among urban areas but the following is an overview of the system in the
United States and a summary of a specific case in the state of Minnesota. This literature
review concentrates on the Minnesota and Seoul cases as they are representative of
property tax base examples while other cases in the literature discuss a sales tax base.
Overview of Tax Base Sharing System in the United States
There are only two areas in the United States, the Twin Cities of Minnesota and
the Meadowlands of New Jersey, where a large-scale property tax base sharing has been
enacted (New York State Commission, 2008). In the other models, some local
governments levy other taxes besides the property tax, such as sales or income taxes.
Table 3 provides a summary of models of sharing revenue system in the United States.
There are two main goals that the policy makers intend to accomplish from the
tax base sharing systems: 1) to increase equity between wealthy and poor communities
in the distribution of fiscal resources; and 2) to diminish inter-municipal competition for
economic development by promoting a higher degree of regional coordination for land
use and infrastructure planning. (OPM, CT, 2010, p.9)

10
Table 3 Summary of Models of Regional Revenue Sharing7
Hackensack Meadowlands, NJ
Twin Cities, MN
Montgomery County, OH
Monroe County, NY
Purpose
To compensate municipalities for impacts of land use decisions
To reduce fiscal disparities
To reduce fiscal disparities
To reduce fiscal disparities
Funding Sources
Fourteen member municipalities contribute 40% of their post-1970 baseline share of property taxes to a common pool
40% of the increase in Commercial-Industrial property assessment goes into a pool
Increased sales tax by 0.5% for economic development and county-wide growth contribution rate for government equity
4% local sales tax
Funding Distribution
Each municipality receives compensation for its share of school students and its percentage of land relative to the region‘s total, while a stabilization factor caps annual fluctuations at 5%
Based on formula that takes into consideration the jurisdiction‘s population and fiscal capacity
70% from tax increase earmarked for economic development; Government equity funds are distributed
Approximately 50% to city; 25% to county; remaining 25% distributed by formula to city, towns, villages and suburban
Source: the Office of Policy and Management, CT (2010, p.10)
7 The table is cited from “ A Review of Regional Tax-Based Revenue Sharing Programs and the
Establishment of Regional Asset Districts” http://www.ct.gov/opm/lib/opm/igp/org/final_rrs-rad_report_7-13-10.pdf
11
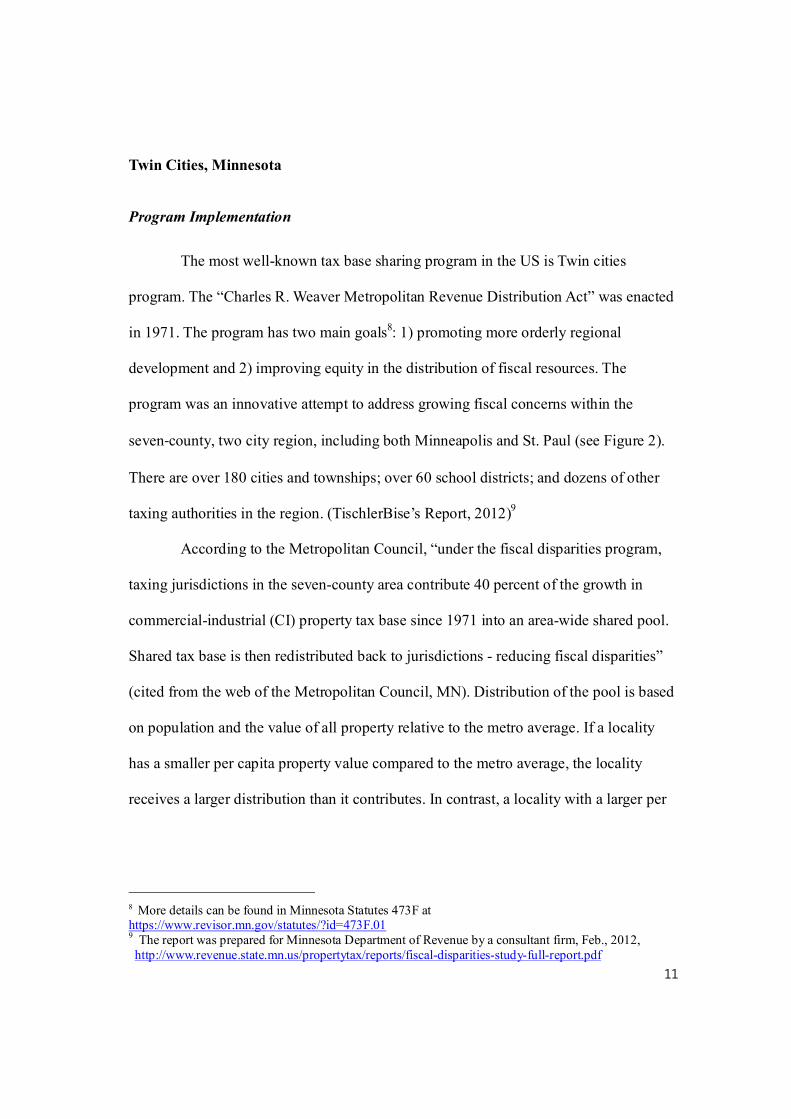
Twin Cities, Minnesota
Program Implementation
The most well-known tax base sharing program in the US is Twin cities
program. The “Charles R. Weaver Metropolitan Revenue Distribution Act” was enacted
in 1971. The program has two main goals8: 1) promoting more orderly regional
development and 2) improving equity in the distribution of fiscal resources. The
program was an innovative attempt to address growing fiscal concerns within the
seven‐county, two city region, including both Minneapolis and St. Paul (see Figure 2).
There are over 180 cities and townships; over 60 school districts; and dozens of other
taxing authorities in the region. (TischlerBise’s Report, 2012)9
According to the Metropolitan Council, “under the fiscal disparities program,
taxing jurisdictions in the seven-county area contribute 40 percent of the growth in
commercial-industrial (CI) property tax base since 1971 into an area-wide shared pool.
Shared tax base is then redistributed back to jurisdictions - reducing fiscal disparities”
(cited from the web of the Metropolitan Council, MN). Distribution of the pool is based
on population and the value of all property relative to the metro average. If a locality
has a smaller per capita property value compared to the metro average, the locality
receives a larger distribution than it contributes. In contrast, a locality with a larger per
8 More details can be found in Minnesota Statutes 473F at https://www.revisor.mn.gov/statutes/?id=473F.01 9 The report was prepared for Minnesota Department of Revenue by a consultant firm, Feb., 2012, http://www.revenue.state.mn.us/propertytax/reports/fiscal-disparities-study-full-report.pdf

12
capita property value compared to the average, receives a smaller distribution from the
pool (cited from the web of the Metropolitan Council, MN).10
Figure 2 Fiscal Disparities Geographic Area: Seven-County Twin Cities
Metropolitan Area
Source: the House Research Department, MN (2005, p.3)
All of taxing the authorities in Twin Cities contributes 40 percent of growth in
CI property tax base in each year, compared to year the baseline year of 1971. “The
growth in CI value is defined as the change in net tax capacity since 1971 including new
construction, inflation, demolition, revaluation, appreciation, and depreciation. CI
property includes all businesses, offices, stores, factories etc, as well as personal
property” (Buhrer, et al., 2007).
10 The Metropolitan Council, MN, http://www.metrocouncil.org/metroarea/FiscalDisparities/index.html

13
Impact and Evaluation of the Program
According to The Metropolitan Council (2012), shared tax base totaled $390
million for taxes payable in 2012 and denoted 37.3 percent of the total CI tax base. The
reported base indicates that the shared percent of CI tax base has increased from 6.7
percent in 1975 and the total tax base is up 12 percent from 2.1 percent in 1975.
Figure 3 indicates changes in shared tax base. Each line shows percentage
shares of metro area CI tax base and total tax base from 1975 to 2012.11
Figure 3 Fiscal Disparities Shared Tax Base in Twin Cities
– Taxes Payable 1975-2012
Source: Cited from the Metropolitan Council, MN (2012, p.11).
11 Cited from “ Fiscal Disparities in the Twin Cities” (Metropolitan Council, Oct. 2012,p10-11)” at http://www.metrocouncil.org/metroarea/FiscalDisparities/FDInfo.pdf

14
When it comes to the result of redistribution of the shared area-wide pool of tax
base, 113 jurisdictions receive more tax base than they contribute. And 63 communities
contribute more tax base than they take back. For communities with population greater
than 10,000, the ratio of highest to lowest CI tax base is narrowed from 10 to 1 without
the program, to 3 to 1 with program in 2012 (the Metropolitan council, 2012).
In an early stage of the program, the Twin cities program was evaluated (Fisher,
1982) as to whether it had accomplished its goal of improving regional efficiency;
through this evaluation it was determined that the overarching goal was not achieved
across the jurisdictions. The author highlights that “the Twin cities formula produces
results that are weak in aspect of effective overall redistribution and that contain lots of
anomalies. In some suburbs with wealthiest in terms of taxable property gain even more
tax base, while some communities relatively poor in terms of fiscal resources are
required to contribute part of those resources to the pool.”
On the other hand, Orfield (1999) argues that the Twin cities program “creates
greater regional equity among cities and counties in the provision of public services,
while preserving local autonomy.” He also cites that the program fosters balanced
regional localities due to its broad design, imposes property tax on CI at a consistent
regional rate, and allows for the narrowing of business tax-rate disparities among
municipalities (Orfield, 2007).

15
The Shared Property Taxation System in Seoul
There have been many studies and debates over the change of the local taxation
system among scholars and/or local governments. Those studies examined various
alternatives. One of the alternatives is that a tax is not influenced by regional wealth,
e.g., tobacco consumption tax, should be turned to district tax whereas a property tax
should be turned to metropolitan tax. Another alternative is property tax sharing (Choi,
2011).
In terms of the effect of the shared property tax system, Choi, et al., (2009)
maintain that the system has not accomplished its goal in diminishing fiscal disparities
among localities. The authors assert that because the system has an equal distribution
system, it cannot reflect both the difference in autonomous revenues and the cost
differentials of public service provisions among districts.
Different from Choi, et al., (2009) analysis, Choi (2011) observes that before
the introduction of the shared tax system in terms of property tax revenues accrued by
municipalities, the ratio of the wealthiest Gangnam-gu to the poorest Gangbuk-gu was
17.1 to 1. However, after the introduction of the shared tax system, the ratio has
narrowed to 6.0 to 1, showing some improvement. The ratio subsequently has continued
to narrow as indicated by 5.7 to 1 in 2009 and 4.7 to 1 in 2010, indicating that the fiscal
revenue imbalances among the localities has been significantly mitigated by this
program (Choi 2011).

16
Research Design
The null hypothesis (H0) is that the shared property tax system in Seoul has
no effect on the district governments’ fiscal capacity and the alternative hypothesis (H1)
is that the system has an effect on the district governments’ fiscal capacity. To test the
null hypotheses, I analyzed ten years of budget data and property tax revenues of the
twenty five districts of the Seoul metropolitan area from 2003 to 2012.
H0 = the shared property tax system has no effect on the district
governments’ fiscal capacity.
H1 = the shared property tax system effect on the district governments’ fiscal
capacity.
Data
I collected data from the Budget Office and the Bureau of Finance of the
Seoul Metropolitan Government (SMG) via the official website of the SMG.12 This
data set includes information on each district government’s characteristics, the
corresponding property tax revenue, SFNSI, etc., from 2003 to 2012. The data were
organized by district and year (25 districts over ten years) totaling 250 observations per
variable. Table Four explains the definitions and summary statistics of the dependent
and explanatory variables (p. 22).
12 http://finance.seoul.go.kr/

17
Methodology
In a number of previous studies, researchers employed coefficient of variation
and equalization index for an analysis determining the effect of revenues which are
influenced by a financial policy. In my research, I use coefficients of variation and an
OLS regression model to understand the relationship between and impact of the shared
property tax system on the localities’ public finance.
First, I calculated the coefficients of variation (CV) of the Standard Financial
Needs Satisfaction Index (SFNSI) and the property tax revenues to examine trends for
ten years by using the following formula.
Coefficient of Variation (CV):
CV = t
σt
- Where:
- t is an average of SNFSI or property tax revenue of all districts in each year
- σt is a standard deviation of SNFSI or property tax revenue of all districts each
year
Second, I employed a pooled regression model to measure the impact of the
shared tax program, especially the financial equalization of the district governments. To
do so, I generated two sets of Z-scores based upon the SFNSI and total property tax
revenue of each district in each year. I used the absolute values of the Z-scores as
dependent variables in two regression models outlined below.
|Z|-score:
|Zit| = |( it- t)|
σt
- |Z|-score is absolute value of Z-score of district i in year t.

18
- is a SFNSI or total property tax revenue of district i in year t.
- t is an average of 25 districts’ SFNSI or total property tax revenue in year t.
- σt is a standard deviation of SFNSI or total property tax revenue of 25 districts in year t.
When I used the intact Z-scores, they had negative or positive values, offsetting
each other and I could not measure exactly how far the variables were spread from the
mean. In other words, all that is necessary for data analysis is how the data are spread
from the mean in a distribution chart. If an absolute Z-score is large, it means that data
are spread wider from the mean and it implies increased fiscal disparity. Similarly, if the
Z-score is small, the gap of the data is also small. Therefore, I can estimate whether
fiscal disparities among districts are reduced or not by using an absolute Z-score.
I set the pooled regression model as follows:
Model 1) Y1= β0 + β1X1 + β2X2 +β3X3 + ɛ
Model 2) Y2= β0 + β1X1 + β2X2 +β3X3 + ɛ
Where:
- Y1= The absolute values of Z score of SFNSI
- Y2 = The absolute values of Z score of property tax revenue
- X1= Program dummy determined 1 or 0 by the program implemented or not
- X2 = Population of the district
- X3= Total general fund of the district
Finally, I generated five interactions for further analysis. Through the pooled
regression model, the average impact of the program can be determined based upon the
fiscal capacity during the last five years. In addition, I examine the yearly impact of the
shared property tax system.
19
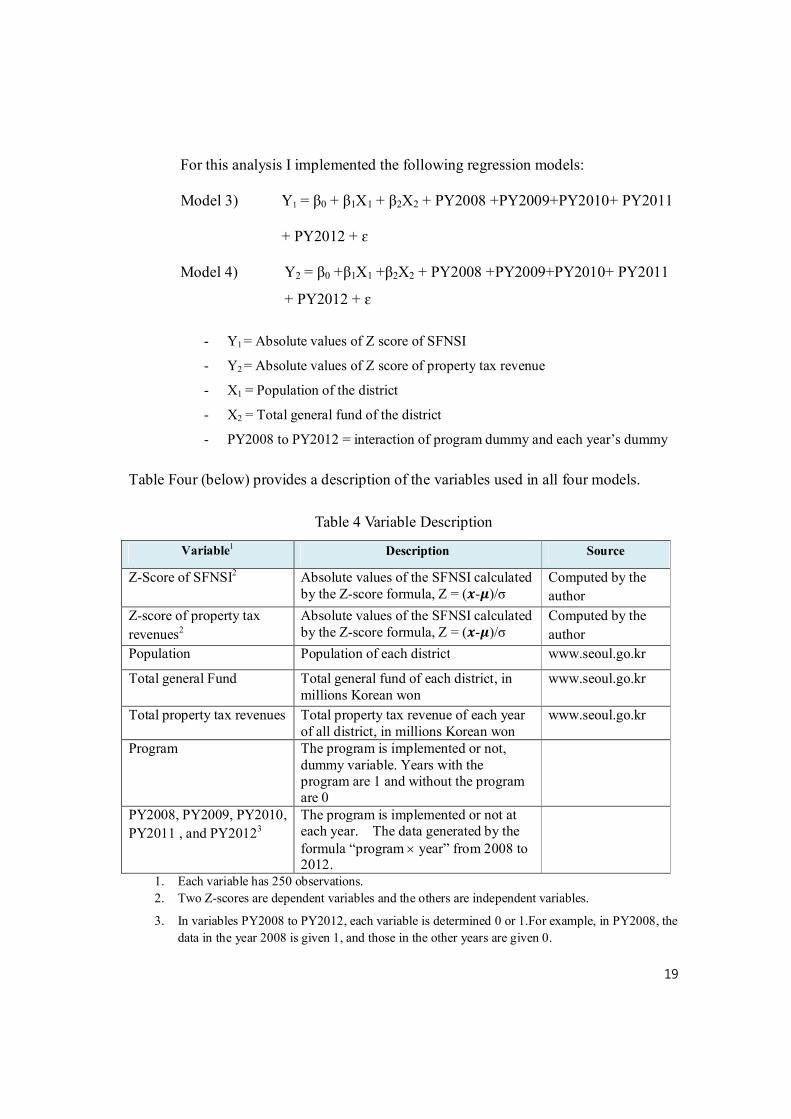
For this analysis I implemented the following regression models:
Model 3) Y1 = β0 + β1X1 + β2X2 + PY2008 +PY2009+PY2010+ PY2011
+ PY2012 + ɛ
Model 4) Y2 = β0 +β1X1 +β2X2 + PY2008 +PY2009+PY2010+ PY2011
+ PY2012 + ɛ
- Y1 = Absolute values of Z score of SFNSI
- Y2 = Absolute values of Z score of property tax revenue
- X1 = Population of the district
- X2 = Total general fund of the district
- PY2008 to PY2012 = interaction of program dummy and each year’s dummy
Table Four (below) provides a description of the variables used in all four models.
Table 4 Variable Description
Variable1 Description Source
Z-Score of SFNSI2 Absolute values of the SFNSI calculated by the Z-score formula, Z = ( - )/σ
Computed by the
author
Z-score of property tax
revenues2
Absolute values of the SFNSI calculated by the Z-score formula, Z = ( - )/σ
Computed by the
author
Population Population of each district www.seoul.go.kr
Total general Fund Total general fund of each district, in millions Korean won
www.seoul.go.kr
Total property tax revenues Total property tax revenue of each year of all district, in millions Korean won
www.seoul.go.kr
Program The program is implemented or not, dummy variable. Years with the program are 1 and without the program are 0
PY2008, PY2009, PY2010,
PY2011 , and PY20123
The program is implemented or not at each year. The data generated by the formula “program ´ year” from 2008 to 2012.
1. Each variable has 250 observations.
2. Two Z-scores are dependent variables and the others are independent variables.
3. In variables PY2008 to PY2012, each variable is determined 0 or 1.For example, in PY2008, the
data in the year 2008 is given 1, and those in the other years are given 0.

20
Results
Table Five provides the summary statistics of SFNSI through the trends of the
change of data, mean, min, and max of SFNSI during last 10 years. From fiscal year
2008, the year of program implementation, the mean and min increase somewhat and
the CV has decreased.
Table 5: Summary Statistics of Standard Financial Needs Satisfaction Index (SFNSI)
2003 2004 2005 2006 2007 2008 2009 2010 2011 2012
Mean (%) 58.3 64.0 63.5 59.4 56.7 74.3 77.2 70.8 68.9 65.9
Min (%) 30.8 32.9 30.8 26.3 26.5 42.3 48.6 45.3 49.2 39.7
Max (%) 191.1 237.2 252.4 196.6 197.9 223.4 224.0 176.7 143.3 173.6
Coefficient of Variation
0.67 0.76 0.80 0.70 0.70 0.57 0.51 0.45 0.32 0.43
Standard Deviation
39.2 48.6 51.1 41.4 39.8 42.1 39.4 31.9 22.0 28.2
Figure 4 is a visual presentation of the statistics outlined in Table Five,
illustrating the degree to which the gap between max and min has been reduced after
2008.
Figure 4: Time Trends of the Mean, Min and Max of SFNSI (percent: %)

21
Table 6 provides the property tax revenue statistics. In these statistics, the
increasing means are not statistically significant because these values are influenced by
other variables including rise the value of taxable items. However, the decrease of the
CV implies that a reduction of fiscal disparities among the localities has occurred since
2008.
Table 6 Summary Statistics of Property Tax Revenue (In billions, KRW)
2003 2004 2005 2006 2007 2008 2009 2010 2011 2012
Mean 31 41 37 42 53 63 61 64 67 70
Min 13 15 14 15 17 36 39 41 43 46
Max 131 184 183 192 252 221 188 200 202 207
Coefficient of Variation
0.87 0.91 0.96 0.91 0.99 0.65 0.52 0.54 0.52 0.50
Standard Deviation
27 37 36 38 52 41 32 34 34 35
Note: Data showing from 2003 to 2011 are accrued tax revenues, 2012 is levied amount in September
2012.
Like SFNSI, in property tax revenue, the intervals between the maximum and
minimum values, along with the mean and minimum have been reduced since 2008.
Figure 5 Trends of Mean, Min and Max of Property Tax Revenue (in billions)

22
Most previous researchers use CV or a population weighted CV to measure
fiscal disparities or regional inequality. The CV of SFNSI was calculated along this best
practice along with the property tax revenues over 10 years. Although Tables 5 and 6
already numerically list the resulting summary statistics, I review them through Figure 6,
which shows that the CV has been decreased since 2008.
Figure 6 Coefficient of Variation of SFNSI and Property Revenue
Table 7 shows that the program has a significant influence on the SFNSI
dispersion based upon regression model one. In other words, the program narro
ws the intervals of the SFNSI between the twenty-five districts, which can be de
termined by measuring the distance of the z-scores close up from the mean on t
he dispersion graph. Therefore, the program variable is statistically significant at
a 0.01 level of significance.

23
In my regression models, I employ population and total general fund as
independent variables. This is because these two particular variables may endogenously
influence the dependent variables. To control for this, two additional variables were
employed in the model to control for this. Table 7 and Table 8 show the program
impacts on improving fiscal equalization among district governments.
Table 7 Results of Model 1 and Model 2
Dependent
Variable : 1)Absolute values of Z score of the Standard Financial Needs Satisfaction Index
2)Absolute values of Z score of the
property tax revenue
Independent
Variable Coefficient t Score p value Coefficient t Score p value
Program -.969*** -10.05 0.000 -.944*** -8.65 0.000
Population -.00000224*** -6.80 0.000 -.00000078** -2.11 0.036
Total general Fund
.00000931*** 13.72 0.000 .00000887*** 11.55 0.000
Constant -.4826496 -3.46 0.001 -1.043 -6.61 0.000
Observations 250 250
R-squared 0.437 0.404
Adj R-squared 0.430 0.397
***Significant at the 0.01 level, **Significant at the 0.05 level, and *Significant at the 0.1 level.
Finally, Table 8 displays the results of the regression analyses using Models
Three and Four, which indicate the impact of the program each year since its
introduction. The coefficients seem to reach a peak at PY2009 and then decline after
that point. The results imply that overall, the program has mitigated fiscal disparities
among the districts but it has been decreasing gradually over time. However, it has been
declined gradually from 2010.

24
Table 8 Results of Model 3 and Model 4
Dependent
Variable :
3) Absolute values of Z score of the Standard Financial Needs Satisfaction Index
4) Absolute values of Z score of the
property tax revenue
Independent
Variable Coefficient t Score p value Coefficient t Score p value
Population -.00000256*** -7.9 0.000 -.00000111*** -2.98 0.000
Total general Fund
.0000104*** -15.03 0.000 .00000997*** 12.57 0.003
PY2008 -.9369056*** -7.40 0.000 -.9150122*** -6.32 0.000
PY2009 -1.521227*** -10.17 0.000 -1.472835*** -8.61 0.000
PY2010 -1.110686*** -8.29 0.000 -1.122728*** -7.32 0.000
PY2011 -.9378667*** -7.36 0.000 -.9443611*** -6.48 0.000
PY2012 -.9079365*** -7.33 0.000 -.8341392*** -5.88 0.000
Constant -.5999811*** -4.40 0.000 -1.160104*** -7.43 0.000
Observations 250 250
R-squared .486 .444
Adj R-squared .471 .428 ***Significant at the 0.01 level, **significant at the 0.05 level, *significant at the 0.1 level.
By the aforementioned results, I reject the null hypothesis that the shared
property tax system in Seoul has no effect on the district governments’ fiscal capacity.
Conclusions
The results of the regression analyses show that the gap of the SFNSI and the
amount of property tax revenue between the richest and poorest localities has narrowed
since 2008. Appendix Two provides an overview of all twenty-five districts,
demonstrating how fiscal power (represented by SFNSI) has increased in most localities
during the last five years. Net contributors are the six richest districts and the remaining

25
19 districts are net recipients (see Appendix 3). Exploring the relationships present in
the four regression analyses employed, it would seem that property tax sharing has
contributed to reducing fiscal disparities among districts and to improving localities’
fiscal power in Seoul metropolitan area, all else constant. This study affords broad
support to previous studies conducted on the topic.
Buhrer, et al., (2007) suggested three policy options in considering the
implementation of a tax base sharing program to achieve the goals of intergovernmental
cooperation. The main idea of the three suggestions is that the “…adoption and
enforcement of a tax base sharing system should be on a statewide basis rather than
local.” In this sense, the Seoul system has a high likelihood of success and stable system
due to the support of national law and a metropolitan government directed policy.
This is not an exhaustive study which includes all resources funded to district
governments. This limitation exists because a district government is funded by various
sources, own revenues (tax and non-tax), and intergovernmental transfers (city and
national government). Moreover, intergovernmental transfers are a very complicated
system so the study was limited to the property tax revenue. In addition, the
methodology behind the collection of the pooled sources and their distribution to the
contributing local governments was not assessed in this study. This is a critical issue to
the program and can be examined in a further professional research. Also, in the present
study, it would seem that additional variables should be included in models three and
four in order to better explain the impact of equalization since 2010 in Seoul.

26
References
Bahl, Roy. (1994). “Metropolitan Fiscal Disparities,” Cityscape, Vol. 1, No 1(Aug.,
1994), pp. 294-296.
http://www.huduser.org/Periodicals/CITYSCPE/VOL1NUM1/ch14.pdf
Buhrer, Scott, Scorsone Eric, Martin, Joseph. (2007). “Intergovernmental Cooperation
in Michigan: A Policy Dialogue White Paper C Tax Base Sharing,” Michigan State University
Cho, Kyeonyeop. (2005). “Tax Policy Analysis Model,” National Assembly Budget
Office. Choi, Byung Ho, Lee, Geun Jae, Choi, Sung Hee, (2009) “The Equalization Effect of
Property Tax Sharing among Autonomous Districts in Seoul,” The Korean
Association for Local Government Studies Vo.13, No.4 (Winter 2009), pp.103-126. Choi, Hangdo. (2011). “The Study on the Fiscal Revenue Balancing Effects of the
Shared Property Taxation System,” Dongguk University.
Fisher, Peter S. (1982). “Regional Tax-Base Sharing: An Analysis and Simulation of
Alternative Approaches’” Land Economics. 1982; 58:497-515. http://www.jstor.org.ezproxy.uky.edu/stable/pdfplus/3145696.pdf?acceptTC=true
Lee, Sejin. (2011). “The Status and Issues of Local Taxes,” National Assembly Budget
Office. Nunn, Samuel and Rosentraub, Mark S., 1996. “Metropolitan Fiscal Equalization:
Distilling Lessons from Four U.S. Programs,” State & Local Government Review, Vol. 28, No. 2 (Spring, 1996), pp. 90-102 http://www.jstor.org.ezproxy.uky.edu/stable/pdfplus/4355148.pdf?acceptTC=true
Orfield, Myron and Wallace, Nicholas. (2007). “The Minnesota Fiscal Disparities Act
Of 1971: The Twin Cities’ Struggle and Blueprint for Regional Cooperation” William Mitchell Law Review, 2007, http://www.wmitchell.edu/lawreview/Volume33/documents/4.Orfield.pdf
Park, Sookhee (2007). “The Impact of the Property Tax Sharing System on Fiscal
Equities among Local Governments In The Seoul Metropolitan Area,” The University of Oregon.
27
https://scholarsbank.uoregon.edu/xmlui/bitstream/handle/1794/4552/Park,%20Sookhee%20terminal%20project.pdf?sequence=1
Reports Hinze, Steve and Baker, Karen, (2005) “Minnesota’s Fiscal Disparities Programs: Twin
Cities Metropolitan Area and Iron Range,” (Jan., 2005), the House Research
Department, MN http://www.house.leg.state.mn.us/hrd/pubs/fiscaldis.pdf
Metropolitan Council, MN, (2012). “Fiscal Disparities: Tax Base Sharing in the Twin
Cities Metropolitan Area”. Retrieved from
http://www.metrocouncil.org/metroarea/FiscalDisparities/index.htm
Ministry of Public Administration and Security (MOPAS). “2010 Annual Report of
Local Tax Administration,” 2011, MOPAS
New York State Commission (2008), 21st Century Local Government, New York State
Commission on Local Government Efficiency & Competitiveness, April, 2008http://www.nyslocalgov.org/pdf/LGEC_Final_Report.pdf?pagemode=bookmarks=pagemode=bookmarks
New York State Commission (2008), “Tax Base Sharing,” New York State Commission
on Local Government Efficiency & Competitiveness, April, 2008 http://www.nyslocalgov.org/pdf/Tax_Base_Sharing.pdf
Orfield, M. 1999. “Grand Rapids Area Metropolitics: Tax-base Sharing in West
Michigan. A Report to the Grand Valley Metropolitan Council”, Metropolitan Area Research Corporation. http://www.gvmc.org/landuse/documents/marc_report.pdf
National Assembly Budget Office (2010), “The long-term plan for Improvement of Real
Estate Tax System,” (2010) National Assembly Budget Office, South Korea
National Assembly Budget Office, “The issue of financial laws that should be
improved,” National Assembly Budget Office, South Korea

28
The Office of Policy and Management, CT, (2010) “A Review of Regional Tax-Based
Revenue Sharing Programs and the Establishment of Regional Asset Districts”,
July 2010 http://www.ct.gov/opm/lib/opm/igp/org/final_rrs-rad_report_7-13-10.pdf
The Seoul Institute (2007), “Thematic Maps of Seoul, 2007 – Economic Activities &
Public Finance” Retrieved from http://www.si.re.kr/eng/seol/inf7/2007_idx.jsp The Tax Policy Center and the New England Public Policy Center (2002), “Measuring Fiscal
Disparities across the U.S. States: A Representative Revenue System/Representative Expenditure System Approach Fiscal Year 2002”. http://www.urban.org/UploadedPDF/311384_fiscal_disparities.pdf
TischlerBise (2012). “Study of the Metropolitan Area Fiscal Disparities Program”, Feb.,
2012, Minnesota Department of Revenue. http://www.revenue.state.mn.us/propertytax/reports/fiscal-disparities-study-full-report.pdf
Seoul Metropolitan Government (SMG). Budget Summary. 2003 – 2012. Budget Office
of SMG. Data sources
http://finance.seoul.go.kr/archives/category/budget/data_budget/data_info_budget-n2 http://finance.seoul.go.kr/files/2012/03/2012_data06.pdf http://www.metrocouncil.org/metroarea/FiscalDisparities/index.htm

29
Appendix 1 Basic Information about the Localities in Seoul
(Dec.31,2011)
District Population The Number of Households
Area
(㎢)
The Number of Public Servants
FY 2012 Budget(in Millions KRW)
2012 FID
2012 SFNSI General
Fund Special Funds
Total
Jongno 168,382 76,688 23.9 1,165 216,717 28,719 245,437 65.7 73.2
Jung 133,193 61,475 10.0 1,211 238,128 26,745 264,873 76.9 121.4
Yongsan 246,501 112,617 21.9 1,174 225,970 28,318 254,288 61.6 74.9
Seongdong 300,711 126,148 16.9 1,176 266,236 14,474 280,709 50.4 59.5
Gwangjin 371,936 158,472 17.1 1,109 255,778 13,329 269,107 37.7 51.0
Dongdaemun 365,486 157,823 14.2 1,223 298,000 32,018 330,018 41.6 56.6
Jungrang 423,706 175,115 18.5 1,179 307,657 17,236 324,893 30.7 49.8
Seongbuk 485,171 199,398 24.6 1,327 343,513 23,624 367,138 33.4 47.5
Gangbuk 345,054 142,527 23.6 1,122 282,582 9,156 291,739 29.6 48.2
Dobong 365,573 139,348 20.7 1,078 266,153 5,840 271,993 30.1 47.4
Nowon 603,930 225,104 35.4 1,311 422,300 12,173 434,474 22.7 39.7
Eunpyeong 493,634 197,582 29.7 1,197 340,000 11,616 351,616 30.9 51.3
Seodaemun 314,852 134,730 17.6 1,178 266,000 9,059 275,059 40.8 53.2
Mapo 389,493 168,640 23.8 1,260 279,281 51,550 330,832 49.1 65.8
Yangcheon 500,210 182,677 17.4 1,209 332,004 16,621 348,625 39.0 51.6
Gangseo 569,072 223,490 41.4 1,313 391,059 23,421 414,480 33.1 56.1
Guro 427,468 171,064 20.1 1,173 311,198 9,127 320,325 36.8 51.6
Geumcheon 243,438 103,600 13.0 1,064 242,454 8,614 251,067 42.2 61.8
Yeongdeungpo 397,443 168,850 24.6 1,283 299,600 32,745 332,345 56.2 73.1
Dongjak 401,408 167,099 16.4 1,213 274,871 10,727 285,598 44.4 60.0
Gwanak 526,397 246,979 29.6 1,293 333,536 18,589 352,125 34.0 49.8
Seocho 433,564 168,988 47.0 1,295 278,550 44,402 322,951 81.5 91.0
Gangnam 565,710 231,983 39.5 1,400 504,426 58,566 562,992 80.5 173.6
Songpa 682,209 261,963 33.9 1,400 381,517 39,293 420,810 63.3 77.8
Gangdong 495,138 190,392 24.6 1,192 303,467 26,177 329,643 44.2 60.8
Total 10,249,679 4,192,752 605.1 30,545 7,660,996 572,139 8,233,135 - -
Average 409,987 167,710 24.2 1,222 306,440 22,886 329,325 46.3 65.9
Source: The Budget Office of Seoul Metropolitan Government

30
Appendix 2 Standard Financial Needs Satisfaction Index (FY2003~2012)
(Percent: %)
District 2003 2004 2005 2006 2007 2008 2009 2010 2011 2012
Jongno 83.6 88.8 82.4 88.4 73.3 88.8 101.0 99.4 85.6 73.2
Jung 146.3 155.2 144.0 140.6 120.8 137.0 124.1 135.3 112.9 121.4
Yongsan 49.4 52.4 58.3 53.3 54.1 75.4 81.0 76.5 78.3 74.9
Seongdong 40.7 39.1 37.5 40.1 41.3 57.1 64.0 59.2 63.1 59.5
Gwangjin 39.0 38.8 37.4 40.5 39.5 61.3 66.4 59.5 59.3 51.0
Dongdaemun 39.5 40.7 38.5 37.4 36.7 53.1 59.0 58.1 62.4 56.6
Jungrang 34.2 32.9 31.1 26.3 26.5 42.3 48.6 45.3 51.7 49.8
Seongbuk 45.9 46.2 45.1 42.2 37.2 52.1 54.1 51.2 53.2 47.5
Gangbuk 32.3 33.2 31.4 31.4 26.7 46.6 54.0 47.6 51.6 48.2
Dobong 34.5 32.9 33.3 34.2 30.2 46.0 51.6 50.3 53.4 47.4
Nowon 34.3 35.8 33.9 31.3 31.9 44.0 49.6 47.6 49.2 39.7
Eunpyeong 30.8 35.5 31.9 30.3 27.5 43.2 49.3 48.0 50.6 51.3
Seodaemun 37.6 38.1 34.4 32.2 34.5 54.4 58.1 53.4 56.7 53.2
Mapo 41.1 46.1 45.5 48.8 54.0 61.4 64.7 63.1 66.1 65.8
Yangcheon 47.4 50.6 60.4 57.2 54.8 74.9 70.1 61.1 58.5 51.6
Gangseo 51.4 57.3 52.9 49.9 45.4 60.8 60.0 58.7 61.9 56.1
Guro 42.7 40.4 42.1 44.3 39.1 54.0 58.9 57.0 59.1 51.6
Geumcheon 36.2 35.3 30.8 30.7 32.8 53.7 59.6 54.6 60.7 61.8
Yeongdeungpo 87.4 95.3 85.0 81.1 79.3 92.6 93.0 85.4 80.2 73.1
Dongjak 42.9 44.6 43.6 41.0 38.5 54.6 61.9 58.6 64.2 60.0
Gwanak 37.0 38.8 35.3 34.5 33.5 47.4 53.1 51.2 57.4 49.8
Seocho 112.1 134.9 146.2 126.5 124.2 148.9 139.3 119.0 100.2 91.0
Gangnam 191.1 237.2 252.4 196.6 197.9 223.4 224.0 176.7 143.3 173.6
Songpa 74.6 99.0 101.2 93.9 86.9 115.3 117.0 93.2 78.6 77.8
Gangdong 45.7 50.3 52.5 52.9 52.1 68.8 66.6 59.8 65.5 60.8
Source: The Administration Bureau of Seoul Metropolitan Government

31
Appendix 3 Property Tax Revenue (FY 2003-2012)
(in Millions, KRW)
Name of Districts
FY2003
FY2004
FY2005
FY2006
FY2007
FY2008 (40%) 1
Total (Own +Redis.)
Own
Redistrib-uted from the Pool
Contrib-ute to the Pool
Jongno 39,223 51,292 38,137 43,656 52,324 61,336 35,743 25,593 24,851
Jung 65,519 80,491 51,001 61,785 73,278 73,390 47,797 25,593 32,935
Yongsan 26,098 34,186 30,842 38,813 50,727 64,842 39,249 25,593 27,093
Seongdong 16,979 22,542 22,671 26,210 31,155 46,242 20,649 25,593 14,721
Gwangjin 19,453 25,852 24,004 26,523 34,703 47,690 22,097 25,593 15,809
Dongdaemun 21,409 25,941 25,109 27,213 31,501 45,585 19,992 25,593 14,304
Jungrang 14,123 17,376 14,896 16,763 19,254 37,256 11,663 25,593 8,744
Seongbuk 21,403 27,918 23,184 25,646 30,672 45,255 19,662 25,593 14,103
Gangbuk 14,335 17,291 13,646 14,740 16,984 35,565 9,972 25,593 7,614
Dobong 12,709 16,324 16,334 17,688 19,770 37,172 11,579 25,593 8,679
Nowon 19,642 24,692 25,439 26,697 29,842 44,016 18,423 25,593 13,240
Eunpyeong 16,165 21,202 18,766 19,373 22,239 38,992 13,399 25,593 9,900
Seodaemun 16,615 21,456 20,020 22,796 25,932 41,369 15,776 25,593 11,459
Mapo 22,329 29,811 27,500 34,139 41,830 53,465 27,872 25,593 19,504
Yangcheon 21,433 31,718 31,607 36,234 47,075 59,508 33,915 25,593 23,719
Gangseo 28,507 35,788 33,923 38,554 45,851 56,795 31,202 25,593 20,243
Guro 19,447 24,973 23,889 26,883 31,351 45,762 20,169 25,593 14,418
Geumcheon 12,875 14,761 14,384 16,658 18,895 36,846 11,253 25,593 8,483
Yeongdeungpo 43,312 52,058 43,103 50,568 61,741 67,949 42,356 25,593 29,282
Dongjak 18,215 23,810 21,713 24,509 29,497 44,839 19,246 25,593 13,854
Gwanak 17,801 22,489 22,698 25,801 30,209 44,573 18,980 25,593 13,600
Seocho 80,917 101,962 92,368 111,386 149,340 136,211 110,618 25,593 75,044
Gangnam 131,331 183,773 182,984 191,969 252,484 220,730 195,137 25,593 131,358
Songpa 55,121 80,177 81,303 88,478 120,570 120,295 94,702 25,593 64,046
Gangdong 25,666 33,827 36,103 38,894 47,593 58,405 32,812 25,593 22,830
1. Source: The Bureau of Finance of the Seoul Metropolitan Government
2. The contribution percent starts from 40 percent in 2008, and had been increased by 5 percent by
each year up to 50 percent.
3. Net contributors (contribution money〉distributed money): 6 districts except in 2009 (7 districts),
in bold 4. Data of 2003 to 2011 are collected revenues, 2012 is taxed amount.

32
Appendix 3. Property Tax Revenue (FY 2003-2012) - Continued
(in Millions, KRW)
Name of Districts
FY2009 (45%) FY2010 (50%)
Total (Own +Redis.)
Own
Distributed from the Pool
Contribute to the Pool
Total (Own +Redis.)
Own
Distributed from the Pool
Contribute to the Pool
Jongno 62,322 35,773 26,549 27,715 63,039 30,483 32,556 31,760
Jung 74,787 48,238 26,549 37,846 74,566 42,010 32,556 43,660
Yongsan 62,722 36,173 26,549 28,184 66,352 33,796 32,556 35,089
Seongdong 49,163 22,614 26,549 16,790 51,236 18,680 32,556 19,971
Gwangjin 48,498 21,949 26,549 16,346 50,344 17,788 32,556 19,213
Dongdaemun 48,750 22,201 26,549 16,477 49,960 17,404 32,556 18,676
Jungrang 40,769 14,220 26,549 9,912 42,433 9,877 32,556 11,308
Seongbuk 47,630 21,081 26,549 15,603 49,359 16,803 32,556 18,154
Gangbuk 39,235 12,686 26,549 8,665 41,280 8,724 32,556 10,062
Dobong 40,175 13,626 26,549 9,445 42,094 9,538 32,556 10,834
Nowon 47,436 20,887 26,549 15,378 49,010 16,454 32,556 17,771
Eunpyeong 42,917 16,368 26,549 11,684 45,334 12,778 32,556 14,157
Seodaemun 44,063 17,514 26,549 12,629 46,400 13,844 32,556 14,987
Mapo 55,000 28,451 26,549 21,845 57,946 25,390 32,556 26,633
Yangcheon 52,655 26,106 26,549 19,950 57,114 24,558 32,556 25,839
Gangseo 57,534 30,985 26,549 21,784 58,997 26,441 32,556 25,167
Guro 48,573 22,024 26,549 16,344 50,090 17,534 32,556 18,846
Geumcheon 40,567 14,018 26,549 9,751 42,984 10,428 32,556 11,718
Yeongdeungpo 65,849 39,300 26,549 30,617 68,625 36,069 32,556 37,405
Dongjak 47,360 20,811 26,549 15,324 49,124 16,568 32,556 17,907
Gwanak 47,611 21,062 26,549 15,512 49,157 16,601 32,556 17,917
Seocho 113,231 86,682 26,549 70,164 121,577 89,021 32,556 90,717
Gangnam 187,863 161,314 26,549 131,926 200,250 167,694 32,556 168,854
Songpa 101,370 74,821 26,549 60,309 109,516 76,960 32,556 78,186
Gangdong 57,296 30,747 26,549 23,529 60,271 27,715 32,556 29,075

33
Appendix 3 Property Tax Revenue (FY 2003-2012) - Continued
(in Millions, KRW)
Name of Districts
FY2011 (50%) FY2012 (50%)
Total (Own +Redis.)
Own
Redistributed from the Pool
Contribute to the Pool
Total (Own +Redis.)
Own
Distributed from the Pool
Contribute to the Pool
Jongno 65,292 32,082 33,210 32,086 69,684 34,625 35,059 34,613
Jung 77,779 44,569 33,210 44,551 82,344 47,285 35,059 47,311
Yongsan 70,188 36,978 33,210 36,978 74,609 39,550 35,059 39,523
Seongdong 53,752 20,542 33,210 20,545 57,732 22,673 35,059 22,667
Gwangjin 53,024 19,814 33,210 19,810 56,301 21,242 35,059 21,240
Dongdaemun 52,569 19,359 33,210 19,321 55,531 20,472 35,059 20,454
Jungrang 44,930 11,720 33,210 11,721 47,685 12,626 35,059 12,619
Seongbuk 52,091 18,881 33,210 18,880 55,373 20,314 35,059 20,306
Gangbuk 43,400 10,190 33,210 10,185 45,842 10,783 35,059 10,778
Dobong 44,043 10,833 33,210 10,831 46,424 11,365 35,059 11,379
Nowon 51,389 18,179 33,210 18,175 53,864 18,805 35,059 18,829
Eunpyeong 48,319 15,109 33,210 15,110 51,589 16,530 35,059 16,530
Seodaemun 48,306 15,096 33,210 15,117 51,108 16,049 35,059 16,045
Mapo 61,524 28,314 33,210 28,224 65,825 30,766 35,059 30,675
Yangcheon 59,492 26,282 33,210 26,305 62,284 27,225 35,059 27,220
Gangseo 60,992 27,782 33,210 25,151 64,955 29,896 35,059 28,074
Guro 52,443 19,233 33,210 19,255 56,344 21,285 35,059 21,359
Geumcheon 46,158 12,948 33,210 12,905 48,772 13,713 35,059 13,737
Yeongdeungpo 70,823 37,613 33,210 37,564 74,632 39,573 35,059 39,554
Dongjak 51,928 18,718 33,210 18,717 55,220 20,161 35,059 20,159
Gwanak 51,445 18,235 33,210 18,232 54,432 19,373 35,059 19,369
Seocho 126,107 92,897 33,210 92,888 134,677 99,618 35,059 99,170
Gangnam 201,702 168,492 33,210 168,488 207,466 172,407 35,059 172,344
Songpa 112,553 79,343 33,210 79,275 116,021 80,962 35,059 80,946
Gangdong 63,161 29,951 33,210 29,944 66,637 31,578 35,059 31,573