The Impact of the New Deal on Black and White Infant...
30
The Impact of the New Deal on Black and White Infant Mortality in the South 1 Price V. Fishback University of Arizona and NBER Michael R. Haines Colgate University and NBER and Shawn Kantor University of Arizona and NBER The New Deal led to unprecedented involvement by the federal government in the provision of relief. Although New Deal officials argued that they sought to be nondis- criminatory in providing access to programs, various scholars have suggested that blacks received fewer benefits than whites. One method for testing the effectiveness of the New Deal at reaching households with low incomes is to examine its impact on infant mortality. In this paper we use county-level data from three subperiods during the 1930s to examine the relationship between several New Deal spending programs and black and white infant mortality in the South. Some New Deal programs contributed to a reduction in infant mortality, but other factors may have been strong contributors to a long-term secular decline in infant mortality. Meanwhile, some of the New Deal programs appear to have been nondiscriminatory or even more beneficial for blacks than for whites, while others appear to have had differential effects that favored whites. © 2001 Academic Press Since the New Deal the United States federal government, in cooperation with state and local governments, has implemented a myriad of programs designed to 1 This paper was prepared for the conference “One Kind of Freedom Reconsidered: African American Economic Life in the Segregation Era” at Lehigh University, September 17–19, 1999. We thank Howard Bodenhorn, participants at the conference, and two anonymous referees for their helpful comments. Special thanks to Kari Beardsley, Amanda Ebel, Michael Hunter, Angela Phillips, and Jeffrey Taylor for their help in computerizing the data. Fishback and Kantor’s work on this paper was supported by National Science Foundation Grant Number SBR-9708098. Any opinions stated here are the authors’ and not the position of the NSF. Explorations in Economic History 38, 93–122 (2001) doi:10.1006/exeh.2000.0759, available online at http://www.idealibrary.com on 93 0014-4983/01 $35.00 Copyright © 2001 by Academic Press All rights of reproduction in any form reserved.
Transcript of The Impact of the New Deal on Black and White Infant...

The Impact of the New Deal on Black and White InfantMortality in the South1
Price V. Fishback
University of Arizona and NBER
Michael R. Haines
Colgate University and NBER
and
Shawn Kantor
University of Arizona and NBER
The New Deal led to unprecedented involvement by the federal government in theprovision of relief. Although New Deal officials argued that they sought to be nondis-criminatory in providing access to programs, various scholars have suggested that blacksreceived fewer benefits than whites. One method for testing the effectiveness of the NewDeal at reaching households with low incomes is to examine its impact on infant mortality.In this paper we use county-level data from three subperiods during the 1930s to examinethe relationship between several New Deal spending programs and black and white infantmortality in the South. Some New Deal programs contributed to a reduction in infantmortality, but other factors may have been strong contributors to a long-term seculardecline in infant mortality. Meanwhile, some of the New Deal programs appear to havebeen nondiscriminatory or even more beneficial for blacks than for whites, while othersappear to have had differential effects that favored whites.© 2001 Academic Press
Since the New Deal the United States federal government, in cooperation withstate and local governments, has implemented a myriad of programs designed to
1 This paper was prepared for the conference “One Kind of Freedom Reconsidered: AfricanAmerican Economic Life in the Segregation Era” at Lehigh University, September 17–19, 1999. Wethank Howard Bodenhorn, participants at the conference, and two anonymous referees for theirhelpful comments. Special thanks to Kari Beardsley, Amanda Ebel, Michael Hunter, Angela Phillips,and Jeffrey Taylor for their help in computerizing the data. Fishback and Kantor’s work on this paperwas supported by National Science Foundation Grant Number SBR-9708098. Any opinions statedhere are the authors’ and not the position of the NSF.
Explorations in Economic History38, 93–122 (2001)doi:10.1006/exeh.2000.0759, available online at http://www.idealibrary.com on
93
0014-4983/01 $35.00Copyright © 2001 by Academic Press
All rights of reproduction in any form reserved.

improve the living standards of children in America. Yet some critics believe thatthe United States has far to go in alleviating poverty among children andimproving their access to health care. For example, even though infant mortalityrates today are one-tenth their 1920s levels, American rates are significantlyhigher than those in many other developed countries. Further, significant con-cerns have been raised about racial differences in the access to public programs,in part because black infant mortality rates today remain substantially higher thanthose of whites (14.7 deaths per thousand live births versus 6.1).
The federal government’s efforts to improve the welfare of black children inthe South dates back to the Reconstruction Era. Yet as Roger Ransom andRichard Sutch argue inOne Kind of Freedom,the Freedman’s Bureau hadmodest success in providing relief and education for newly freed black children.The federal government’s first broad-based effort to provide social welfareoccurred during the New Deal, first through emergency assistance and thenthrough the establishment of long-term programs such as Aid to DependentChildren and Social Security. In this paper we examine the effectiveness ofvarious New Deal programs in improving the socioeconomic status of black andwhite children during the 1930s. We focus specifically on infant mortality.
Franklin Roosevelt and the Congress responded to the Great Depression byestablishing a number of programs that potentially could have contributed tolowering infant mortality rates. As part of the New Deal, the federal governmentprovided funds for direct relief and work relief through the Federal EmergencyRelief Administration (FERA), and work relief under the Civil Works Admin-istration (CWA) and eventually the Works Progress Administration (WPA). ThePublic Works Administration (PWA) was supposed to alleviate unemploymentproblems by providing additional employment, while enhancing the economy bybuilding social capital, including sanitation projects in many cities. The Agri-cultural Adjustment Administration (AAA) was designed to help raise theincomes of struggling farmers. Under the Social Security Act of 1935, thelong-term programs for old-age assistance, aid to dependent children, and aid tothe blind were established. Public housing was created to try to upgrade thequality of housing for families in slums. The administrators of all of theseprograms saw them as means to put resources into the hands of families in need,precisely the group where infant mortality was most likely to be a problem.
There has been some empirical controversy whether the stated goals of theNew Deal—relief, recovery, and reform—were actually met. In studies of thedistribution of funds across the states, Wright (1974), Wallis (1998), and Couchand Shughart (1998), for example, show that the distribution of New Deal fundsdoes not seem to fit a reform motive. Couch and Shughart (1998) questionwhether the funds were distributed in ways that promoted relief or recovery,claiming that the political agendas of the president and congressmen were moreimportant determinants (see also Anderson and Tollison (1991) and Wright(1974)). John Wallis (1998), on the other hand, finds some evidence that NewDeal money was distributed to areas with relatively higher unemployment. All of
94 FISHBACK, HAINES, AND KANTOR

these discussions focus on the politics and economics of distributing federallargesse. Surprisingly, very little research has attempted to address the importantquestion of how successful these programs were in reducing socioeconomicproblems.
One means of measuring the success of federal relief programs during the NewDeal is to examine their effect on infant mortality rates. Since children under theage of one are probably the societal group with the fewest defenses against theproblems of disease, malnourishment, and maltreatment, they are probablyaffected most by negative socioeconomic shocks to the household. Infant mor-tality rates have been shown by numerous studies to be strongly associated withsocioeconomic status broadly defined (see Antonovski and Bernstein (1977),Clifford and Brannon (1978), Fordyce (1976/1977), and Waldman (1992)).Because social insurance programs and relief programs are designed to helppeople in the lower end of the income distribution, their impact on the infantmortality rate is one important measure of their success. In fact, the social
TABLE 1Infant Mortality Rate by Race for the Birth Registration Area (1915–1932), the United States
(1933–1940), and Selected States (1915–1940)
Year
Current birth registration area(1915–1932) or United States
(1933–1940) Virginia South Carolina Mississippi
Total White Nonwhite Black Total White Nonwhite Total White Nonwhite Total White Nonwhite
1915 99.9 98.6 181.21916 101.0 99.0 184.9 184.31917 93.8 90.5 150.7 97.8 80.4 136.51918 100.9 97.4 161.2 162.5 102.9 85.8 141.51919 86.6 83.0 130.5 134.3 91.0 77.9 119.6 113.1 75.9 149.31920 85.8 82.1 131.7 135.6 83.6 71.7 109.8 115.8 83.4 147.91921 75.6 72.5 108.5 110.7 78.7 68.1 102.5 96.1 69.5 122.6 68.4 52.8 84.61922 76.2 73.2 110.0 111.5 76.8 65.4 102.1 92.9 66.7 119.0 68.0 56.0 79.21923 77.1 73.5 117.4 119.9 84.0 70.5 114.7 96.3 69.5 125.1 68.1 53.1 82.31924 70.8 66.8 112.9 114.1 77.6 65.9 104.4 101.6 77.1 127.0 71.3 54.9 88.01925 71.7 68.3 110.8 112.0 80.8 67.5 110.9 68.5 52.9 83.31926 73.3 70.0 111.8 112.1 83.7 71.9 110.8 70.0 58.7 80.81927 64.6 60.6 100.1 99.9 75.5 62.4 106.4 66.8 55.3 77.91928 68.7 64.0 106.2 105.9 75.9 64.1 104.5 96.5 77.7 115.2 73.8 61.1 86.11929 67.6 63.2 102.2 101.5 78.8 66.9 107.3 91.0 72.1 109.6 72.1 58.4 84.91930 64.6 60.1 99.9 99.5 77.3 65.1 107.2 88.7 69.0 108.1 67.7 51.4 83.01931 61.6 57.4 93.1 92.7 76.3 63.9 107.8 81.0 58.9 102.0 55.9 43.9 67.11932 57.6 52.8 92.1 84.1 67.2 57.7 90.1 77.2 61.5 91.9 53.6 44.4 61.81933 58.1 52.0 101.4 85.4 68.5 59.2 90.0 78.2 60.9 94.6 63.6 50.9 74.71934 60.1 53.6 105.8 91.0 72.6 62.2 98.4 83.0 67.3 98.3 64.8 54.8 73.61935 55.7 51.9 83.2 81.9 69.6 58.8 96.1 79.3 61.6 95.8 53.9 47.8 59.01936 57.1 52.9 87.6 86.1 73.9 62.6 101.8 80.8 62.1 98.9 58.2 50.3 64.71937 54.4 50.3 83.2 82.0 69.7 59.2 95.2 75.6 62.7 87.9 58.9 50.0 66.01938 51.0 47.1 79.1 77.9 66.2 57.0 89.6 80.3 64.4 95.9 56.7 50.4 61.71939 48.0 44.3 74.2 73.2 59.7 50.3 83.9 66.5 54.1 78.8 56.6 50.4 61.81940 47.0 43.2 73.8 72.9 58.5 50.5 79.5 68.2 50.8 86.1 54.4 46.6 60.6
Sources.U.S. data are from National Center for Health Statistics (1996). The individual state dataare from Linder and Grove (1947).
95NEW DEAL AND INFANT MORTALITY

programs of the New Deal might well have been extremely important. During theworst depression in American history, the infant mortality rate continued todecline through 1932, rose slightly in 1933 and 1934, and then declined sharplythrough the rest of the 1930s (see Table 1). Such a drop is surprising since wemight expect that lower incomes would contribute to greater infant mortality,particularly if lower income influenced both prenatal care and nutrition and thedegree of crowding in households.
Both black and white infant mortality rates followed similar patterns duringthe 1930s, although the black rate remained substantially higher and had largerfluctuations. Part of the difference probably stems from differences in householdincomes, but there might also have been differential access to the benefits fromthe government programs. Federal New Deal administrators claimed that theysought to treat the races equally when they distributed funds. Many New Dealprograms, however, were administered in partnerships with state and localofficials, and there was plenty of room for local administrative discretion in thedistribution of funds. Since state and local governments in the South hadimplemented policies that had significantly retarded black progress for decades(see, for example, Kousser (1974), Higgs (1977), Ransom and Sutch (1977), andMargo (1990)), there may well have been racial differences in the access to andsubsequent effects of the New Deal.2
In this paper we describe the long-term infant mortality decline for both blacksand whites during the early 1900s, its continuation through the Great Depression,and the nature of New Deal programs. Using a sample of over 700 counties fromthe South with separate information for blacks and whites, we then examine theeffect of New Deal spending on black and white infant mortality.
MORTALITY TRENDS
One of the most significant trends in America since 1850 has been the greatmortality transition (Easterlin, 1996, Chap. 6). Even more dramatic has been thedecline in infant mortality for both white and black populations. In 1850, theexpectation of life at birth (e(0)) in theUnited States was 38.3 years (39.5 for thewhite population), and the infant mortality rate (IMR: deaths before age 1 per1,000 live births) was 229 (217 for whites) (Haines, 1998a, Table 1). The IMRfor the black population (most of whom were slaves in 1850) may have been ashigh as 350 and thee(0) as low as 23 years (Steckel, 1986). The mortalitytransition essentially began in the 1870s and was well underway by the turn ofthe century. In 1900 the expected life span at birth for the overall population was50.1 (51.8 for whites and 41.8 for blacks). The corresponding IMR had fallen to
2 Richard Sterner (1943, pp. 213–323) portrays a very complex picture of the racial differences inaccess to many of the New Deal relief programs. Warren Whatley (1983) has suggested that spendingby the Agricultural Adjustment Administration might have led to greater income inequality aslandlords demoted sharecroppers and tenants to wage workers.
96 FISHBACK, HAINES, AND KANTOR
120 for the overall population (111 for whites and 170 for blacks) (Haines,1998a, Table 1).
A complex set of factors contributed to this achievement, including improve-ments in diet, nutrition, clothing, and shelter; expanded public health measures toprovide clean water supplies, proper sewerage and refuse disposal, quarantine,pure milk, unadulterated food and drink, health education, and vaccinations andinoculations; improved health behavior (e.g., washing and personal hygiene, foodpreparation); medical advances; and even possibly exogenous changes in thevirulence and etiology of specific diseases (e.g., scarlet fever). The improvementsin infant mortality were assisted, in part, by the decline in fertility, which hadproceeded throughout the 19th century (Haines, 2000; Meckel, 1990; Troesken,1999).
During the Progressive Era there was a heightened interest in controlling andreducing morbidity and mortality among infants, children, and mothers. Forinstance, the U.S. Children’s Bureau was founded in 1912 “to investigate andreport upon all matters pertaining to the welfare of children and child life amongall classes of our people” (Bremner, 1971, p. 1525; Lindenmeyer, 1997, Chap. 1).Julia Lathrop, first head of the agency, “selected a noncontroversial issue,reducing infant mortality, as the agency’s first project” (Lindenmeyer, 1997, p.30). The Bureau did much to promote measurement of levels, trends, differen-tials, and causes of infant mortality. For example, the Children’s Bureau spon-sored early studies (1911–1915) of matched birth-infant death records for severalU.S. cities (see Woodbury (1926)).
Perhaps more importantly, the Children’s Bureau successfully lobbied for theextension of the Death Registration Area (DRA) and the Birth Registration Area(BRA). The original DRA included only the six New England states plus NewYork, New Jersey, Michigan, Indiana, and the District of Columbia. Thispreliminary set of states comprised only 26% of the American population, wasmore urban, had a higher proportion of the foreign born, and had relatively fewerblacks (4.4% of the U.S. total) compared to the nation as a whole. In addition,most of the blacks in the DRA were urban (82%), in contrast to the nation overall,where 20% of blacks were urban (Preston and Haines, 1991, Table 2.1). It tookeven longer to form the BRA. It was put together in 1915 and consisted of thesix New England states plus New York, Pennsylvania, Michigan, Minnesota, andthe District of Columbia. Both the DRA and the BRA did not include the entirecontinental United States until 1933, when Texas was admitted. Thus, for thetime period considered in this paper, the vital statistics coverage was notcomplete at the beginning of the period, although births, deaths, and infant deathswere reported for about 95% of the population by 1929 (U.S. Bureau of theCensus, 1975, p. 44).
The Progressive Era saw great strides in the reduction of infant mortality.Between 1900 and 1920, the IMR declined by about 35%, from 111 to 82, for thewhite population and by about 29%, from 170 to 132, for the black population(Haines, 2000, Table 3). The efforts of the progressives eventually led to the
97NEW DEAL AND INFANT MORTALITY

passage of the Sheppard–Towner Act in November 1921, which remained ineffect until June 1929. The law appropriated about seven million dollars infederal money for grants-in-aid to states for the promotion of maternal and infanthealth and welfare (Bremner, 1971, pp. 1003–1025; Meckel, 1990, Chap. 8;Lindenmeyer, 1997, Chap. 4). By 1930 the Children’s Bureau had reported thatthe legislation led to, among other things, expansion of the BRA and the DRA,establishment of state child-hygiene bureaus and divisions, establishment ofpermanent state health centers for mothers and children, and, perhaps mostimportant, an accompanying increase in state appropriations for infant andmaternal health (U.S. Children’s Bureau, 1930, pp. 1–3). Thus, even though theSheppard–Towner legislation had expired, much public health infrastructure wasalready in place by the late 1920s, both of a general sort—purification of water,improvements in the disposal of sewerage and refuse, quarantine, health educa-tion—and of a type that specifically assisted infants and mothers—milk pasteur-ization, vaccinations and inoculations, visiting nurses, maternal care, and edu-cation.
The IMR continued to decline through the 1930s.3 As shown in Table 1,between 1930 and 1940, the IMR for whites declined by 28% while that forblacks fell by 27%, although both rates rose somewhat between 1932 and 1934.The declines were virtually identical to the percentage declines of the 1920s(27% for each group). In the southern states of Virginia, South Carolina, andMississippi (see Table 1), black and white infant mortality rates followed thenational trends, although the levels were different from state to state.
Given that infant mortality tends to be correlated with socioeconomic status,the continuation of the downward trend for both blacks and whites during the1930s is surprising because America experienced its most severe macroeconomicdisturbance during that decade. Between 1929 and 1933, nominal GNP fell by46% and real GNP by 30%. The unemployment rate rose from 3.2 to 24.9% ofthe civilian labor force (U.S. Bureau of the Census, 1975, Series F1,5, D 86). The1929 unemployment rate was not reached again until World War II, and the levelof real GNP per capita in 1929 was not achieved until 1940. Thus, despite ahorrendous downturn and a decade of lost economic growth, infant and maternalhealth improved, except for a short-lived jump upward in 1933 and 1934 duringthe trough of the Depression. Part of the improvement over the course of thedecade may have stemmed from the continuation of practices that had beendeveloped in the 1920s. Another possible reason might be that the federalprograms under the New Deal helped sustain the earlier progress and helpedprevent those struck hardest by the Depression from suffering too sharp a declinein their material well-being.
3 In fact, dramatic declines continued throughout the 20th century. By 1997 the IMR had declinedto 7.2 infant deaths per 1000 live births overall. The white rate had fallen to 6.0 and the rate for blacksto 14.2. See National Center for Health Statistics (1999, Table 27).
98 FISHBACK, HAINES, AND KANTOR

NEW DEAL PROGRAMS
Prior to the 1930s providing financial relief for people struck by misfortune—poverty, unemployment, injury, etc.—was not considered to be a federal respon-sibility. State and local governments provided varying degrees of aid throughmothers’ aid programs, poor relief, workers’ compensation, and institutions forthe blind and disabled. When the Depression hit, however, attitudes toward thefederal role were altered, as people saw the Depression as a problem that wasnational in scope (Wallis, 1984). The federal government began loaning funds forrelief through the Reconstruction Finance Corporation in 1932, during theHoover Administration. Activity at the federal level exploded when FranklinRoosevelt and the Democratic Congress established the New Deal in March1933. A profusion of programs were established with goals ranging from directrelief, to employment, to the building of public works. The federal governmentspent approximately 5% of GDP on New Deal programs during the 1930s. Thislevel of federal government spending during the 1930s was unprecedented andset the stage for a dramatic shift in the financial responsibilities of the national,state, and local governments. New Deal programs raised federal spending as aproportion of all government spending from 30% in 1932 to 46% in 1940 (Wallis1984, pp. 141–142).
Table 2 shows per capita New Deal spending in the South and the rest of thenation for several key programs that might have influenced infant mortalitybetween March 1933 and June 1939. The information comes from the U.S. Officeof Government Reports (1940), which reported federal spending, loans, andinsurance for all of the counties in the United States. The programs listed in Table
TABLE 2Per Capita Spending on Various New Deal Programs in the South and Non-South
Non-South South
Agricultural Adjustment Administration, RentalBenefits and Conservation Payments $13.85 $21.99
Civil Works Administration 6.58 5.25Federal Emergency Relief Administration 25.10 13.39Public Works Administration 18.91 14.76Aid to Dependent Children, Social Security
Administration 0.42 0.32PWA/U.S. Housing Administration Housing Projects 1.12 0.83Works Progress Administration 58.05 24.44
Source.New Deal spending is from the U.S. Office of Government Reports, Statistical Section,Report No. 10, Volume 1, “County Reports of Estimated Federal Expenditures March 4, 1933–June30, 1939.” The per capita figures were created by dividing by the population in 1930 fromHistorical,Demographic, Economic, and Social Data: The United States, 1790–1970(ICPSR tape number0003, as corrected by Michael Haines).
Note.The South includes the states of Alabama, Arkansas, Florida, Georgia, Kentucky, Louisiana,Maryland, Oklahoma, Mississippi, North Carolina, South Carolina, Tennessee, Texas, and Virginia.
99NEW DEAL AND INFANT MORTALITY

2 potentially influenced infant mortality by reducing economic distress in bothdirect and indirect ways. The Federal Emergency Relief Administration (FERA)provided a combination of work relief and direct relief for the unemployed andneedy families between 1933 and 1935. During the winter of 1933–1934, theCivil Works Administration (CWA) provided extensive amounts of work relief.The Works Progress Administration (WPA), later the Works Projects Adminis-tration, superceded the FERA in the latter part of 1935 and provided work relieffor “employables,” while “unemployables” once again became the responsibilityof local and state governments. The federal government still provided somedirect relief for dependent children, the blind, and the elderly through programsestablished by the Social Security Act of 1935. The Public Works Administrationbuilt public works, while aiding the unemployed by providing constructionemployment and potentially some economic stimulus in the area. The PublicWorks Administration, in particular, might have had a more direct effect onpublic health because it contributed to the building of sewage control andwaterworks facilities in hundreds of communities (Public Works Administration,1939, pp. 139–180). The Public Works Administration and later the U.S.Housing Authority began building public housing projects that were designed toimprove housing and reduce overcrowding in slum areas. Payments to farmersunder the Rental and Benefit program and later the Conservation programs of theAgricultural Adjustment Administration were designed to increase farm incomes.
The North/South comparisons in Table 2 show that per capita federal NewDeal spending tended to be smaller in the South than in the rest of the countryfor most programs. Thus, just by living in the South, blacks had access to asmaller share of New Deal spending. Part of the difference in spending across thecountry may have been driven by the fact that the South was less urban than therest of the nation. Many of the relief programs were more focused on resolvingissues related to urban unemployment. The South fared much better with respectto the AAA programs, although, as we will see below, the distribution of AAAfunds might have contributed to greater income inequality and more problems forthe disadvantaged.
THE DETERMINANTS OF INFANT MORTALITY
The costs and benefits of public programs are never distributed equally acrosssociety. During the 20th century the federal government seems to have been lessdiscriminatory than southern states and local governments; therefore, we mightexpect that New Deal federal government programs were likely to provide moreequal access to blacks and whites than the earlier state and local relief groups.The Federal Works Agency (1940, p. 23) argued that its programs—including thePublic Works Administration and the Works Projects Administration—activelysought to ensure no racial discrimination in employment and in the distributionof benefits. Although the federal government may have attempted to create equalaccess to these programs based on race or socioeconomic status, its oversight was
100 FISHBACK, HAINES, AND KANTOR
limited because nearly all of the programs were administered in conjunction withstate and local authorities in some way. Thus, while the federal government mayhave been a positive force in aiding blacks in a number of situations, state andlocal governments in the South had developed policies that had significantlyretarded black progress for decades (see, for example, Kousser (1974), Higgs(1977), Ransom and Sutch (1977), and Margo (1990)). Racial differences inprogram participation may also have led to an unequal distribution of programfunds. Blacks with limited education may have faced more obstacles in deter-mining their eligibility for relief programs. In addition, past experiences withlocal public programs may have discouraged them from applying.
Richard Sterner (1943, pp. 213–323) used various surveys to develop acomplex picture of the extent to which black families participated in New Dealrelief programs. There appear to have been racial differences in the participationin New Deal programs that varied across programs, and varied from state to stateand probably from county to county within most programs. Sterner found fromsurveys in 1933 and 1935 that the share of the black population receiving reliefwas higher than the white share of the population in southern cities, but it waslower in southern rural areas. Black families seem to have fared the worst fromthe Aid to Dependent Children program, which was largely administered by stateand local agencies. Lieberman (1998, p. 128) and Sterner (1943, pp. 282–286)found that the percentage of black children accepted for ADC in the late 1930sin nearly every southern state was smaller than the black percentage of childrenunder age 16, even though black families were more likely to have low incomes.Meanwhile, ADC benefits per child recipient were lower for blacks than forwhites.
In some cases the introduction of New Deal programs could have had perverseeffects on low-income and minority populations. Warren Whatley (1983) hasargued, for example, that sharecroppers and share tenants tended to be demotedto wage laborers as a result of the Agricultural Adjustment Administration(AAA). The AAA payments gave landlords incentive to displace tenants, eventhough the intent of the legislation was for tenants to share in the benefits of thefarm programs. Since blacks were found more often at the lower end of the tenureladder, they may have actually suffered from the introduction of the AAA.
Only limited race-specific information on the division of New Deal spendingbetween black and white families is available (see Sterner (1943)). However, wecan draw some inferences by looking at how New Deal spending affected blackand white infant mortality rates in the various counties of the United States. Thevarious New Deal programs potentially might have reduced infant mortality byproviding employment to the unemployed, in some cases by providing directrelief, by building sanitation projects, and by stimulating the economy eitherdirectly or indirectly with an influx of spending. To measure the impact of theNew Deal, we developed a data set for over 700 counties with race-specificinformation on births and deaths throughout the 1930s. The regression model weestimate is relatively straightforward:
101NEW DEAL AND INFANT MORTALITY

IMR i 5 f~GFRi, ND, X, ei!,
where IMRi is the infant mortality rate for racei (black or white), GFR is thegeneral fertility rate for racei , ND is a group of variables describing New Dealspending per capita for various programs,X is a group of variables describing theeconomic and geographic characteristics of the counties, andei is a set ofrace-specific stochastic error terms. We have race-specific information on theinfant mortality rate and birth rates, but we do not have race-specific informationon the other variables in the equation.
In addition to the New Deal programs, we are able to include several variablesthat capture key factors that might have influenced infant mortality. Geographicdifferences in infant mortality based on the ethnicity and/or racial mix of thepopulation are captured in the regression with variables measuring the percent-ages of black and foreign-born individuals in each county. Racial and ethnicdifferences in infant mortality may have arisen from a disparity in the socioeco-nomic status of various population groups or cultural differences in the use of oraccess to medical care in different areas. Carson (1994) cites several studiesshowing that the foreign-born and southern blacks were much more likely to usemidwives than were black and white women in northern cities. She also notesthat there were substantial differences in blacks’ and whites’ access to hospitals.Moreover, since there was substantial residential segregation at the time, therewere likely to be racial and ethnic differences in the extent of residentialcrowding and access to sanitation services, even within the same county.
The regression includes the percentage of the population living in urban areas(defined as residing in towns with more than 2,500 people) and rural, nonfarmareas. These variables capture the impact of greater population density andurbanization on the potential spread of epidemics among infants and on access tohealth care. To control for differences in the overall economic condition acrossthe counties, we include retail sales per capita. This variable is designed to proxypersonal income at the local level, which is not available.
We also included a measure of literacy because more highly educated familieswere likely to have better information about infant care and health, moregenerally. The census reported illiteracy for people aged 10 and above in 1930and then reported the number of years of school completed for people over 24years in 1940. We used the illiteracy rate from 1930 and then calculated illiteracyrates for 1940 for people over 24 years old. The 1940 estimate is based on 1947information from the U.S. Bureau of the Census (1948, p. 7) on the illiteracy ofmales and females over 24 who had no schooling and 1 to 4 years of schooling.4
4 The illiteracy rate for those with no schooling was 78.2% for males and 80.7% for females. Theilliteracy rate among those with 1 to 4 years of schooling was 22.5% for males and 16.7% for females.We assumed those with more than 5 years of schooling were all literate. See U.S. Bureau of theCensus (1948).
102 FISHBACK, HAINES, AND KANTOR

CONSTRUCTION OF THE DATA SET
Infant deaths and births were collected from the U.S. Bureau of the Census(1934a, 1934b, 1934c, 1936a, 1936b, 1938, 1939, 1940, 1941, 1942). From 1930to 1934 the information on births, deaths, infant deaths, and stillbirths wasreported separately for towns and cities above 10,000 in population and for therural sections of each county. We determined the counties in which each of thetown and cities were located and then aggregated the rural and city informationto the county level. In some cases cities were located in two counties. Insituations where over 90% of the population of the city was in one county, wecombined the city information with that county’s information. In several othersituations we combined counties.5 We also had to combine a number of countiesbecause of the way the New Deal information was reported.6
Separate information for “colored persons” and whites was provided forbetween one-fourth of the counties in the early 1930s and one-third of thecounties in the late 1930s. The counties with separate information were primarilylocated in the South. Colored persons includes some Asians and others who werenot of African descent, although the vast majority of the nonwhites in the Southwere African-Americans. Our sample is limited to a subset of all southerncounties for several reasons. In a number of counties, typically with populationsthat were less than 10% black, the Census did not report separate information forblacks and whites. In quite a few settings, the Census reported black and whiteinformation for the urban sector but not the rural sector of the county. Since theinformation on the determinants of infant mortality rates was reported for theentire county level, we felt that we should focus on the counties with full infantmortality information for the entire county. After ensuring that we had fullinformation on infant mortality for blacks and whites for the southern counties,our sample includes 723 counties in the years 1930 to 1932, 845 counties in theyears 1933 to 1935, and 1192 counties for the years 1936 to 1939. In thedifference regressions, which compare the later years with the period 1930 to1932, the sample is limited to the number of counties for which we have data in
5 Therefore, we combined Russell and Lee counties in Alabama (Phenix City); DeKalb, Fulton,Milton, and Campbell in Georgia (Atlanta); Edgcomb and Nash in North Carolina (Rocky Mount);and James City and York in Virginia (Williamsburg).
6 In Virginia we combined the following districts that were reported separately in the Census:Albemarle county and Charlottesville city; Allegheny county and Clifton Forge city; Augusta countyand Staunton city; Campbell county and Lynchburg city; Dinwiddie county and Petersburg city;Elizabeth City county and Hampton city; Frederick county and Winchester city; Henrico county andRichmond city; Henry county and Martinsville city; James City county and Williamsburg city;Montgomery county and Radford city; Nansemond county and Suffolk city; Norfolk county withNorfolk city, South Norfolk city, and Portsmouth city; Pittsylvania county and Danville city; PrinceGeorge county and Hopewell city; Roanoke county and Roanoke city; Rockbridge county and BuenaVista city; Rockingham county and Harrisonburg city; Spotsylvania county and Fredericksburg city;Warwick county and Newport News city; Washington county and Bristol city; Arlington county andAlexandria city.
103NEW DEAL AND INFANT MORTALITY

the earliest period. One reason for the smaller number of observations in 1930 to1932 is that Texas (253 counties) was not included in the BRA or DRA at this time.
Census information on population and many of the socioeconomic variableswere derived from ICPSR data set 0003, as corrected by Michael Haines (ICPSR,0003, no date). The information on the different New Deal programs wasreported by the United States Office of Government Reports (the “Office”). In1940 the Office compiled a detailed statistical description of the federal govern-ment’s expenditures across the United States during the New Deal era. Data werecollected on 31 different New Deal-era programs for 3,069 counties in the UnitedStates for the period March 1933 through June 1939. For each county, aggregateexpenditures over the entire time period were reported for each of the programs.We focus our attention here on the spending programs that would have been mostdirectly beneficial in preventing infant mortality, including the major work reliefprograms, Aid to Dependent Children, the AAA, and the PWA public works andpublic housing projects.
Although the Office reported information aggregated for the entire period from1933 to 1939, we were able to use the reports of the various agencies to roughlyidentify the timing of the programs. This allowed us to break the New Dealspending into two time periods, 1933 through 1935 and 1936 through 1939. Inbrief, the funds spent by the Federal Emergency Relief Administration (FERA),the Civil Works Administration (CWA), and the Agricultural Adjustment Ad-ministration’s (AAA) Rental and Benefits program were largely exhausted priorto 1936. The Social Security Aid to Dependent Children program, the PublicWorks Administration’s (PWA) public housing program (later transferred to theU.S. Housing Authority), the AAA Conservation payments, and 95% of theWPA programs had their effects after 1935. We used a variety of sources to splitthe PWA public works programs into the two periods.7 To translate the New Dealspending into per capita figures, we divided by the county’s population in 1930.
7 The Federal Emergency Relief Administration programs allocated well over 90% of its fundsbetween May of 1933 and June of 1935. There was a small amount of additional spending by FERAas the program wound down through March 1937. The Civil Works Administration operated betweenNovember 1933 and April 1934. Because the WPA did not start until July 1935 and less than 6% ofthe employment occurred in 1935 (see Federal Works Agency, 1940, p. 413), we placed all of theWPA spending in the 1936–1939 period. The spending on Aid to Dependent Children was distributedafter 1935. The U.S. Housing Authority was established on November 11, 1937, but took overhousing projects that had been built or started by the Public Works Administration. The timing of theprojects suggests that people did not begin to live in the projects until the end of 1935, so we placedthe impact of the spending in the 1936–1939 period (Public Works Administration, 1939, pp.207–217, 283–284). We distributed the PWA funds for federal and nonfederal projects usingemployment information from the Federal Works Agency (1940, p. 307). Between 1933 and 1935,77.9% of the employed worked on federal projects, and 22.1% did from 1936 on. Thirty-two percentworked on nonfederal projects from 1933–1935, 68% did from 1936 to 1939. The Office ofGovernment Reports (1940) provided information on “rental and benefit” payments under the AAAfrom 1933 and 1935 and for “conservation” payments from 1936 and 1937, which allowed us todivide the information between time periods accordingly.
104 FISHBACK, HAINES, AND KANTOR
Given the timing of our information on the New Deal programs, we havecreated three time groupings, 1930–1932, 1933–1935, and 1936–1939. For eachperiod we summed the infant deaths and births and then calculated an infantmortality rate. When we calculated the general fertility rate for each race we usedthe number of women of each race aged 15 to 44 in the denominator. There wasno New Deal spending in the 1930–1932 period for the programs that weconsidered. We used the census information from 1930 and 1940 and straight-line interpolations for the midpoint of each period (1931 for 1930–1932, 1934 for1933–1935, and 1937/38 for 1936–1939) for the following variables: percentblack, percent foreign-born, percent illiterate, percent urban, and percent rural-nonfarm. For retail sales per capita, we used information on retail sales in 1929for the 1930–1932 period, we averaged retail sales for 1933 and 1935 for1933–1935, and we came up with a midpoint estimate for retail sales in 1936–1939 using the retail sales information from 1935 and 1939.8 For each period wedivided the retail sales by a population estimate based on a linear interpolationbetween 1930 and 1940. The retail sales information for 1933 and 1935 comesfrom the Consumer Market Data Handbooks for 1936 and 1939 published by theU.S. Department of Commerce, Bureau of Foreign and Domestic Commerce(1936, 1939).
RESULTS OF THE ANALYSIS
The analysis involves several steps. Given that many prior infant mortalitystudies have used cross-section regressions, the cross-sectional regressions forthe three time periods are reported. We lack measures of some of the variablesthat might have influenced infant mortality, such as public health expenditures,hospitals, or household sanitation practices. We know that public health expen-ditures and access to medical care were important factors, and these variedsubstantially across states. In the cross-sectional regressions state dummy vari-ables are included to control for differences in such variables as public healthspending, state relief programs, cost of living, and other factors that werecommon to all counties in each state.
The state dummies, however, cannot control for unmeasured differencesacross counties. Numerous econometric studies have shown that mistaken infer-ences can be drawn by not controlling for unmeasured heterogeneity across theobservations. As a step toward controlling for the unmeasured heterogeneityacross counties, we use two separate difference regressions, one for 1933–1935minus 1930–1932 and another for 1936–1939 minus 1930–1932. The differenceregression helps control for factors that remained constant within the samecounties over time but varied across counties. We are using 1930–1932 as a baseyear without New Deal programs for the comparisons. In essence, the difference
8 Using the average of retail sales in 1929 and 1933 to represent the retail sales in 1930–1932 doesnot change the qualitative results reported here.
105NEW DEAL AND INFANT MORTALITY

regressions are another method of controlling for fixed effects. We do not rundifferences for 1936–1939 and 1933–1935 because for some of the New Dealprograms like the PWA, which spent money in both time periods, we would haveto make assumptions about the timing of the distribution of the funds. Weavoided estimating the difference between 1936–1939 and 1933–1935 becausewe did not want our results to be driven by our assumptions about the timing ofthe New Deal spending.
Finally, we worried about potential simultaneity bias in the estimates of theNew Deal variables. That is, it is possible that increased infant mortality (or aslowing in the decline of infant mortality) might have been a signal used by NewDeal administrators to deliver more funds for relief and employment. Therefore,in all of the regressions we use instruments for the New Deal programs to controlfor possible endogeneity. The instruments are predictions from regressions witha variety of economic and political variables similar to the ones used in theliterature summarized by Wallis (1998) and Couch and Shughart (1998). Weestimated separate regressions for each program, with expenditures regressed onthe following socioeconomic and political variables (for 1930 unless otherwisespecified): the inverse of population, the percent black, the percent urban, thedecline in retail sales from 1929 to 1933, the ratio of tax returns filed in 1935 tothe population in 1930, the per capita value of farms, the percentage of land infarms, average farm size, the ratio of unemployed in 1930 to gainfully employedin 1930, the ratio of unemployed in 1937 to gainfully employed in 1930, meanand standard deviation of the percent voting Democrat from 1896 to 1932, thedifference between the percent voting for Roosevelt in 1932 and the mean from1896 to 1932, electoral votes per capita, percent voting in 1932, a series ofvariables describing representation on House committees during the 1930s, anda series of state dummy variables. We then used the predictions from theseequations as instruments for the New Deal programs in the infant mortalityregressions. The correlation between the instruments for the New Deal programsand the actual values are typically above 0.5, with the lowest correlation at about0.37.9 Since the instruments were all estimated using the same sets of correlates,we also examined the correlations between the instruments. The overwhelmingmajority of correlations were below 0.5 in absolute value. The highest correlationwas between FERA and CWA (0.73). There was a 0.73 correlation between theFERA and WPA, but they do not appear in the same equations.
The inclusion of the birth rate in the infant mortality equation also createspotential endogeneity problems. Demographers have found a positive relation-ship between infant deaths and birth rates, which could be explained as eitherreplacement or insurance (Haines, 1998b). As couples seek a target family size,a baby lost in infancy would be replaced with another child. Alternatively, some
9 The correlations between the instruments and the actual per capita funds in the programs areFERA (0.64), WPA (0.74), PWA (0.37), CWA (0.68), SSA aid to dependent children (0.73), AAAprograms (0.89), PWA housing (later USHA housing) (0.78).
106 FISHBACK, HAINES, AND KANTOR

TABLE 3Summary Statistics of Variables Used in the Difference Equations
Variables Mean Standard deviation
Infant mortality rates:Whites, 1930–1932 55.2 16.8Whites, 1933–1935 56.9 17.1Whites, 1936–1939 52.0 14.9Blacks, 1930–1932 89.9 37.7Blacks, 1933–1935 85.4 34.1Blacks, 1936–1939 79.1 26.7
General fertility rates:Whites, 1930–1932 93.1 34.5Whites, 1933–1935 90.4 33.2Whites, 1936–1939 91.0 32.5Blacks, 1930–1932 98.4 34.5Blacks, 1933–1935 100.2 42.8Blacks, 1936–1939 104.3 66.3
Percent black, 1930 38.2 18.0Percent black, 1940 36.7 18.2Percent illiterate, 1930 11.6 5.8Percent illiterate, 1940 10.9 4.8Percent urban, 1930 15.9 20.7Percent urban, 1940 17.9 20.9Percent foreign born, 1930 0.6 1.2Percent foreign born, 1940 0.5 1.0Percent rural-nonfarm, 1930 26.7 16.3Percent rural-nonfarm, 1940 27.5 16.6Retail sales per capita, 1929 179.6 93.9Retail sales per capita, 1933 88.1 48.6Retail sales per capita, 1935 115.7 63.8Retail sales per capita, 1939 149.0 81.3Per capita spending on New Deal programs:
Federal Emergency Relief Administration 12.9 17.4Civil Works Administration 4.9 2.8Public Works Administration, 1933–1935 7.0 35.5Agricultural Adjustment Administration,
1933–1935 14.4 12.0Works Progress Administration 18.2 15.3Agricultural Adjustment Administration,
1936–1937 8.6 6.1Aid to Dependent Children under Social
Security Administration 0.3 0.3PWA/USHA Housing Projects 0.1 1.5Public Works Administration, 1936–1939 6.2 17.8
Sources.For New Deal spending and demographic sources, see Table 2. Retail sales in 1933 and1935 are from U.S. Department of Commerce, Bureau of Foreign and Domestic Commerce (1936,1939). The infant mortality data are from U.S. Bureau of the Census (1934a, 1934b, 1934c, 1936a,1936b, 1937, 1938, 1939, 1940, 1941, 1942).
Note.Sample is restricted to southern counties.
107NEW DEAL AND INFANT MORTALITY

families may have had more children as insurance against the future loss of achild.10 To determine the relative effects of the birth rate variable, we haveestimated a reduced-form version of the mortality equations that did not includethe birth rate, and the results for the remaining variables, which are the focus ofthe study, are similar to those reported here.
Table 3 reports summary statistics of New Deal spending for the variousprograms and of the socioeconomic measures in 1930 and 1940 for the southernsample of 723 counties used in the difference regressions. Comparisons of thesouthern sample with national averages for all counties show that the percentblack and the percent illiterate are substantially higher in the southern sample.Meanwhile, nominal retail sales per capita, the percent foreign-born, the percenturban, and the percent rural-nonfarm were all substantially lower.
We ran OLS regressions and used White’s (1980) method to correct thestandard errors for potential heteroskedasticity. We chose OLS over a logittransformation of the infant mortality rate for ease of interpretation of thecoefficients. Using a logit transformation does not affect the statistical inferences.Tables 4 and 5 show the results of cross-section regressions for 1930–1932,1933–1935, and 1936–1939 for blacks and whites, respectively. The independentvariables explain roughly 36% of the variation in 1930–1932, 31% in 1933–1935, and 14% in 1936–1939 in the black cross-section regressions. In contrast,the percentage of variation explained for the white observations rises to 39% bythe last period.11 The percentages explained by the variables in the regression areactually impressive given that we could not obtain county-level information onmany factors that influence infant mortality, such as specific behaviors offamilies with small children, breast-feeding practices, use of hospitals, and accessto other forms of medical care.
Most of the results are consistent with expectations about how various factorsinfluence infant mortality. Black and white infant mortality rates were higher inareas where the illiteracy rate was higher, consistent with views that the absenceof education contributed to an environment where small children were subject togreater illness. Black and white infant mortality rates were also higher in urbanand rural nonfarm areas. It appears that in more densely settled regions theproblems of contagion and/or public health issues with people living closertogether were not overcome by extant sanitation practices or access to moredoctors in more populated areas.
We included a measure of retail sales per capita as a proxy for consumption in
10 Haines (1998b) estimated a replacement effect in the United States of between one-fourth toone-third of a child per child death. For more discussion of the issue, see the edited volume byMontgomery and Cohen (1998).
11 The R2 values in regressions with only the state dummies were 0.295 for blacks and 0.128 forwhites in 1930–1932, 0.144 for blacks and 0.0497 for whites in 1933–1935, and 0.078 for blacks and0.047 for whites in 1936–1939. TheR2 values in regressions with all of the variables except the statedummies are 0.139 for blacks and 0.069 for whites in 1930–1932, 0.232 for blacks and 0.146 forwhites in 1933–1935, and 0.104 for blacks and 0.324 for whites in 1936–1939.
108 FISHBACK, HAINES, AND KANTOR
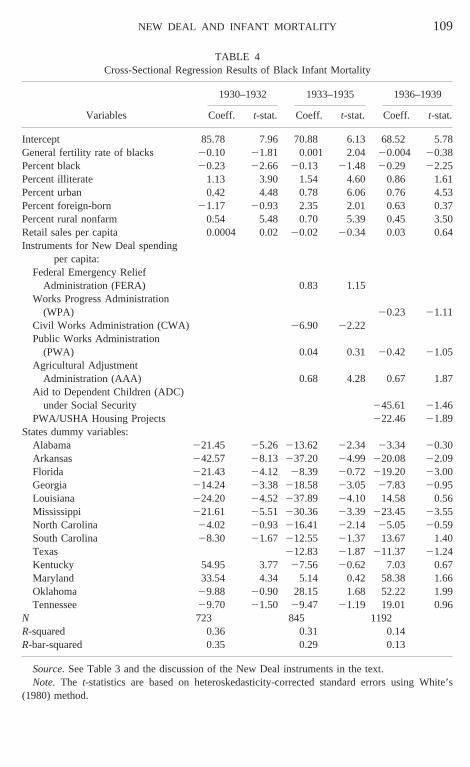
TABLE 4Cross-Sectional Regression Results of Black Infant Mortality
Variables
1930–1932 1933–1935 1936–1939
Coeff. t-stat. Coeff. t-stat. Coeff. t-stat.
Intercept 85.78 7.96 70.88 6.13 68.52 5.78General fertility rate of blacks 20.10 21.81 0.001 2.04 20.004 20.38Percent black 20.23 22.66 20.13 21.48 20.29 22.25Percent illiterate 1.13 3.90 1.54 4.60 0.86 1.61Percent urban 0.42 4.48 0.78 6.06 0.76 4.53Percent foreign-born 21.17 20.93 2.35 2.01 0.63 0.37Percent rural nonfarm 0.54 5.48 0.70 5.39 0.45 3.50Retail sales per capita 0.0004 0.0220.02 20.34 0.03 0.64Instruments for New Deal spending
per capita:Federal Emergency Relief
Administration (FERA) 0.83 1.15Works Progress Administration
(WPA) 20.23 21.11Civil Works Administration (CWA) 26.90 22.22Public Works Administration
(PWA) 0.04 0.31 20.42 21.05Agricultural Adjustment
Administration (AAA) 0.68 4.28 0.67 1.87Aid to Dependent Children (ADC)
under Social Security 245.61 21.46PWA/USHA Housing Projects 222.46 21.89
States dummy variables:Alabama 221.45 25.26 213.62 22.34 23.34 20.30Arkansas 242.57 28.13 237.20 24.99 220.08 22.09Florida 221.43 24.12 28.39 20.72 219.20 23.00Georgia 214.24 23.38 218.58 23.05 27.83 20.95Louisiana 224.20 24.52 237.89 24.10 14.58 0.56Mississippi 221.61 25.51 230.36 23.39 223.45 23.55North Carolina 24.02 20.93 216.41 22.14 25.05 20.59South Carolina 28.30 21.67 212.55 21.37 13.67 1.40Texas 212.83 21.87 211.37 21.24Kentucky 54.95 3.77 27.56 20.62 7.03 0.67Maryland 33.54 4.34 5.14 0.42 58.38 1.66Oklahoma 29.88 20.90 28.15 1.68 52.22 1.99Tennessee 29.70 21.50 29.47 21.19 19.01 0.96
N 723 845 1192R-squared 0.36 0.31 0.14R-bar-squared 0.35 0.29 0.13
Source.See Table 3 and the discussion of the New Deal instruments in the text.Note. The t-statistics are based on heteroskedasticity-corrected standard errors using White’s
(1980) method.
109NEW DEAL AND INFANT MORTALITY

TABLE 5Cross-Sectional Regression Results of White Infant Mortality
Variables
1930–1932 1933–1935 1936–1939
Coeff. t-stat. Coeff. t-stat. Coeff. t-stat.
Intercept 48.74 11.84 56.66 9.49 25.35 7.34General fertility rate of whites 0.01 0.51 20.02 20.93 0.14 10.29Percent black 20.07 21.46 20.17 23.42 20.09 22.18Percent illiterate 0.68 4.31 1.50 9.06 1.26 8.13Percent urban 0.18 3.39 0.24 3.49 0.36 6.99Percent foreign-born 22.80 24.17 0.28 0.46 3.03 8.80Percent rural nonfarm 0.02 0.38 0.07 1.17 0.17 4.37Retail sales per capita 0.01 1.16 0.00 0.18 0.01 0.75Instruments for New Deal spending
per capita:Federal Emergency Relief
Administration (FERA) 0.50 1.50Works Progress Administration (WPA) 20.11 22.08Civil Works Administration (CWA) 23.13 22.22Public Works Administration (PWA) 20.09 21.37 20.52 23.97Agricultural Adjustment Administration
(AAA) 0.09 1.76 0.12 1.75Aid to Dependent Children (ADC)
under Social Security 23.31 20.35PWA/USHA Housing Projects 28.61 22.20
State dummy variables:Alabama 28.34 22.95 28.82 22.44 26.83 21.88Arkansas 212.70 23.99 27.06 21.61 24.64 21.51Florida 23.35 21.17 210.79 21.83 215.64 26.41Georgia 21.70 20.73 21.92 20.57 23.66 21.42Louisiana 29.80 23.53 222.37 24.68 217.71 22.21Mississippi 212.47 24.78 211.13 22.35 26.82 22.85North Carolina 4.24 1.63 25.56 21.34 21.56 20.58South Carolina 21.93 20.64 24.79 20.98 2.39 0.68Texas 26.15 21.74 26.23 22.49Kentucky 4.11 1.18 28.83 21.61 0.91 0.34Maryland 13.48 3.27 26.24 21.09 21.31 20.12Oklahoma 210.09 22.40 21.84 20.38 3.12 0.40Tennessee 0.42 0.12 25.21 21.17 3.22 0.54
N 723 845 1192R-squared 0.19 0.20 0.39R-bar-squared 0.17 0.17 0.38
Source.See Table 3 and the discussion of the New Deal instruments in the text.Note. The t-statistics are based on heteroskedasticity-corrected standard errors using White’s
(1980) method.
110 FISHBACK, HAINES, AND KANTOR

these areas. Although many studies find an inverse relationship between socio-economic status and infant mortality, we cannot reject the hypothesis that retailsales had no effect in either the black or the white regression. We also includedthe variable percent black as one means of examining the impact of the blackgroup economy on infant mortality. A higher black percentage of the populationwas associated with lower black infant mortality rates. In the highly segregatedsouthern society, access to hospitals and medical care was subject to discrimi-nation. As the percentage black in a county rose, there was the potential for ahospital or public health services devoted to the black community that otherwisewould be unavailable in an area where there were relatively few blacks. It isinteresting to note that white infant mortality was also lower in areas with a largerpercent black population.12
We included a measure of the birth rate under the hypothesis that more birthsmight raise the probability of infant deaths by increasing the number of infantsat risk or by increasing pressure on the existing health-care network, holdingother factors constant. The positive relationship is present for blacks in 1933–1935 and for whites in 1936–1939, but in the remaining periods we could notreject the hypothesis of no effect.
We also included a series of state dummy variables to capture the effects offactors that were common to the counties in those states during that time period.Such factors might include state public health policies, cost of living differences,epidemics, and other factors. The results for all of the years show that there wassubstantial variation in infant mortality across the states, after holding the otherfactors constant. The differences across states were similar across time periodsand races, as the correlations of the coefficients of the state dummies from theregressions for different time periods ranged from a low of 0.46 between the statecoefficients in the black regressions for 1930–1932 and 1933–1935 to a high of0.72 between the black regressions for 1933–1935 and 1936–1939. The corre-lation of state coefficients across time in the white regressions ranged from a lowof 0.3 between the white state coefficients in 1930–1932 and in 1933–1935 to ahigh of 0.81 between the white state coefficients in 1933–1935 and 1936–1939.The correlation between the state coefficients in the black regressions and in thewhite regressions in the same year were relatively high at 0.78 in 1930–1932,0.57 in 1933–1935, and 0.44 in 1936–1939.
The cross-sectional regressions offer an initial look at the impact of key NewDeal spending programs while controlling for differences in state policies. We
12 There might be a couple of explanations for this result. First, it might be that the reduction ininfant mortality among blacks benefited whites by reducing the contagion of infant diseases,particularly in cases where black domestic servants were in daily contact with relatively high-incomewhites. A second potential explanation for why whites benefited when the black population washigher may be that income was distributed more unevenly in those counties. In other words, arelatively large black population in the South typically translated into relatively more farm tenants,sharecroppers, and wage laborers. Perhaps in such counties the white population was wealthier, whichmay have been manifest in lower infant mortality rates.
111NEW DEAL AND INFANT MORTALITY

are hesitant to put much emphasis on the New Deal results from the cross-sectional regressions because we believe that the inclusion of the state dummieshas not fully controlled for unmeasured heterogeneity across counties in thesample. One reason to report the cross-sectional results is to show how some ofthe statistical inferences change when we switch to a difference method thatcontrols for unmeasured factors that are constant for each county over the yearsbut vary across counties. The results in Tables 4 and 5 show that among the reliefprograms, the CWA was associated with statistically significant reductions ininfant mortality for blacks and whites, the FERA was associated with statisticallyinsignificant increases in infant mortality for both races, and the WPA loweredinfant mortality for both blacks and whites, although statistically significant onlyfor whites. The Social Security Administration’s Aid to Dependent Childrenprogram was associated with large reductions in infant mortality for blacks andwhites, but we cannot reject the hypothesis of no effect. The PWA’s publichousing program, later under the U.S. Housing Administration, also loweredinfant mortality. The PWA sewer projects and other public works projects hadstatistically insignificant and small effects in 1933–1935 and then was associatedwith lower infant mortality, particularly for whites, in 1936–1939. Finally, theAAA funds distributed to farmers in Rental and Benefit payments and later asConservation payments were associated with higher levels of infant mortality forboth blacks and whites in both 1933–1935 and 1936–1939.
Although we have controlled for differences in state policy in the cross-sectional regressions, there still may have been unmeasured heterogeneity acrosscounties that we have not controlled for at this point. Even within the same statethere may have been social differences in the birthing and raising of childrenacross counties. There certainly were unmeasured differences in the extent andreach of county health programs, and we can anticipate that epidemics or droughtconditions hit some counties in the same state harder than others. Therefore, weanalyzed the data again in difference form to try to control for the unmeasuredfactors that remained the same over the two time periods in each county butdiffered across counties. There are two sets of difference regressions, one setfocuses on the difference between infant mortality and the independent variablesbetween the periods 1930–1932 and 1933–1935 and the other focuses on thedifferences between the periods 1930–1932 and 1936–1939. The two sets ofdifference regressions contain different lists of New Deal programs becauseprograms like the FERA and the CWA essentially terminated by the end of 1935,while other programs were started after 1935. Some programs like the AAAcovered both periods.
In the difference regressions the differences in the percent black, illiterate,rural nonfarm, urban, and foreign-born between 1930–1932 and 1933–1935 andbetween 1930–1932 and 1936–1939 are essentially linear transformations of thetrends between 1930 and 1940. All monetary variables in the equation are incurrent dollars because the New Deal spending programs were spread overdifferent time periods. The consumer price index (19675 100) for the entire
112 FISHBACK, HAINES, AND KANTOR

United States fell 6.7% per year, from 51.3 in 1929 to 38.8 in 1933, rose 2.6%per year, to 43 in 1937, and then fell 0.8% per year, to 42 in 1940 (U.S. Bureauof Census, 1975, series E-135, pp. 210–211).
As is typically the case, theR2 values and adjustedR2 values are substantiallylower in the difference regressions reported in Tables 6 and 7 than in thecross-sectional regressions in Tables 4 and 5. In the cross-sectional regressions,illiteracy, percent black, percent urban, and percent rural nonfarm had strong andstatistically significant effects. In the difference regressions, we cannot reject thehypothesis of no effect. There are two potential reasons for the difference in theseeffects. One possibility is that the illiteracy, urbanization, and percent blackcoefficients in the cross-section regressions were correlated with unmeasuredfeatures, like sanitation and public health programs, that influenced infant mor-tality. Thus, the coefficients in the cross-section regressions might have reflectedthe bias of omitting the unmeasured variables. A second possibility is that therewas very little variation in the percent illiterate, percent urban, and percent black
TABLE 6Difference-Regression Results of Black and White Infant Mortality, 1936–1939 minus 1930–1932
Variables
Black White
Black differenceminus whitedifference
Coeff. t-stat. Coeff. t-stat. Coeff. t-stat.
Intercept 210.53 22.20 218.01 22.82 11.78 1.75General fertility rate of blacks 0.03 1.28 0.01 0.75General fertility rate of whites 0.14 1.94 20.17 23.08Percent black 1.24 1.59 0.56 1.23 0.78 0.91Percent illiterate 20.07 20.13 0.10 0.27 20.26 20.46Percent urban 0.39 0.82 20.09 20.34 0.50 0.95Percent foreign-born 23.53 20.59 23.41 21.02 0.57 0.10Percent rural nonfarm 0.17 0.4620.10 20.45 0.26 0.62Retail sales per capita 20.04 20.89 0.00 20.16 20.03 20.76Instruments for New Deal spending
per capita:Works Progress Administration (WPA) 20.05 20.39 0.13 2.24 20.16 21.25Public Works Administration (PWA) 20.81 22.37 20.16 21.02 20.65 21.82Agricultural Adjustment Administration
(AAA) 20.24 20.74 0.13 0.99 20.35 21.07Aid to Dependent Children (ADC)
under Social Security 9.00 1.6321.58 20.72 10.44 1.91PWA/USHA Housing Projects 2.81 0.54 0.62 0.22 0.87 0.17
N 723 723R-squared 0.02 0.08 0.04R-bar-squared 0.00 0.07 0.02
Source.See Table 3 and the discussion of the New Deal instruments in the text.Note. The t-statistics are based on heteroskedasticity-corrected standard errors using White’s
(1980) method.
113NEW DEAL AND INFANT MORTALITY
between 1930 and 1940. The correlations between 1930 and 1940 for the sampleof 722 counties was 0.99 for percent black, 0.84 for percent illiterate, 0.97 forpercent urban, 0.97 for percent foreign-born, and 0.92 for percent rural nonfarm.Thus, much of the variation in the cross section for these variables is eliminatedby the differencing method.
When looking at the impact of the New Deal, however, we can eliminate thesecond possibility that there was little variation in New Deal spending becausethere was no spending until 1933 in the programs we examine and the amountsspent varied tremendously across counties. Therefore, the primary reason fordifferences between the econometric results for the cross sections and thedifference regressions for the New Deal program will be driven by our controlsfor unmeasured heterogeneity across counties in the difference regressions.
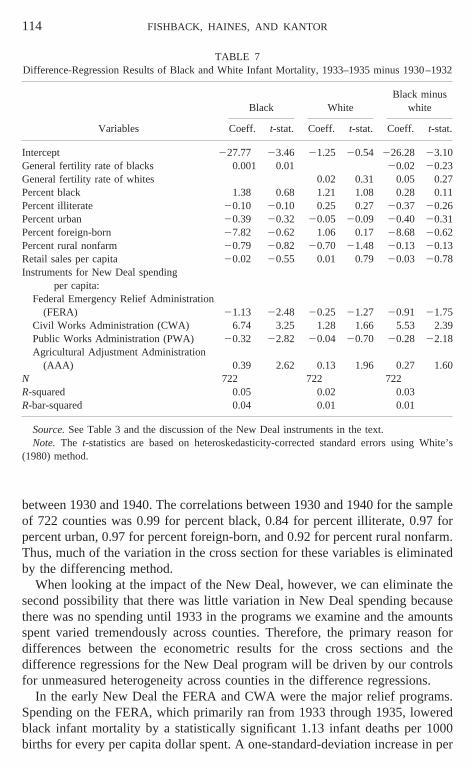
In the early New Deal the FERA and CWA were the major relief programs.Spending on the FERA, which primarily ran from 1933 through 1935, loweredblack infant mortality by a statistically significant 1.13 infant deaths per 1000births for every per capita dollar spent. A one-standard-deviation increase in per
TABLE 7Difference-Regression Results of Black and White Infant Mortality, 1933–1935 minus 1930–1932
Variables
Black WhiteBlack minus
white
Coeff. t-stat. Coeff. t-stat. Coeff. t-stat.
Intercept 227.77 23.46 21.25 20.54 226.28 23.10General fertility rate of blacks 0.001 0.01 20.02 20.23General fertility rate of whites 0.02 0.31 0.05 0.27Percent black 1.38 0.68 1.21 1.08 0.28 0.11Percent illiterate 20.10 20.10 0.25 0.27 20.37 20.26Percent urban 20.39 20.32 20.05 20.09 20.40 20.31Percent foreign-born 27.82 20.62 1.06 0.17 28.68 20.62Percent rural nonfarm 20.79 20.82 20.70 21.48 20.13 20.13Retail sales per capita 20.02 20.55 0.01 0.79 20.03 20.78Instruments for New Deal spending
per capita:Federal Emergency Relief Administration
(FERA) 21.13 22.48 20.25 21.27 20.91 21.75Civil Works Administration (CWA) 6.74 3.25 1.28 1.66 5.53 2.39Public Works Administration (PWA) 20.32 22.82 20.04 20.70 20.28 22.18Agricultural Adjustment Administration
(AAA) 0.39 2.62 0.13 1.96 0.27 1.60N 722 722 722R-squared 0.05 0.02 0.03R-bar-squared 0.04 0.01 0.01
Source.See Table 3 and the discussion of the New Deal instruments in the text.Note. The t-statistics are based on heteroskedasticity-corrected standard errors using White’s
(1980) method.
114 FISHBACK, HAINES, AND KANTOR

capita FERA spending of $17.35 would have been associated with a reduction inblack infant mortality of nearly 20 deaths per 1000, which would have cut theblack infant mortality rate to nearly the level of white infant mortality. Spendingon the FERA also had a negative effect on white infant mortality, but the effectwas much smaller and not statistically significant.13
The reductions in infant mortality associated with FERA spending weresomewhat offset by increases in infant mortality associated with Civil WorksAdministration spending on work relief between November 1933 and April 1934.In the difference regressions in Table 7, the CWA effect is positive and statis-tically significant at the 10% level for both blacks and whites. Further, CWAspending had a larger effect on black infant mortality than on white infantmortality.
The WPA, the major work relief program of the later New Deal, had astatistically insignificant and small negative effect on black infant mortality anda positive and statistically significant effect on white infant mortality. Thedifference in the impact between the FERA, the CWA, and the WPA may havebeen driven by the explicit goals of the programs. The FERA had both directrelief and work relief components to it, while the CWA was specifically focusedon work relief. Williams (1968, pp. 120, 130) notes that the FERA useddeficiencies in the families’ budgets to determine the eligibility of recipients foreither work or direct relief as well as the number of hours that recipients couldwork. Further, many of the FERA rules for projects and work opportunitieslimited relief opportunities for more highly skilled and employable workers, andthus targeted more low-income people. In contrast, even though the CWA waslargely administered by FERA administrators, the CWA basically followed therules established for work on PWA projects, and half of the CWA workers,though unemployed, were without relief status. When the WPA was establishedin the latter half of 1935, the WPA explicitly focused on work relief and leftresponsibility for the “unemployables” to state and local governments. Familieswith an employable member, even if unemployed at the time, were likely to havemore resources than those eligible for direct relief. Thus, it appears that theFERA offered more benefits to the types of families with the least resources, andthus, the funds were directed to families where infant health was likely mostthreatened.
The Public Works Administration was less oriented toward work relief thanthe building of public works projects, which included a significant number ofsewage treatment plants in smaller cities. The PWA has a negative and statisti-cally significant effect on black infant mortality in both time periods, and theeffect strengthens over time. An additional dollar of PWA spending in 1933–
13 We experimented with including interactions between the percent urban and the New Dealvariables because Sterner (1943) had suggested that the relative share of relief spending for blackswas higher in urban areas than in rural areas. However, none of the interaction terms were statisticallysignificant and most of the other results were unaffected.
115NEW DEAL AND INFANT MORTALITY

1935 was associated with a statistically significant reduction of about one-thirdof a death per 1000 births in black infant mortality. The effect is even strongerin 1936–1939 at a reduction of 0.8 of a death per 1000 births. In both periods thePWA had a small negative and statistically insignificant association with whiteinfant mortality. Thet-tests in the black minus white regressions imply that thePWA had a more beneficial impact on infant mortality for blacks than for whites.The strength of the PWA effect is probably more from the building of sewagefacilities and other public works than from the work relief provided. The PWAtended to be more focused on skilled workers, whose families were more likelyto be at income levels where the risk of infant mortality was diminished. In fact,the stronger reductions in infant mortality in 1936–1939 than in 1933–1935 areconsistent with a strong lagged effect of the PWA. The effects of better sanitationand public works were not likely to take effect until the later period, after theprojects had been finished and put into operation. The results here are alsoconsistent with earlier results by Werner Troesken, who found that black mor-tality due to typhoid and other water-borne diseases was sharply reduced by thedevelopment of public water treatment plants at the turn of the century (Troes-ken, 1999).
At the end of 1935 the Public Works Administration began building a seriesof public housing projects for the poor that were later administrated by the U.S.Housing Administration. Although these public housing projects have marredreputations today, projects like Techwood in Atlanta and projects in Birminghamappeared more promising when new. While we would anticipate that improvedhousing for the poor would reduce infant mortality, we cannot reject the hypoth-esis of no effect in the difference regressions. It may have been that the housingwas not sufficiently better to have made a difference. It is possible that New Dealadministrators chose families to live in the new projects with an eye towardensuring the success of the project and thus did not populate them with the typesof families for whom infant mortality was a problem. Or dislocations from thehousing torn down to build the new housing might have offset any salutaryeffects.
The Social Security Administration’s aid to dependent children (ADC) pro-gram was the primary program in the later New Deal targeted specifically forchildren. The impact of ADC spending was negative, although not statisticallysignificant, for whites, and positive and large, but statistically insignificant, forblacks. We have no definitive explanation for why ADC spending did not lowerinfant mortality for either blacks or whites. The amount spent per person wassmall relative to the relief programs, and most of the spending came late in theNew Deal, after the long-term downward trend for infant mortality had beenreestablished.
The major agricultural spending program we examine is the AgriculturalAdjustment Administration’s payments to farmers. Although the AAA paymentswere supposed to go to farm owners, croppers, and tenants, Warren Whatley(1983) has suggested that the owners relegated a number of tenants and croppers
116 FISHBACK, HAINES, AND KANTOR

to wage labor status, as they sought to obtain a larger share of the AAA paymentsfor themselves. Thus, even though the AAA brought more income into thecounties, there is the possibility that the AAA may have engendered an incomeredistribution that left croppers and tenants in a worse income position thanbefore. The results here are consistent with this hypothesis, particularly in the1933–1935 period. In this period, AAA spending was associated with higherinfant mortality for both blacks and whites. After the AAA was reorganized inresponse to the Supreme Court decision declaring the program unconstitutional,the effects on infant mortality are no longer statistically significant in either theblack or white regressions. The absence of the effect in the 1936–1939 periodmay have been the result of a change in the attentiveness of the AAA toprotecting tenant rights. Whatley (1983, p. 927) claims that by 1936 and 1938 theshare of benefits going to tenants had increased, thus lower-income groups mighthave shared in the benefits of the AAA, which in turn would have meant theAAA would have helped contribute to lowering infant mortality. Another pos-sible interpretation of the results is that the damage to croppers and tenants hadalready been done in the earlier period, so the AAA neither degraded the situationfurther nor made it better.
In comparisons of the cross-sectional regressions and the difference regres-sions, we see some substantial swings in the estimated coefficients on the NewDeal programs. The most striking are the reversal of the effect of the CWA fromlowering infant mortality to raising it and the switch from a strong loweringeffect of the PWA/USHA housing projects to a statistically insignificant effect.There was also a switch in sign for the ADC coefficient in the black regressions,although none of the coefficients in the tables were statistically significant. Webelieve that the changes in the results as we move from the cross-sectional to thedifference analysis are the result of inadequate accounting for unmeasuredheterogeneity across counties in the cross-sectional regressions.
So what was the source of this heterogeneity? There appears to have been anegative omitted-variables bias. We are looking for unmeasured factors thatwould have been negatively associated with lower infant mortality but at thesame time positively correlated with per capita spending on the CWA, the ADC,and PWA/USHA. We can only speculate, but one possible factor is the variationin the strength of local relief networks. Williams (1968) and Howard (1943)argue that there was substantial variation in the strength and extent of local reliefnetworks. The networks were an agglomeration of people, churches, privategroups, and local government programs. The stronger and more established localrelief networks were in a better position to seek out families and help them obtainaccess to benefits. Such help would be extremely important in notifying familiesof the possibilities of new programs like the ADC program. These networks alsoplayed an important role in creating and lobbying for projects to attract moreNew Deal funds. These more established and successful groups might havealready had more success in combating problems that led to infant mortality andat the same time may have had more success in helping families obtain funds and
117NEW DEAL AND INFANT MORTALITY

in attracting New Deal projects. The combination potentially creates the negativecorrelation with infant mortality and the positive association with New Dealfunds that led to the negative bias in the cross-sectional regressions.
The FERA situation is one where there was a swing from essentially no effecton infant mortality to a negative and statistically significant one. This swingsuggests a positive bias in the FERA coefficient that might have been driven byunmeasured factors that are positively associated with the FERA as well as withinfant mortality. Given that the FERA spending included direct relief to familieswith “unemployable” household heads, it is possible that FERA spending wastargeted at long-term pockets of poverty. Such pockets of poverty might havegone unmeasured by an average income proxy like retail sales per capita, whichcaptures the average in the county but not a highly unequal distribution of incomethat might be associated with a significant group with high incomes and anothergroup with low incomes. Thus, the combination of a long-term pocket of povertyattracting FERA funds and the association of higher infant mortality with suchpoverty in the county might have led to a positive bias in the FERA coefficientin the cross-sectional regressions.
Although the coefficients for blacks and whites have been discussed sepa-rately, one of the issues we would like to address is the difference in accessto New Deal funds for blacks and whites. Our metric here is the comparisonsof how black and white infant mortality responded to New Deal programs.The far right columns of Tables 6 and 7 report the results of estimating adifference-in-difference analysis for blacks and whites. The dependent vari-able is thedifference in black infant mortality rates minus the difference in whiteinfant mortality rates. The advantage of the difference-in-difference analysis isthat the t-tests on the per capita New Deal spending coefficients are directstatistical tests of the hypothesis that the impact on black and white infantmortality was the same. The results suggest that all but two of the programs wereat worst nondiscriminatory and sometimes even benefited black families morethan white families, at least from the perspective of infant mortality. The FERAand the PWA appear to have reduced infant mortality more for blacks than forwhites. We cannot reject the hypothesis of no difference in the effects of theAAA and the WPA. The CWA was associated with even higher infant mortalityfor blacks than for whites, although it was unexpected to see a positive associ-ation for both.
The difference in the effect of ADC was statistically significant and morepositive for blacks than for whites. On the other hand, the ADC coefficient in theblack–white difference equation in Table 6 is positive and statistically significant.This finding is consistent with Robert Lieberman’s (1998, pp. 118–120) andRichard Sterner’s (1943, pp. 281–285) findings that blacks had less access toADC benefits than did poor whites and that blacks received lower amounts perchild on average. Yet this is an odd situation because whites appear to havereceived a greater share of the ADC benefits, yet the infant mortality rates of
118 FISHBACK, HAINES, AND KANTOR

whites were not reduced much if at all by additional spending on aid to dependentchildren.
CONCLUSIONS
During the worst depression in American economic history, black and whiteinfant mortality rates continued to decline except for a slight blip upward in1933–1934. Normally, we might anticipate that such a large economic disloca-tion that lasted a decade would have manifested itself in a more substantial risein infant mortality rates. The results of our analysis suggest that the New Dealhad a mixed effect on the secular decline in infant mortality rates. The combi-nation of direct relief and work relief administered by the FERA was associatedwith lower infant mortality. The PWA programs appear to have lowered infantmortality through the building of large numbers of sewage facilities throughoutthe United States and by providing extra employment in communities. Not all ofthe relief programs were associated with lower infant mortality, however. Thefocus of the CWA and the WPA on “employables” may have limited the impactof work relief on infant mortality. Neither Aid to Dependent Children nor thePWA Housing projects had any statistically measurable effect.
On the other hand, the AAA, which put substantial amounts of income into thehands of farmers, was associated with higher infant mortality. The incentivesestablished by the AAA, which led landowners to transfer the status of tenantsand croppers to wage workers, may have led to a decline in income for somefamilies that increased the likelihood of infant mortality.
It is important to note, however, that over the course of the decade infantmortality continued to follow a long-term trend that had been established inearlier decades. Despite the small jumps upward in 1933 and 1934, the declinein infant mortality proceeded at a fairly rapid pace through the end of the decade.Thus, the specific New Deal programs that had had some success in contributingto the reductions in infant mortality were only a subset of the factors that explainthe continued decline.
Several New Deal agencies claimed that they sought to avoid racial discrim-ination in the provision of employment and benefits. On the other hand, scholarssuch as Joseph Lieberman (1998) have argued that some programs, largely runby administrators from the local community, appear to have been activelydiscriminating against blacks. Our metric for testing the extent of discriminationwas to determine the relative impact of the programs on infant mortality forblacks and whites. Many of the programs appear to have been nondiscriminatory.Some, like the FERA’s combination of direct and work relief and the PWA’ssanitation works and other public works, even lowered black infant mortalitymore than they lowered white infant mortality. On the other hand, the CWA workrelief programs and the relief to children under the Social Security Administra-tion’s ADC program seem to have been associated with relatively higher infantmortality for blacks and whites. In the final analysis we cannot say that the NewDeal as a whole was discriminatory or nondiscriminatory. Any effects describing
119NEW DEAL AND INFANT MORTALITY

the aggregate New Deal would cover the differences that we see program byprogram.
REFERENCES
Anderson, G. M., and Tollison, R. D. (1991), “Congressional Influence and Patterns of New DealSpending, 1933–1939.”Journal of Law and Economics34, 161–175.
Antonovsky, A., and Bernstein, J. (1977), “Social Class and Infant Mortality,”Social Science andMedicine11, 453–470.
Bremner, R. H. (Ed.) (1971),Child and Youth in America: A Documentary History. Volume II:1866–1932.Cambridge, MA: Harvard Univ. Press.
Carson, C. L. (1994), “And the Results Showed Promise . . .Physicians, Childbirth, and SouthernBlack Migrant Women, 1916–1930; Pittsburgh as a Case Study,”Journal of American EthnicHistory 14, 32–64.
Clifford, W. B., and Brannon, Y. S. (1978), “Socioeconomic Differentials in Infant Mortality: AnAnalysis Over Time,”Public Use Data6, 29–37.
Couch, J. F., and Shughart, W. II (1998),The Political Economy of the New Deal.New York: EdwardElgar.
Easterlin, R. A. (1996),Growth Triumphant: The Twenty-First Century in Historical Perspective.Ann Arbor, MI: Univ. of Michigan Press.
Federal Works Agency (1940),First Annual Report, 1940.Washington, DC: U.S. Govt. PrintingOffice.
Fleck, R. K. (1994), “Essays on the Political Economy of the New Deal.” Unpublished Ph.D. thesis,Stanford University.
Fordyce, E. J. (1976/1977), “Early Mortality Measures as Indicators of Socio-Economic Well-Beingfor Whites and Non-Whites: A Re-Appraisal.”Sociology and Social Research61, 125–137.
Haines, M. R. (1998a), “Estimated Life Tables for the United States, 1850–1910.”HistoricalMethods31, 149–169.
Haines, M. R. (1998b), “The Relationship between Infant and Child Mortality and Fertility: SomeHistorical and Contemporary Evidence for the United States.” In Mark R. Montgomery andBarney Cohen (Eds.),From Death to Birth: Mortality Decline and Reproductive Change.Washington, DC: National Academy Press, 227–253.
Haines, M. R. (2000), “The Population of the United States, 1790–1920.” In Stanley Engerman andRobert Gallman, (Eds.),The Cambridge Economic History of the United States, Volume II.NewYork: Cambridge Univ. Press, Chap. 4.
Higgs, R. (1977),Competition and Coercion.New York: Cambridge Univ. Press.Howard, D. S. (1943),The WPA and Federal Relief Policy.New York: Russell Sage Foundation.ICPSR (Inter-University Consortium for Political and Social Research), “Historical, Demographic,
Economic, and Social Data: The United States, 1790–1970,” tape 0003, as corrected by MichaelHaines, Department of Economics, Colgate University, Hamilton, NY.
ICPSR, “United States Historical Election Returns, 1824–1968,” tape 0001.Kousser, J. M. (1974),The Shaping of Southern Politics: Suffrage Restriction and the Establishment
of the One-Party South, 1880–1910.New Haven, CT: Yale Univ. Press.Lieberman, R. C. (1998),Shifting the Color Line: Race and the American Welfare State.Cambridge,
MA: Harvard Univ. Press.Lindenmeyer, K. (1997),A Right to Childhood: The U.S. Children’s Bureau and Child Welfare,
1912–1946.Urbana, IL: Univ. of Illinois Press.Linder, F. E., and Grove, R. D. (1947),Vital Statistics Rates in the United States, 1900–1940.
Washington, DC: U.S. Govt. Printing Office. Tables 26 and 28.Margo, R. A. (1990),Race and Schooling in the South, 1890–1940.Chicago: Univ. of Chicago Press.Meckel, R. A. (1990),“Save the Babies”: American Public Health Reform and the Prevention of
Infant Mortality, 1850–1929.Baltimore: Johns Hopkins Univ. Press.
120 FISHBACK, HAINES, AND KANTOR

Montgomery, M. R., and Cohen, B. (Eds.) (1998),From Death to Birth: Mortality Decline andReproductive Change.Washington, DC: National Academy Press.
National Center for Health Statistics (1996),Vital Statistics of the United States, 1992, Vol. II,“Mortality,” Part A. Washington, DC: Public Health Service. Table 2-2.
National Center for Health Statistics (1999), “Deaths: Final Data for 1997.”National Vital StatisticsReports,47,(19) (June 30).
Preston, S. H., and Haines, M. R. (1991),Fatal Years: Child Mortality in Late Nineteenth CenturyAmerica.Princeton, NJ: Princeton Univ. Press.
Public Works Administration (1939),America Builds: The Record of the PWA.Washington, DC:U.S. Govt. Printing Office.
Ransom, R., and Sutch, R. (1977),One Kind of Freedom: The Economic Consequences of Eman-cipation.New York: Cambridge Univ. Press.
Steckel, R. H. (1986), “A Peculiar Population: The Nutrition, Health, and Mortality of AmericanSlaves from Childhood to Maturity.”Journal of Economic History46, 721–741.
Sterner, R. (1943),The Negro’s Share: A Study of Income, Consumption, Housing, and PublicAssistance.New York: Harper and Brothers.
Troesken, W. (1999), “Race, Disease, and the Provision of Water in American Cities, 1889–1921.”Unpublished working paper, Department of History, Univ. of Pittsburgh.
U.S. Bureau of the Census (1934a),Birth, Stillbirth, and Infant Mortality Statistics for the BirthRegistration Area of the United States, 1930,16th Annual Report. Washington, DC: U.S. Govt.Printing Office.
U.S. Bureau of the Census (1934b),Birth, Stillbirth, and Infant Mortality Statistics for the BirthRegistration Area of the United States, 1931,17th Annual Report. Washington, DC: U.S. Govt.Printing Office.
U.S. Bureau of the Census (1934c),Birth, Stillbirth, and Infant Mortality Statistics for the BirthRegistration Area of the United States, 1932,18th Annual Report. Washington, DC: U.S. Govt.Printing Office.
U.S. Bureau of the Census (1936a),Birth, Stillbirth, and Infant Mortality Statistics for the Conti-nental United States, The Territory of Hawaii, and the Virgin Islands, 1933.19th First AnnualReport. Washington, DC: U.S. Govt. Printing Office.
U.S. Bureau of the Census (1936b),Birth, Stillbirth, and Infant Mortality Statistics for the Conti-nental United States, The Territory of Hawaii, and the Virgin Islands, 1934.20th Annual Report.Washington, DC: U.S. Govt. Printing Office.
U.S. Bureau of the Census (1937),Birth, Stillbirth, and Infant Mortality Statistics for the ContinentalUnited States, The Territory of Hawaii, and the Virgin Islands, 1935,21st Annual Report.Washington, DC: U.S. Govt. Printing Office.
U.S. Bureau of the Census (1938),Birth, Stillbirth, and Infant Mortality Statistics for the ContinentalUnited States, The Territory of Hawaii, and the Virgin Islands, 1936,22nd Annual Report.Washington, DC: U.S. Govt. Printing Office.
U.S. Bureau of the Census (1939),Birth, Stillbirth, and Infant Mortality Statistics for the ContinentalUnited States, The Territory of Hawaii, and the Virgin Islands, 1937,23rd Annual Report.Washington, DC: U.S. Govt. Printing Office.
U.S. Bureau of the Census (1940),Birth, Stillbirth, and Infant Mortality Statistics for the ContinentalUnited States, The Territory of Hawaii, and the Virgin Islands, 1938,24th Annual Report.Washington, DC: U.S. Govt. Printing Office.
U.S. Bureau of the Census (1941),Birth, Stillbirth, and Infant Mortality Statistics for the ContinentalUnited States, The Territory of Hawaii, and the Virgin Islands, 1939,25th Annual Report.Washington, DC: U.S. Govt. Printing Office.
U.S. Bureau of the Census (1942),Birth, Stillbirth, and Infant Mortality Statistics for the ContinentalUnited States, The Territory of Hawaii, and the Virgin Islands, 1940,26th Annual Report.Washington, DC: U.S. Govt. Printing Office.
121NEW DEAL AND INFANT MORTALITY

U.S. Bureau of the Census (1975),Historical Statistics of the United States: Colonial Times to 1970.Washington, DC: U.S. Govt. Printing Office.
U.S. Bureau of the Census (1948), “Illiteracy in the United States, October 1947,” Current PopulationReports: Population Characteristics, Series P-20, no. 20. Washington, DC: U.S. Bureau of theCensus.
U.S. Children’s Bureau (1930), “Eighteenth Annual Report of the Children’s Bureau.” Washington,DC: U.S. Bureau of the Census.
U.S. Department of Commerce, Bureau of Foreign and Domestic Commerce (1936),ConsumerMarket Data Handbook, 1936.Washington, DC: U.S. Govt. Printing Office.
U.S. Department of Commerce, Bureau of Foreign and Domestic Commerce (1939),ConsumerMarket Data Handbook, 1939.Washington, DC: U.S. Govt. Printing Office.
U.S. Office of Government Reports, Statistical Section (1940), Report No. 10, Volume 1, “CountyReports of Estimated Federal Expenditures March 4, 1933–June 30, 1939.” [Mimeo].
Waldmann, R. J. (1992), “Income Distribution and Infant Mortality.”Quarterly Journal of Econom-ics 107,1284–1302.
Wallis, J. J. (1984), “The Birth of the Old Federalism: Financing the New Deal, 1932–1940.”Journalof Economic History44, 139–159.
Wallis, J. J. (1998), “The Political Economy of New Deal Spending Revisited, Again: With andWithout Nevada.”Explorations in Economic History35, 140–170.
Whatley, W. (1983), “Labor for the Picking: The New Deal in the South.”Journal of EconomicHistory 43, 905–929.
White, H. (1980), “A Heteroskedasticity-Consistent Covariance Matrix Estimator and a Direct Testfor Heteroskedasticity.”Econometrica48, 817–838.
Williams, E. A. (1968),Federal Aid for Relief.New York: AMS Press. [Reprint]Woodbury, R. M. (1926),Infant Mortality and Its Causes.Baltimore: Williams and Wilkins Co.Wright, G. (1974), “The Political Economy of New Deal Spending: An Econometric Analysis.”
Review of Economics and Statistics56, 30–38.
122 FISHBACK, HAINES, AND KANTOR