The Impact of the Government Shutdown Tennessee Short 2022 t
13
• Union membership in each state during 2009 and 2010 • Tennessee Historical Civilian Labor Force Series, 1980 to Present • County Unemployment Rates • Civilian Labor Force Summary • State Unemployment Insurance Activities Inside This Issue: The Impact of the Government Shutdown Department of Labor and Workforce Development Tennessee’s growth rate from the first quarter of 2020 to the first quarter of 2022 is expected to be positive, but slow to 0.4 percent, compared to the previous two-year projections of 2 percent growth. The continuing pandemic significantly slowed growth in 2020, especially in sev- eral industry sectors. These short-term projections include not only non-farm employment, but also esti- mates of agricultural employment and the self-employed. The number of self- employed is expected to increase through 2022, as during higher rates of unemployment more workers are operat- ing their own businesses. Total employ- ment during this period is expected to increase from 3,362,260 to 3,376,400, cre- ating new job growth of 14,140. From the first quarter of 2020 to 2022, the non-farm industry sectors forecast to grow the most rapidly include transporta- tion and warehousing (4.6 percent); con- struction (2.5 percent); professional, sci- entific, and technical services (2.5 per- cent); and information (2.4 percent). Indi- viduals sequestering at home and in- creasing their online purchasing are ex- pected to continue to boost transporta- tion and warehousing. Renovations of existing homes as well as new residential building will continue to spur construc- tion. Employment in the information sec- tor will continue growth as new technolo- gies continue to develop to aid domestic and worldwide communication. Industries which lost significant employ- ment during 2020, including manufactur- ing and arts, entertainment, and recrea- tion, are not expected to recover to the level of employment of the first quarter of 2020 by early 2022. Manufacturing employment 1 , significantly impacted by declines in the transportation equipment manufacturing sector, is expected to be about five percent less. Stimulus spend- ing could improve the outlook. The three major occupational groups ex- pected to have the most new jobs are transportation and material moving (7,310), management (3,500), and con- struction (2,700). Due to the demand for online ordering, top transportation jobs will include heavy and tractor-trailer truck drivers and light truck and delivery drivers, as well as industrial truck and tractor op- erators working in warehouses. In con- struction, jobs with the largest number of openings expected include construction laborers, electricians, supervisors, carpen- ters, helpers, and operating engineers. Although production worker employment overall is expected to decline, there will be significant numbers of openings for metal workers and plastics workers (4,470) and assemblers and fabricators (3,220) due to large numbers of employees exiting these fields. Projected to be among the fastest growing non-farm occupational groups are legal employees (3 percent growth), computer and mathematical employees (2.6 percent) and transportation and material moving employees (2.6 percent). Agricultural em- ployment is also expected to grow by more than two percent. Most occupational openings are due to people leaving the occupation through transfers and exits (separations) rather than growth. In 2019- 21, healthcare practitioners and technical occupations were expected to have 28,870 openings. Although the healthcare indus- try is expected to have a lower growth rate in 2020-22, 25,800 openings are still ex- pected, due to significant numbers of em- ployee separations. Further information about Tennessee’s short-term industry and occupational pro- jections can be found in the labor market information tab at jobs4tn.gov. 1 Tennessee merchandise exports declined by 35 per- cent in the first nine months of 2020. Boyd Center for Business and Economic Research. An Economic Report to the Governor of the State of Tennessee, p. 32 Tennessee Short-Term Projections, 2020-2022 Highlights Pages 1-3 The 2020-2022 Tennessee short-term projections Page 4 A directory of articles for every month in 2020 Page 5 The annual average nonfarm employment rates and the not seasonally adjusted monthly labor force data Pages 6-11 Monthly nonfarm employment, long -term graphs of the unemployment and a brief explanation for each major MSA in Tennessee Page 12 Monthly nonfarm employment for each small MSA in Tennessee Page 13 The monthly consumer price index and wages by industries for production workers Fastest Growing Occupations Most Rapidly Growing Industries
Transcript of The Impact of the Government Shutdown Tennessee Short 2022 t

• Union membership in each state during 2009 and 2010
• Tennessee Historical Civilian Labor Force Series, 1980 to Present
• County Unemployment Rates
• Civilian Labor Force Summary
• State Unemployment Insurance Activities
Inside This Issue:
The Impact of the Government Shutdown
De
pa
rtm
en
t o
f L
ab
or
an
d W
ork
forc
e D
eve
lop
me
nt
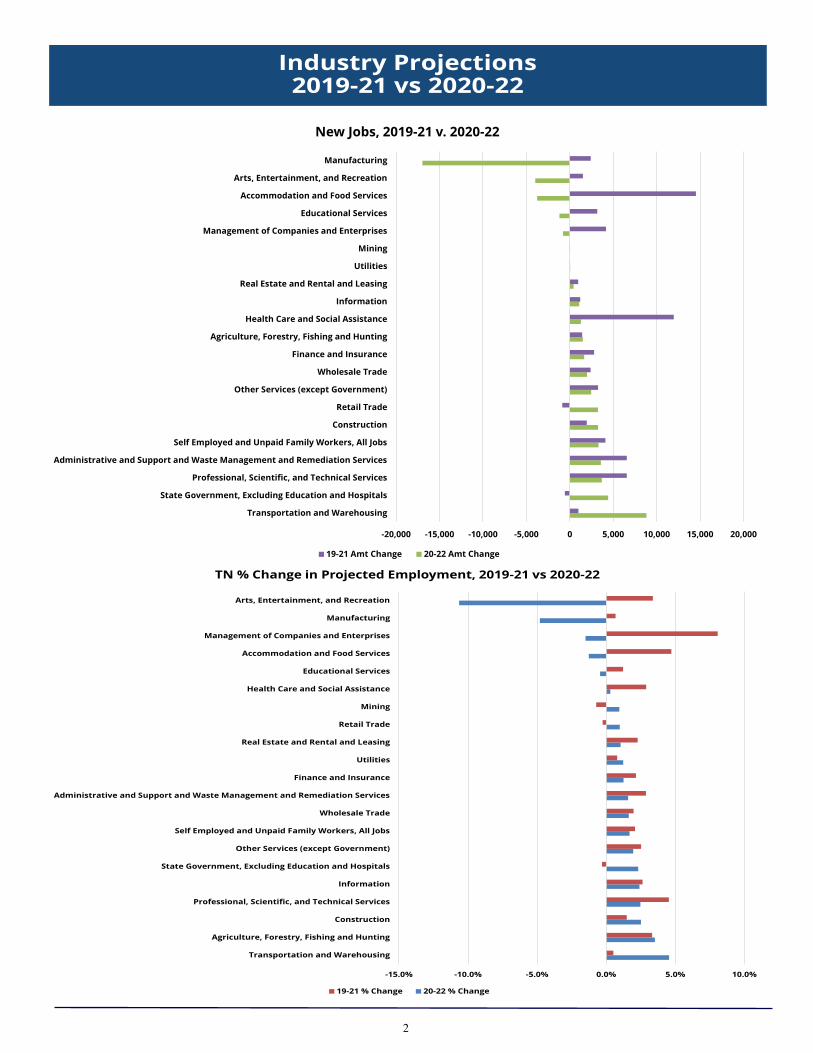
Tennessee’s growth rate from the first quarter of 2020 to the first quarter of 2022 is expected to be positive, but slow to 0.4 percent, compared to the previous two-year projections of 2 percent growth. The continuing pandemic significantly slowed growth in 2020, especially in sev-eral industry sectors. These short-term projections include not only non-farm employment, but also esti-mates of agricultural employment and the self-employed. The number of self-employed is expected to increase through 2022, as during higher rates of unemployment more workers are operat-ing their own businesses. Total employ-ment during this period is expected to increase from 3,362,260 to 3,376,400, cre-ating new job growth of 14,140.
From the first quarter of 2020 to 2022, the non-farm industry sectors forecast to grow the most rapidly include transporta-tion and warehousing (4.6 percent); con-struction (2.5 percent); professional, sci-entific, and technical services (2.5 per-cent); and information (2.4 percent). Indi-viduals sequestering at home and in-creasing their online purchasing are ex-pected to continue to boost transporta-tion and warehousing. Renovations of existing homes as well as new residential building will continue to spur construc-tion. Employment in the information sec-tor will continue growth as new technolo-gies continue to develop to aid domestic and worldwide communication. Industries which lost significant employ-ment during 2020, including manufactur-ing and arts, entertainment, and recrea-tion, are not expected to recover to the level of employment of the first quarter of 2020 by early 2022. Manufacturing employment1, significantly impacted by declines in the transportation equipment manufacturing sector, is expected to be about five percent less. Stimulus spend-ing could improve the outlook.
The three major occupational groups ex-pected to have the most new jobs are transportation and material moving (7,310), management (3,500), and con-struction (2,700). Due to the demand for online ordering, top transportation jobs will include heavy and tractor-trailer truck drivers and light truck and delivery drivers, as well as industrial truck and tractor op-erators working in warehouses. In con-struction, jobs with the largest number of openings expected include construction laborers, electricians, supervisors, carpen-ters, helpers, and operating engineers. Although production worker employment overall is expected to decline, there will be significant numbers of openings for metal workers and plastics workers (4,470) and assemblers and fabricators (3,220) due to large numbers of employees exiting these fields. Projected to be among the fastest growing non-farm occupational groups are legal employees (3 percent growth), computer and mathematical employees (2.6 percent) and transportation and material moving employees (2.6 percent). Agricultural em-ployment is also expected to grow by more than two percent. Most occupational openings are due to people leaving the occupation through transfers and exits (separations) rather than growth. In 2019-21, healthcare practitioners and technical occupations were expected to have 28,870 openings. Although the healthcare indus-try is expected to have a lower growth rate in 2020-22, 25,800 openings are still ex-pected, due to significant numbers of em-ployee separations. Further information about Tennessee’s short-term industry and occupational pro-jections can be found in the labor market information tab at jobs4tn.gov.
1Tennessee merchandise exports declined by 35 per-cent in the first nine months of 2020. Boyd Center for Business and Economic Research. An Economic Report to the Governor of the State of Tennessee, p. 32
Tennessee Short-Term Projections, 2020-2022
Highlights Pages 1-3 The 2020-2022 Tennessee short-term projections Page 4 A directory of articles for every month in 2020 Page 5 The annual average nonfarm employment rates and the not seasonally adjusted monthly labor force data Pages 6-11 Monthly nonfarm employment, long-term graphs of the unemployment and a brief explanation for each major MSA in Tennessee Page 12 Monthly nonfarm employment for each small MSA in Tennessee Page 13 The monthly consumer price index and wages by industries for production workers
Fastest Growing Occupations
Most Rapidly Growing Industries
2
Source: U.S. Department of Labor and Workforce Development
-20,000 -15,000 -10,000 -5,000 0 5,000 10,000 15,000 20,000
Transportation and Warehousing
State Government, Excluding Education and Hospitals
Professional, Scientific, and Technical Services
Administrative and Support and Waste Management and Remediation Services
Self Employed and Unpaid Family Workers, All Jobs
Construction
Retail Trade
Other Services (except Government)
Wholesale Trade
Finance and Insurance
Agriculture, Forestry, Fishing and Hunting
Health Care and Social Assistance
Information
Real Estate and Rental and Leasing
Utilities
Mining
Management of Companies and Enterprises
Educational Services
Accommodation and Food Services
Arts, Entertainment, and Recreation
Manufacturing
New Jobs, 2019-21 v. 2020-22
19-21 Amt Change 20-22 Amt Change
-15.0% -10.0% -5.0% 0.0% 5.0% 10.0%
Transportation and Warehousing
Agriculture, Forestry, Fishing and Hunting
Construction
Professional, Scientific, and Technical Services
Information
State Government, Excluding Education and Hospitals
Other Services (except Government)
Self Employed and Unpaid Family Workers, All Jobs
Wholesale Trade
Administrative and Support and Waste Management and Remediation Services
Finance and Insurance
Utilities
Real Estate and Rental and Leasing
Retail Trade
Mining
Health Care and Social Assistance
Educational Services
Accommodation and Food Services
Management of Companies and Enterprises
Manufacturing
Arts, Entertainment, and Recreation
TN % Change in Projected Employment, 2019-21 vs 2020-22
19-21 % Change 20-22 % Change

3
Source: U.S. Department of Labor and Workforce Development
-20,000 -15,000 -10,000 -5,000 0 5,000 10,000 15,000 20,000
Self Employed and Unpaid Family Workers, All Jobs
Agriculture, Forestry, Fishing and Hunting
Mining
Utilities
Construction
Manufacturing
Wholesale Trade
Retail Trade
Transportation and Warehousing
Information
Finance and Insurance
Real Estate and Rental and Leasing
Professional, Scientific, and Technical Services
Management of Companies and Enterprises
Administrative and Support and Waste Management and Remediation…
Educational Services
Health Care and Social Assistance
Arts, Entertainment, and Recreation
Accommodation and Food Services
Other Services (except Government)
State Government, Excluding Education and Hospitals
New Jobs, 2019-21 v. 2020-22
19-21 Amt Change 20-22 Amt Change
-15.0% -10.0% -5.0% 0.0% 5.0% 10.0%
Transportation and Warehousing
Agriculture, Forestry, Fishing and Hunting
Construction
Professional, Scientific, and Technical Services
Information
State Government, Excluding Education and Hospitals
Other Services (except Government)
Self Employed and Unpaid Family Workers, All Jobs
Wholesale Trade
Administrative and Support and Waste Management and Remediation Services
Finance and Insurance
Utilities
Real Estate and Rental and Leasing
Retail Trade
Mining
Health Care and Social Assistance
Educational Services
Accommodation and Food Services
Management of Companies and Enterprises
Manufacturing
Arts, Entertainment, and Recreation
TN % Change in Projected Employment, 2019-21 vs 2020-22
19-21 % Change 20-22 % Change
-15000
-10000
-5000
0
5000
10000
15000Major Occup Group Change, 2019-21 vs. 2020-22
2020-22 Amt of Change 2019-21 Change
-6.0%
-4.0%
-2.0%
0.0%
2.0%
4.0%
6.0%
Major Occ. Group % Change, 2019-21 vs. 2020-22
2020-22 % Change 2019-2021 % Change
-15000
-10000
-5000
0
5000
10000
15000Major Occup Group Change, 2019-21 vs. 2020-22
2020-22 Amt of Change 2019-21 Change

4
This is a list of monthly articles that were featured in the 2020 issues of The Labor Market Report. The pre-vious issues of The Labor Market Report are available on our department’s Website at https://www.tn.gov/workforce/general-resources/major-publications0/major-publications-redirect/public-reports-redirect/labor-market-reports.html. • JANUARY
Page 1 includes information about the 2019 Labor Surplus Areas in Tennessee. Page 2 is The 2019 LMR Directory of last year’s articles in The Labor Market Report.
• FEBRUARY
Essential Industries in Tennessee: This article includes information on essential industries in Tennessee from the 2019 Occupational Employment Statistics (OES) survey.
• MARCH
Unemployment Insurance & Weekly Claims: This article includes information on Unemployment Insurance (UI). It explains who qualifies, the new rules that were passed in the CARES Act, and the number of initial claims over the year for both the United States and Tennessee.
• APRIL
This article gives information about Labor Force & Nonfarm Employment, 2015-2019. It shows nonfarm employment by industry and the labor force, employment, and unemployment rate in Tennessee cities.
• MAY
This article is An Overview of Economic Recessions in the United States since World War II. It also discusses the current COVID-19 economic recession.
• JUNE
This article explains Per Capita Income and Population by County. The population and income data encompasses 2017 to 2018.
• JULY
This article discusses the county Gross Domestic Product in Tennessee from 2015 to 2019. The article also explains what gross domestic product is and how it is used.
• AUGUST
Goods-Producing & Service-Providing Employment: This article is about the em-ployment trends of the goods-producing and service-providing industry sectors in both Tennessee and the United States from 1990 to 2019.
• SEPTEMBER
This article discusses the COVID-19’s Effect on the Tennessee Economy, March-June 2020. It includes the Tennessee Demand Occupations by claims filed as per-cent of 2020 employment.
• OCTOBER
This article discusses the Industries and Occupations Adding Jobs During the COVID-19 Pandemic in Tennessee.
• NOVEMBER
This article talks about Workplace Injuries and Illnesses and shows a compari-son of injury and illness rates amongst the states for 2019.
• DECEMBER
This article looks at the Effects of the COVID-19 Recession by Gender. It discusses how this recession has been the first recession to have women more affected by job loss than men.

5
Tennessee Civilian Labor Workforce 1991-Present County Unemployment Rates*
Jan Jan Jan Jan
County 2020 2021 County 2020 2021
Anderson 3.9 5.0 Lauderdale 6.0 6.9
Bedford 4.1 5.3 Lawrence 4.6 5.3
Benton 5.8 6.5 Lewis 4.2 5.1
Bledsoe 6.1 7.6 Lincoln 7.8 5.2
Blount 3.9 4.7 Loudon 3.9 4.3
Bradley 3.9 5.2 Macon 3.4 5.2
Campbell 5.4 6.3 Madison 3.9 5.5
Cannon 3.3 4.3 Marion 5.2 5.6
Carroll 6.0 6.2 Marshall 4.2 5.0
Carter 4.7 5.6 Maury 3.4 5.6
Cheatham 3.0 3.9 McMinn 4.3 5.2
Chester 3.7 4.6 McNairy 6.4 7.7
Claiborne 5.2 5.6 Meigs 5.6 6.8
Clay 7.5 7.1 Monroe 4.4 5.0
Cocke 7.0 8.5 Montgomery 4.3 5.7
Coffee 4.0 4.7 Moore 3.5 3.8
Crockett 4.7 4.9 Morgan 5.1 6.2
Cumberland 6.9 7.0 Obion 5.3 6.5
Davidson 2.8 4.9 Overton 5.1 5.1
Decatur 7.5 7.1 Perry 7.8 7.7
DeKalb 5.1 5.4 Pickett 6.4 5.3
Dickson 3.4 4.1 Polk 5.0 5.2
Dyer 5.8 6.1 Putnam 4.0 4.9
Fayette 4.0 5.2 Rhea 6.0 7.2
Fentress 5.0 5.5 Roane 4.9 5.8
Franklin 4.2 4.6 Robertson 3.2 4.1
Gibson 5.1 5.4 Rutherford 2.8 4.2
Giles 5.5 5.2 Scott 4.8 6.5
Grainger 5.1 6.0 Sequatchie 4.6 5.9
Greene 5.3 6.1 Sevier 6.5 7.3
Grundy 4.9 6.7 Shelby 4.5 7.7
Hamblen 4.7 5.0 Smith 3.5 4.1
Hamilton 3.8 5.1 Stewart 5.3 5.9
Hancock 6.7 6.2 Sullivan 4.3 5.7
Hardeman 6.1 7.8 Sumner 3.0 4.2
Hardin 5.4 6.0 Tipton 4.6 5.2
Hawkins 5.1 6.0 Trousdale 3.4 4.7
Haywood 5.4 7.2 Unicoi 6.9 7.5
Henderson 5.4 5.9 Union 4.4 5.4
Henry 5.5 6.1 Van Buren 5.0 6.4
Hickman 3.5 4.2 Warren 4.6 6.0
Houston 6.1 7.1 Washington 4.0 4.8
Humphreys 5.4 5.2 Wayne 6.2 5.9
Jackson 5.8 6.0 Weakley 4.2 4.7
Jefferson 5.0 5.6 White 4.4 4.8
Johnson 4.6 5.5 Williamson 2.6 3.2
Knox 3.2 4.2 Wilson 3.0 4.0
Lake 7.2 8.4 *Data Not Seasonally Adjusted
3.0
3.9
4.8
5.7
6.6
7.5
8.4
9.3
10.2
11.1
U n
e m
p l o
y m
e n
t
R a
t e
Unemployment Rates 2006-2020
55.0
55.9
56.8
57.7
58.6
59.5
60.4
61.3
62.2
63.1
64.0
64.9
65.8
Lab
or F
orc
e P
arti
cip
ati
on
Ra
te
Labor Force Participation Rates 2006-2020
(N UM B ER S IN THOUS A N D S )
Total Total Rate (%) Total Rate (%)
1991 3,822.5 2,418.5 63.3% 2,258.8 59.1% 159.8 6.6%
1992 3,875.8 2,469.2 63.7 2,309.7 59.6 159.6 6.5
1993 3,936.5 2,534.5 64.4 2,386.9 60.6 147.6 5.8
1994 4,003.3 2,657.2 66.4 2,529.6 63.2 127.6 4.8
1995 4,075.6 2,723.1 66.8 2,582.9 63.4 140.3 5.2
1996 4,150.1 2,763.2 66.6 2,620.2 63.1 143.0 5.2
1997 4,218.9 2,780.6 65.9 2,634.2 62.4 146.4 5.3
1998 4,272.7 2,810.1 65.8 2,688.5 62.9 121.6 4.3
1999 4,317.6 2,843.0 65.8 2,730.1 63.2 112.9 4.0
2000 4,358.4 2,849.0 65.4 2,738.8 62.8 110.2 3.9
2001 4,401.2 2,857.7 64.9 2,728.6 62.0 129.0 4.5
2002 4,444.9 2,898.9 65.2 2,750.4 61.9 148.5 5.1
2003 4,492.3 2,904.6 64.7 2,744.4 61.1 160.2 5.5
2004 4,541.6 2,897.8 63.8 2,742.9 60.4 154.9 5.3
2005 4,610.1 2,898.5 62.9 2,738.2 59.4 160.3 5.5
2006 4,692.4 3,014.7 64.2 2,856.1 60.9 158.7 5.3
2007 4,760.1 3,043.3 63.9 2,901.9 61.0 141.3 4.6
2008 4,821.7 3,060.8 63.5 2,862.1 59.4 198.7 6.5
2009 4,868.4 3,032.7 62.3 2,725.1 56.0 307.5 10.1
2010 4,925.4 3,093.1 62.8 2,789.1 56.6 304.1 9.8
2011 4,973.5 3,117.5 62.7 2,833.3 57.0 284.2 9.1
2012 5,020.4 3,096.3 61.7 2,849.7 56.8 246.6 8.0
2013 5,064.6 3,078.9 60.8 2,840.1 56.1 238.8 7.8
2014 5,109.9 3,043.6 59.6 2,842.5 55.6 201.0 6.6
2015 5,159.2 3,074.2 59.6 2,902.7 56.3 171.5 5.6
2016 5,213.9 3,136.4 60.2 2,987.7 57.3 148.7 4.7
2017 5,272.1 3,187.4 60.5 3,068.6 58.2 118.9 3.7
2018 5,328.2 3,250.7 61.0 3,137.7 58.9 113.0 3.5
2019 5,381.1 3,329.3 61.9 3,216.9 59.8 112.4 3.4
2020 5,437.9 3,289.4 60.5 3,043.9 56.0 245.5 7.5
2021
January (p) 5469.2 3,306.1 60.4% 3,128.7 57.2% 177.4 5.4%
February
March
April
May
June
July
August
September
October
November
December
(r)=rev ised
(p)=preliminary
Year
and
Month
Civilian
noninstitutional
population
Labor Force
Participation
Rate (%)
MONT HLY DA T A NOT SEA SONA LLY A DJUST ED
Employed Unemployed
Civilian Labor Force

6
2020
Jan.
Jan. Jan.
Nonfarm Employment & Labor Workforce Narrative
Estimated Nonfarm Employment (in thousands)
Total Nonfarm 3,117.6 3,065.1 3,000.6 -117.0 -64.5
Total Private 2,677.4 2,627.1 2,576.0 -101.4 -51.1
Goods Producing 485.9 478.6 474.9 -11.0 -3.7
Mining, Logging & Construction 132.4 133.1 130.4 -2.0 -2.7
Natural Resources & Mining 4.3 4.2 4.2 -0.1 0.0
Construction 128.1 128.9 126.2 -1.9 -2.7
Construction of Buildings 26.8 25.9 25.6 -1.2 -0.3
Heavy an Civil Engineering 15.8 16.2 15.1 -0.7 -1.1
Specialty Trade Contractors 85.5 86.8 85.5 0.0 -1.3
Manufacturing 353.5 345.5 344.5 -9.0 -1.0
Durable Goods Manufacturing 225.8 219.5 219.5 -6.3 0.0
Wood Product Manufacturing 12.9 12.9 12.7 -0.2 -0.2
Nonmetallic Mineral Product Manufacturing 14.2 13.8 13.8 -0.4 0.0
Primary Metal Manufacturing 11.3 10.6 10.7 -0.6 0.1
Fabricated Metal Product Manufacturing 38.0 37.5 37.5 -0.5 0.0
Machinery Manufacturing 25.0 24.2 24.0 -1.0 -0.2
Computer & Electronic Product Manufacturing 5.9 6.2 6.2 0.3 0.0
Electrical Equipment & Appliance Manufacturing 17.4 17.2 17.3 -0.1 0.1
Transportation Equipment Manufacturing 74.4 71.3 71.5 -2.9 0.2
Furniture & Related Product Manufacturing 9.7 9.6 9.6 -0.1 0.0
Miscellaneous Manufacturing Durable Goods 17.0 16.2 16.2 -0.8 0.0
Nondurable Goods Manufacturing 127.7 126.0 125.0 -2.7 -1.0
Food Manufacturing 36.2 36.4 36.0 -0.2 -0.4
Beverage & Tobacco Product Manufacturing 7.6 7.5 7.4 -0.2 -0.1
Paper Manufacturing 12.7 12.4 12.5 -0.2 0.1
Printing & Related Support Activities 9.0 7.9 7.8 -1.2 -0.1
Chemical Manufacturing 26.0 25.8 25.6 -0.4 -0.2
Plastics & Rubber Products Manufacturing 24.7 24.2 23.8 -0.9 -0.4
Service Providing 2,631.7 2,586.5 2,525.7 -106.0 -60.8
Trade, Transportation, & Utilities 640.3 657.0 642.4 2.1 -14.6
Wholesale Trade 121.3 117.6 117.4 -3.9 -0.2
Merchant Wholesalers, Durable Goods 71.7 69.7 69.7 -2.0 0.0
Merchant Wholesalers, Nondurable Goods 42.5 41.1 40.9 -1.6 -0.2
Wholesale Electronic Markets 7.1 6.8 6.8 -0.3 0.0
Retail Trade 331.8 337.5 329.6 -2.2 -7.9
Motor Vehicle & Parts Dealers 46.9 45.8 45.4 -1.5 -0.4
Furniture & Home Furnishings Stores 10.3 9.7 9.4 -0.9 -0.3
Building Material, Garden Equipment, & Supplies 29.0 32.0 31.4 2.4 -0.6
Food & Beverage Stores 55.2 58.5 57.7 2.5 -0.8
Health & Personal Care Stores 23.7 24.1 23.2 -0.5 -0.9
Gasoline Stations 23.8 24.1 23.7 -0.1 -0.4
Clothing & Clothing Accessories Stores 23.2 21.8 19.5 -3.7 -2.3
Sporting Goods, Hobby, Book, & Music Stores 12.0 12.2 11.3 -0.7 -0.9
General Merchandise Stores 71.2 73.4 70.7 -0.5 -2.7
Miscellaneous Store Retailers 17.6 17.0 17.2 -0.4 0.2
Nonstore Retailers 8.5 8.3 7.9 -0.6 -0.4
Transportation, Warehousing, & Utilities 187.2 201.9 195.4 8.2 -6.5
Utilities 3.6 3.7 3.7 0.1 0.0
Transportation & Warehousing 183.6 198.2 191.7 8.1 -6.5
Truck Transportation 61.2 58.8 57.6 -3.6 -1.2
Information 44.9 43.3 42.8 -2.1 -0.5
Financial Activities 173.7 170.9 170.2 -3.5 -0.7
Finance & Insurance 132.1 131.8 132.1 0.0 0.3
Real Estate, Rental, & Leasing 41.6 39.1 38.1 -3.5 -1.0
Professional & Business Services 426.3 436.7 421.7 -4.6 -15.0
Professional, Scientific, & Technical Services 147.8 153.8 152.1 4.3 -1.7
Management of Companies & Enterprises 51.6 50.5 49.9 -1.7 -0.6
Administrative, Support, & Waste Management 226.9 232.4 219.7 -7.2 -12.7
Educational & Health Services 447.0 431.2 428.4 -18.6 -2.8
Educational Services 62.0 56.7 56.0 -6.0 -0.7
Health Care & Social Assistance 385.0 374.5 372.4 -12.6 -2.1
Ambulatory Health Care Services 156.8 156.1 156.1 -0.7 0.0
Hospitals 110.0 109.4 109.2 -0.8 -0.2
Nursing & Residential Care Facilities 63.0 57.6 56.5 -6.5 -1.1
Social Assistance 55.2 51.4 50.6 -4.6 -0.8
Leisure & Hospitality 336.8 291.3 279.3 -57.5 -12.0
Arts, Entertainment, & Recreation 37.1 33.6 30.2 -6.9 -3.4
Accommodation & Food Services 299.7 257.7 249.1 -50.6 -8.6
Accommodation 39.0 26.7 25.5 -13.5 -1.2
Food Services & Drinking Places 260.7 231.0 223.6 -37.1 -7.4
Other Services 122.5 118.1 116.3 -6.2 -1.8
Government 440.2 438.0 424.6 -15.6 -13.4
Federal Government 50.4 52.1 50.8 0.4 -1.3
State Government 93.1 95.8 89.1 -4.0 -6.7
State Government Educational Services 51.8 54.9 48.3 -3.5 -6.6
Local Government 296.7 290.1 284.7 -12.0 -5.4
Local Government Educational Services 147.7 143.4 140.5 -7.2 -2.9
The data from all the nonfarm employment estimates tables include all full- and part-time nonfarm wage and salary employ-ees who worked during or received pay for any part of the pay period that includes the 12th of the month. This is a count of jobs by place of work. Agricultural workers, proprietors, self-employed persons, workers in private households, and unpaid family workers are excluded. These numbers may not add due
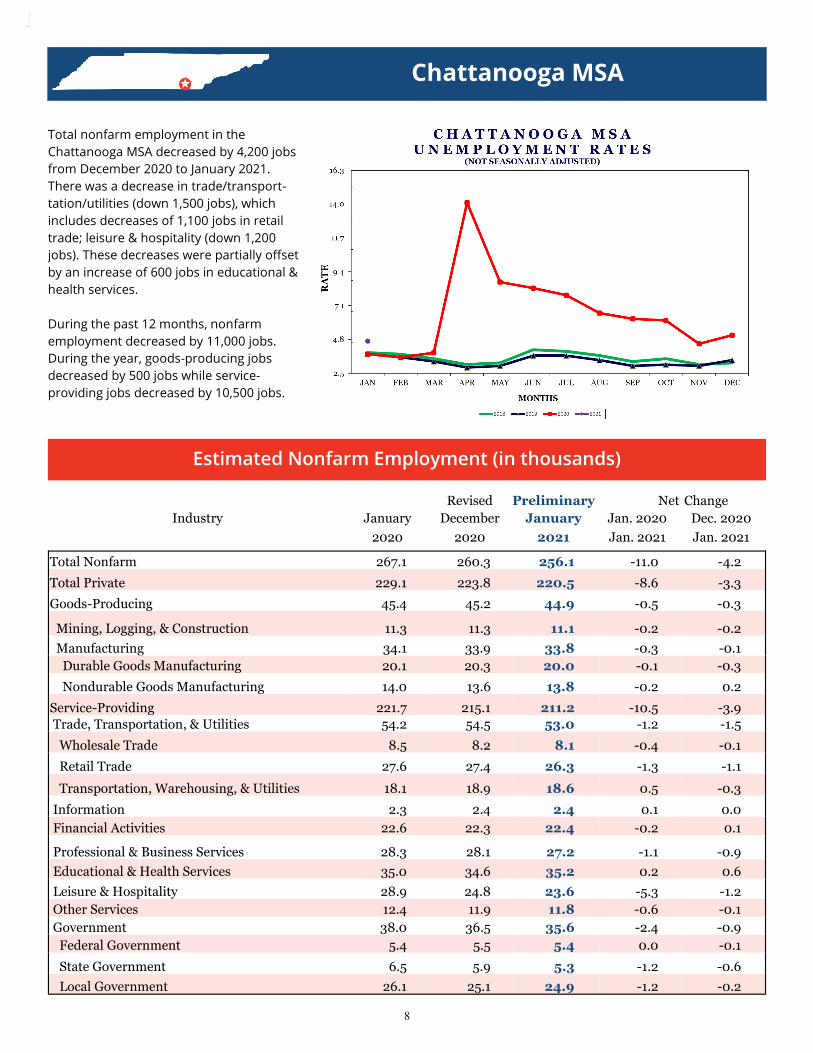
Total nonfarm employment decreased by 117,000 jobs from January 2020 to January 2021. There were decreases in leisure & hospitality (down 57,500 jobs), which in-cludes decreases of 37,100 jobs in food services & drinking places; educational & health services (down 18,600 jobs), which includes decreases of 12,600 jobs in health care & social assistance; government (down 15,600 jobs), which includes de-creases of 12,000 jobs in local government; manufacturing (down 9,000 jobs), which includes decreases of 6,300 jobs in durable goods manufacturing. These decreases were partially offset by increases in transportation & warehousing (up 8,100 jobs); professional/scientific/technical services (up 4,300 jobs); food & beverage stores (up 2,500 jobs); building material/garden equipment/supplies (up 2,400 jobs). During the past month, nonfarm employ-ment decreased by 64,500 jobs. There were decreases in professional & business services (down 15,000), which include de-creases of 12,700 jobs in administrative/support/waste management; trade/transportation/warehousing (down 14,600 jobs), which includes decreases of 7,900 jobs in retail trade; government (down 13,400 jobs), which includes decreases of 6,600 jobs in state government educational services. These decreases were partially offset by increases in finance & insurance (up 300 jobs); miscellaneous store retailers and transportation equipment manufacturing (both up 200 jobs). Tennessee's seasonally adjusted estimated unemployment rate for January 2021 was 5.1 percent, down from the revised Decem-ber 2020 rate of 5.6 percent. The United States unemployment rate for January 2021 was 6.3 percent, down from the re-vised December 2020 rate of 6.7 percent. In January 2020, the U.S. seasonally adjust-ed rate was 3.5 percent while the state rate was 3.7 percent. The not seasonally adjusted unemploy-ment rate decreased in 78 counties, in-creased in 10 counties, and remained the same in 7 counties. Williamson County had the lowest rate at 3.2 percent, down from the revised December rate of 3.8 percent. The highest rate was Cocke County at 8.5 percent, up from the revised unemploy-ment rate of 6.5 percent in December.
Dec.January Dec.

7
Civilian Labor Force Summary
U.S. TENNESSEE
U.S.
TENNESSEE
Labor Force Employment Unemployed Rate Labor Force Employment Unemployed Rate Labor Force Employment Unemployed Rate
Bartlett
Brentwood
Bristol
Chattanooga
Clarksville
Cleveland
Collierville
Columbia
Cookeville
Franklin
Gallatin
Germantown
Hendersonville
Jackson
Johnson City
Kingsport
Knoxville
LaVergne
Lebanon
Maryville
Memphis
Morristown
*Mount Juliet
Murfreesboro
Nashville
Oak Ridge
Smyrna
Spring Hill
Chattanooga
Clarksville
Cleveland
Jackson
Johnson City
Kingsport
Knoxville
Memphis
Morristown
Nashville
Athens
*Brownsville
Cookeville
Crossville
*Dayton
Dyersburg
Greeneville
Lawrenceburg
Lewisburg
Martin
McMinnville
Newport
Paris
Sevierville
Shelbyville
Tullahoma
24,112 23,065 1,047 4.3 23,442 22,053 1,389 5.9 23,319 22,107 1,212 5.2
7,842 7,415 427 5.4 7,824 7,263 561 7.2 7,821 7,261 560 7.2
49,915 47,743 2,172 4.4 50,592 47,878 2,714 5.4 50,132 47,607 2,525 5.0
23,504 21,882 1,622 6.9 22,956 21,312 1,644 7.2 22,800 21,195 1,605 7.0
13,716 12,890 826 6.0 13,169 12,167 1,002 7.6 13,106 12,163 943 7.2
16,118 15,183 935 5.8 15,940 14,968 972 6.1 15,776 14,812 964 6.1
29,552 27,971 1,581 5.3 28,873 26,994 1,879 6.5 28,715 26,968 1,747 6.1
19,259 18,373 886 4.6 19,295 18,246 1,049 5.4 19,233 18,223 1,010 5.3
15,690 15,029 661 4.2 15,210 14,416 794 5.2 15,231 14,476 755 5.0
15,935 15,261 674 4.2 15,571 14,778 793 5.1 15,545 14,813 732 4.7
17,151 16,357 794 4.6 17,101 16,092 1,009 5.9 17,124 16,104 1,020 6.0
14,807 13,764 1,043 7.0 14,380 13,441 939 6.5 14,587 13,341 1,246 8.5
14,085 13,308 777 5.5 13,522 12,654 868 6.4 13,426 12,611 815 6.1
55,009 51,430 3,579 6.5 52,905 50,463 2,442 4.6 52,567 48,752 3,815 7.3
20,989 20,122 867 4.1 20,742 19,571 1,171 5.6 20,860 19,746 1,114 5.3
49,846 47,824 2,022 4.1 48,801 46,355 2,446 5.0 48,603 46,364 2,239 4.6
14,291 13,531 760 5.3 14,277 13,334 943 6.6 14,279 13,380 899 6.3
31,476 30,445 1,031 3.3 31,439 30,131 1,308 4.2 30,970 29,755 1,215 3.9
22,382 21,816 566 2.5 22,051 21,189 862 3.9 21,939 21,217 722 3.3
11,778 11,268 510 4.3 11,670 10,985 685 5.9 11,603 10,946 657 5.7
87,665 84,116 3,549 4.0 87,558 81,987 5,571 6.4 87,352 81,980 5,372 6.1
63,578 60,700 2,878 4.5 64,250 59,973 4,277 6.7 63,837 59,822 4,015 6.3
21,521 20,634 887 4.1 21,982 20,636 1,346 6.1 21,849 20,582 1,267 5.8
26,364 25,602 762 2.9 26,313 25,338 975 3.7 25,893 25,022 871 3.4
19,522 18,702 820 4.2 19,417 18,166 1,251 6.4 19,631 18,181 1,450 7.4
14,435 13,792 643 4.5 14,699 13,839 860 5.9 14,545 13,726 819 5.6
48,599 47,371 1,228 2.5 47,731 46,010 1,721 3.6 47,479 46,072 1,407 3.0
22,856 22,089 767 3.4 22,669 21,468 1,201 5.3 22,548 21,488 1,060 4.7
20,022 19,470 552 2.8 20,040 19,270 770 3.8 19,649 19,029 620 3.2
33,335 32,385 950 2.8 32,914 31,474 1,440 4.4 32,834 31,504 1,330 4.1
32,242 30,937 1,305 4.0 33,006 30,860 2,146 6.5 32,242 30,259 1,983 6.2
31,606 30,369 1,237 3.9 31,797 30,141 1,656 5.2 31,069 29,620 1,449 4.7
23,135 22,109 1,026 4.4 23,038 21,552 1,486 6.5 22,918 21,476 1,442 6.3
96,598 93,313 3,285 3.4 97,641 92,375 5,266 5.4 97,269 92,393 4,876 5.0
19,605 19,055 550 2.8 19,524 18,532 992 5.1 19,491 18,536 955 4.9
17,676 17,081 595 3.4 17,519 16,589 930 5.3 17,479 16,602 877 5.0
14,148 13,686 462 3.3 14,204 13,528 676 4.8 14,137 13,537 600 4.2
295,213 280,224 14,989 5.1 304,572 277,335 27,237 8.9 301,702 273,876 27,826 9.2
11,882 11,292 590 5.0 11,987 11,282 705 5.9 11,879 11,188 691 5.8
20,499 19,969 530 2.6 20,268 19,394 874 4.3 20,221 19,409 812 4.0
84,675 82,247 2,428 2.9 83,728 79,991 3,737 4.5 83,723 80,009 3,714 4.4
404,469 393,108 11,361 2.8 403,329 382,329 21,000 5.2 402,128 382,548 19,580 4.9
14,141 13,642 499 3.5 14,255 13,504 751 5.3 14,187 13,508 679 4.8
29,063 28,259 804 2.8 28,695 27,484 1,211 4.2 28,570 27,490 1,080 3.8
24,448 23,827 621 2.5 24,116 23,143 973 4.0 24,091 23,170 921 3.8
277,409 266,995 10,414 3.8 274,117 260,172 13,945 5.1 272,798 260,096 12,702 4.7
117,782 112,360 5,422 4.6 117,910 110,783 7,127 6.0 117,148 110,496 6,652 5.7
60,052 57,602 2,450 4.1 60,958 57,593 3,365 5.5 60,579 57,448 3,131 5.2
64,589 62,024 2,565 4.0 65,455 61,740 3,715 5.7 63,966 60,578 3,388 5.3
91,646 87,603 4,043 4.4 92,071 86,872 5,199 5.6 90,115 85,408 4,707 5.2
137,751 131,969 5,782 4.2 135,021 127,238 7,783 5.8 133,991 126,458 7,533 5.6
431,905 416,106 15,799 3.7 433,205 411,565 21,640 5.0 431,693 411,748 19,945 4.6
639,738 610,422 29,316 4.6 651,858 606,594 45,264 6.9 642,312 597,423 44,889 7.0
53,174 50,597 2,577 4.8 53,333 50,546 2,787 5.2 52,915 50,129 2,786 5.3
1,091,003 1,059,377 31,626 2.9 1,080,130 1,029,442 50,688 4.7 1,077,275 1,030,270 47,005 4.4
164,455,000 158,659,000 5,796,000 3.5 162, 156, 5,82 3.6 162, 156, 5,88 3.6 3,338,446 3,214,183 124,263 3.7 3,30 3,19 106, 3.2 3,32 3,21 109, 3.3
160,567,000 149,830,000 10,736,000 6.7
3,313,650 3,127,609 186,041 5.6
160,161,000 150,031,000 10,130,000 6.3
3,316,943 3,146,636 170,307 5.1
163,498,000 156,994,000 6,504,000 4.0
3,332,953 3,200,454 132,499 4.0
160,017,000 149,613,000 10,404,000 6.5
3,324,493 3,138,615 185,878 5.6
January 2020 December 2020 January 2021
*2016 Census changes: Micropolitan Areas-Dayton and Brownsville added, Columbia, Harriman, Humboldt, LaFollette deleted. Cities: Mount Juliet added and Union City deleted.
159,234,000 148,383,000 10,851,000 6.8
3,306,113 3,128,694 177,419 5.4
Seasonally Adjusted
Not Seasonally Adjusted
Metropolitan Statistical Areas
Micropolitan Statistical Areas
Cities
8
Chattanooga MSA
Revised Preliminary Net Change
Industry January December January Jan. 2020 Dec. 2020
2020 2020 2021 Jan. 2021 Jan. 2021
Estimated Nonfarm Employment (in thousands)
Total Nonfarm 267.1 260.3 256.1 -11.0 -4.2
Total Private 229.1 223.8 220.5 -8.6 -3.3
Goods-Producing 45.4 45.2 44.9 -0.5 -0.3
Mining, Logging, & Construction 11.3 11.3 11.1 -0.2 -0.2
Manufacturing 34.1 33.9 33.8 -0.3 -0.1
Durable Goods Manufacturing 20.1 20.3 20.0 -0.1 -0.3
Nondurable Goods Manufacturing 14.0 13.6 13.8 -0.2 0.2
Service-Providing 221.7 215.1 211.2 -10.5 -3.9
Trade, Transportation, & Utilities 54.2 54.5 53.0 -1.2 -1.5
Wholesale Trade 8.5 8.2 8.1 -0.4 -0.1
Retail Trade 27.6 27.4 26.3 -1.3 -1.1
Transportation, Warehousing, & Utilities 18.1 18.9 18.6 0.5 -0.3
Information 2.3 2.4 2.4 0.1 0.0
Financial Activities 22.6 22.3 22.4 -0.2 0.1
Professional & Business Services 28.3 28.1 27.2 -1.1 -0.9
Educational & Health Services 35.0 34.6 35.2 0.2 0.6
Leisure & Hospitality 28.9 24.8 23.6 -5.3 -1.2
Other Services 12.4 11.9 11.8 -0.6 -0.1
Government 38.0 36.5 35.6 -2.4 -0.9
Federal Government 5.4 5.5 5.4 0.0 -0.1
State Government 6.5 5.9 5.3 -1.2 -0.6
Local Government 26.1 25.1 24.9 -1.2 -0.2
Total nonfarm employment in the
Chattanooga MSA decreased by 4,200 jobs
from December 2020 to January 2021.
There was a decrease in trade/transport-
tation/utilities (down 1,500 jobs), which
includes decreases of 1,100 jobs in retail
trade; leisure & hospitality (down 1,200
jobs). These decreases were partially offset
by an increase of 600 jobs in educational &
health services.
During the past 12 months, nonfarm
employment decreased by 11,000 jobs.
During the year, goods-producing jobs
decreased by 500 jobs while service-
providing jobs decreased by 10,500 jobs.
9
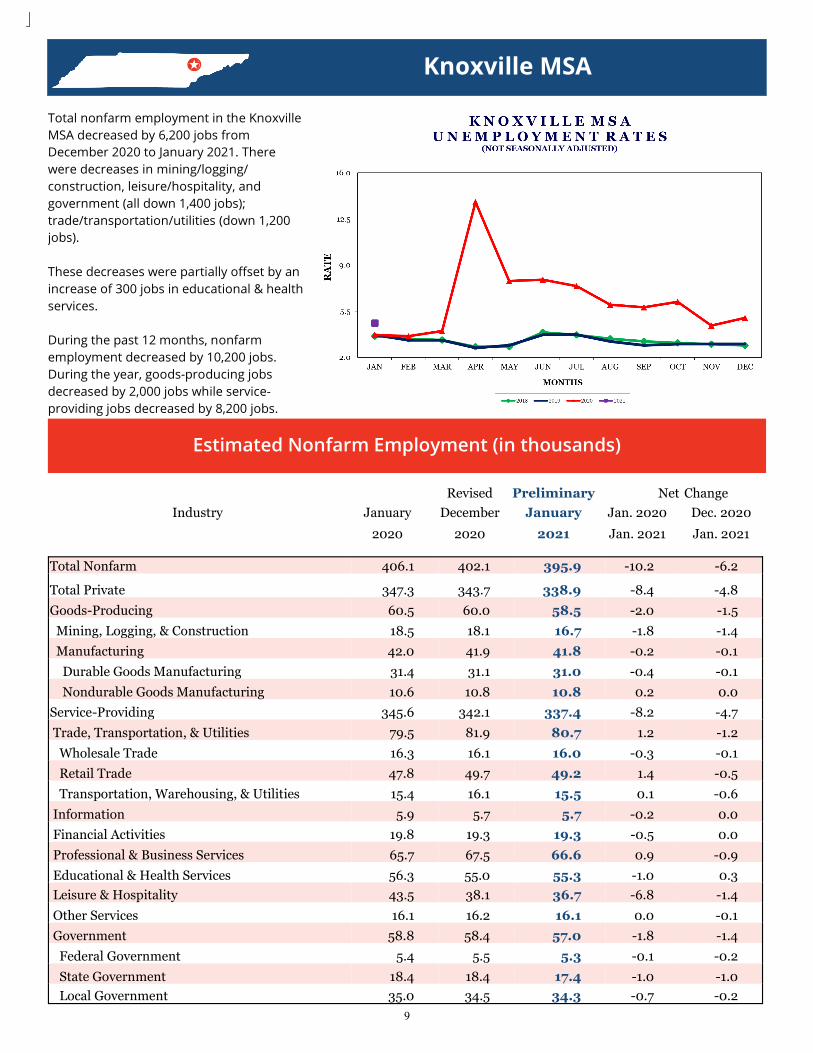
Knoxville MSA
Estimated Nonfarm Employment (in thousands)
Total Nonfarm 406.1 402.1 395.9 -10.2 -6.2
Total Private 347.3 343.7 338.9 -8.4 -4.8
Goods-Producing 60.5 60.0 58.5 -2.0 -1.5
Mining, Logging, & Construction 18.5 18.1 16.7 -1.8 -1.4
Manufacturing 42.0 41.9 41.8 -0.2 -0.1
Durable Goods Manufacturing 31.4 31.1 31.0 -0.4 -0.1
Nondurable Goods Manufacturing 10.6 10.8 10.8 0.2 0.0
Service-Providing 345.6 342.1 337.4 -8.2 -4.7
Trade, Transportation, & Utilities 79.5 81.9 80.7 1.2 -1.2
Wholesale Trade 16.3 16.1 16.0 -0.3 -0.1
Retail Trade 47.8 49.7 49.2 1.4 -0.5
Transportation, Warehousing, & Utilities 15.4 16.1 15.5 0.1 -0.6
Information 5.9 5.7 5.7 -0.2 0.0
Financial Activities 19.8 19.3 19.3 -0.5 0.0
Professional & Business Services 65.7 67.5 66.6 0.9 -0.9
Educational & Health Services 56.3 55.0 55.3 -1.0 0.3
Leisure & Hospitality 43.5 38.1 36.7 -6.8 -1.4
Other Services 16.1 16.2 16.1 0.0 -0.1
Government 58.8 58.4 57.0 -1.8 -1.4
Federal Government 5.4 5.5 5.3 -0.1 -0.2
State Government 18.4 18.4 17.4 -1.0 -1.0
Local Government 35.0 34.5 34.3 -0.7 -0.2
Revised Preliminary Net Change
Industry January December January Jan. 2020 Dec. 2020
2020 2020 2021 Jan. 2021 Jan. 2021
Total nonfarm employment in the Knoxville
MSA decreased by 6,200 jobs from
December 2020 to January 2021. There
were decreases in mining/logging/
construction, leisure/hospitality, and
government (all down 1,400 jobs);
trade/transportation/utilities (down 1,200
jobs).
These decreases were partially offset by an
increase of 300 jobs in educational & health
services.
During the past 12 months, nonfarm
employment decreased by 10,200 jobs.
During the year, goods-producing jobs
decreased by 2,000 jobs while service-
providing jobs decreased by 8,200 jobs.

10
Memphis MSA
Estimated Nonfarm Employment (in thousands)
Industry
January Revised
December Preliminary
January Net
Jan. 2020 Change
Dec. 2020
2020 2020 2021 Jan. 2021 Jan. 2021
Total nonfarm employment in the Mem-phis MSA decreased by 18,400 jobs from December 2020 to January 2021. There were decreases in administrative/support/waste management (down 6,100 jobs); trade/transportation/utilities (down 4,200 jobs), which in-cludes decreases of 3,100 jobs in trans-portation/warehousing/utilities; govern-ment (down 3,400 jobs). These decreases were partially offset by increases in wholesale trade (up 400 jobs); management of companies & en-terprises (up 300 jobs). During the past 12 months, nonfarm employment decreased by 24,900 jobs. During that time, goods-producing jobs decreased by 1,000 jobs, while service-providing jobs decreased by 23,900 jobs.
Total Nonfarm 650.6 644.1 625.7 -24.9 -18.4
Total Private 566.2 560.5 545.5 -20.7 -15.0
Goods-Producing 68.3 67.7 67.3 -1.0 -0.4
Mining, Logging, & Construction 23.5 23.7 23.2 -0.3 -0.5
Manufacturing 44.8 44.0 44.1 -0.7 0.1 Durable Goods Manufacturing 26.8 26.0 26.1 -0.7 0.1
Nondurable Goods Manufacturing 18.0 18.0 18.0 0.0 0.0
Service-Providing 582.3 576.4 558.4 -23.9 -18.0
Trade, Transportation, & Utilities 176.5 180.3 176.1 -0.4 -4.2
Wholesale Trade 35.3 34.2 34.6 -0.7 0.4
Retail Trade 64.0 64.7 63.2 -0.8 -1.5
Transportation, Warehousing, & Utilities 77.2 81.4 78.3 1.1 -3.1
Information 5.4 5.1 5.0 -0.4 -0.1
Financial Activities 29.5 29.3 28.5 -1.0 -0.8
Professional & Business Services 93.7 99.3 93.7 0.0 -5.6
Professional, Scientific, & Technical Services 23.3 24.0 24.2 0.9 0.2
Management of Companies & Enterprises 9.7 9.4 9.7 0.0 0.3
Administrative, Support, & Waste Management 60.7 65.9 59.8 -0.9 -6.1
Educational & Health Services 98.6 94.3 93.9 -4.7 -0.4
Leisure & Hospitality 66.4 57.4 54.5 -11.9 -2.9
Other Services 27.8 27.1 26.5 -1.3 -0.6
Government 84.4 83.6 80.2 -4.2 -3.4
Federal Government 13.8 14.6 14.0 0.2 -0.6
State Government 15.3 14.0 13.4 -1.9 -0.6
Local Government 55.3 55.0 52.8 -2.5 -2.2
11
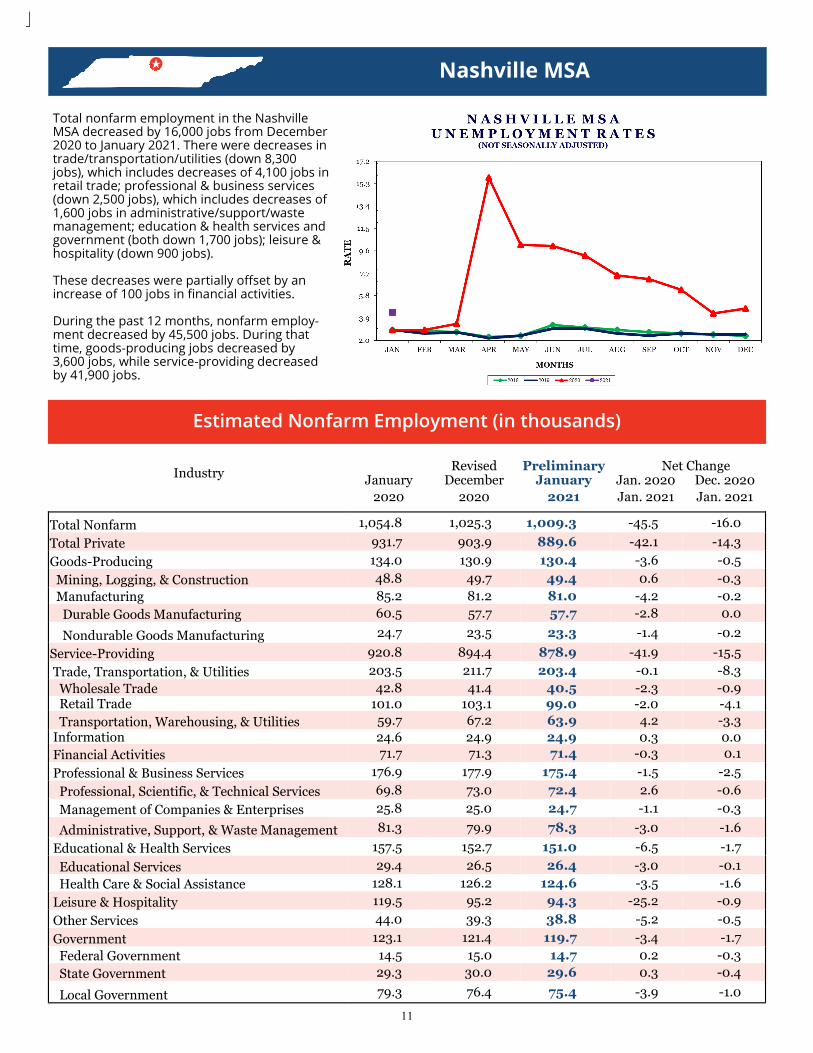
Nashville MSA
Estimated Nonfarm Employment (in thousands)
Total nonfarm employment in the Nashville MSA decreased by 16,000 jobs from December 2020 to January 2021. There were decreases in trade/transportation/utilities (down 8,300 jobs), which includes decreases of 4,100 jobs in retail trade; professional & business services (down 2,500 jobs), which includes decreases of 1,600 jobs in administrative/support/waste management; education & health services and government (both down 1,700 jobs); leisure & hospitality (down 900 jobs). These decreases were partially offset by an increase of 100 jobs in financial activities. During the past 12 months, nonfarm employ-ment decreased by 45,500 jobs. During that time, goods-producing jobs decreased by 3,600 jobs, while service-providing decreased by 41,900 jobs.
Industry
January Revised
December Preliminary
January Net
Jan. 2020 Change
Dec. 2020
2020 2020 2021 Jan. 2021 Jan. 2021
Total Nonfarm 1,054.8 1,025.3 1,009.3 -45.5 -16.0
Total Private 931.7 903.9 889.6 -42.1 -14.3
Goods-Producing 134.0 130.9 130.4 -3.6 -0.5
Mining, Logging, & Construction 48.8 49.7 49.4 0.6 -0.3
Manufacturing 85.2 81.2 81.0 -4.2 -0.2
Durable Goods Manufacturing 60.5 57.7 57.7 -2.8 0.0
Nondurable Goods Manufacturing 24.7 23.5 23.3 -1.4 -0.2
Service-Providing 920.8 894.4 878.9 -41.9 -15.5
Trade, Transportation, & Utilities 203.5 211.7 203.4 -0.1 -8.3
Wholesale Trade 42.8 41.4 40.5 -2.3 -0.9 Retail Trade 101.0 103.1 99.0 -2.0 -4.1
Transportation, Warehousing, & Utilities 59.7 67.2 63.9 4.2 -3.3
Information 24.6 24.9 24.9 0.3 0.0
Financial Activities 71.7 71.3 71.4 -0.3 0.1
Professional & Business Services 176.9 177.9 175.4 -1.5 -2.5
Professional, Scientific, & Technical Services 69.8 73.0 72.4 2.6 -0.6
Management of Companies & Enterprises 25.8 25.0 24.7 -1.1 -0.3
Administrative, Support, & Waste Management 81.3 79.9 78.3 -3.0 -1.6
Educational & Health Services 157.5 152.7 151.0 -6.5 -1.7
Educational Services 29.4 26.5 26.4 -3.0 -0.1
Health Care & Social Assistance 128.1 126.2 124.6 -3.5 -1.6
Leisure & Hospitality 119.5 95.2 94.3 -25.2 -0.9
Other Services 44.0 39.3 38.8 -5.2 -0.5
Government 123.1 121.4 119.7 -3.4 -1.7
Federal Government 14.5 15.0 14.7 0.2 -0.3
State Government 29.3 30.0 29.6 0.3 -0.4
Local Government 79.3 76.4 75.4 -3.9 -1.0

12
Clarksville MSA is Montgomery County, Christian County, KY, & Trigg County, KY. Cleveland MSA is Bradley & Polk counties. Jackson MSA is Chester, Crockett, & Madison counties. Johnson City MSA is Carter, Unicoi, & Washington counties. Kingsport-Bristol MSA is Hawkins County, Sullivan County, Scott County, VA, Wash-ington County, VA, & Bristol City, VA. Morristown MSA is Hamblen & Jefferson counties.
Clarksville, TN-KY MSA Cleveland, TN MSA Jackson, TN MSA
Dec. 2020 Jan. 2021 Dec. 2020 Jan. 2021 Dec. 2020 Jan. 2021
Revised Prelim. Revised Prelim. Revised Prelim.
Johnson City, TN MSA Kingsport-Bristol, TN-VA MSA Morristown, TN MSA
Dec. 2020 Jan. 2021 Dec. 2020 Jan. 2021 Dec. 2020 Jan. 2021
Revised Prelim. Revised Prelim. Revised Prelim.
Total Nonfarm 80,300 77,500 117,600 115,100 47,300 46,100
Total Private 63,900 63,000 102,000 99,700 40,400 39,900
Goods Producing 10,600 10,600 25,600 25,100 13,800 13,700
Mining, Logging & Construction 2,500 2,400 5,400 5,200 1,800 1,800
Manufacturing 8,100 8,200 20,200 19,900 12,000 11,900
Service Providing 69,700 66,900 92,000 90,000 33,500 32,400
Trade, Transportation, & Utilities 14,200 13,800 23,800 23,100 9,900 9,800
Wholesale Trade 2,500 2,500 3,300 3,300 1,400 1,400
Retail Trade 10,700 10,300 15,600 15,000 6,000 5,900
Transportation, Warehousing, & Utilities 1,000 1,000 4,900 4,800 2,500 2,500
Information 1,000 1,000 1,000 1,100 300 300
Financial Activities 4,700 4,700 3,600 3,600 900 900
Professional & Business Services 8,600 8,500 13,900 13,600 4,800 4,800
Educational & Health Services 13,700 13,500 17,100 17,000 5,600 5,500
Leisure & Hospitality 8,400 8,200 11,600 10,800 3,900 3,700
Other Services 2,700 2,700 5,400 5,400 1,200 1,200
Government 16,400 14,500 15,600 15,400 6,900 6,200
Federal Government 3,000 3,000 900 900 300 300
State Government 5,900 4,000 2,300 2,100 1,500 900
Local Government 7,500 7,500 12,400 12,400 5,100 5,000
Total Nonfarm 92,800 90,900 48,700 47,900 69,200 66,500
Total Private 73,600 72,500 43,300 42,500 55,100 53,400
Goods Producing 14,500 14,400 10,800 10,700 14,100 13,900
Mining, Logging & Construction 3,600 3,500 2,200 2,200 3,100 3,000
Manufacturing 10,900 10,900 8,600 8,500 11,000 10,900
Service Providing 78,300 76,500 37,900 37,200 55,100 52,600
Trade, Transportation, & Utilities 18,600 18,100 13,100 12,800 12,700 12,000
Wholesale Trade N.A. N.A. 800 800 2,900 2,900
Retail Trade 12,900 12,700 5,500 5,400 7,900 7,400
Transportation, Warehousing, & Utilities 2,700 2,700 6,800 6,600 1,900 1,700
Information 1,000 1,000 200 200 500 500
Financial Activities 3,100 3,100 1,300 1,300 2,100 2,100
Professional & Business Services 9,900 9,600 5,200 4,900 7,400 6,900
Educational & Health Services 12,000 11,900 5,900 5,700 10,900 10,800
Leisure & Hospitality 11,300 11,200 4,600 4,700 5,300 5,100
Other Services 3,200 3,200 2,200 2,200 2,100 2,100
Government 19,200 18,400 5,400 5,400 14,100 13,100
Federal Government 5,000 4,900 300 300 500 500
State Government 3,100 2,600 700 700 2,100 1,300
Local Government 11,100 10,900 4,400 4,400 11,500 11,300
13
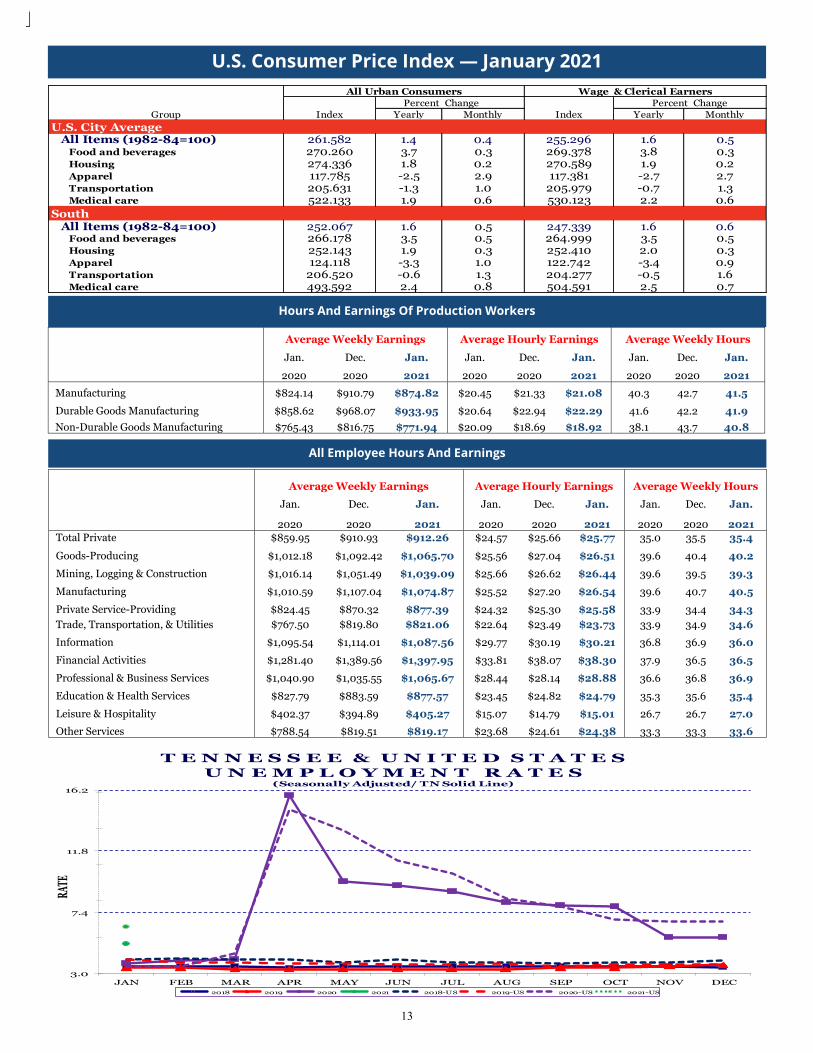
U.S. Consumer Price Index — January 2021
All Employee Hours And Earnings
3.0
7.4
11.8
16.2
JAN FEB MAR APR MAY JUN JUL AUG SEP OCT NOV DEC
RATE
T E N N E S S E E & U N I T E D S T A T E S
U N E M P L O Y M E N T R A T E S(Seasonally Adjusted/ TN Solid Line)
2018 2019 2020 2021 2018-US 2019-US 2020-US 2021-US
Group
U.S. City Average All Items (1982-84=100) Food and beverages
Housing
Apparel
Transportation
Medical care
South All Items (1982-84=100) Food and beverages
Housing
Apparel
Transportation
Medical care
Percent Change
0.50.30.91.6
3.8
0.6266.178252.143124.118
206.520493.592
1.9
247.339264.999252.410122.742
All Urban Consumers Wage & Clerical Earners
261.582270.260
0.50.3
Percent Change
1.4
Index Monthly
0.7
Monthly
-2.7-0.72.2
1.6
0.22.71.30.6
504.591
-3.4-0.52.5
3.5
1.30.8
2.0
204.277
255.296269.378270.589117.381
205.979530.123
2.9
2.4
Yearly
0.50.5
1.9
3.70.40.3
1.00.6
274.336117.785205.631522.133
-0.61.0
3.50.3
-3.3
Index
1.6
1.8 0.2
Yearly
252.067
-2.5-1.31.9
1.6
Hours And Earnings Of Production Workers
Average Weekly Earnings Average Hourly Earnings Average Weekly Hours
Jan. Dec. Jan. Jan. Dec. Jan. Jan. Dec. Jan.
2020 2020 2021 2020 2020 2021 2020 2020 2021
Manufacturing $824.14 $910.79 $874.82 $20.45 $21.33 $21.08 40.3 42.7 41.5
Durable Goods Manufacturing $858.62 $968.07 $933.95 $20.64 $22.94 $22.29 41.6 42.2 41.9
Non-Durable Goods Manufacturing $765.43 $816.75 $771.94 $20.09 $18.69 $18.92 38.1 43.7 40.8
Average Weekly Earnings Average Hourly Earnings Average Weekly Hours
Jan. Dec. Jan. Jan. Dec. Jan. Jan. Dec. Jan.
2020 2020 2021 2020 2020 2021 2020 2020 2021
Total Private $859.95 $910.93 $912.26 $24.57 $25.66 $25.77 35.0 35.5 35.4
Goods-Producing $1,012.18 $1,092.42 $1,065.70 $25.56 $27.04 $26.51 39.6 40.4 40.2
Mining, Logging & Construction $1,016.14 $1,051.49 $1,039.09 $25.66 $26.62 $26.44 39.6 39.5 39.3
Manufacturing $1,010.59 $1,107.04 $1,074.87 $25.52 $27.20 $26.54 39.6 40.7 40.5
Private Service-Providing $824.45 $870.32 $877.39 $24.32 $25.30 $25.58 33.9 34.4 34.3
Trade, Transportation, & Utilities $767.50 $819.80 $821.06 $22.64 $23.49 $23.73 33.9 34.9 34.6
Information $1,095.54 $1,114.01 $1,087.56 $29.77 $30.19 $30.21 36.8 36.9 36.0
Financial Activities $1,281.40 $1,389.56 $1,397.95 $33.81 $38.07 $38.30 37.9 36.5 36.5
Professional & Business Services $1,040.90 $1,035.55 $1,065.67 $28.44 $28.14 $28.88 36.6 36.8 36.9
Education & Health Services $827.79 $883.59 $877.57 $23.45 $24.82 $24.79 35.3 35.6 35.4
Leisure & Hospitality $402.37 $394.89 $405.27 $15.07 $14.79 $15.01 26.7 26.7 27.0
Other Services $788.54 $819.51 $819.17 $23.68 $24.61 $24.38 33.3 33.3 33.6