The Impact of the Flint Water Crisis on Fertility
75
[Date] The Impact of the Flint Water Crisis on Fertility Daniel Grossman, West Virginia University David Slusky, University of Kansas June 18, 2018 2018 IRP Summer Research Workshop
Transcript of The Impact of the Flint Water Crisis on Fertility

[Date]
The Impact of the Flint Water Crisis on Fertility
Daniel Grossman, West Virginia University David Slusky, University of Kansas
June 18, 20182018 IRP Summer Research Workshop

The Effect of an Increase in Lead in the Water System on Fertility, Pregnancy, and
Birth Outcomes: The Case of Flint, Michigan
Daniel Grossman, West Virginia University and
David J.G. Slusky, University of Kansas
July 10, 2017 “We were drinking contaminated water in a city that is literally in the middle of the Great Lakes, in the middle of the largest source of fresh water in the world.” – Dr. Mona Hanna-Attisha
2

College of Business and Economics
Flint water leached corrosion
Source: City of Flint website
3

Research questions
• What is the impact of a high level of lead in the water supply on– The fertility rate?– The sex ratio for live births?– Birth weight?
• Are the results robust?
4

Preview of results: fertility rates drop
• Investigating the fertility and health effects at birth of the Flint Water change
• Fertility rates decreased 12%• Sex ratios skew female births (as in
Sanders and Stoecker 2015)• Weaker evidence of lower birth weight• No evidence of behavioral changes
5

Lead has many terrible consequences
• Lead in the water raises blood lead levels• Lead crosses the placenta, affecting fetus• Lead is an abortifacient• Lead is associated with criminality and
behavior and educational problems• There is no “safe” level of lead
6
Sources: Troesken 2006; Hall 1905; Edwards et al. 2009; Hanna-Attischa et al. 2016; Edwards 2014; Taylor et al. 2014; Feigenbaum and Muller 2016; Clay et al. 2014; Reyes 2007, 2015; Aizer et al. 2016; Aizer and Currie 2017; Billings and Schnepel 2018, Guzze 2016; Clay et al. 2018

Lagged gasoline lead correlated w/ crime
7
Source: Reyes 2007

Individual evidence for cognitive channel
8
Source: Aizer, Currie, Simon, and Vivier 2015

150+ years of data that ↑lead means ↓kids
• Men exposed have lower fecundity • Pregnant women get prenatal
abnormalities, reduced gestation, miscarriage, & reduced birth weight
• Clay, Portnykh, and Severnini (2018) use the Interstate Highway System & the Clean Air Act and find reductions in the birth rate and worsening birth outcomes
9
Sources: Men: Paul 1860; Hamilton and Hardy 1983; Assennato et al. 1987; Coste et al. 1991; Winder 1993; Alexander et al. 1996; Lin et al. 1996; Bonde and Kolstad 1997; Apostoli, Porru, & Bisanti 1999; Apostoli et al. 2000; Hernberg2000; Sallmén, Lindbohm, and Nurimnen 2000; Sallmén 2001; Shaiau, Wang, & Chen 2004; Wirth & Mijal 2010; Vigehet al. 2011; Wu et al. 2012; Eibensteiner 2013. Women: Borja-Aburto et al. 1999; Hertz-Picciotto 2000; Joffe et al. 2003; Bellinger 2005; Hu et al. 2006; Cleveland et al. 2008; Vigeh et al. 2010; Zhu et al. 2010; Taylor, Golding, & Emond 2014

10
2014
Pre 2014 Flint receives water from Detroit Water and Sewerage Department (DWSD)
Governor appoints Emergency Manager
Water rates (prices) hit extreme levels
2011
March 2014: Flint and Genesee County plan own pipeline to Lake Huron
April 2014: Flint changes water source to Flint River, Genesee County stays with DWSD
2012 2013
Timeline of events in Flint
Flint passes ordinance that all connections with any water main be made with lead pipe
1897

11
Mar 2015 Aug 2015Aug-Dec 2014
Problems begin to emerge. Fecal coliform, GM water switch, TTHM
Emergency manager stresses water is safe, refuses to return to DWSD
Citizens complain about color, taste of water
Dr. Edwards independently tests Flint water lead levels, 19 times more corrosive than DWSD.
Dr. Hanna-Attisha finds increased blood level in Flint children
Sep 2015
Timeline of events in Flint (cont.)

2016: Governor apologies & asks for help
12
Source: Getty Images, March 17, 2016

Identification strategy: Flint water change
• Flint changed its water source from Lake Huron to the Flint River in April 2014
• Flint River water had numerous problems with contradictory chemical solutions
• New water leached lead out of pipes• So far, 15 individuals have been indicted• Yet, government budgets are potentially
about to be cut, including for testing water• Flint is not the only place with lead issues
13
Sources: Edwards et al. 2017, EPA, Reuters 2017, Drum 2016, Doleac 2017

Flint kids w/ high lead rose from ’13→‘15
14
Source: Hanna-Attisha et al. 2016

Specifically in the first few months
15
Source: Zahran et al. 2017

2 other papers looking at more outcomes
• Using Zillow home sales data– Home prices have declined significantly– No effect on the number of houses sold
• Using county-level Nielsen scanner data– Bottle water sales increased immediately– Water filter sales rose after October 2015
• Using Michigan education data– 6-9 pp fewer scoring proficient in math– 12-14 pp fewer scoring proficient in reading
16
Source: Christensen, Keiser, and Lade 2017; Sauve-Syed 2017

Reviewing 3 health economics models
• Grossman Model of Health Capital (Grossman 1972)
• Selection and Scarring (Bozzoli, Deaton, Quintana-Domeque 2009)
• Fetal Origins Hypothesis (Barker 1992, 1995; Currie 1999; Almond and Currie 2010)
• Not mutually exclusive
17

Demand for health (Grossman 1972)
• Health is durable stock; depreciates with age; also directly in utility function
• Determines amount of time available for market activities
• Death when health < minimum stock• Can be increased (decreased) through
investment (disinvestment)• Contaminants in water can be considered
a disinvestment in health
18

19
Mean increases
SelectionMean decreases
ScarringPDF PDF
Scarring & selection (Bozzoli et al. 2009)

Could disentangle with generational data
20
Source: Gørgens, Meng, Vaithianathan 2012
• 1959–1961 Great Chinese Famine• Taller children are more likely to survive• But appeared to be no change in height• Could be because scarring + selection = 0• Disentangled using survivor’s children’s
height to proxy for unscarred height• Scarring results is that children < 5 who
survived grew up to be 1-2 cm shorter

Fetal origins hypothesis (Barker 1992, 1995)
• In utero environment can program a person for later life health
• Increased risk of hypertension, cardiovascular disease
• Latent health effect
21

• Selective attrition (culling)– The least healthy fetuses don’t survive– Lower fertility rates, but increased health
• Direct effect on infant health (scarring)– Shifts the health distribution to the left– Births that did occur measurably less healthy
• Indirect or latent effect on adult health
22
These models lead to several channels

Data: Michigan Vital Statistics 2008-15
• Birth data– Date of birth– Geocoded to the census tract level– Weeks of gestation– Gender of the child– Birth weight
• Define conception date = date of birth – weeks of gestation
23
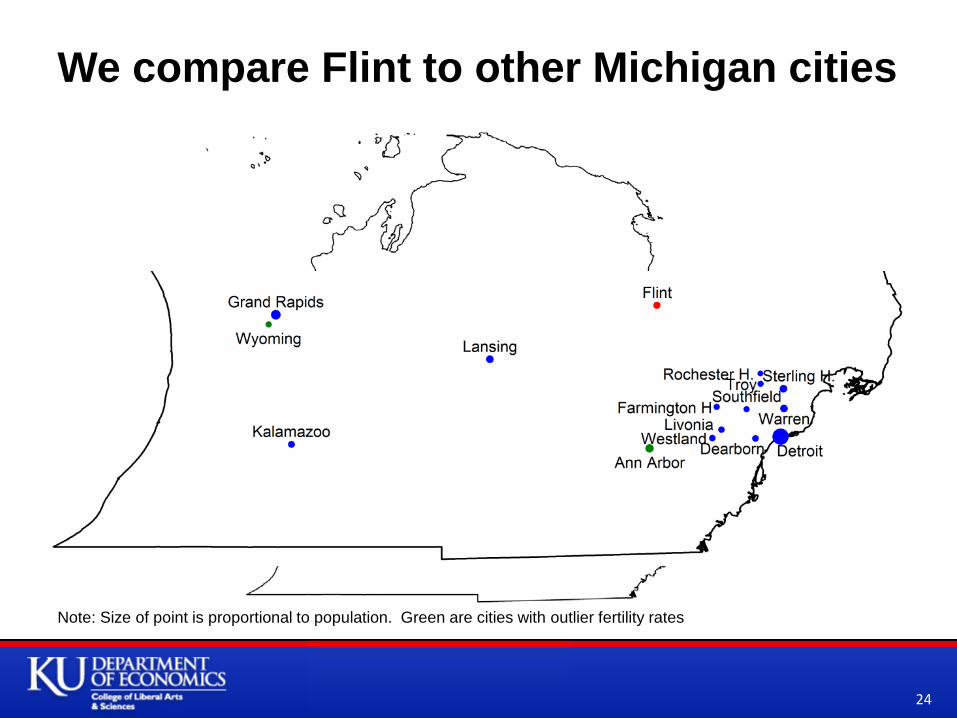
We compare Flint to other Michigan cities
24
Note: Size of point is proportional to population. Green are cities with outlier fertility rates

25
Outcomes• General fertility rate• Male-female ratio
=1 if conception date >= Nov 2013 & born in Flint(affected >= half of pregnancy)
Clustered at city level
City fixed effects
Month#yearfixed effects
Empirical structure: City panel over time
𝑂𝑂𝑂𝑂𝑂𝑂𝑂𝑂𝑂𝑂𝑂𝑂𝑂𝑂𝑐𝑐𝑐𝑐 = 𝑎𝑎 + 𝛽𝛽1𝑊𝑊𝑎𝑎𝑂𝑂𝑂𝑂𝑊𝑊𝑐𝑐𝑐𝑐 + 𝛼𝛼𝑐𝑐 + 𝛿𝛿𝑐𝑐 + 𝜀𝜀𝑐𝑐𝑐𝑐
For• c city• t month and
year

Look at annual general fertility rate (GFR)
26
𝐺𝐺𝐺𝐺𝐺𝐺15−49𝑐𝑐𝑐𝑐=
𝐵𝐵𝐵𝐵𝑊𝑊𝑂𝑂𝐵𝐵𝐵 𝑂𝑂𝑂𝑂 𝑤𝑤𝑂𝑂𝑂𝑂𝑂𝑂𝑤𝑤 𝑎𝑎𝑎𝑎𝑂𝑂 15 − 49𝑐𝑐𝑐𝑐𝑃𝑃𝑂𝑂𝑃𝑃𝑂𝑂𝑃𝑃𝑎𝑎𝑂𝑂𝐵𝐵𝑂𝑂𝑤𝑤 𝑂𝑂𝑜𝑜 𝑤𝑤𝑂𝑂𝑂𝑂𝑂𝑂𝑤𝑤 𝑎𝑎𝑎𝑎𝑂𝑂 15 − 49𝑐𝑐𝑐𝑐∗ 12 ∗ 1000

Monthly GFR is extremely noisy
27

28
Result easier to see in when smoothed
5560
6570
75G
FR (1
3 m
onth
mov
ing
aver
age)
1/07 1/09 1/11 1/13 1/15Conception Month and Year
15 Most Populous Cities in MI (excluding Flint) Flint

PrePre
Post
Post
0
10
20
30
40
50
60
70
80
Rest of Michigan Flint
GFR
Fertility rates decline in Flint
29

Pre PrePost
Post
49.649.8
5050.250.450.650.8
5151.251.4
Rest of Michigan Flint
Share of babies who
are male
Sex ratio shifts toward girls in Flint
30

In regression: GFR ↓12%; Sex ratio ↓1.8%
31
-10-9-8-7-6-5-4-3-2-10
ΔGFR
-0.016
-0.014
-0.012
-0.01
-0.008
-0.006
-0.004
-0.002
0
ΔSex Ratio
95% confidence interval 95% confidence interval

Our results are plausible in the literature
• Our question has not been studied in the economics literature
• But it has in the environmental science literature
• Edwards (2014) studied lead in water in Washington, D.C. in the 2000s
• Found that it led to a 12% decrease in fertility rate (same as us)
32

How many fewer kids?
33
• Women 15-49 in Flint 26,000• Coefficient -7.5• Months of treatment 17• Adjust for monthly vs. annual 1 / 12• Adjust for GFR per 1000 women 1 / 1000• 26,000 * -7.5 * 17 / 12 / 1000
≈ 276 fewer children

34
Primary robustness checks
• Flexible start date• Subsample analyses• American Time Use Survey (county level)• Google Trends (4-county level)• Dropping each control city• Randomization Inference• Synthetic Control• Imperfect Synthetic Control

Effect is not sensitive to start month
35
-12
-8
-4
0
4
8
12
Nov-06 Nov-07 Nov-08 Nov-09 Nov-10 Nov-11 Nov-12 Nov-13 Nov-14 Nov-15
Effect on GFR
Month "Treatment" Begins
Treatment for primaryspecification (Nov '13)

Flint mothers are relatively uneducated
36
No High School
Degree, 25%
Only High School
Degree, 35%
Some College (No Degree),
30%
Post-secondary
Degree, 10%
0% 20% 40% 60% 80% 100%

Fertility results are on more educated (?)
37
-40-30-20-10
01020304050ΔGFR
95% confidence interval

Sex ratio also on more educated (?)
38
-8%-6%-4%-2%0%2%4%6%
ΔSex Ratio95% confidence interval

(1) (2) (3) (4) (5)All No High
School Degree
Only High School Degree
Some College
(No Degree)
Post-secondary
DegreePanel A. GFR
-8.188*** 26.81** 9.124* -20.27*** -9.876***(1.112) (9.224) (4.836) (3.170) (2.079)
R-squared 0.247 0.091 0.101 0.149 0.204Mean 76.92 109.2 85.75 68.01 49.53
Panel B. Sex Ratio-0.0169*** 0.00944 0.00816 -0.0162* -0.0481***(0.00403) (0.0176) (0.00755) (0.00882) (0.00705)
R-squared 0.008 0.055 0.077 0.054 0.060Mean 0.493 0.505 0.501 0.523 0.487
Results are on some college (no degree)
39

Why are the results from the educated?
• Avoidance by more educated is possible, but unlikely to explain disparity in sex ratio
• College graduate group in Flint is very small (< 100 births post water change)
• The “some college” are really different– Not necessarily a convex combination of
college graduates and high school graduates– Many dropped out due to a shock, making
them more disadvantaged than those with no college (Pollak and Lundberg 2014)
40

Using populous counties instead of cities
41

Results hold at greater aggregation
42
-10-9-8-7-6-5-4-3-2-10
Main Result Counties County Groups
ΔGFR
95% confidence interval

Time spend having sex (ATUS) increases!
43
0
0.01
0.02
0.03
County-level CBSA-level
ΔShare reporting
time spent having sex
95% confidence interval

Flint Water (blue) & Lead (red)
44
Source: Google Trends; http://edition.cnn.com/2016/01/20/health/flint-water-crisis-timeline/index.html
0
10
20
30
40
50
60
70
80
90
100
Jan-04 Jan-05 Jan-06 Jan-07 Jan-08 Jan-09 Jan-10 Jan-11 Jan-12 Jan-13 Jan-14 Jan-15 Jan-16 Jan-17
Rel
ativ
e Se
arch
Vol
ume
First Hanna-Attisha report comes out
Situation becomes a national story; Governor apologizes and asks for federal and state aid
Nothing in April 2014

Abortion (g), condom (b), & contraception (r)
45
Source: Google Trends
0
10
20
30
40
50
60
70
80
90
100
Jan-04 Jan-05 Jan-06 Jan-07 Jan-08 Jan-09 Jan-10 Jan-11 Jan-12 Jan-13 Jan-14 Jan-15 Jan-16 Jan-17
Rel
ativ
e Se
arch
Vol
ume

Baby
46
Source: Google Trends
0
10
20
30
40
50
60
70
80
90
100
Jan-04 Jan-05 Jan-06 Jan-07 Jan-08 Jan-09 Jan-10 Jan-11 Jan-12 Jan-13 Jan-14 Jan-15 Jan-16 Jan-17
Rel
ativ
e Se
arch
Vol
ume

Moving (blue) & escape (red)
47
Source: Google Trends
0
10
20
30
40
50
60
70
80
90
100
Jan-04 Jan-05 Jan-06 Jan-07 Jan-08 Jan-09 Jan-10 Jan-11 Jan-12 Jan-13 Jan-14 Jan-15 Jan-16 Jan-17
Rel
ativ
e Se
arch
Vol
ume

Help
48
Source: Google Trends
0
10
20
30
40
50
60
70
80
90
100
Jan-04 Jan-05 Jan-06 Jan-07 Jan-08 Jan-09 Jan-10 Jan-11 Jan-12 Jan-13 Jan-14 Jan-15 Jan-16 Jan-17
Rel
ativ
e Se
arch
Vol
ume

Results are robust to omitting cities
49
Ann Arbor
Dearborn
Detroit
Farmington Hills
Grand Rapids
Kalamazoo
Lansing
Livonia
Rochester Hills
Southfield
Sterling Heights
Troy
Warren
Westland
Wyoming
-10-9-8-7-6-5-4-3-2-10
ΔGFR

50
Check using randomization inference
• Inference problem with only having one treated unit (Flint)
• Follow Cunningham & Shah (2017) which study RI decriminalizing indoor prostitution
• They assign treatment to each of the other 49 states in the US and look at distribution
• We’ll do this by assigning treatment to each of the 15 other cities in Michigan
• Variant of Fisher’s (1935) permutation test

51
Flint’s is the largest in magnitude
02
Freq
uenc
y
-10 -5 0 5Average Treatment Effect
Flint Comparison cities

Check using synthetic control method
• Want the mix of control cities that best matches Flint on pre-trends and levels
• Minimizes standard deviation between Flint and the weighted control covariates
• Covariates include– Fertility rate– Demographics: maternal educational
outcomes, race/ethnicity, sex of the child
52
Source: Abadie and Gardeazabal 2003; Abadie et al. 2010

53
1st used to study terrorism in Basque C.
Source: Abadie and Gardeazabal 2003

54
Check with a Catalonia as a placebo
Source: Abadie and Gardeazabal 2003

Synthetic control weights for Flint
55
Synthetic Flint WeightAnn Arbor 0Dearborn 0Detroit 0.599Farmington Hills 0Flint 0Grand Rapids 0Kalamazoo 0Lansing 0Livonia 0Rochester Hills 0Southfield 0Sterling Heights 0Troy 0Warren 0.401Westland 0Wyoming 0

Synthetic Flint better matches for GFR
56

The difference is bigger than placebos
57

58
Clearer if Wyoming is excluded

59
Average treatment effect is the largest

Imperfect synthetic control method
• Powell (2017) has a brand new method• Solves two problems
– Improves inconsistent pre-period match due to temporary spikes by matching pre-period outcomes predicted from flexible time trends
– Allows for treated group being an outlier by using treated group’s presence in other group’s synthetic controls
60

Example of second fix for outliers
61
Treated Unit Control Unit A Control Unit B
Outcome Variable
• Can’t use positive weights on A and B to match the treated unit
• But can weight the treated unit and B to match A
• Can then invert this match to get a weight for the treated unit
• Conceptually: allowing negative weights

Much better pre-period match
62
4050
6070
80G
FR
0 20 40 60 80 100Months
Flint Synthetic Control

Resulting inference is consistent
63
Flint
02
Freq
uenc
y
-10 -5 0 5 10Average Treatment Effect
Flint Comparison cities

64
𝐵𝐵𝐵𝐵𝑊𝑊𝑂𝑂𝐵𝑂𝑂𝑂𝑂𝑂𝑂𝑂𝑂𝑂𝑂𝑂𝑂𝑂𝑂𝑖𝑖𝑐𝑐𝑐𝑐 = 𝑎𝑎 + 𝛽𝛽1𝑊𝑊𝑎𝑎𝑂𝑂𝑂𝑂𝑊𝑊𝑖𝑖𝑐𝑐𝑐𝑐 + 𝛽𝛽2𝑋𝑋𝑖𝑖𝑐𝑐𝑐𝑐 + 𝛾𝛾𝑖𝑖𝑐𝑐𝑐𝑐 + 𝛿𝛿𝑐𝑐 + 𝜀𝜀𝑖𝑖𝑐𝑐𝑐𝑐
Analogous framework for birth outcomes
Birth outcomes• Birth weight• Gestational age• Gestational growth
=1 if conception date >= Nov 2013 & born in Flint(affected >= half of pregnancy)
Clustered at city level
Census tract fixed effect
Month and year fixed effects
For• i individual• c city• t month and
year
Controls for • Child: sex, race, ethnicity• Mother: marital status,
educational attainment

Pre
Pre
Post
Post
2900
2950
3000
3050
3100
3150
3200
3250
Rest of Michigan Flint
Birth weight (g)
Birth weight decline is ambiguous
65

Analogously ambiguous in a regression
66
-70-60-50-40-30-20-10
0102030
Difference inDifferences
+CensusTract FE
+Time FE +Child SexControl
+MomControls
ΔBirth weight (g)
95% confidence interval

Other outcomes also mostly ambiguous
67
-0.01
0.00
0.01
0.02
0.03
0.04
Share low birth weight
-0.25
-0.20
-0.15
-0.10
-0.05
0.00
0.05
0.10
Gestational Age (weeks)
-1.0
-0.8
-0.6
-0.4
-0.2
0.0
0.2
0.4
0.6
Gestational Growth (g/week)
95% confidence interval

0.0
002
.000
4.0
006
.000
8D
ensi
ty
0 2000 4000 6000 8000grams
Flint Pre-Water Flint Post-WaterNon-Flint Pre-Water Non-Flint Post-Water
68
Birth weight shows a slight leftward shift

Netting out selection from scarring
• Assume GFR ↓ 12.0% came from left tail of BW distribution (μ = 3082 g, σ = 632 g)
• 𝐸𝐸 𝑋𝑋 𝑋𝑋 > 𝜇𝜇 + 𝜎𝜎Φ−1 𝑃𝑃 = 𝜇𝜇 +𝜎𝜎𝜎𝜎 Φ−1 𝑝𝑝
1−𝑝𝑝
• = 3242 g• = 3217 g after diff in diff trend• Actual post μ = 3042 g • ↓ 5.4% on 3217 g (-175 g)
69
Source: Bozzoli, Deaton, and Quintana-Domenque (2009)

Results are robust to many checks, e.g.:
• Ln(births)• Fixed effect Poisson• Stratifying by mother’s race or age • Omitting cities with outlier GFR• Only children conceived <= Sep 2014• Flint vs. Genesee County• Falsification: Rest of Genesee vs. others
70

-12-10-8-6-4-202
Main Result Omitting AnnArbor &
Wyoming
Onlyconceptionsbefore Sept
2014
Flint vs.Genesee
Genesse w/oFlint vs. Rest
ΔGFR(pre-period mean=62)
Results are robust to many checks
71
95% confidence interval

Water switch → scarring and selection
• 12% decrease in fertility rate• ≈ 276 fewer children born in Flint• 1.9% shift in sex ratio toward more female• 5.4% decrease in birth weight of survivors• Not explained by a behavioral responses• Cutting government funding could cause
this tragedy to repeat itself in other cities
72
This project is just the beginning
• We will purchase linked Medicaid and birth data for the births affected the water crisis
• We will investigate its impact on– Medicaid take up rates – Previously forgone preventive care– Wasteful medical spending
• Also allows us to follow mothers as they move out of Flint and calculate avoidance
73

Questions?
74

[Date]
Thank you!