THE IMPACT OF THE AIFTA FREE TRADE AGREEMENT IN ... · agreement is known as the ASEAN India Free...
14
1 THE IMPACT OF THE AIFTA FREE TRADE AGREEMENT IN MANUFACTURED TRADE OF THE MEMBER COUNTRIES Haryadi Faculty of Economic and Business, University of Jambi, Indonesia Phone: +6281366573010, +628127410103. Fax number: +62741583317 Corresponding authors: [email protected] ABSTRACT This study has three objectives. First, to analyze the map and the flow of the AIFTA (AIFTA) trade both intra and extra ASEAN region. Second, to analyze the position of Indonesia in terms of trade among AIFTA members. Third, to explore the impacts of tariff elimination on the performance of trade of each member country, in particular for Indonesia. General Equilibrium Model and General Trade Analysis Project (GTAP) have been used in answering the research objectives. The research has been focused in ASEAN5 + India. The results show that Trade flow among AIFTA is still small compared with the trade carried out with extra ASEAN countries. The share of intra AIFTA Trade is still below 20 percent. Nevertheless, there is a tendency for members to increase their trade activities in recent years. In terms of intra ASEAN + India, all ASEAN 5 and India (Singapore, Malaysia, Indonesia, Thailand, The Philippines, and India) will experience an increase in their trade activities both in their import and their export. The implementation of the AIFTA Free Trade will encourage the trade creation and trade diversion intra AIFTA. It can be concluded that the AIFTA Free Trade will create a chance for all members to increase their trade activities. Nevertheless, this Agreement still need more time to be implemented. It is necessary to give a chance to the members to prepare their competitiveness. Keywords: AIFTA, International Trade, GTAP Model INTRODUCTION Since May 2010 ASEAN has signed a free trade agreement with India. This agreement is known as the ASEAN India Free Trade Area (AIFTA). The possibility of opening up export opportunities to India after the agreement is quite reasonable because India has been a country that is quite protective of imports since a long time. Progress in India-ASEAN connectivity is also supported by the "Look East Policy". There was a sharp increase of Indian exports to ASEAN countries in recent years. As a proof, in 2010, total trade between ASEAN and India reached 55.4 billion dollars, up 42 percent compared with 2009. Besides that, the value of the AIFTA trade has also penetrated 70 billion U.S. dollars in 2012. The question that arises is whether the imposition of AIFTA region is able to improve the welfare of all member countries? Is this implementation only able to lead the strong ASEAN countries to get stronger and the weak will get weaker? Looking at
Transcript of THE IMPACT OF THE AIFTA FREE TRADE AGREEMENT IN ... · agreement is known as the ASEAN India Free...
1
THE IMPACT OF THE AIFTA FREE TRADE AGREEMENT IN
MANUFACTURED TRADE OF THE
MEMBER COUNTRIES
Haryadi
Faculty of Economic and Business, University of Jambi, Indonesia
Phone: +6281366573010, +628127410103. Fax number: +62741583317
Corresponding authors: [email protected]
ABSTRACT
This study has three objectives. First, to analyze the map and the flow of the
AIFTA (AIFTA) trade both intra and extra ASEAN region. Second, to analyze the
position of Indonesia in terms of trade among AIFTA members. Third, to explore the
impacts of tariff elimination on the performance of trade of each member country, in
particular for Indonesia. General Equilibrium Model and General Trade Analysis
Project (GTAP) have been used in answering the research objectives. The research
has been focused in ASEAN5 + India.
The results show that Trade flow among AIFTA is still small compared with the
trade carried out with extra ASEAN countries. The share of intra AIFTA Trade is still
below 20 percent. Nevertheless, there is a tendency for members to increase their
trade activities in recent years. In terms of intra ASEAN + India, all ASEAN 5 and
India (Singapore, Malaysia, Indonesia, Thailand, The Philippines, and India) will
experience an increase in their trade activities both in their import and their export.
The implementation of the AIFTA Free Trade will encourage the trade creation and
trade diversion intra AIFTA.
It can be concluded that the AIFTA Free Trade will create a chance for all
members to increase their trade activities. Nevertheless, this Agreement still need
more time to be implemented. It is necessary to give a chance to the members to
prepare their competitiveness.
Keywords: AIFTA, International Trade, GTAP Model
INTRODUCTION
Since May 2010 ASEAN has signed a free trade agreement with India. This
agreement is known as the ASEAN India Free Trade Area (AIFTA). The possibility
of opening up export opportunities to India after the agreement is quite reasonable
because India has been a country that is quite protective of imports since a long time.
Progress in India-ASEAN connectivity is also supported by the "Look East
Policy". There was a sharp increase of Indian exports to ASEAN countries in recent
years. As a proof, in 2010, total trade between ASEAN and India reached 55.4 billion
dollars, up 42 percent compared with 2009. Besides that, the value of the AIFTA
trade has also penetrated 70 billion U.S. dollars in 2012.
The question that arises is whether the imposition of AIFTA region is able to
improve the welfare of all member countries? Is this implementation only able to lead
the strong ASEAN countries to get stronger and the weak will get weaker? Looking at

2
the various issues that are likely to arise and to anticipate the impact of tariff policy in
AIFTA, it is necessary to find an answer whether the AIFTA trade (AIFTA) can be
beneficial or detrimental to all states members or several of them. Is the
implementation of the AIFTA able to fix Indonesia's trade balance position, or even
vice versa Indonesian imports will increase if AIFTA implement zero tariff?.
The study aims to assess the impact of AIFTA on Indonesian macroeconomic
performance. In particular, the purpose of the research are as follows: (1) to analyze
the maps and the trade flows among AIFTA member countries, (2) to analyze the
position of Indonesia in the context of trade between AIFTA member countries, (3) to
explore the impact of tariff elimination policy in exports and imports of each AIFTA
member countries.
2. LITERATURE REVIEW
2.1. ASEAN International Trade
Although the AIFTA trade volumes continue to increase in the last two
decades, but until now India has not been a major trading partner of ASEAN (Table
1). ASEAN's main export partner is China, followed by the European Union
countries, as well as Japan and the United States. Based on the same table, India is
also not being the main origin countries of ASEAN imports. India ranks only ninth
major imports from ASEAN origin. The contribution of trade with India is just 2.7
percent. This figure is equal to the contribution of ASEAN trade with Australia and
Hong Kong.
Tabel 1. Top 10 ASEAN Partners in Trade
Trade partner
country/region1/
Value Share to total ASEAN trade
Exports Imports Total trade Exports Imports Total
trade
ASEAN 267,981.0 251,823.8 519,804.7 25.0 25.8 25.4
China 112,999.8 119,013.4 232,013.2 10.6 12.2 11.3
EU-27 115,036.4 93,548.4 208,584.8 10.7 9.6 10.2
Japan 102,890.8 103,746.3 206,637.1 9.6 10.6 10.1
USA 100,464.7 86,220.0 186,684.7 9.4 8.8 9.1
Republic of Korea 44,980.1 53,648.2 98,628.3 4.2 5.5 4.8
India 36,028.7 19,414.7 55,443.4 3.4 2.0 2.7
Australia 35,250.8 20,175.4 55,426.3 3.3 2.1 2.7
Hong Kong 33,039.4 21,292.3 54,331.7 3.1 2.2 2.7
Taiwan 16,122.3 18,989.3 35,111.6 1.5 1.9 1.7
Total top ten trade
partner countries 864,794.0 787,871.8 1,652,665.8
80.8
80.8
80.8
Others2/
206,147.4 186,917.8 393,065.2 19.2 19.2 19.2
Total 1,070,941.4 974,789.6 2,045,731.0 100.0 100.0 100.0
Sources: ASEANSec. (2013)
Nevertheless, India is quite important for ASEAN particularly for Indonesia.
The implementation of AIFTA is expected to boost Indonesian exports. India is
currently ranked 6th Indonesia's main export destination with contribute of 7.4 percent
of Indonesia's total exports. Therefore, in the implementation of free trade, Indonesia
should be able to take steps carefully. This step is important so that the desired goal
can actually be achieved, especially after the AIFTA set a zero rate in 2016.

3
Y
X
120
100
80
60 40 20 20 40 60 80 100 120 140
60
40
20
0
20
40
60
80
Y
X
E
E’
E’
Country 1
Country 2
PB=PB’=1
1 2 III
III’
Tabel 2. Market Structure of Indonesian Export
No Destination Persen
1 China 12.3
2 Japan 10.9
3 United States of America 10.8
4 Singapore 9.3
5 India 7.4
Sources: Central Bank of Indonesia, 2014
2.2. Theory and Distortion in International Trade
Difference resources owned by countries push them to produce a product that
can be produced at a relatively lower cost compare with other countries, and then sell
that product to other countries that produce it with relatively more expensive. This
policy will provide benefits or gains from trade in each country. (Caves et. Al., 1993;
Chacoliades, 1978; Dunn Jr. and Mutti (2000), Krugman and Obstfeld (2000) and
Salvatore, 2000).
Figure 1. Process of Trade Between Two Countries point E *).

4
The process of trading can be described as in Figure 1. Upon the trade takes
place, the state 1 will produce 130X and 20Y (point E which is identical to consume
70X and 80Y (also indicated by point E are the same but drawn from the central axis
or 0), while the 60X and 60Y will trade the rest of the country 2.
Meanwhile, country 2 produces 40X and 120Y (point E 'are also sources :
Salvatore (2000) is identical to point E *). State 2 consumes 100X and 60Y (also
symbolized by point E 'are the same, but refers to the central axis or 0), while the rest
will be traded with countries 1. The country will consume 70X and 80Y (also
indicated by point E are the same but drawn from the central axis or 0), while the 60X
and 60Y will trade with the rest of the country 2. Meanwhile, country 2 produces 40X
and 120Y (point E 'are also sources : Salvatore (2000) is identical to point E *). State
2 consumes 100X and 60Y (also symbolized by point E 'are the same, but refers to the
central axis or 0), while the rest will be traded with countries 1.
2.3. Previous studies about an Impact of Trade Liberalization
There are some researchers who have studied and analyzed the impact of
liberalization on economic performance either in the context of a country or in a
broader context. The results are varied. Some find a positive effect while others find
negative effects.
Devaragan et.al. (1990) look at the impact of trade liberalization which is
focused on the two sectors model. Using simultaneous equations, they found that the
change in terms of trade (TOT) in African countries on one hand has raised the
income effect which causes the demand for domestic goods raised sharply. On the
other hand the policy would not be able to create economic recovery for these
countries, in fact, it would be worsening their trade balance. This finding is consistent
Paulino and Thirwall (2004).
Another examination of the impact of trade liberalization was also carried out
by Lopez (2003). In his study, Lopez examined the impact of regional trade
liberalization, including NAFTA, on the balance of payments and balance of
Mexico’s trade during the 1980s. He come to the conclusion that trade reforms during
the 1980s significantly affects trade, export and import. It is, however, the effects of
NAFTA can be ignored. It means that NAFTA did not give any effect on exports and
imports as well as Mexico's balance of payments. There is a prediction that the
differences in economic structure of member countries are not the cause of the
emergence of such effects.
In the context of AFTA, impact of trade liberalization has been examined by
the Judge (2004), Oktaviani (2000), Oktaviani et.al. (2008), and Haryadi (2008). The
finding showed that the impact of AFTA was significant enough for the economy of
member countries. Using Recursive Dynamic Multi-Region Computable General
Equilibrium, trade liberalization is predicted to increase trade among member
countries of ASEAN as a whole. It is, however, among the ASEAN member
countries, Indonesia is one of members that experience the smallest increase in real
GDP.
Emilia and Haryadi (2009) found that Trade flow among ASEAN countries
still small compared with the trade taking with developed countries. The share of intra
ASEAN Trade is still below 20 percent. In terms of intra ASEAN, ASEAN 5

5
(Singapore, Malaysia, Indonesia, Thailand, and The Philippines) still dominate the
trade activities. Meanwhile, the new comers such as Vietnam, Brunei, Lao, and
Cambodian are still left behind.
3. METHODS
3.1. Types and Sources of Data
This study use secondary data and mostly from a database of The General
Trade Analysis Project (GTAP) version 8. Other complementary data derived from
relevant agencies such as the World Bank, the International Monetary Fund, Bank
Indonesia, Central Bureau of Statistics, ASEANSecretary, Ministry of Commerce,
Ministry of Industry, Department of Foreign Affairs and others.
Table 3. Aggregation of Countries/Regions based on GTAP Aggregation
Aggregation based on GTAP Database
New Aggregation
Old Region Code Description
1 Chn China China
2 Ind India India
3 Jpn Japan Japan
4 Ina Indonesia Indonesia
5 Mys Malaysia Malaysia
6 Tha Thailand Thailand
7 Phl Philippines Philippinnes
8 Vnm Vietnam Vietnam
9 Spr Singapore Singapore
10 XSE Other Asean Other ASEAN
11 USA USA USA
12 EU European
Union
Austria;Belgium; Denmark; Finland; France;
Germany; United Kingdom;Greece;Ireland; Italy;
Luxemburg;Netherlands;Portugal;Spain:Sweden
12 ROW All other
region
Rest of Oceania; Hong Kong; Taiwan; Rest of East
Asia; Singapore; Rest of Southeast Asia; Canada;
Mexico; Rest of Neorth America; Columbia; Rest of
Andrean Pact; Argentina; Brazil: XChile; Uruguay; Rest
of South America; Central America; Rest of FTAA;
Rest of The Carribian; Switzeland; Rest of EFTA; Rest
of Europe; Albania; Bulgaria; Croatia; Cyprus; Czech
Republic; Hungaria; Malta; Poland; Romania; Slovakia;
Slovenia; Estoria; Latvia; Lithuania; Russian
Federation; Rest of Former Soviet Union; Rest of
Middle East; Morocco; Tunisia; Rest of North Africa;
South Africa; Rest of South African CU; Malawi; Resto
of Sub-Saharan Africa; Armenia; Azerbaijan; Georgia;
Iran; Rest of Western Asia; Ethiopia; Nigeria; Sinegal;
Ukraina; Rest of Eastern Europe; Norway; Costa Rica;
Guatemala; Nicaragua; Panama; Egypt.

6
The main analytical tool used is a multicounty CGE model GTAP 8 which has been
agregated in to 129 countries/regions and 57 commodity sectors. Data country/region
and many sectors will be grouped and separated in accordance with the purposes of
this study. The process of sorting and merging this (disaggregation and aggregation)
will be determined by a variety of considerations: (1) for the ASEAN countries, while
these countries stand alone in the GTAP data base, it will be left to stand alone, but
when in the data base ASEAN member countries are located in an area that would
normally be left to join because its contribution in the international trade is quite
small. The same condition will be treated in the commodities sector, (2)
manufacturing commodities are separated by industry groups such as those found in
the data base GTAP 8. Based on the above considerations, the countries or regions
will be aggregated into 13 regions, while commodities are grouped into 16. The
structure, model and application of GTAP is explained clearly by Hertel (1997), and
Hertel and Tsigas (1997).
Table 4. Aggregation of sectors based on GTAP Aggregation
Aggregation based on GTAP’s Database
New Sector
New Sector Description
New Product Code Comprising
1 textile tex
2 Wearing Apparel Wearing Apparel wap
3 Leather Leather Products lea
4 Wood Wood products lum
5 Paper Paper Products ppp
6 Chemical Chemical, rubber, plastic
products
crp
7 motor Motor Vehicle and parts,
Tansport equipments
mvh otn
8 electronic Electronic equipments ele
9 machinary mesin-mesin ome
10 Palm Oil Crude Palm Oil vol
11 Other Vegetable Oil Other Vegetable Oil osd
12 Food Food made of sugar,milk,
and other
c_b mil sgr ofd b_t
13 Other Manufacture Other Manufacture omf
14 Agriculture Agriculture pdr wht gro v_f osd c_b
pfb ocr ctl oap rmk wol frs
fsh omt mil pcr sgr ofd b_t
15 Mining Coal, oil and gas, mineral
products
coa oil gas omn p_c nmm
i_s nfm fmp
16 Services Services and activities NES ely gdt wtr cns trd otp wtp
atp cmn ofi isr obs ros osg
dwe
GTAP in the data base contained 129 countries / regions and 57 commodity sectors.
Data country / region and many sectors will be grouped and separated in accordance
with the purposes of this study. The process of sorting and merging this

7
(disaggregation and aggregation) will be determined by a variety of considerations:
(1) for the ASEAN countries, while these countries stand alone in the GTAP data
base, it will be left to stand alone, but when in the data base ASEAN member
countries are located in an area that would normally be left to join because its
contribution in the international trade is quite small. The same condition will be
treated in the commodities sector, (2) manufacturing commodities are separated by
industry groups such as those found in the data base GTAP 6.2. Basing on the above
considerations, it is planned to study the countries or regions will be aggregated into
13 regions (Table 3), while commodities are grouped into 16 (Table 4).
3.4. Simulation policies
Simulation of the impact of policy on the elimination of trade tariffs is done by
removing import tariffs in total either included in Inclusion List, Temporary List,
Sensitive List, and General Exception List. This simulation aims to accommodate the
AIFTA agreement which eliminates tariffs in total no later than in 2020.
4. RESULTS AND DISCUSSIONS
4.1. Flow Map of Indonesian Trade And its Position among ASEAN Countries
and India
Among seven countries / territories, Singapore appears to be a major
destination countries (Table 5). It means that Singapore is a promising market for all
ASEAN members. Total of Singapore export achieved US$118,182.1 million, or ¼ of
the total of trade among ASEAN India which achieved US$ 488.051.1 Million.
Tabel 5. Map of Intra ASEAN Trade Flows Based On Market Price
US$ Million
Country Ina Mys Tha Phl Spr India A+I ROW Total
Ina 0 2478.5 1648.4 937.8 5498.4 648.8 11211.9 66935.2 78147.1
Mys 1662 0 3569.1 1314.6 19108.7 1317.3 26971.7 107110.9 134082.6
Tha 1400.8 3450.9 0 1304 5054.3 2719.9 13929.9 76047.6 89977.5
Phl 190.8 1328.9 1634.1 0 2752.5 119.6 6025.9 34518.5 40544.4
Spr 3404.9 12994.2 4317.3 2768.2 0 3170.7 26655.3 91526.8 118182.1
India 205.5 457.7 1560.5 417.1 1163.4 0 3804.2 23313.2 27117.4
A+I 6864 20710.2 12729.4 6741.7 33577.3 7976.3 88598.9 399452.2 488051.1
ROW 36958.1 55356 53016.4 36380.9 83136.7 22676.4 5890797 996987.90 6887784.90
Total 47047.1 80257.3 69508.8 44992.3 124483.5 35028.1 6660762 715074 7375836
where: Ina = Indonesia; Mys = Malaysia; Phl = Philipina; Spr = Singapura; India =
India; A+I = ASEAN + India; ROW = Rest of the World
This fact shows that Singapore has been a center of trade in the ASEAN
region and also a transit place for product from overseas (Table 6). These countries
are Indonesia, Malaysia, Thailand, Philippines, Vietnam, and India. In this study,
other ASEAN countries are Lao, Cambodia, Myan Mar, and Brunei Darussalam.

8
Table 6. Countries Major Destination of the AIFTA Regional Export
Country/Region Main Destination of Export
I II II
Indonesia Singapore Malaysia Indonesia
Malaysia Singapore Thailand Indonesia
Philipines Singapore Malaysia Thailand
Thailand Singapore Malaysia Indonesia
Vietnam Singapore Thailand Philipines
Singapore Malaysia Thailand Indonesia
India Singapore Thailand Malaysia
Source: GTAP 8. (Processed)
Where,
I = the country's largest export destination
II = second largest export destination
III = third largest export destination
Different with the export target, ASEAN members and India are still placing
Singapore as the main origin of imports (Table 7). Among the seven countries
included in the simulation, all of them put Singapore as the main countries of origin of
their imports.
Table 7. Countries Become Major Destination Trade in the ASEAN Region
Country
Origin of Import
I II III
Indonesia Singapore Thailand Malaysia
Malaysia Singapore Thailand Indonesia
Philipines Singapore Malaysia Indonesia
Thailand Singapore Malaysia Indonesia
Vietnam Singapore Thailand Indonesia
Singapore Malaysia Indonesia Thailand
India Thailand Singapore Malaysia
Source: GTAP 8. (processed)
Where,
I = country largest import origin
II = second largest import origin country
III = third largest import origin country
When further examination was carried out among other ASEAN countries, it
can be seen than only Laos which places Thailand as the main supplier of its domestic
market. This condition is expected to have a closely related to the regional location.
Thailand is a country which borders with Laos.
4.2. Indonesian Position among the ASEAN and India
Map of the status and position of Indonesian trade among ASEAN+India can
be seen in Table 8. Based on the table, it can be seen that, overall, Indonesia is a net
exporter of manufactured products.
9
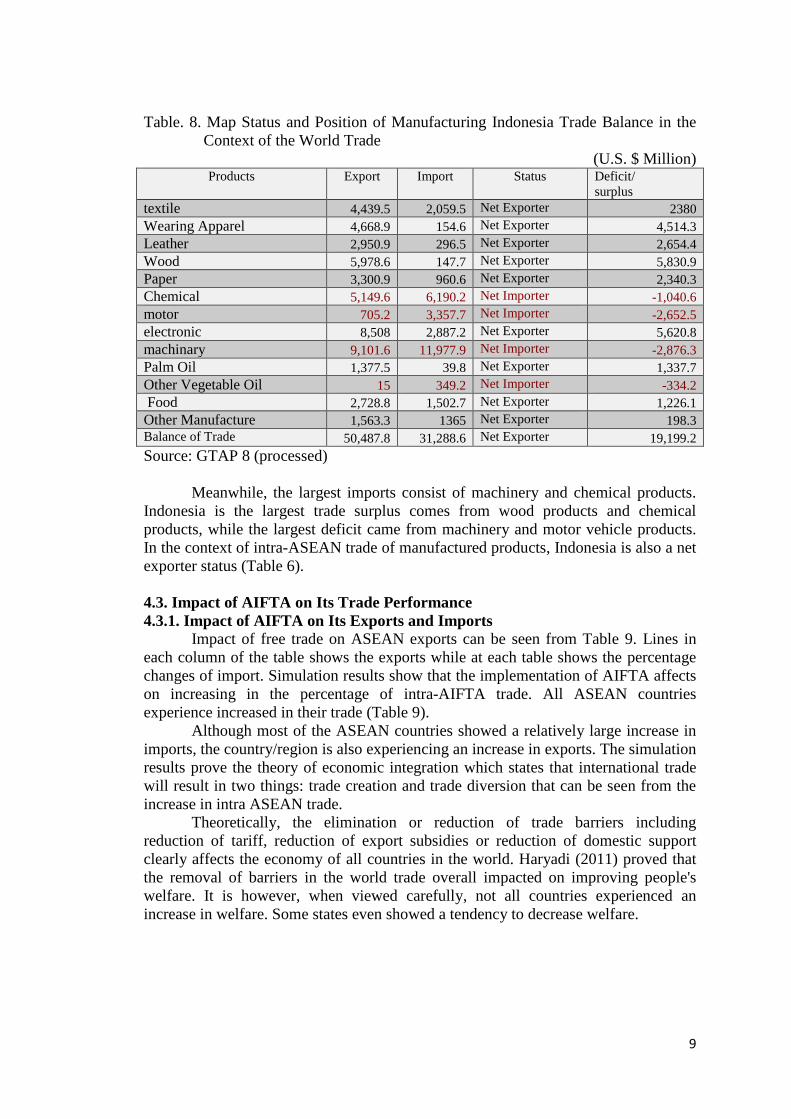
Table. 8. Map Status and Position of Manufacturing Indonesia Trade Balance in the
Context of the World Trade
(U.S. $ Million) Products Export Import Status Deficit/
surplus
textile 4,439.5 2,059.5 Net Exporter 2380
Wearing Apparel 4,668.9 154.6 Net Exporter 4,514.3
Leather 2,950.9 296.5 Net Exporter 2,654.4
Wood 5,978.6 147.7 Net Exporter 5,830.9
Paper 3,300.9 960.6 Net Exporter 2,340.3
Chemical 5,149.6 6,190.2 Net Importer -1,040.6
motor 705.2 3,357.7 Net Importer -2,652.5
electronic 8,508 2,887.2 Net Exporter 5,620.8
machinary 9,101.6 11,977.9 Net Importer -2,876.3
Palm Oil 1,377.5 39.8 Net Exporter 1,337.7
Other Vegetable Oil 15 349.2 Net Importer -334.2
Food 2,728.8 1,502.7 Net Exporter 1,226.1
Other Manufacture 1,563.3 1365 Net Exporter 198.3
Balance of Trade 50,487.8 31,288.6 Net Exporter 19,199.2
Source: GTAP 8 (processed)
Meanwhile, the largest imports consist of machinery and chemical products.
Indonesia is the largest trade surplus comes from wood products and chemical
products, while the largest deficit came from machinery and motor vehicle products.
In the context of intra-ASEAN trade of manufactured products, Indonesia is also a net
exporter status (Table 6).
4.3. Impact of AIFTA on Its Trade Performance
4.3.1. Impact of AIFTA on Its Exports and Imports
Impact of free trade on ASEAN exports can be seen from Table 9. Lines in
each column of the table shows the exports while at each table shows the percentage
changes of import. Simulation results show that the implementation of AIFTA affects
on increasing in the percentage of intra-AIFTA trade. All ASEAN countries
experience increased in their trade (Table 9).
Although most of the ASEAN countries showed a relatively large increase in
imports, the country/region is also experiencing an increase in exports. The simulation
results prove the theory of economic integration which states that international trade
will result in two things: trade creation and trade diversion that can be seen from the
increase in intra ASEAN trade.
Theoretically, the elimination or reduction of trade barriers including
reduction of tariff, reduction of export subsidies or reduction of domestic support
clearly affects the economy of all countries in the world. Haryadi (2011) proved that
the removal of barriers in the world trade overall impacted on improving people's
welfare. It is however, when viewed carefully, not all countries experienced an
increase in welfare. Some states even showed a tendency to decrease welfare.

10
Table 9. Impact of the ASEAN India Free Trade on Members Trade Balance
(percent) Product/ Countries
Indonesia
Malaysia
Thailand
Philipina
Vietnam
Singapura
India
textile
Wearing
Apparel
Export 79.66 51.92 72.24 165.26 40.50 91.16 149.2
Import 39.74 73.94 156.35 26.92 113.1 2.84 37.02
Leather
Wood
Export 115.67 50.02 72.25 64.74 115.3 143.52 136.4
Import 57.12 70.17 164.38 33.14 138.6 2.11 32.36
Paper
Chemical
Export 49.49 79.07 29.07 136.28 154.1 77.77 76.67
Import 31.65 86.94 237.43 35.27 185.1 2.34 23.73
motor
electronic
Export 51.06 13.27 36.94 86.87 46.88 47.43 63.88
Import 18.05 23.21 125.27 18.44 149.6 -0.14 11.88
machinary
Palm Oil
Export 25.74 53.92 25.61 42.05 69.63 20.32 29.09
Import 22.32 36.17 96.54 15.56 88.78 4.54 2.48
Other
Vegetable Oil
Food
Export 22.42 22.44 15.15 29.76 19.67 19.59 79.77
Import 24.92 20.71 67.02 18.21 71.94 1.82 4.19
Other
Manufacture
textile
Export 170.80 144.62 150.40 157.76 99.62 40.90 177.7
Import 75.49 123.81 261.24 79.88 324.1 5.66 71.67
Wearing
Apparel
Leather
Export 39.05 22.51 63.71 4.23 11.45 16.34 300.7
Import 13.83 5.95 49.27 4.88 348.36 1.21 34.50
Wood
Paper
Export 34.18 34.21 24.07 28.13 42.56 27.08 34.22
Import 16.87 26.76 83.27 17.99 70.30 1.41 7.86
Chemical
motor
Export 14.79 27.88 -12.77 -21.30 -11.62 44.50 4.20
Import 5.39 6.12 34.72 10.93 -13.62 5.74 -3.61
electronic
machinary
Export 79.94 31.61 22.87 4.29 -5.03 64.59 42.40
Import -5.01 -2.18 217.33 6.04 23.42 5.34 -4.27
Palm Oil
Other
Vegetable Oil
Export 89.27 65.53 17.03 50.94 33.64 82.11 77.14
Import 30.11 33.73 207.84 13.53 94.26 8.56 27.64
Food Export 119.76 79.00 137.39 90.82 115.8 49.93 56.22
Import 138.08 17.10 144.75 119.91 141.9 0.99 86.13
4.3.2. Free trade and Welfare The results of the simulations performed in this study were also showing the
same thing. The implementation of the ASEAN-India free trade is managed to
improve the welfare of society as a whole (Table 10).

11
Table 10. Impacts Implementation of ASEAN-INDIA Free Trade on
World.Macroeconomic Performance .
However, if it is explored further, the policy was not able to improve the welfare of
the people in all members. This means that the implementation of AIFTA will not be
able to create a free trade welfare evenly.
As it is shown in Figure 2, from 7 aggregations ASEAN-INDIA, there are
only 5 countries show an increase in welfare as a result of treatment of free trade in
the region. The five countries increasing their welfare are Indonesia, Malaysia,
Thailand, Philippines, and Singapore. All these countries are those that already exist
Figure 2. Enforcement Impact of ASEAN-INDIA Free Trade against Welfare
Member State
and are founding members of ASEAN-INDIA. In contrast countries those are new in
the ASEAN-INDIA economic foundation and has relatively less powerful in fact
harmed by the implementation of zero tariff on ASEAN-INDIA, including India.
4.3.3. Economic analysis
The impact of the implementation of the AIFTA free trade on the performance
trade member has successfully explored. As it was expected, the impact of the
implementation of zero tariff policy is intended to improve the welfare of society as a
whole. It is however, when it is examined further turns the impacts are not uniformly
distributed. Each member countries get different effects.
Indonesia, Malaysia, and Singapore are three of the eleven member countries
of the AIFTA which is enjoying zero tariff policy implemented in the region.
Meanwhile, member states of the AIFTA such as Thailand, Philippines, Vietnam,
Brunei, Laos, Cambodia, and Myanmar did not obtain significant positive impact.
The simulation results show that there are 3 (three) important points of interest
in deeply observed: (1) the impact of liberalization has led to the increase in exports
in almost all member states of the AIFTA, (2) concurrent impact of rising exports, the
Indicators Change
World Trade Price Index 0.0001%
World Trade Volume 0.0015%
World Trade Value 0.0016%
Walras Demand -0.0006%
Walras Suooly -0.0006%
0
World Welfare US$ 254.2 Billion

12
implementation of the ASEAN free trade area-INDIA has also led to a surge in
imports in almost all countries, (3) the impact of the increase in exports and imports in
each AIFTA differ between each other.
The increase in exports and imports with different magnitudes cause the net
impact received by the member states also differ. Countries such as Indonesia,
Malaysia, Thailand, Philippines, and Singapore enjoy the positive impact of the zero
tariff policy. This impact is shown by an increase in the welfare of each of these
countries (Figure 4). In contrast, a relatively new member states enter as members of
the AIFTA harmed due to a decrease in the level of welfare.
One of the interesting points could be shown as the results of the investigation.
The results showed that at the time of the ASEAN free trade area-INDIA
implemented, there will be an increase in the volume of trade among the member
countries of the AIFTA. The increase in trading volume is shown in the form of
increased exports, followed by an increase in imports. Thus the integration of
economic theory that states that free trade would create an increase in the volume of
trade (trade creation) can be proven.
These findings also suggest that the implementation of free trade will create
opportunities for member countries to increase the intensity of trade in the pursuit of
foreign exchange. The intensity of the trade can be done by considering the greater
export opportunities. The findings suggest that the implementation of free trade will
result in the transfer of trading activities from outside to inside of member countries.
It is However, not all countries of the AIFTA experience an increase in their trade
shows. For example, the country of Thailand is still focusing its trade with countries
outside AIFTA. The visible indication of Thailand's trade balance shows that
percentage of increase in exports is smaller than the increase in imports, while exports
outside Thailand to the AIFTA show improvement.
The increase in the volume of trade among the AIFTA countries is strongly
influenced by the level of tariffs applied before the policy deletion done. If the rate of
pre-application level zero rate of a country is high enough, then the country will be
negatively impacted if the free trade is carried out. Striking example occurred in the
country of Thailand. Among the member countries of the AIFTA, Thailand is the
highest level of protection. The impact would be occurred if the AIFTA Free Trade is
implemented, then the product of Thailand will be hard to compete at the level of the
AIFTA. Therefore, from the simulation results it appears that Thailand experienced a
smaller increase in exports even sometimes tend to decline to trade among the
AIFTA. In contrast imports from AIFTA Thailand generally increases sharply if the
zero rate applied current. Some countries are unable to compete in the AIFTA shift
some of its exports to countries outside the AIFTA. One indication of this is shown by
Thailand. Some Thai products such as food, motorcycles and other products showed
an increase in export to AIFTA.
5. CONCLUSION AND POLICY IMPLICATIONS Based on the description and explanation that has been given in the previous
section, it can be drawn a conclusion and policy implications.
1. Countries of the AIFTA still have a relatively large dependence on the developed
world, either as their export destination or as a major supplier of their domestic
needs, so the external trade with AIFTA is greater than their internal.
2. The power of the economy, especially in the context of manufactured commodity
traded by the AIFTA is still dominated by Singapore, followed by Malaysia and
Indonesia, Thailand and Philippines, nevertheless, the implementation of ASEAN

13
-India free trade area will have an impact on trade creation (increase in trading
volume in the internal region) and trade diversion (change in the flow of trade
from external trade to internal trade).
3. The Impact of this policy on the welfare largely enjoyed by the ASEAN five
(Indonesia, Malaysia, Thailand, Philippines, and Singapore's), all of whom are
founding members of the AIFTA and has particularly been relatively more
advanced economies than other countries in ASEAN.
Based on the above conclusions, the policy implementation of this study are as
follows.
1. Simulation results show that the AIFTA dependence on external trade is still
relatively high. The intra-AIFTA trade is lower than those of extra trade of the
AIFTA. This dependence is mainly caused by the trade orientation of the Member
States of the AIFTA that is still concentrated to countries outside AIFTA. In
addition, the factors cause the price level is estimated as the product of a country
outside AIFTA relatively low, therefore, although the tariff was abolished but will
not greatly affect the manufacturing trade of the AIFTA. To reduce the level of
dependence, the AIFTA must continue to improve the competitiveness that tariff
cut further strengthen and improve the internal trade of the AIFTA.
2. Simulation results show that the elimination of domestic support can improve the
welfare of the AIFTA and the world as a whole. However, when viewed in more
detail, it turns out not all AIFTA enjoying the effects of free trade. Most AIFTA
especially a relatively new entry into the AIFTA decreased levels of well-being.
Therefore, the removal of barriers to intra-ASEAN trade-INDIA should be done
gradually. This policy is expected to give more time for countries such as the
AIFTA Vietnam and Others to reorganize its manufacturing industry is one of the
ways is through increasing competitiveness.
3. Simulation results show that the removal of tariff into the implementation of zero
tariffs will lead to trade creation and creates trade diversion. However, not all
members enjoy this policy. Therefore, strengthening and increasing the intensity
of trade in this region is needed. Therefore, all the policy makers in the AIFTA
must commit to the goal of the AIFTA boost intra-regional trade volumes.
REFERENCES
Aseansec. (2013). Asean secretariat, asean Ecoonomic corporation-Trade and
AFTA: http://www.aseansec.org/.
Caves, E. R, Jeffrey A. F, & Ronald W. J. (1993). World Trade and VESPayments:
An Introcuction. Sixth Edition. Harper Collins Collage Publisher. New
York.
Chacoliades, M. (1978). International Trade: Theory and Policy. Mc Graw-Hill Book
Company, London.
Devaragan, S., Lewis J.D. & Robinson S. (1990). Policy Lessons from Trade
Focussed : Two Sektor Models. Journal of Policy Modelling 12 (4) : 625 -
657.

14
Emilia & Haryadi. (2009), The impact of Free Trade Area on the Intra ASEAN
Manufacture Trade, Research Report, Jambi University Reseach Center,
Jambi.
Haryadi. (2008). The impact of Agricultural Trade Liberalization on De veloped and
Developing Countries, Doctoral Disertation, Bogor Agricultural University,
Bogor, Indonesia.
Hertel, T.W. (ed). (1997), Global Trade Analysis: Modelling and Applications,
Cambridge University Press, Cambridge.
Hertel, T.W. & Tsigas M.E. (1997). Structure of GTAP. In Global Trade Analysis:
Modeling and Applications. Cambridge University Press, Cambridge.
Krugman P & M Obstfeld. (2000), International Economics: Theori and Policy, 5th
Edition, Addison-Wesley Publishing Company, USA
Oktaviani, R, 2000, The Impact of trade Liberalization on Indonesian Economy and
its agricultural sektor, Disertation, Department of Agricultural Economics,
University of Sydney
Oktaviani, R. Puspitawati, E. & Haryadi. (2008), Impacts of ASEAN Agricultural
Trade Liberalization on ASEAN-6 Economies and Income Distribution in
Indonesia, ASIA-Pacific and Training Network, Research Series, No 51,
Januari 2008. www.artnetontrade.org.
Lopez, C. & Penélope, P. (2005). The Impact of Trade Liberalisation on Exports,
Imports, the Balance of Payments and Growth: the Case of Mexico.
Department of Economics, University of Kent, Canterbury.
Paulino As & Thirlwall, A. P. (2004). The Impact Of Trade Liberalisation On
Exports, Imports And The Balance Of Payments Of Developing Countries,
The Economic Journal, 114 (February), F50–F72. _ Royal Economic
Society 2004. Published By Blackwell, Publishing, 9600 Garsington Road,
Oxford Ox4 2dq, Uk And 350 Main Street, Malden,Ma 02148, USA.
Salvatore D. (2000), International Economics, 5th
Edition, Prentice Hall, New Jersey,
USA.


![NORTH AMERICAN FREE TRADE AGREEMENT - · PDF fileASEAN–China Free Trade Area (ACFTA), in effect as of 1 January 2010[15] ASEAN–India Free Trade Area (AIFTA), in effect as of 1](https://static.fdocuments.us/doc/165x107/5a82b0387f8b9aee018e413f/north-american-free-trade-agreement-china-free-trade-area-acfta-in-effect.jpg)