The Impact of Sompa Elp Scores on Special Education ...
160
Louisiana State University LSU Digital Commons LSU Historical Dissertations and eses Graduate School 1983 e Impact of Sompa Elp Scores on Special Education Evaluation and Placement. Alan Lesley Taylor Louisiana State University and Agricultural & Mechanical College Follow this and additional works at: hps://digitalcommons.lsu.edu/gradschool_disstheses is Dissertation is brought to you for free and open access by the Graduate School at LSU Digital Commons. It has been accepted for inclusion in LSU Historical Dissertations and eses by an authorized administrator of LSU Digital Commons. For more information, please contact [email protected]. Recommended Citation Taylor, Alan Lesley, "e Impact of Sompa Elp Scores on Special Education Evaluation and Placement." (1983). LSU Historical Dissertations and eses. 3941. hps://digitalcommons.lsu.edu/gradschool_disstheses/3941
Transcript of The Impact of Sompa Elp Scores on Special Education ...

Louisiana State UniversityLSU Digital Commons
LSU Historical Dissertations and Theses Graduate School
1983
The Impact of Sompa Elp Scores on SpecialEducation Evaluation and Placement.Alan Lesley TaylorLouisiana State University and Agricultural & Mechanical College
Follow this and additional works at: https://digitalcommons.lsu.edu/gradschool_disstheses
This Dissertation is brought to you for free and open access by the Graduate School at LSU Digital Commons. It has been accepted for inclusion inLSU Historical Dissertations and Theses by an authorized administrator of LSU Digital Commons. For more information, please [email protected].
Recommended CitationTaylor, Alan Lesley, "The Impact of Sompa Elp Scores on Special Education Evaluation and Placement." (1983). LSU HistoricalDissertations and Theses. 3941.https://digitalcommons.lsu.edu/gradschool_disstheses/3941

INFORMATION TO USERS
This reproduction was made from a copy of a document sent to us for microfilming. While the most advanced technology has been used to photograph and reproduce this document, the quality of the reproduction is heavily dependent upon the quality of the material submitted.
The following explanation of techniques is provided to help clarify markings or notations which may appear on this reproduction.
1.The sign or “ target” for pages apparently lacking from the document photographed is “Missing Page(s)” . If it was possible to obtain the missing page(s) or section, they are spliced into the film along with adjacent pages. This may have necessitated cutting through an image and duplicating adjacent pages to assure complete continuity.
2. When an image on the film is obliterated with a round black mark, it is an indication of either blurred copy because of movement during exposure, duplicate copy, or copyrighted materials that should not have been filmed. For blurred pages, a good image of the page can be found in the adjacent frame. If copyrighted materials were deleted, a target note will appear listing the pages in the adjacent frame.
3. When a map, drawing or chart, etc., is part of the material being photographed, a definite method o f “sectioning” the material has been followed. It is customary to begin filming at the upper left hand comer of a large sheet and to continue from left to right in equal sections with small overlaps. If necessary, sectioning is continued again—beginning below the first row and continuing on until complete.
4. For illustrations that cannot be satisfactorily reproduced by xerographic means, photographic prints can be purchased at additional cost and inserted into your xerographic copy. These prints are available upon request from the Dissertations Customer Services Department.
5. Some pages in any document may have indistinct print. In all cases the best available copy has been filmed.
UniversityMkzrorilms
International300 N. Zeeb Road Ann Arbor, Ml 48106


8409597
T ay lo r, Alan L esley
THE IMPACT OF SOMPA ELP SCORES ON SPECIAL EDUCATION EVALUATION AND PLACEMENT
The Louisiana State University and Agricultural and M echanical Col. Ph.D.
University Microfilms
International 300 N. Zeeb Road, Ann Arbor, Ml 48106
1983


THE IMPACT OF SOMPA ELP SCORES ON SPECIAL EDUCATION EVALUATION AND PLACEMENT
A Dissertation
Submitted to the Graduate Faculty of the Louisiana State University
Agricultural and Mechanical College in partial fulfillment of the
requirements for the degree of Doctor of Philosophy
inthe Department of Psychology
by
Alan Lesley Taylor B.A. Louisiana Tech University, 1969
M.S. Iowa State University, 1971 December 1983

ACKNOWLEDGEMENTSMy heartfelt appreciation goes to a number of persons
who made this study possible.Mrs. Irene Newby, Director of Special Education for
the East Baton Rouge Parish School System, provided the initial permission and continuing assistance in gathering the data. She exhibited the utmost in dedication to her special education students and their welfare by her interest in the study and her willingness to cooperate over a long period of time to see the work completed.
Mrs. Kathy Lohman, of the East Baton Rouge Special Education staff, was invaluable in handling all computer- related problems such as generating the various printouts, soliciting teacher ratings, and helping me to ask the right questions in the right way.
Dr. Frank Gresham, my committee chairman, contributed his considerable expertise on SOMPA research and general school psychology issues along with a great deal of support.
Mrs. Elaine Moore, of the LSU Psychology Department, has been known to graduate more students than any professor, and I owe her special thanks for her support over the years I have been a student at LSU.
Dr. Steven Buco, of the LSU Department of Experimental Statistics, was invaluable with his assistance during the statistical analyses and their related computer problems.He displayed patience far beyond the call of duty.
ii

Finally, I must give the most credit to my wife, Judy Taylor, who contributed her own special education knowledge and all those qualities of wife and supporter that have sustained generations of graduate students when all else seemed lost. To her I dedicate this dissertation.
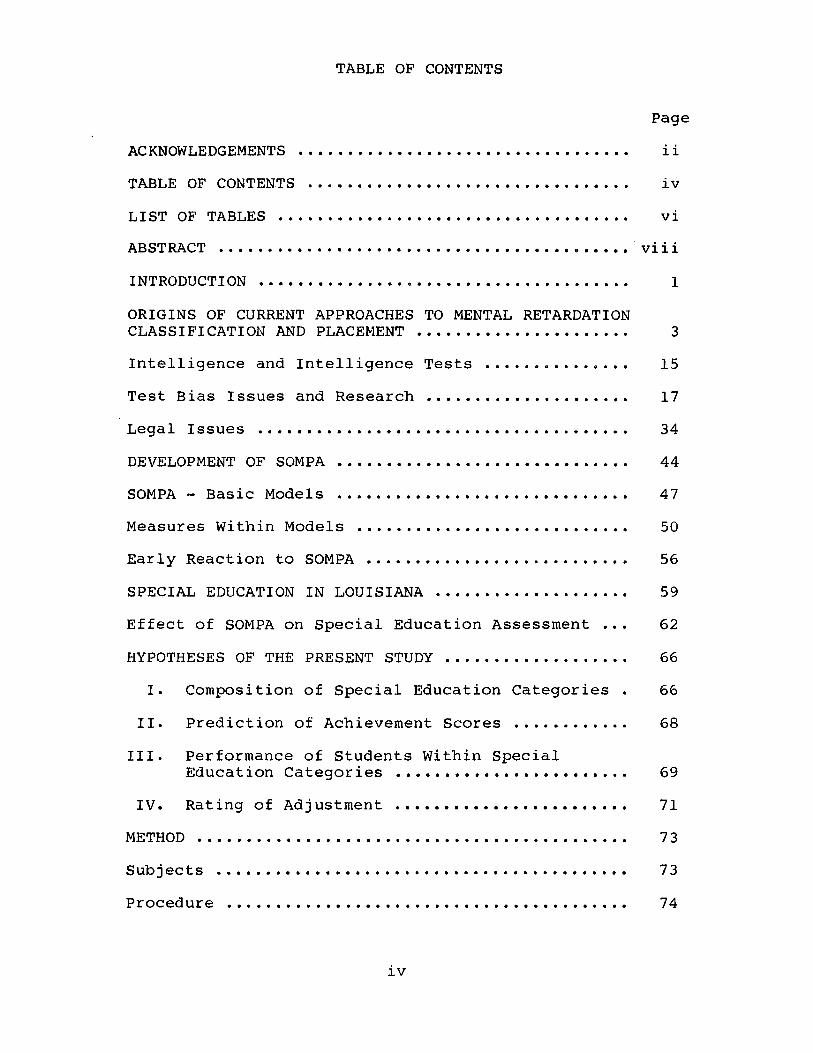
TABLE OF CONTENTS
PageACKNOWLEDGEMENTS ....................................... iiTABLE OF CONTENTS ...................................... ivLIST OF TABLES ....... viABSTRACT .......................................... viiiINTRODUCTION ........ 1
ORIGINS OF CURRENT APPROACHES TO MENTAL RETARDATION CLASSIFICATION AND PLACEMENT ......................... 3Intelligence and Intelligence Tests ................ 15Test Bias Issues and Research ....................... 17Legal Issues ............................................ 34DEVELOPMENT OF SOMPA .................................. 44SOMPA - Basic Models .................................. 47Measures Within Models ................................ 50Early Reaction to SOMPA .............................. 56SPECIAL EDUCATION IN LOUISIANA ...................... 59Effect of SOMPA on Special Education Assessment ... 62HYPOTHESES OF THE PRESENT STUDY ..................... 66
I. Composition of Special Education Categories . 66II. Prediction of Achievement Scores .......... 68
III. Performance of Students Within SpecialEducation Categories ........................... 69
IV. Rating of Adjustment ............................ 71METHOD ................................................... 7 3Subjects ................................................ 73Procedure ............................................... 74
iv

PageMeasures ................................................ 76Data Analysis .......................................... 79RESULTS ................................................. 81Hypothesis I - Minority Percentage ................. 84Hypothesis II - IQ and ELP Prediction .............. 91Hypothesis III - Student Performance ............... 102
DISCUSSION .............................................. 114Percentage of Minority Students ..................... 114Prediction of Achievement ...................... 119Student Performance .............. *................... 121Efficacy of Special Education ......................... 122Implications for Further Research .................... 123Recent Changes and Future Trends ..................... 125REFERENCES ....................................... 128APPENDICES .............................................. 137VITA ..................................................... 142
v

LIST OF TABLES
Table Page1 Classification of Retardation ................ 102 Teacher Ratings Solicited and Returned ..... 753 Percentages of Data Available for Total
Sample (2120) .................................. 774 Characteristics of Total Sample ............. 82
5 Comparison of Current Findings with Hansche(1982) Statewide Sample ........... .... ....... 83
6 Minority Percentages for Special EducationClassifications 1978-1983 .................... 85
7 Percentage Distribution Across LD, SL, MiMR,and MoMR Categories of Students Referred for Academic Problems 1978-1982 ................. 87
8 IQ "movement" Between Special EducationCategories ...................................... 88
9 IQ Percentages in Special EducationCategories (Total Samples) ................... 89
10 Category Agreement with ELP vs. IQ Scores .. 9211 IQ and ELP as Predictors of Achievement and
Adjustment ...................................... 9312 IQ vs. ELP Correlations for White
Students ........................................ 9413 IQ vs. ELP Correlations for Black
Students ........................................ 9514 IQ vs. ELP Prediction of Achievement and
Adjustment by Race ............................ 9615 Differences Between IQ, ELP, and Achievement
Means for Total Sample and by Race ......... 10016 Correlations of Sociocultural Scales with IQ
for Black Students - Current Study v s .Mercer's Original Group ...................... 101
vi

Page17 Means on Sociocultural Scales for Black
Students - Current Study v s . Mercer's Original Group ................................. 103
18 Results of ANOVA on Match Categories forAchievement and Adjustment Measures (MoMR Black Students) ................................ 105
19 Results of ANOVA on Match Categories forAchievement and Adjustment Measures (MiMR Black Students) ................................ 106
20 Results of ANOVA on Match Categories for Achievement and Adjustment Measures (SL Black Students) ........................................ 107
21 Results of ANOVA on Match Categories for Achievement and Adjustment Measures (LD Black Students) ........................................ 108
22 Results of ANOVA on Match Categories for Achievement and Adjustment Measures (NE Black Students) ........................................ 109
23 Results of ANOVA on Match Categories for Achievement and Adjustment Measures (GT Black Students) ........................................ 110
24 Results of ANOVA on Match Categories for Achievement and Adjustment Measures (NE Black Students Referred for Gifted Classes) ......... Ill
25 Achievement Means for Categories by Raceand IQ Range .................................... 117
26 Adjustment Rating Means at Evaluation andAfter Placement by Race ......................... 124
vii

ABSTRACTThe impact of the use of SOMPA Estimated Learning
Potential (ELP) scores as a substitute for traditional IQ scores was examined as it affected students evaluated for special education in a large metropolitan school system. SOMPA is the System of Multicultural Pluralistic Assessment, an evaluation package developed by Jane Mercer
(1979) to address concerns about bias in assessment of minority students and particularly to remove "unfair" labels of mental retardation. ELP scores represent IQ scores adjusted for the effects of sociocultural background and compared only to ethnic peer norms, with the general effect being to raise estimates of intellectual potential for minority students.
ELP scores were mandated for use in Louisiana from 1978 to 1981. The present study examined their impact on the East Baton Rouge Parish special education system by addressing three major questions: (a) Did the use of ELPscores lower minority percentages in retardation categories, (b) Did ELP scores predict achievement and adjustment as well as IQ scores, and (c) Did students placed consistent with ELP scores perform as well as those placed consistent with IQ scores?
Data was collected across six special education categories requiring consideration of IQ scores (including mental retardation). Dependent measures included achievement scores in reading and arithmetic and achievement/
viii

adjustment ratings by teachers. Results from a total of 2120 observations were consistent with predictions that minority percentage would not change but that students with "mildly retarded" IQ scores would be relabeled and shifted to other categories. ELP scores were found to be similar to IQ in predicting rank order of achievement scores but to significantly overestimate group performance. Students placed in categories consistent with ELP scores performed less well on achievement and adjustment measures than those placed consistent with IQ or with both scores.
It was concluded that ELP scores served primarily to change category labels rather than declassify students, that ELP scores were inferior to IQ in predicting achievement, and that students placed consistent with ELP scores showed no evidence of realizing the "extra" potential in their new categories.
ix
INTRODUCTIONThe issue of bias or discrimination toward minorities
in intellectual and achievement testing has a long and controversial history in the American education system (Lambert, 1981; Jensen, 1980; Mercer, 1979). Although testing in regular education has not escaped its share of complaints, the use of intelligence tests to place minority
children in special education classes has been soundly criticized (Mercer, 1973; Dunn, 1968; Kamin, 1974). The use and interpretation of tests still presents a major sociopolitical issue in education today, with the most heated battles taking place in the arena of the courts (Larry P. v. Riles, 1979). As a result, court rulings and legislation (Bersoff, 1981) have mandated new responsibilities and limited previous practices in the assessment and placement of students in special education. For example, the use of IQ tests for placement purposes has been forbidden in California for several years, and most federal and state regulations now specify procedures for conducting "non-biased" assessments. Many new tests and assessment batteries have been developed in response to these sociopolitical and scientific issues. One of the most recent is the SOMPA, or System of Multicultural Pluralistic Assessment (Mercer & Lewis, 1979). SOMPA has been adopted and implemented statewide in Louisiana and has been used in several locations in the southwestern United States. Its impact on the literature preceded its
1

2
introduction in practice by the appearance of a special issue of School Psychology Digest in 1979 (Vol. 8). The philosophy, sociopolitical impact, and theoretical/applied scientific merit of SOMPA received lengthy and often unfriendly discussion. Research on the actual use of SOMPA is now beginning to surface. This study seeks to investigate one of the most unique and debated parts of SOMPA; the
use of an Estimated Learning Potential (ELP) as an alternative to the traditional (WISC-R) IQ, and the impact of such use within a system of special education.

ORIGINS OF CURRENT APPROACHES TO MENTAL RETARDATION CLASSIFICATION AND PLACEMENT
The modern definition of mental retardation, as opposed to mental illness, did not truly develop until the beginning of the 20th century. Several factors were necessary before such a concept made logical or practical sense:
1. Human ability to learn was recognized as the key
to civilization's progress and education began to be adopted as a primary goal for those who wished to advance.
2. An emerging science of individual differences, begun by European and early American psychologists, focused on the identification and measurement of differences in mental ability.
3. An enlightened cultural/educational leadership began to promote the idea that society had a responsibility to help its mentally less fortunate by providing care and training. These trends merged as society recognized that individuals lacking perhaps the most important human ability could be identified and should be helped.
Although there was no such term, the idea of mental retardation has a long history (MacMillan, 1982). Many of Plato's writings suggested that individual differences in intelligence would determine social and political order in a society. At that point and for some time afterward, general social competence (comparable to the current notion of adaptive behavior) was the "measure" of intelligence. During the Middle Ages, the retarded were feared,
4
persecuted, ignored, destroyed, or sometimes worshipped. A general trend to protect the retarded began in the 18th century, and one of the first attempts to educate a retarded child was by Jean Itard in 1799. However, regular education was not available to the masses until the mid- 1800's, as the poor seldom sent children to school. As late as the middle 1950's, debates continued as to whether public schools had an obligation to serve children who would not profit from academics (Goldberg, 1958). Court guarantees of access to education did not come until after 1970.
The history of mental retardation (Tredgold, 1908; Doll, 1962) is largely a history of its various definitions and the impact they have had on the nature of goals and services available to individuals classified by those definitions. There have been three major perspectives.
The earliest historical approach to mental retardation is the medical view. As noted earlier, retardation and illness were not differentiated for many centuries. Identification was first by specific syndromes based on physical anomalies or by general diagnostic categories such as cretinism or idiocy (Kanner, 1967). For some time, only individual physicians took an interest in such persons although they pointed out possible hereditary factors.When Goddard (1912) published his history of the Kallikak family a period of alarm followed, spurring a eugenics movement to prevent the degeneration of society by

5
sterilizing and segregating these "dangerous" individuals. In contrast to the detrimental effects of these attitudes toward the retarded, medical research into various syndromes began advances in genetics and other preventative measures that did attack the biological roots of more severe cases. The idea that retardation is innate and has a biological basis is still part of current debates (Goodman, 1979; Mercer, 1979), but espousal of these beliefs is a decidedly unpopular action today, so that most scientists and almost all psychologists vehemently deny any notion that intelligence is innate and fixed.
A second era began with the rising importance of education and the appearance of tools to measure mental abilities. The educational perspective had rather humble beginnings with Itard's attempt to educate the "wild boy of Aveyon." In the early 20th century interventions were usually based on assumptions about the nature of mental retardation. Itard believed that "intelligence" might be taught. However, both he and his student Seguin believed that mental retardation was due to biological causes and adopted a sensory stimulation approach to build up the physical structures. Maria Montessori, a student of Seguin, began to view mental retardation as an educational rather than medical problem, but her pioneering techniques are now largely used in "advanced" preschools. Samuel Howe in 1848 opened an experimental school which stressed self- care and vocational skills.

6
As the eugenics movement began, psychologists also were caught up in the spirit of the times. Pioneers such as Terman (1917) recommended that retarded students be kept separate from regular students. By 1911 there were classes in America for the retarded in 99 cities. By 1948 the number was only 400, but post-war affluence and population growth fueled increases which reached over 400,000 students served by 1963 (Farber, 1968). Currently, it is estimated that two to three percent of the total public school p o p u lation consists of students in mental retardation categories (Patrick & Reschly, 1982).
The conventional wisdom about special education has changed over the years. In the 1950's the prevailing philosophy was that students were "entitled" to special classes. In the 1960's lack of evidence for special education efficacy and the extra cost and stigmatization factors presaged a shift in philosophy. In the 1970's, the emphasis has been on mainstreaming and normalization, ideas that stress the reintegration of retarded students with their normal counterparts.
The changes noted above involved a third, psychosocial or sociocultural perspective. Ability to learn became viewed no longer as fixed and inherited, but was seen as the product of early environmental influences. Retardation (particularly for the "mild" category) came to be defined as a psychosocial phenomenon and was felt to be subject to remediation. An upsurge in faith and optimism led to large

7
increases in early intervention programs, such as Head Start, and in expanded special education services. The combination of easy measurement, plentiful funding, and national goals of remediating social disadvantages through improved education led to a much larger population of classified and placed students. As MacMillan (1982) notes, the last decade has focused on retardation as a social, civil rights, and political issue. While the threads of previous medical and psychometric perspectives are still evident, retardation today is inseparable from the American political and economic fabric.
One of the most comprehensive surveys of the status of mentally retarded populations was done by Mercer (1973) and her associates in the city of Riverside, California during the years 1963-65. Two studies were carried out. The first was an epidemiological study to locate, count, and describe all persons in that community classified as mentally retarded. Social agency surveys were made to see which persons were so classified and under what criteria. The 241 agencies involved included schools, mental health agencies, law enforcement agencies, medical facilities, and various public welfare, rehabilitation, private, and religious organizations. In addition, a series of household interviews yielded a list of "neighbor nominees" of people thought to be retarded.

8
Mercer found public schools to be the primary labeler of retardation, accounting for more than 50% of all individuals labeled, with more than 33% of the sample labeled only by the school system. Only the most severely retarded persons tended to be labeled before or after their school years. In looking at criteria for classification, it was noted that children labeled by schools invariably had been
given IQ tests, and nearly half of those labeled had IQ scores above 70. More than half had no other evidence of retardation, such as physical anomalies. Once children were placed in classes for the mentally retarded, less than one in five ever returned to the regular school program.
In considering socioeconomic factors, it was found that the likelihood of being labeled correlated with race (minority), sex (male), and socioeconomic status (poor). Children from lower socioeconomic levels were more likely to be perceived as retarded only by the school, and not by friends, relatives, or other agencies.
The clinical survey involved the screening of a representative community sample to determine the number of persons having the "symptoms" (IQ below 70, adaptive behavior below a 3rd percentile cutoff level) of mental retardation. A first-stage screening used the adaptive behavior measure, and a smaller weighted sample was given IQ tests.

9
Using a lower 3rd percentile cutoff score on IQ and adaptive behavior resulted in four possible categories, listed in Table 1.
Mercer used the terminology in Table 1 to refer to situations where the IQ alone, Adaptive Behavior alone, neither, or both were below the 3rd percentile cutoff.Only cases with both scores below the cutoff were con
sidered to represent "true" retardation.In analyzing the results of the clinical study, Mercer
noted that the correlation between IQ and adaptive behavior was low (.20) and that adaptive behavior scores did not differ significantly between ethnic groups or socioeconomic status levels. However, minority status and low SES levels were associated with lower IQ scores, with sociocultural background accounting for 15-30% of the variance. When both measures were required to classify retardation, 60% of the Spanish and 91% of the black populations scoring an IQ below 70 "passed" the adaptive behavior measure. Most of these individuals were reported to be successful in nonschool roles and independent living skills.
Based on these findings, Mercer (1973) strongly recommended the development of formal and psychometrically sound adaptive behavior measures, the use of a lower 3rd percentile cutoff level for defining exceptionality, and the use of pluralistic norms so that persons would be compared only to those of similar sociocultural backgrounds. The first two recommendations are favored in

TABLE 1Classification of Retardation
Intellectual Functioning (IQ)Adaptive Behavior Subnormal Normal
Subnormal Comprehensively BehaviorallyRetarded Maladjusted
Normal Quasi-retarded Normal
Adapted from the SOMPA technical manual, 1979

11
current practice, but the issue of appropriate social and educational policy for retarded children remains unresolved. This is particularly true of Mercer's "quasiretarded" children, who have been called "6-hour retarded," "mildy retarded," "slow learners," "educationally handicapped," and other such names. Mercer's findings and remarks about this particular group formed the leading edge
of a trend that was to interweave social, scientific, and political ideas concerning the identification, assessment, and placement of these children. Over the next decade, a series of court decisions and lay/scientific debates made policy on mild mental retardation one of the most controversial and emotionally charged issues of the day. Mercer was involved as a key plaintiff witness in the Larry P. (1972) trial, which dealt with placement in classes for the mildly retarded. Other court cases (Hobson v. Hansen,1967; Diana v. Board of Education, 1970; PASE v. Hannon, 1980) have dealt with school system responses to students whose deficits were mild enough to generate controversy as to whether special classes were necessary or good for them. Before detailing current formal definitions and approaches to retarded students generally, some distinctions about the "mild" group need to be made.
Implicit in the term "mildly retarded" is the assumption that this is a quantifiable entity. The "degree" of retardation is a very important factor in how it is defined, basic ideas about etiology, and consequent
12
recommendations for assessment and intervention. Reschly and Phye (1979) note that there are distinct differences in mild retardation and retardation generally, and that these must be recognized for any accurate understanding of the status of mental retardation today.
The mildly retarded (IQ = 55-70) were not generally recognized until the mid-20th century. Individuals in this
category seldom have evidence of biological anomalies or etiology, and thus escaped notice until society as a whole was more educated. As the Riverside studies noted, they are seldom "diagnosed" before school age, are often seen as impaired only in the educational arena, and lose their classification after their school years. The mildly retarded are often the only groups assumed to have the ability to learn basic academic skills and to eventually be able to function independently in our society (MacMillan, 1982). Finally, there is a high correlation with low socioeconomic status for this group. None of these statements are true for lower IQ levels, which appear to include more comprehensive, more permanent, and more biologically based deficits. Reschly (1981) suggests that the term retardation might best be reserved for this group only, since the deficits are much clearer and there is general agreement about a need for special education, while in many respects the mildly retarded "catch up" once they leave the narrower realm of the school.

13
To a great extent, the recent history of retardation is that of the mildly retarded, the largest, least understood, and most controversial group. It is this group that is the primary focus of this study.
In 1959 the American Association of Mental Deficiency proposed and later adopted (Heber, 1961) a formal definition of mental retardation, one which to some degree
incorporated all the perspectives presented previously. It included a measurement of and specific cutoff scores for mental ability (IQ), required emergence of the problem to have been in the developmental period, and required the presence of a deficit in adaptive behavior (self-help and social roles).
A recent survey (Patrick & Reschly, 1982) of all state special education departments indicates that the majority of states currently use the 1973 AAMD definition of mental retardation, which states: "Mental retardation refers to significantly subaverage general intellectual functioning existing concurrently with deficits in adaptive behavior, and manifested during the developmental period (Grossman, 1977, p. 11)." The Patrick and Reschly study investigated criteria utilized by states to define mental retardation and demographic variables which might be related to prevalence. Historically, prevalence estimates of mental retardation had been thought to be largely related to the classification system and formal definition used. Lower IQ cutoff scores and adaptive behavior requirements were

14
thought to lower prevalence estimates nearer to the one percent range, as opposed to three percent for more liberal definitions. Patrick and Reschly (1982) found that the system utilized had little to do with the prevalence of mental retardation despite wide variation in classification systems. The three most important factors correlated with prevalence were economic and demographic measures: median
educational level, per capita income, and educational cost- character istics of the states themselves. Despite the fact that most states advocated the use of adaptive behavior measures in principle, there were no specific rules as to what to assess or how to combine the results with IQ scores (required by 84% of the states). More conservative definitions and recent court decisions might be expected to generally lower prevalence rates, but Patrick and Reschly (1982) noted mixed results, with more states having increased or stable rather than lower prevalence. National prevalence was reported as 1.63%, with a range among states of .37 to 3.93%.
Patrick and Reschlys' (1982) findings suggest that the actual process of change in assessment and classification of mental retardation has occurred mainly on paper and by definition rather than application. Lower cutoff scores do not seem to be related to lower prevalence, and there is no convincing evidence of any formal use of dual criteria (IQ and adaptive behavior) for classification. Current practice seems more likely to be the use of IQ and
15
achievement scores as the "dual criteria" for differentiation between the categories of Mental Retardation and Learning Disabled (noted to be negatively related to mental retardation prevalence). These findings also suggest that the mildly handicapped population, regardless of label, has not been "removed" from special education and in fact still constitutes by far the largest number served.
Consistent definitions of intelligence and the requirement of IQ testing by most states still places the IQ test at the core of current debates about fair vs. biased assessment and placement of mentally retarded children. Thus, a review of the current status of ideas and research about intelligence and intelligence tests, with particular emphasis on test bias, is presented in the following section.Intelligence and Intelligence Tests
The concept of an entity such as intelligence, by whatever name, has been present since antiquity. Individual differences in mental ability have been discussed and described by students of human behavior for centuries. Psychology itself was born largely as a science of mental measurement, proceeding from psychological research in the first laboratories to the study of higher mental abilities. Francis Galton pioneered such work by studying mental functioning with the aid of psychometric methods. James McKeen Cattell researched the same area in America, coining the term "mental test" in 1890. From the beginning,

16
theorists differed in their definitions of intelligence and ideas about how it should best be measured. Binet (Binet & Simon, 1905) took an empirical approach, using tests that differentiated older from younger children without a prior hypothesis about what the tests measured. This contrasted with most theorists for the next 40 years, who saw intelligence as innate. Factor analytic theorists used
statistical techniques to study intelligence. Spearman (1927) felt that a general factor "g" was involved in all tests, with a specific factor also present in individual tests. Thurstone (1938) extracted seven "primary mental abilities" and developed a test to measure them, thinking of "g" as a second-order factor. Guilford (1956) developed an even more complex model with 120 possible factors. Cattell (1963) spoke of "fluid" and "crystallized" intelligence, distinguishing a basic broad capacity from skills learned by experience.
While empiricists and factor analysts focused on quantitative approaches, Piaget (Elkind, 1969) saw intelligence as biological maturation and adaptation to the environment.
Theory and application in the area of intelligence proceeded largely independently during the first half of the 20th century. Terman and Merrill (1937) developed the Stanford Binet scales, which became the primary intelligence test of the era. Military needs to identify and discriminate among inductees resulted in the development of

17
the Army Alpha and Beta tests. During these years, testing gained rapidly in popularity as a quick and fairly reliable means of classification for large groups. Following World War II, David Wechsler introduced a third approach which hoped to move away from global estimates and provide diagnostic information for clinical use. The development of his scales for children and adults has dominated intelli
gence testing practice for the last 30 years, with the Binet remaining a distant second choice.Test Bias Issues and Research
As long as there was widespread agreement about the usefulness and fairness of IQ tests, few charges of bias were raised against the tests themselves. When placement decisions made on the basis of tests were seen as leading to undesirable ends (exclusions from jobs, stigmatization as retarded, consignment to "disabling trajectories" in special education [Mercer, 1979]), tests were soon attacked as being based on invalid theories about intelligence itself or as sampling the "wrong" information. Arthur Jensen (1980), in an exhaustive review of test bias issues and research, devoted an entire chapter to lists of the major criticisms of tests. One of the most common criticisms is the "egalitarian fallacy." According to Jensen (1980), the "fallacy" holds that biological intelligence is distributed randomly across ethnic groups. Any differences between groups are therefore a result of bias, which is primarily a sociocultural phenomenon holding white middle

18
class values first (Mercer, 1979). The "egalitarian fallacy" posits that the construct of intelligence (as defined by IQ tests) is largely (if not exclusively) due to learning, culture, and experience rather than genetic factors. Ethnic groups not given an equal opportunity to acquire these factors are thus unfairly penalized on IQ tests.
Other frequent criticisms state that IQ tests are composed of biased (white middle class) items, that the tests measure only abilities favoring whites and ignore those favoring minorities, and that the test-taking situation and environment, including the examiner, contaminate test performance for minorities.
The above criticisms are a few of hundreds made over the years (Jensen, 1980). However, the central issues may be described as follows: (a) Is IQ genetically or biologically determined, (b) are IQ tests culturally biased against minorities, and (c) are "unbiased" tests being used in a biased fashion?
It is difficult to find a modern psychologist who would answer the first question with a simple affirmative. Whether in court (Larry P., 1979), as part of an official professional body (Cleary et al, 1975), or in public and scientific forums, the vast majority of psychologists, as Goodman (1979, p. 49) puts it: "have acknowledged theimpossibility of determining intellectual potential through the IQ test or any other set of instruments." The second

question has received a great deal more attention, with simultaneous research to define and describe cultural bias, if any, and empirical attempts to modify tests or test practices based on the assumption that the answer is "yes". Psychologists have always urged caution in the interpretation of test results (Cronbach, 1970; Anastasi, 1976), and many have tried to avoid bias by eliminating "cultural" items. Among the more classic examples are the Davis-Eells games (Eells eb al, 1951), Raven's Progressive Matrices (1938), and the Cattell Culture Fair Intelligence Test (1940). The failure of such tests to gain significant adoption has been due to a number of factors, including inadequate prediction and awkward construction. Robert Williams developed the BITCH 100 (1972), a culture specific test for black children with all items peculiar to black culture. Efforts such as these have served polemic purposes but have had little impact on actual testing practices. Many psychologists agree with Anastasi (1976) that culture in testing is an inevitable and even desirable factor, since achievement and success are also culturally defined.
Rather than try to devise new tests or remove cultural loadings, current testing approaches involve an insistence on multiple measures, particularly those involving adaptive behavior in the home or other non-school environments. Formal scales, such as the Adaptive Behavior Inventory for Children (Mercer, 1979) and the AAMD Adaptive Behavior
20
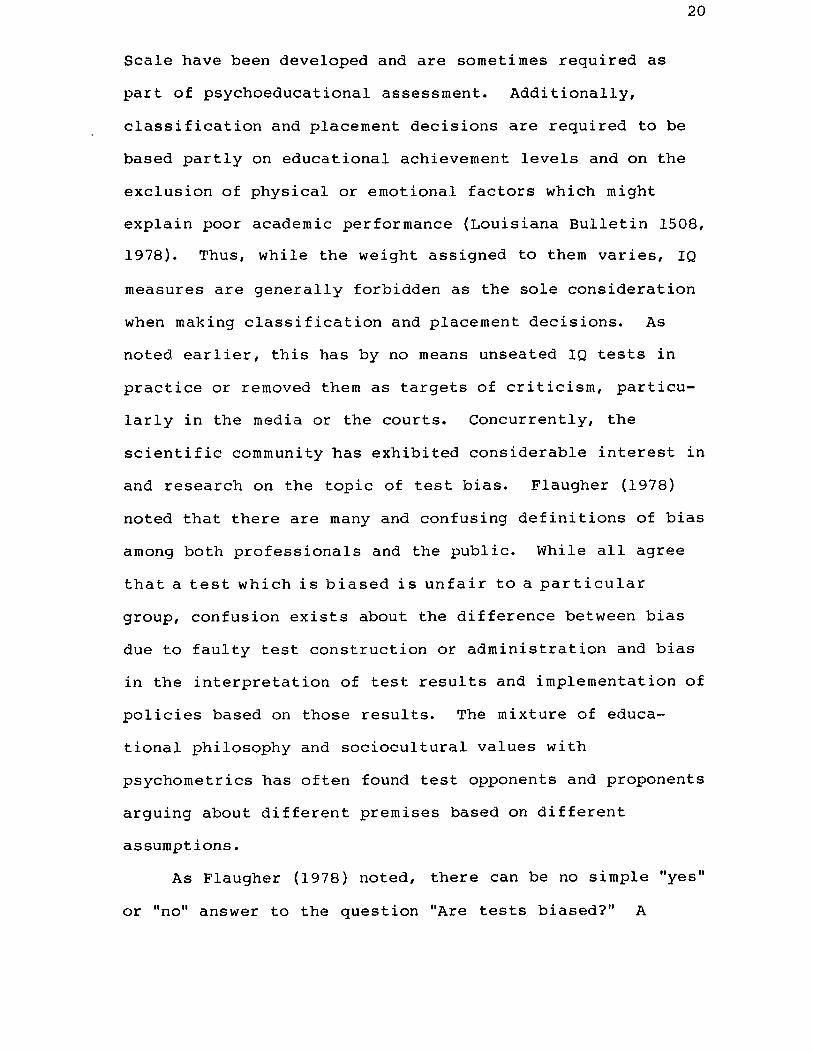
Scale have been developed and are sometimes required as part of psychoeducational assessment. Additionally, classification and placement decisions are required to be based partly on educational achievement levels and on the exclusion of physical or emotional factors which might explain poor academic performance (Louisiana Bulletin 1508, 1978). Thus, while the weight assigned to them varies, IQ
measures are generally forbidden as the sole consideration when making classification and placement decisions. As noted earlier, this has by no means unseated IQ tests in practice or removed them as targets of criticism, particularly in the media or the courts. Concurrently, the scientific community has exhibited considerable interest in and research on the topic of test bias. Flaugher (1978) noted that there are many and confusing definitions of bias among both professionals and the public. While all agree that a test which is biased is unfair to a particular group, confusion exists about the difference between bias due to faulty test construction or administration and bias in the interpretation of test results and implementation of policies based on those results. The mixture of educational philosophy and sociocultural values with psychometrics has often found test opponents and proponents arguing about different premises based on different assumptions.
As Flaugher (1978) noted, there can be no simple "yes" or "no" answer to the question "Are tests biased?" A

21
general understanding of "bias" in its various definitions is necessary first. "Bias" might include any of the following situations:
1. Interpreting tests of achievement as if they were tests of aptitude.
2. Considering test results as a broad index of all worthwhile traits rather than a good estimate of a narrow
range of abilities.3. Using tests that predict well for one group to
make decisions about other groups (differential validity).4. Using tests made up of content peculiar to one
group (content bias).5. Predicting to the "wrong" criteria.6. Using the "wrong" statistical model for selection.7. Testing under adverse conditions (atmosphere
bias).As is obvious from the foregoing incomplete list of
possibilities, proposals or accounts of research need to specify the type of "bias" being considered. In the case of IQ tests, objections concerning bias usually address the content of the test, the effects of various psychometric approaches to handling the results, or the making of proper social and ethical decisions once results are obtained. In practice, these issues are inseparable.
Hunter and Schmidt (1976) noted three most common ethical positions taken in regard to the use of test scores: (a) unqualified individualism, (b) qualified

22
individual ism, and (c) quota systems. Unqualified indivi- d u alism is rigid adherence to the idea that the best scores on the best test (most accurate predictor) should always be selected regardless of the outcome for the groups involved. Such an approach would use any available data from an evaluation, including race, if it improved prediction. Mercer's (1979) use of sociocultural information (e.g.,
race, socioeconomic status, urban acculturation), which is used to calculate differentially weighted regression equations for Anglos, Hispanics, and blacks, represents a form of unqualified individualism. Qualified individualism involves a commitment not to treat groups differently even if more accurate prediction were possible by doing so.Thus, the position of qualified individualism would dictate that the same predictors be used for both majority and minority groups with the constraint that demographic factors (e.g., race, sex, socioeconomic status) could not be used in the regression equation, even if they enhanced prediction. Quota systems involve political appropriateness and the idea that selection should match the ratio of groups in the community. This has been the position of the Office of Civil Rights and other plaintiffs in court cases. SOMPA's presumption that intelligence is distributed randomly and therefore tests which result in an "overrepresentation" of minorities in special education compared to their number in regular education are "biased" reflects a quota approach.

23
Hunter and Schmidt (1976) also illustrated a number of attempts to define "fairness" statistically (Cleary, 1968; Thorndike, 1971; Darlington, 1971) and showed that all such solutions could be seen as unfair from one or more ethical positions. Flaugher (1978) concluded in his article that the era of seeking psychometric solutions to social problems may be near an end, and hinted that "bias" actually
occurs when test results are interpreted as an excuse to ignore or give up on a significant social problem (lack of achievement by minorities), and that critics are biased when the thermometer (IQ) is blamed for the patient's illness. Reschly (1981) echoed this statement, defining bias as the use of assessment which (a) does not result in effective interventions and (b) differentially exposes minority groups to ineffective programs as a result of the assessment.
In spite of numerous arguments, there are some general statements about intelligence and intelligence tests that find fairly wide agreement. Most theorists consider intelligence to be developed mental ability, an inseparable combination of innate and acquired skills present at the time of testing (Reschly, 1981). It embodies more than the primary factors (Kaufman, 1979) of verbal comprehension, perceptual organization, and freedom from distractibility. However, the IQ score is a summary score on a measure of abilities noted in most major theoretical definitions of intelligence (Guilford, 1967; Kaufman 1979). It has

24
demonstrated strong empirical relationships to successful performance in traditional school subjects (Lambert, 1981; Jensen, 1980). It has more demonstrated correlates than any other psychological measure and has been subject to thousands of research studies. Many of these have dealt with attempts to locate bias in the psychometric makeup of the tests. A summary of the major research subjects
follows.1. Face Validity. Face validity, or the appearance
that items in a test are truly related to what the test measures, is not a measure of validity in an empirical sense. However, it has been and is a concern of many test critics. The visibility of test items and the ease of selecting individual items to buttress arguments about bias has actually been a major feature in recent court cases, and in one instance a judge (PASE vs. Hannon, 1980) reviewed test questions item by item to determine whether they were biased, using his own opinion as a guide. Thus, face validity cannot be considered a noncontroversial area.
Three responses to the face validity question have surfaced. As Jensen (1980) notes, the public spotlight on testing has led test makers to pay much more attention to item selection so that test-taking attitudes and general public opinion do not become so negative as to cause rejection of testing altogether. Secondly, there have been some attempts at serious resarch to determine whether "experts" can indeed identify culturally biased items.

Jensen (1977) asked panels of five black and five white psychologists to pick out the eight most and least racially discriminatory items on the Wonderlic Personnel Test, when given only those sixteen items (preselected psychometrically). The judges sorted the items at no better than chance levels. Sandoval and Miile (1980), using the WISC-R, did a much more extensive analysis.
University students from white, Spanish, and black ethnic groups were given a set of items previously found to be (a) most difficult for blacks compared to whites, (b) Spanish compared to whites, and (c) equal in difficulty for all three groups. Again, judges were unable to accurately differentiate the items, nor was the ethnic background of the judge related to accuracy for any group. Anecdotal evidence has also indicated (Reynolds, 1982) that the WISC- R items most widely charged with cultural bias are in fact easier for blacks than whites.
Findings such as those noted above have reduced scientific interest in face validity, although the rapport and public opinion value is considered ample reason to continue to review items carefully during test construction. Recent research has been focused on more objective and empirical indices of validity.
2. Content Validity. Critics who question the content validity of IQ tests have felt that item difficulty is greater for black than for white children because of cultural, experience, or language differences. Sandoval

26
(1979) used the SOMPA WISC-R standardization sample (Mercer & Lewis, 1979) and examined patterns of item difficulty for blacks, whites and Spanish children. He concluded that:"In general, the notion that there may be a number of items with radically different difficulties for children from different ethnic groups has not been supported." A number of slightly more difficult items spread throughout the test suggested that general factors rather than specific item content contributed to differences in group performance. Oakland and Feigenbaum (1979) reported similar results with a different sample. Reynolds (1982) noted that few ethnic group by item interactions (suggesting differences in difficulty) have been found, and when noted have usuallyinvolved less than 5% of the variance in performance. Thiswas also true of results in Jensen's (1976) studies on fivemajor intelligence tests, in which correlations between ethnic groups on rank order of item difficulty were made. Jensen noted correlations of .94 or higher between ethnic groups, suggesting that rank orders of most to least difficult items were highly similar. Considering these findings, Reynolds (1982) concluded that no empirical support has been found for bias due to differences in item difficulty.
While item difficulty has been the major topic, other
internal consistency measures have also been compared

27
across ethnic groups. Oakland and Feigenbaum (1979) found very similar reliabilities between whites, blacks, and Mexican Americans for all WISC-R subtests. They also noted very similar item/total correlations (internal consistency) when comparing the groups. Cole (1981) in a review article summarized a series of studies utilizing much more complex and sophisticated statistical models for detecting item
bias. She noted that, although items with anomalous statistics between groups were found, they were generally uninterpretable and inconsistent from one sample to another.
3. Construct Validity. Another major test criticism has been that IQ tests measure different abilities for whites than for minorities (i.e., that construct validity is different for the two groups). The major statistical tool for such research is factor analysis. A number of WISC-R factorial studies (Reschly, 1978; Jensen, 1980; Oakland & Feigenbaum, 1979; Gutkin & Reynolds, 1981) have reached essentially the same conclusion: strong and consistent findings that the WISC-R factor structure was generally invariant across ethnic groups. Kaufman (1979) notes that the three major factors of verbal comprehension, perceptual organization, and freedom from distractibility have been seen in all old and new Weschler Scales.Findings of such congruence are among the most frequently replicated in test research (see Reynolds, 1982, for a review).

28
A second investigatory method involves the use of internal consistency measures of reliability. If test items are all measuring a similar construct with accuracy, there should be little difference in internal consistency estimates for various ethnic groups. Again, several investigators (Sandoval, 1979? Oakland & Feigenbaum, 1979; Jensen, 1980) have reported similar internal consistency
estimates for ethnic groups, with differences seldom more than .06 between coefficients.
Two general surveys of internal test bias research (Reynolds, 1982; Jensen, 1980) have concluded that little evidence for such bias exists.
4. Predictive Validity. The most crucial and controversial issues about test bias come into play at the point tests are used to make decisions that lead to consequences. As the name implies, predictive validity involves the accuracy of a test in predicting to criteria beyond itself. In the educational system, this means that individual test scores will be used to make a decision about likely future academic performance on what some individuals feel to be at best unreliable and at worst unfair (Mercer, 1979) criteria. There is by now little doubt about the general relationship between IQ and achievement, since many authors (Reschly, 1981; Kaufman, 1979; Anastasi, 1976) have stated that intelligence tests average correlations in the .6 to .7 range with achievement in elementary grades. Indeed, Kaufman (1979) noted that the empirical relationship is so
29
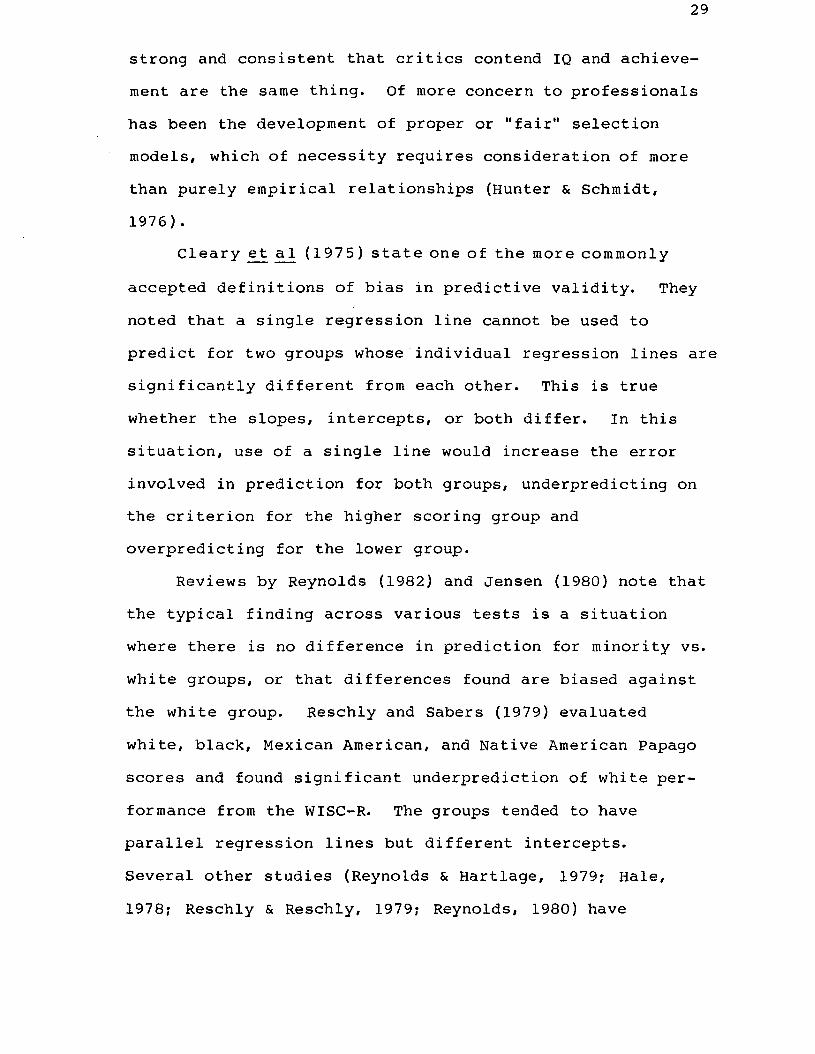
strong and consistent that critics contend IQ and achievement are the same thing. Of more concern to professionals has been the development of proper or "fair" selection models, which of necessity requires consideration of more than purely empirical relationships (Hunter & Schmidt,1976).
Cleary e_t a L (1975) state one of the more c ommonly
accepted definitions of bias in predictive validity. They noted that a single regression line cannot be used to predict for two groups whose individual regression lines are significantly different from each other. This is true whether the slopes, intercepts, or both differ. In this situation, use of a single line would increase the error involved in prediction for both groups, underpredicting on the criterion for the higher scoring group and overpredicting for the lower group.
Reviews by Reynolds (1982) and Jensen (1980) note that the typical finding across various tests is a situation where there is no difference in prediction for minority vs. white groups, or that differences found are biased against the white group. Reschly and Sabers (1979) evaluated white, black, Mexican American, and Native American Papago scores and found significant underprediction of white performance from the WISC-R. The groups tended to have parallel regression lines but different intercepts.Several other studies (Reynolds & Hartlage, 1979; Hale,1978; Reschly & Reschly, 1979; Reynolds, 1980) have

30
reported similar findings. Flaugher (1978) cites at least ten studies showing little evidence of differential validity, and Jensen (1980, p. 15) likewise concluded that "differential validity for the two racial groups (black and white) is a virtually nonexistent phenonmenon."
The consistency of results in such studies has led some reviewers (Reschly, 1979; Jensen, 1980) to accept as
fact that IQ tests predict with equal accuracy for all ethnic groups, and to state that the true issue is what to do about the group differences in performance; that is, what is the "fair" way to make use of the data. Attempts to justify particular selection models by various psychometric strategies and manipulations have typically led to confusion and self-contradiction (Hunter & Schmidt, 1976). Many writers (Cronbach, 1975; Cole, 1981; Carrol & Horn, 1981) feel scientists have provided most or all of the relevant and worthwhile psychometric information needed to refute charges of prediction bias, and that selection policies will best be addressed in the social/political values arena. Since SOMPA (Mercer, 1979) is largely a proposed selection model(s) based on a clearly defined value system, a review of selection models will be deferred until development of the SOMPA is discussed.
5. Atmosphere Bias. Sattler and Gwynne (1982) recently noted that atmosphere bias, despite all evidence to the contrary, is still a pervasive myth in psychology. They reviewed available research on race of examiner

effects. The two major complaints in the literature have involved the inhibitory effect of a white examiner on rapport, and the misunderstanding of test items by blacks because of different linguistic backgrounds. Sattler and Gwynne (1982) noted no significant race of examiner effects in 23 of 27 studies reviewed, and pointed out serious methodological flaws in two of the most frequently cited
remaining studies. Additionally, a review of studies on dialect differences failed to note any improvements in test scores when tests were "translated" into black nonstandard English. As others have pointed out when dealing with test criticisms, Sattler and Gwynne (1982) cited social and cultural reasons for the persistence of "scientific" myth despite available evidence.
Flaugher (1978) was concerned with another and potentially more serious form of atmosphere bias: the effect onattitudes and test-taking motivation due to the adverse publicity concerning testing and its unfairness to minorities. This area has not seen much research, but Flaugher (1978) pointed out that this type publicity and the use of tests which remind deprived populations (e.g., inner city schools) of all too painful realities may be counterproductive, creating another kind of "bias" toward testing.Again, we see that much of the bias is created by and responsive to factors outside the testing situation and the test itself.
32
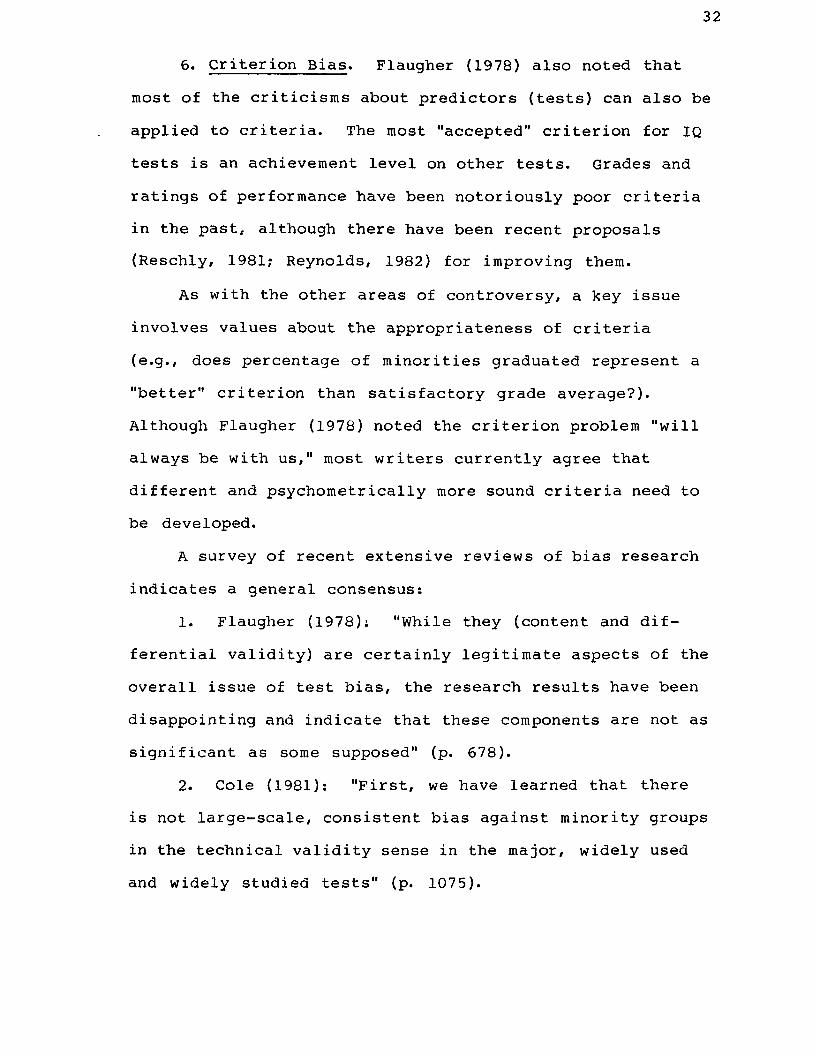
6. Criterion Bias. Flaugher (1978) also noted that most of the criticisms about predictors (tests) can also be applied to criteria. The most "accepted" criterion for IQ tests is an achievement level on other tests. Grades and ratings of performance have been notoriously poor criteria in the past, although there have been recent proposals (Reschly, 1981; Reynolds, 1982) for improving them.
As with the other areas of controversy, a key issue involves values about the appropriateness of criteria (e.g., does percentage of minorities graduated represent a "better" criterion than satisfactory grade average?). Although Flaugher (1978) noted the criterion problem "will always be with us," most writers currently agree that different and psychometrically more sound criteria need to be developed.
A survey of recent extensive reviews of bias research indicates a general consensus:
1. Flaugher (1978): "While they (content and differential validity) are certainly legitimate aspects of the overall issue of test bias, the research results have been disappointing and indicate that these components are not as significant as some supposed" (p. 678).
2. Cole (1981): "First, we have learned that there is not large-scale, consistent bias against minority groups in the technical validity sense in the major, widely used and widely studied tests" (p. 1075).
33
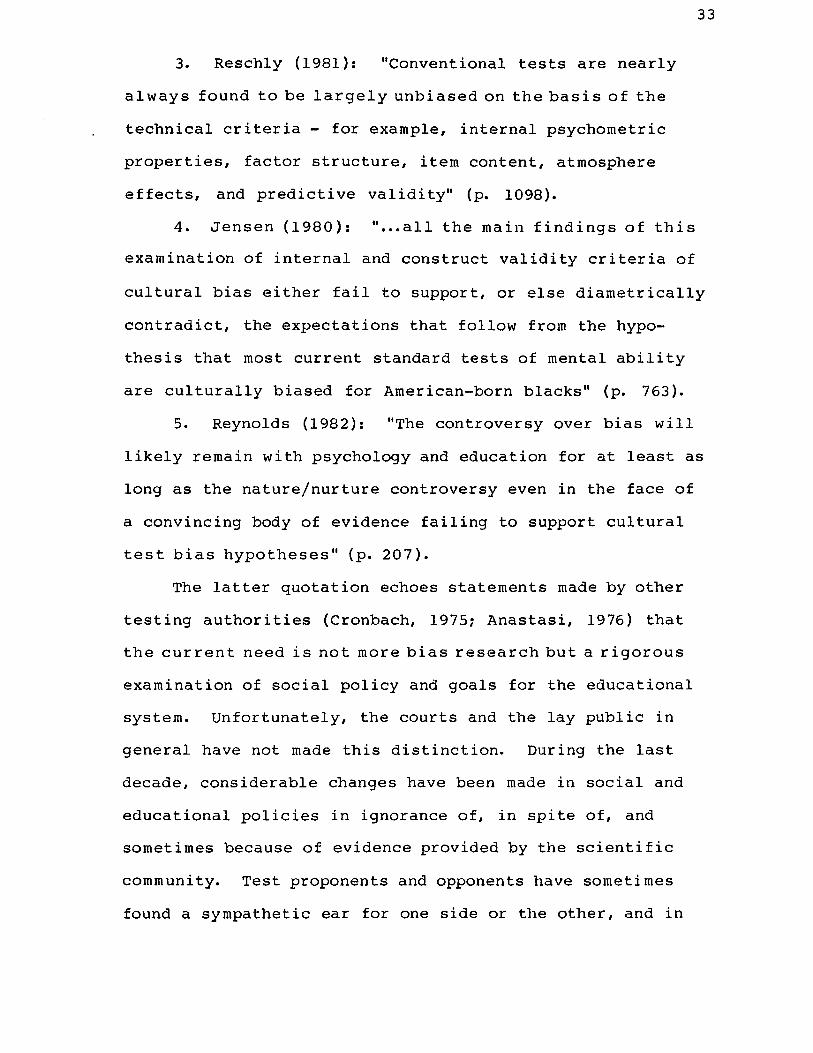
3. Reschly (1981): "Conventional tests are nearlyalways found to be largely unbiased on the basis of the technical criteria - for example, internal psychometric properties, factor structure, item content, atmosphere effects, and predictive validity" (p. 1098).
4. Jensen (1980): "...all the main findings of thisexamination of internal and construct validity criteria of
cultural bias either fail to support, or else diametrically contradict, the expectations that follow from the hypothesis that most current standard tests of mental ability are culturally biased for American-born blacks" (p. 763).
5. Reynolds (1982): "The controversy over bias will likely remain with psychology and education for at least as long as the nature/nurture controversy even in the face of a convincing body of evidence failing to support cultural test bias hypotheses" (p. 207).
The latter quotation echoes statements made by other testing authorities (Cronbach, 1975? Anastasi, 1976) that the current need is not more bias research but a rigorous examination of social policy and goals for the educational system. Unfortunately, the courts and the lay public in general have not made this distinction. During the last decade, considerable changes have been made in social and educational policies in ignorance of, in spite of, and sometimes because of evidence provided by the scientific community. Test proponents and opponents have sometimes found a sympathetic ear for one side or the other, and in
34
some cases both have been ignored (PASE v. Hannon 1980). Currently, decisions about testing practices are being and will be made on a sociopolitical basis, largely through district court interventions and perhaps ultimately the Supreme Court (Larry P. v. Riles). Therefore, a review of legal issues and decisions about testing is in order.Legal Issues
It is only during the last twenty years that there has been extensive legislative and judicial involvement in the practice of education. In 1969 the Supreme Court declared students to be "persons" whose constitutional rights must be respected. This marked the beginnings of appeals to the courts and legislatures to grapple with education's social and political problems. During the next decade, a series of legislative acts (Civil Rights Act, 1964; Elementary and Secondary Education Act, 1965; Handicapped Children's Early Education Assistance Act, 1968; Rehabilitation Act, 1973; Education for the Handicapped Amendments 93-380, 1971; Education for all Handicapped Children Act 94-142, 1975)were passed and followed by long, complicated, and controversial regulations from federal administrative agencies.
The general legal principles of equal protection under the law and due process are no different for school systems and students than for other areas of society. However, "equal protection" has been extended to include "equal educational opportunity." Discrimination is therefore not allowed to deny such opportunity without a legitimate
reason. This principle was in large measure responsible for court victories requiring public school systems to serve handicapped students (Mills v. Board of Education,1972). On the other hand, special education students have also argued that they were unfairly classified as handicapped and denied equal protection by not having equal access to regular education (Larry P. v. Riles, 1979). The
principle of due process has been involved in timelines and procedural steps required for special education assessments and placements.
Special education classes for American students did not exist in significant numbers until after 1950, when increasing public sophistication and formation of parent groups led to demands for special facilities. Political changes in the 1960's toward more liberal and optimistic viewpoints about the ability of education to solve the nation's problems brought special programs for disadvantaged children (e.g., Head Start) and new federal agencies (Bureau of Education for the Handicapped). By 1973 special education was increasing rapidly both in numbers served (over 2 million) and financial support (over 90 million dollars, Office of Mental Retardation Coordination, 1972). Today a free and appropriate public education is mandated for all children aged 3-21 (P.L. 94-142, 1975). Includedis a "least restrictive environment" mandate which means that placements for children fall into a hierarchy depending on the severity of the problem, ranging from

regular classrooms with supplementary assistance through part time services (resource rooms) to full time day or residential schools. Special education now has its own framework for training and certification, with most relatively large school systems having separate administration and budgeting for special education services.
Despite the recent rapid progress for special
education services, there are a number of unresolved disagreements. The term "appropriate" used earlier points out an area of ambivalence by both public and professionals concerning the benefits versus disadvantages of special education. For some time, public opinion had concerned itself with making special education available to all deprived and underserved children. Minority children constituted a large percentage of this number, since classification measures (IQ scores) revealed group scores for minorities to average one standard deviation below those of whites. As court decisions in the area of civil rights forced integration in the schools, special education came to be viewed by some as a "dumping ground" (Mercer,1973) where rules of classification were used to isolate and segregate minority children. In the current controversy, one side has sought to prevent unfair labeling and "inappropriate" placement for services, while the other seeks to prevent unfair denial of the same services. At the crux of the controversy lies the alleged primary classification instrument, the IQ test.

37
IQ tests have been inextricably bound to educational classification since the development of the Binet scales in France exclusively for that purpose. In America their use did not attract a great deal of attention because of the slow development of special education services and school segregation. Integration in the 1950’s and increasing concern with civil rights legislation soon led to a focus
on special education in general and testing in particular. The Brown versus Board of Education (1954) mandate for desegregation brought charges that tests were tools to avoid desegregation and more generally deny the constitutional rights of minorities.
The first major court case involving tests themselves was Hobson versus Hansen (1967). This case dealt with black students placed in lower tracks based on standardized group tests. The court looked at whether classifications in the Washington, D.C. school system were unfairly performed and whether grouping by ability deprived students of equal protection. Ironically, evidence that the tests measured innate capacity would have been an acceptable reason for grouping. The court found ability grouping to be inflexible, stigmatizing, and most importantly a consignment to tracks with fewer financial and educational resources. Tests were seen as relevant only to white middle class students. This was the beginning of the end for the use of group tests, and in fact individual tests

38
were used to prove that more than half the students had indeed been misclassified.
Individual tests were attacked next in the case of the 1970's, Larry P. v. Riles. The case has been resolved in district court but is currently being appealed. In 1971, black children in the San Francisco school system filed suit in Federal district court, charging racial discrimina
tion by unfair placement (using IQ tests) in classes for Educable Mentally Retarded (EMR). A temporary injunction against such placements was requested. This suit clearly framed a basic question: Is it constitutional to useindividual psychological tests to place students in special classes if this adversely affects minorities? To answer no would mean that IQ tests would have to be considered invalid or a "qualified individualism" stance would be taken (cf. Hunter & Schmidt, 1976).
The plaintiffs in Larry P. noted that the percentage of black students in EMR programs was much higher than the percentage in the entire system. The court agreed that this was in violation of a presumption that innate ability is randomly distributed across ethnic groups, and that disproportionate EMR placement therefore represented discrimination due to "biased" tests. The burden of proof was shifted to the school system to demonstrate the connection b e tween IQ tests and the purposes for which they were used. All arguments were rejected, and the court enjoined the use of IQ tests to place black children in EMR classes. By

39
1975 no IQ tests were used for placement in the state of California.
The actual trial on the main issues in Larry P. did not begin until October, 1977 and lasted until the middle of 1978. In the meantime, the Supreme Court (Washington v. Davis, 1976) had held that discriminatory intent as well as impact must be shown to prove a constitutional viola
tion. Also, Public Law 94-142 was passed in 1975, providing extensive guidelines to assure nondiscriminatory, multi-disciplinary assessment. This represented a legislative attempt to ensure equal protection and due process rights for all handicapped students, including a fair evaluation to determine whether they were indeed handicapped .
As Larry P. (part I I ) began, the original complaints were expanded to include violation of the Civil Rights Act (proof of discriminatory intent not necessary) and violations of P.L. 94-142 and section 504 of the Rehabilitation Act. This broadened the issues studied by the court and increased the complexity of the eventual ruling. I n
October, 1979 the court found in favor of the plaintiffs; holding that special education classes did not constitute "meaningful education," that proof of validation of I Q
tests for placement purposes was not shown, and that statutes requiring placement in the least restrictive environment were violated.
40
A major part of the reason for the findings was the court's contention that IQ tests had not been validated for selecting children for EMR classes. The considerable amount of research evidence on the correlation of IQ with achievement was largely ignored, as the court felt prediction of low achievement, even if accurate, was not a fair basis for consigning students to a "markedly inferior,
dead-end track" (Larry P. v. Riles, 1979, p. 269).Although the court saw IQ tests as biased, and
accepted testimony that IQ and achievement tests measured the same thing, the use of achievement tests was never questioned by the court. Instead, the court stated that the most notoriously poor (by research) measure of grades was the best criteria for validation studies.
The negative view of EMR programs as "dead end" classes which assumed the students incapable of learning permeated Judge Peckham's report. Since the court concluded that IQ tests were the most important factor in determining placement, the next question involved whether IQ tests were discriminatory. Testimony was presented and accepted that intelligence is impossible to define and thus to measure (Lambert, 1981). The court then found IQ tests biased due to inadequate standardization, language bias, and failure to consider black culture in constructing test items.
Judge Peckham's decision had many revolutionary impacts, the major one being the first ban on the use of
41
individually administered I Q tests. However, there were also specific implications for test construction and testing practices. "Validation" was defined in a way as to insist that separate norms by race would be the only acceptable standardization, and that I Q tests could not be correlated with other standardized tests to determine validity. This would imply that similar patterns and means
must be displayed for all subgroups on a test to escape a charge of bias, a clearly impossible task for most current tests. It is interesting to note at this point that the court's philosophy, findings, and recommendations are identical to those espoused and represented by SOMPA, whose developer Jane Mercer was one of the key witnesses at the trial. SOMPA appears to follow the exact criteria set up by the court for an unbiased instrument. The present study provides information as to how well such an instrument actually performed compared to others the court rejected.
The second and more recent case about testing, almost directly opposite in results to Larry P., is that of PASE v. Hannon (1980). A parent group in the Chicago school system brought a class action suit on behalf of two black children "inappropriately" placed in special education classes. In July, 1981, Judge Grady astonished the scientific community by listing every item on the WISC, WISC-R, and Stanford-Binet tests and giving his own opinion as to whether the items were biased. Judge Grady felt that the number of biased items were so few as to be
insignificant. He also disagreed with the Larry P. results in finding that IQ scores were only one of several factors in placement decisions. Black/white test score differences were explained as being largely due to socioeconomic conditions, not cultural bias. Predictably, the judge received considerable criticism for this personal face validity approach from many sides, although he was
praised for upholding the usefulness of tests. In most areas, Judges Grady and Peckham were diametrically opposed, whether on the functions and quality of special education classes, IQ as a sole determinant in classification decisions, test validity as a critical factor, or adherence to the provisions of P.L. 94-142. The common element involves the fact that both trials turned on a decision about whether IQ tests were biased, and both essentially ignored voluminous research in favor of simple presumptions .
Current and future court proceedings make it clear that the test bias issue is far from settled. Court decisions have already created significant changes in testing practice and policies. No recent testing instrument has embodied in its development or use more of a mixture of sociopolitical values, test theory and psychometrics, and general scientific controversy than has the System of Multicultural Pluralistic Assessment (SOMPA). As such, a brief description and review of SOMPA, its assumptions regarding intelligence, and its recommended use in

educational classification and placement decisions will be presented. Since the SOMPA is the most critical aspect of this proposal, a clear understanding of its nature and use is necessary.
DEVELOPMENT OF SOMPA As Mercer (1979) noted in the introduction to the
SOMPA technical manual, the evolution of the evaluation system took place gradually over a period of years. The Riverside studies (Mercer, 1973) provided information about societal definitions of and approaches to mental retardation. It became clear that assumptions about retardation
as a medical or social entity were insufficient to explain the complexity of the problem. The pool of persons labeled "retarded" contained only small numbers of individuals with demonstrable physcial deficits (medical model) or who were considered to be retarded in any other social context than the schools (social model). Further, these (largely poor and ethnic minority) individuals tended to lose the label when they moved into general society, and to complain about stigmatization and unhappiness while in school. As noted earlier, the Riverside results led to recommendations that cutoff scores on IQ tests be lowered, that adaptive behavior be given equal importance in defining retardation, and that new norms based on sociocultural status be used in interpreting test results. Dissemination of the Riverside conclusions began in 1965, concurrent with major societal changes in the area of civil rights and education. A number of court cases over the next several years attacked the uses of tests in special education assessment and placement. As the pressure for changes mounted, the 1973 AAMD revision of the definition of retardation fulfilled
44

the first two of the Riverside recommendations (lower IQ cutoffs, requirement of adaptive behavior). The goals and specific language of special education legislation (e.g., P.L. 94-142) also adopted these values. While these responses led to a smaller incidence of labels of retardation in some states (Patrick & Reschly, 1982), the ethnic composition of groups so labeled remained largely
unchanged. This may have been affected by the failure to adopt the third Riverside recommendation; the use of socioculturally specific (pluralistic) norms. No large legislative or professional body advocated a pluralistic approach. As dissatisfaction with racial imbalance in special education led to calls for the elimination of "discriminatory" tests, Jane Mercer and her colleagues received a grant from the National Institute of Mental Health to develop a system of multicultural assessment, eventually to be called the SOMPA.
Mercer (1979) took an unusual step in the SOMPA technical manual by devoting considerable space to explication of the basic philosophy, assumptions, and values underlying the system, which is considered to be a logical outgrowth of those values. Many of these stem directly from the Riverside studies' conclusions.
Mercer and Lewis (1979, p. 15), in discussing the "Anglo Conformity Model," noted the generally uncontested fact that American society is largely fashioned from the English (Anglican) traditions of the early colonists,

particularly in law, commerce, education, and family ideals. They likewise noted the role of public educational systems in conveying these traditions, describing them as "Anglocentric, monocultural, biased toward middle and upper class customs and lifestyle, standardized, and centralized bureaucracies administered by professional educators (p. 15)." The goals of American society were held to be the assimilation of all other cultures into the Anglo core, with treatment of different groups as deviant.
In contrast, Mercer (1979) presents a model of cultural and structural pluralism, noting that there are distinct cultural groups in American society who have reached varying degrees of assimilation. These groups and their cultures are held to be of equal worth and deserving of a public policy guarantee to perpetuate themselves through the educational system.
Mercer next states that the Anglo conformity model also describes current testing practices, in that tests assume cultural homogeneity when in fact this is not the case, thereby penalizing minority children. This occurs in a number of areas, including the dominance of the English language in terms of style and content, the use of a single (Anglo) normative framework to interpret scores, the use of Anglo criteria (GPA, achievement scores) to define the validity of tests, the restriction of the concept of bias to mean accuracy of prediction for Anglo core culture

goals, and the lumping together of distinct assessment models into one model with the major requirement of adaptation to Anglo society. Among the negative consequences to minorities from this state of affairs were noted restricted educational opportunities, stigmatizing labels, ignoring success in non-school roles, and devaluing minority cultures. Mercer (1973, Chapter 3) felt that a culturally pluralistic approach to assessment would avoid these negative impacts through the use of multiple norms and expansion of success criteria.SOMPA - Basic Models
Assessment with SOMPA has previously been noted to involve a triangulation process, with three sets of measures based on three distinct models. A brief description of each model follows.
In the medical model, assessment has to do with the physical status of the individual. Abnormality is defined as the presence of physiological or behavioral symptoms presumed to have a biological basis. Sociocultural factors are not considered to be relevant to diagnosing the problem, although there may be a correlation between these, a biological factor, and the problem in question, leading to a mistaken assumption that the sociocultural factor is a cause. One set of norms suffices for all populations.
The medical model tends to view health as the absence of disease, and assessment within the model usually involves the counting of symptoms. The "symptoms" may be
48
noted during general screenings of populations having no prior complaints. There is generally a cutoff score at the "normal" level, and no further attention is paid to performance above that level. The small number who fail may be more carefully measured to determine their level of pathology. The consequences of overlooking pathology when present are considered to be more serious than suspecting it and finding none, leading to more inclusive ranges of "abnormality" on measuring instruments.
The basic question in the social system model involves whether a person's behavior meets the social norms of the group in which he participates. Mercer indicates that the typical role for children is that of student, and that most psychological and educational tests represent this model. "Abnormality" in this model is social deviance, which is viewed as a behavior rather than a trait. There are multiple social systems (family, peers, school) and thus an individual may be described as normal, abnormal, or both depending on the system(s) studied. Thus, there can be no trans cultural interpretations of behavior. Learning, motivation, and socialization are held to be the etiological factors for any observed behavior. Measures of behavior above an "acceptable" cutoff are both possible and desirable, since assets are at least as important as deficits.
The norms of a culture are often politically determined, and reflect sociocultural values. Currently, the
49
public education system is based on Anglo values, so that acceptable performance is defined by behavior in the academic student role and largely measured by IQ and achievement tests. Obviously, this is only one possible role, and assessment of other children's roles requires other sets of norms.
Unlike the medical model, the consequences of falsely
diagnosing behavior as deviant in the social system model is seen as more negative than failing to do so (because a labeling effects, self-fulfilling prophecies, etc.). Therefore, a greater deviation from the norm should be required to diagnose subnormality.
Mercer, having relegated the IQ test to a social systems model, deals with the question of how to measure learning potential in a pluralistic model. Measures of general intelligence cannot be used to make inferences about learning potential unless sociocultural factors are considered, such as opportunity to learn, materials, motivation, familiarity with test taking situation, physical problems, etc. Inferences can only be made if the appropriate normative framework for each student is identified (i.e., he can only be compared to others from a similar sociocultural background). It is assumed that the innate component of intelligence is equal across all ethnic groups, while differences in the background factors mentioned above produce group score differences. Mercer feels that test validity within the pluralistic model is assessed
50
by means of logical consistency with the assumptions of the model (i.e., have sociocultural factors been controlled?), and that external criteria such as grades are inappropriate to determine validity. The negative consequences of labeling are again felt to be great enough that overestimates of potential are preferred to underestimates. To estimate potential, the results of standard intelligence
tests must be interpreted within a pluralistic model.Since there were no available instruments to do this, an approach to it was developed as part of SOMPA.Measures Within Models
The basic purpose of medical model measures is to screen for deficits in sensory or motor areas and for significant problems in general health that may contribute to poor school performance. There are six measures:
1. Weight by Height. This ratio is converted into a set of scaled scores for males and females. Children whose scores fall at or below the 16th or at or above the 85th percentile are considered to be "at risk".
2. Health History Inventory. A series of questions regarding a history of trauma, diseases, or injuries, prenatal/postnatal problems, and vision and hearing problems are asked and the responses are coded and scored. Children achieving a raw score at or below the 16th percentile in any specific area are considered to be "at risk."

51
3. Visual Acuity. Scores in the extreme 16% deviating from the standard (Snellen notation, 20/40 or worse) norms are identified as "at risk".
4. Auditory Acuity. Testing is done by an audio- metrist. Hearing levels of 35db or greater for one frequency or between 25 and 35 db for two frequencies in one ear represent an "at risk" score for that ear.
5. Physical Dexterity Tasks. Six measures of dexterity are administered and scored. These include Ambulation, Equilibrium, Placement, Fine Motor Sequencing, Finger-tongue Dexterity, and Involuntary Movement. Scale scores are derived on each measure, and the results are summed and averaged. Students who make a significant number of errors (scoring at or below the 16th percentile) are considered to be "at risk."
6. Bender Visual Motor Gestalt Test. The test is administered by the standard procedures and scored according to Koppitz criteria. A significant number of errors resulting in a scaled score at or below the 16th percentile (tables provided by Mercer) represents problems in perceptual maturity and the student is considered "at risk."
Scores falling within the "at risk" range on the various measures call for further examination by persons trained in the particular area of expertise (generally physicians or allied health professionals). Such results imply caution in interpreting the results of other measures within the SOMPA system.

52
There are two social system measures. The first, the Adaptive Behavior Inventory for Children (ABIC), surveys five social systems (family, community, peer group, school, earner/consumer) and adds a measure of self-maintenance. Items were generated by combining previous test items and the results of interviews with mothers of children who had been labeled mentally retarded. Questions are arranged to
reflect increasing expectations and changes of the relative importance of the six areas with age. Responses are obtained from parent interviews and scored for a particular behavior as latent (0), emergent (1), or mastered (2), depending on how frequently or independently the given behavior is observed. A "basal and ceiling" approach is utilized, with examiners beginning at an appropriate age for the particular student. However, 35 of the total 242 items showed no differences across age during standardization and are thus given in every case. Items within various age groups are listed in order of difficulty (least to most). Since the ABIC generates a summary score, item differences by sex and socioeconomic status were examined and held by Mercer to balance out. Considerable differences were noted across ethnic groups but not commented upon in terms of alterations in scoring or interpretation, and the three ethnic groups (black, white, and Hispanic) were treated as a single population in developing norms.
Administration of the ABIC results in an overall average scaled score based on the average scaled score
53
across the six subtests. Mercer indicated, however, that validation must be conducted separately for each subtest and that no general criteria be used. For example, proper validation of responses in the "peer" domain could only be done by collecting peer ratings rather than using responses of teachers or mothers.
The second social system measure is the WISC-R, which Mercer describes as representing the Anglo social system in terms of values and expected roles. Thus, the WISC-R measures behavior as a function of how well it fits a sociopolitical definition of "normal". It is seen as a culture-bound test because of a finding that slightly more than 20% of WISC-R variance is accounted for by sociocultural background factors. The IQ resulting is relabeled the School Functioning Level (SFL) as a reminder of its limited interpretability. While describing the WISC-R as a weak predictor of grade-point average or teacher ratings, Mercer advocates using the WISC-R because of its high reliability, wide usage by large numbers of trained examiners, technically significant relationship to academic achievement, and sound internal validity.
As noted earlier, SOMPA views all tests as measures of learned behavior and therefore requires evidence of equal opportunity to learn before inferences can be made about an individual's "potential." This would require culture- specific norms for the WISC-R, since there are significant differences in performance between ethnic groups. SOMPA
54
generates such pluralistic norms by utilizing multiple regression equations to modify the basic WISC-R scores for sociocultural factors. There are four basic factors: Family Size, Family Structure (intactness), Socioeconomic Status, and Urban Acculturation. Correlations of scales containing these measures and WISC-R Verbal, Performance, and Full Scale IQ's initially ranged from .08 to .47 across black, white, and Hispanic groups. For each ethnic group, a predicted score consists of the values of that group's intercept of the Y axis plus the four weighted sociocultural scores. For each individual, then, the WISC-R IQ is adjusted for sociocultural factors and the result compared only to his ethnic peers. This score is called the Estimated Learning Potential (ELP). If the sociocultural factors predict an IQ higher than 100 (as they often will for white students), the original WISC-R norms are considered appropriate. In this case, the ELP and IQ (or SFL, as termed by Mercer) would be the same.
In practice, the general effect of utilizing ELP scores will be to raise the learning potential estimate above the IQ score for minority groups more than for whites. The larger the discrepancy between the sociocultural factors (more deprivation) and those of the "norm," the more points tend to be added by the use of ELP. The average Full Scale ELP-IQ difference m the original SOMPA standardization was near 11 points for blacks and 7 points for Hispanics.

55
Mercer states that validity under the pluralistic model is inferential, not predictive, and thus based solely on the amount of variance accounted for by sociocultural factors (the higher the percentage, the greater the validity).
Use of the entire SOMPA package should resolve questions about the reason for a particular child's difficulty
in school. The inclusion of basic health and sensory information serves as a check on whether physically based factors can be ruled out as contributing to poor school performance. Adaptive behavior is included as a necessary adjunct to measures of intelligence in defining whether retardation is a general or a school-specific characteristic. The traditional intelligence test serves two functions: measurement of school role performance (SFL)and estimate of learning potential (ELP). The time necessary to score, administer, and interpret the whole package ranges from four to eight hours (Oakland, 1979).
None of the types of assessment devices listed are unique to SOMPA, as there are many health screening and adaptive behavior inventories. However, the core of SOMPA's attempt to eliminate test discrimination is the use of regression equations to generate the ELP as an alternative to the WISC-R IQ score. Mercer holds that this score should be the one used in classifying and placing children, and it is this aspect of SOMPA that is at the heart of a wave of critical reaction.

56
Early Reaction to SOMPAThe development, California standardization, field
trials, and adoption of SOMPA as a practical instrument have taken place within the last eight years. The first actual implementation of SOMPA occurred in the Pueblo, Colorado school system (Talley, 1979). To date, the only statewide adoption of SOMPA has occurred in Louisiana, where its use was mandated by the Louisiana State Department of Education (1978), but later made optional(1981) .
The SOMPA has not escaped its share of criticisms on philosophical, theoretical, psychometric, applied, and social policy grounds. The brunt of the criticism has been directed at the concept of pluralistic norms and the use of the ELP. The eighth volume of School Pscyhology Digest (1979) is largely devoted to reviews of SOMPA by both academicians and researchers, Mercer's rejoinders, and a round of rebuttals by the reviewers. The major criticisms are as follows:
1. Some authors have disagreed that there is a monolithic Anglo culture significantly different from minority cultures (Olmedo, 1979). A number of internal validity studies (Reschly, 1979; Oakland and Feigenbaum, 1979) show that IQ tests are basically measuring the same factors across ethnic groups and that there is no evidence for content bias.

57
2. In preliminary research, ELP scores have failed to demonstrate an advantage over WISC-R IQ's in terms of predictive validity for achievement scores or school grades (Oakland, 1979; Reschly, 1978). Mercer (1979) had anticipated this outcome.
3. There is evidence that California norms for ELP and sociocultural factors are not representative of other states (Oakland, 1979).
4. Brown (1979) asserted that the ELP is an estimate of what "might have been" rather than current or future functioning; i.e., that long-term experiences in deprived environments have just as "permanent" effects on ability without making an assumption about hereditary origins. The ELP scores are seen not only as unrealistic but harmful to the extent they deprive students of special services.
5. Goodman (1979) argues the SOMPA is a return to the idea of genetic potential and seeks once again to get a "pure" estimate of intelligence when this approach has been discarded by most psychologists.
The SOMPA controversy has so far generated much more heat than light, with arguments primarily political and theoretical in nature as to whether it should or should not be used. Since SOMPA has in fact been implemented in a number of cases, it is more appropriate to look at the impact of its actual use as a means of addressing major questions about its value. In particular, there are two primary questions. The first involves the fact that a main
58
consideration in SOMPA's development and adoption is the elimination of discriminatory labeling of minorities as retarded and hence their reduction as a percentage of the special education population. Is this in fact accomplished when SOMPA is used? The second question involves the relationship of ELP scores to student performance and success once placements are made. How does the ELP compare to tne IQ in terms of predicting achievement? How do students placed consistent with ELP scores perform compared to students placed consistent with IQ scores?
As Green (1978) pointed out, even if one wishes to favor a particular group as a matter of social policy, one still needs to use the most valid instrument available. Goodman (1979) stated that the adoption and use of SOMPA has moved the debate over its assumptions and practical value "from the realm of theoretical controversy to that of intense practical concern." In that vein, this study examines the impact of SOMPA ELP scores on changes in racial composition and student performance of special education students in a large Louisiana public school system.A brief description of the provision of special education services in Louisiana as well as assessment guidelines are provided in the following section.

SPECIAL EDUCATION IN LOUISIANA Special education services for exceptional children
have been available (in some form) in Louisiana for more than two decades. A formal mandate for these services was established by Act 754 of the Louisiana State Legislature, which was inspired by and closely parallels the federal Public Law 94-142. A comprehensive set of regulations was
then derived by the Louisiana Board of Elementary and Secondary Education to translate Act 754 into educational guidelines. The basic intent of the legislation was to provide for a free, appropriate public education for all exceptional children in the least restrictive environment consistent with their handicapping conditions. Special education in Louisiana has generally followed M. C. Reynold's pyramid model (1962), in that a continuum of services is available so that increasingly restrictive educational environments are provided as the severity of a child's handicap prevents him from educational benefit in less restrictive environments. The range of options available moves from a regular class setting to 24-hour residential care. Qualification for special education services and placement within the continuum is determined by an assessment process which is also defined in specific guidelines. The process is required to be as fair and accurate as possible, including, if necessary, a multidisciplinary individual evaluation. No single procedure may be used as a sole criterion for placement. Tests used

60
in an evaluation are required to be free of racial, cultural, language, or sex bias (Louisiana Special Education Bulletin 1508, 1978).
The purposes of special education evaluations are twofold. First, a formal classification as exceptional is necessary in order for a child to be eligible for ongoing special educational services. Secondly, educationally
relevant data is utilized in making a decision as to specific placement in the continuum of services and to suggest techniques of intervention. Thus, an educational classification per se does not translate into a specific placement, but does imply that a student would be grouped with others who exhibit the same general severity of the handicapping condition (an assumption not always met in practice, cf. Robinson & Robinson, 1976; Leinhardt et al, 1982).
Appendix A lists the criteria specified in the 1978 Louisiana Special Education Bulletin 1508 for classification categories largely based on questions of intellectual functioning. In the case of the Not Exceptional (NE) and Learning Disabled (LD) categories, intelligence must be ruled out as an explanation for poor academic performance. In other cases (Slow Learner [SL], Mild Mentally Retarded [MiMR], Moderate Mentally Retarded [MoMR]), the severity of the deficit has to be specified.In the Gifted (GT) category, evidence of sufficiently high intelligence is required. The criteria listed are those in

61
effect for the period during which SOMPA ELP scores were required.
Bulletin 1508 (p. 7) specified that "all evaluations must meet the criteria for eligibility established by the State Board of Elementary and Secondary Education for each exceptionality (category) and included in this handbook." Any determinations of mental retardation were supposed to be based on a variety of information, including an assessment of adaptive behavior. In addition to these requirements, the Department of Education published guidelines for nondiscriminatory intelligence assessment procedures (Special Education Department, State of Louisiana, 1978). The guidelines reiterated the Act 754 requirement concerning the use of nondiscriminatory tests and went on to discuss the rationale and background of SOMPA, concluding that "in standardization and field trials SOMPA appears to have corrected the racial, cultural, and socioeconomic bias inherent in the Wechsler Intelligence Scales-Revised." Page 14 of the guidelines includes the statement that for children between 5 and 12 years of age "Estimated Learning Potential shall be calculated and used as the indicator of intellectual ability." The 1978 guidelines were in effect until 1981 when a revised bulletin eliminated the requirement that ELP be used but continued to require consideration of sociocultural factors in determinations of possible mental retardation.

62
Effect of SOMPA on Special Education AssessmentSOMPA was introduced to Louisiana state education
personnel through a series of workshops in regional locations. No specific data are available concerning the overall level of compliance to the mandate for ELP use, but a recent study (Hansche, 1982) suggested that ELP scores were generally derived and recorded, although the ultimate
placement decisions was not always consistent with ELP scores.
Earlier descriptions of SOMPA ELP scores noted certain properties that imply their effect on special education classification categories. The use of ELP scores can generally only raise IQ estimates (except for small statistical artifacts, cf. SOMPA Technical Manual, Mercer &Lewis, 1979, p. 137). Thus, use of ELP instead of IQ scores for a given category would generally move students up within a category range or raise them to the next higher category. Appendix B identifies the probable subgroups to be found in each category, depending on whether ELP, IQ, or both scores are consistent with the category range. There were expected to be a few cases where neither score matches the range. Hansche (1982) found no such cases.
Considering the basic SOMPA model and characteristics of ELP scores, the general impact of their use should involve a relative elevation of IQ estimates for minority as opposed to white students. Whether this in fact changes educational classification and placement depends primarily
on: (a) Whether assessment personnel follow guidelines as specified, and (b) how often factors other than IQ scores are given greater weight in placement decisions. Hansche's(1982) results suggested that achievement was a secondary source of variance in explaining classification decisions. While adaptive behavior was noted to be a large source of variance, Hansche used it as a dummy variable which was
coded as present vs. absent, and noted that teams appeared to first derive IQ scores before deciding whether to assess adaptive behavior.
A primary reason for adoption of SOMPA by many school systems is a response to current or expected pressure from the U.S. Office of Civil Rights (Talley, 1979). The specific demand is usually the reduction of a "disproportionate" number of minority students, defined as a higher percentage of minorities in special education as opposed to their numbers in the general school population (Larry P. v. R iles, 1979). Since SOMPA is specifically targeted to remove labels of retardation, it has had some appeal as a desegregation instrument.
Few studies about changes in special education composition as a consequence of SOMPA use are available. Talley's (1979) report was labeled as a "qualitative" account and consisted largely of reported reactions of administrators to the introduction and use of SOMPA. In the Austin study (Oakland & Feigenbaum, 1979) the use of ELP scores was reported to decrease the number of students

64
identified as educable mentally retarded. However, no information as to a change in the black/white composition of actual special education classes was given. Although Hansche (1982) did not address this specific question, data from her study of a Louisiana special education sample indicated that 93% of students in Mildly Retarded, 75% in Slow Learner, and 72% in Moderately Retarded groups were black, while 40% of the Learning Disabled sample were black. The study was done two years after SOMPA use was required. While small sample sizes make the results tentative, there are little data to suggest any major shift in special class racial composition except for an increase in black percentage of the Learning Disabled category. Thus, there is no current evidence regarding changes in the racial composition of special education classes as a result of SOMPA use although this was a major selling point in marketing the test (Brown, 1979).
A central point in the controversy between SOMPA critics and defenders has been the accuracy and therefore usefulness of ELP scores as predictors of school achievement. Oakland (1979) found WISC-R IQ scores to be superior to ELP scores in predicting academic achievement. Reschly (1979) noted that IQ scores (.6 range) accounted for approximately twice the variance of ELP scores (.4 range) in predicting academic achievement. Hansche (1982 did not present correlations for IQ vs. ELP scores, but achievement and IQ score means for whites were nearly one standard
65
deviation higher than those for blacks, while ELP scores for the two groups were nearly identical, suggesting that IQ/achievement correlation would be higher than the ELP/achievement correlation.
There are no current studies comparing achievement performance of students placed consistent with ELP as opposed to IQ scores. However, Hansche's (1982) results (see above) concerning IQ/achievement concordance raise the question of whether ELP scores did in fact indicate hidden potential that could be realized through the increased individualized attention and instruction available in special education.
Considering the need for information about the impact of SOMPA use, the foci of the current investigation are:(a) to assess the effect ELP use had upon the racial composition of special education classes, (b) to compare the validity of ELP vs. IQ scores in predicting academic achievement, and (c) to evaluate the performance of students so placed within each special education category. The specific hypotheses of the study are listed below.
HYPOTHESES OF THE PRESENT STUDY I . Composition of Special Education Categories
It was hypothesized that the use of ELP scores for placement decisions would result in the following effects on special education categories (compared to levels for previous years):
1. Gifted (GT) - an increase in the percentage of
black students due to the general ELP effect of raising estimates for minority students.
2. Not Exceptional (NE) - an increase in the percentage of black students returned to regular education, due to general elevation of scores as noted above. However, the fact that achievement scores were not raised may reduce the numbers in favor of the Learning Disabled category.
3. Slow Learner (SL) - an increase in the percentage of black students due to the general ELP effect noted above and a consequent "migration" from the lower categories.
4. Moderate Mental Retardation (MoMR) - no change.ELP scores do not go below 60, which is above the stipulated category range and ensures that only IQ scores will be consistent for this placement. Hansche's (1982) data suggested that assessment teams in such cases use IQ scores for placement decisions, which represents no change from previous practices.
5. Learning Disabled (LD) - an increase in the percentage of black students. Due to the fact that raising the intelligence estimate without altering achievement
66
67
scores increases the gap between them, and the fact that this gap is a prime determinant of classification as LD, it was expected that there would be a large migration into this category by students previously classified as Mildly Retarded or Slow Learner.
6. Mild Mental Retardation (MiMR) - no significant change in the minority percentage in this category due to
upward migration from the "Moderate" category and a low incidence of white students.
The rationale for the previous hypotheses assumes compliance with state requirements that ELP scores be used and the general effects of raising intelligence estimates without a concurrent adjustment of achievement scores.Since the use of ELP scores is the only major alteration in requirements for classification decisions, use of these scores should be the major contributing factor to significant changes in racial composition within the various categories and special education as a whole. However, the overall outcome should indicate no significant change for racial composition system wide, and the higher percentage of black students as compared to the percentage in the general school population should continue. In essence, it was predicted the ELP use would result in shuffling students between special education categories but not removing large numbers back to regular education.

68
11• Prediction of Achievement ScoresIt was hypothesized that IQ scores would be signifi
cantly more accurate than ELP scores in predicting achievement, whether test scores or ratings are used as criteria. Research cited previously has supported this hypothesis, and this proposal agrees with Brown's (1979) contention that ELP's measure what "might have been" rather than giving an accurate estimate of current or future functioning. The issue of the proper criteria for intelligence test validation has been the subject of considerable debate (Mercer, 1979; Reschly, 1981; Larry P., 1972).General arguments against the use of grades have noted lack of precision, subjectivity, and wide variations in grading standards. Although studies using grades have produced varying results, at least one court decision (Larry P.) has specified them as the only proper criteria in research on test bias, and at least one recent study (Reschly, 1978) seemed to demonstrate that the use of grades only from relevant subjects (reading and arithmetic) could eliminate flaws noted in previous studies (e.g., Goldman & Hartig, 1976). Achievement scores as criteria have likewise been criticized as simply giving an autocorrelation between highly similar tests (Kaufman, 1979), although there are arguments to the contrary (Green, 1978). Nevertheless, achievement test scores still represent the most commonly used criteria in studies of IQ/achievement prediction.

69
A third alternative, advocated by Mercer (1979), has been the use of teacher ratings of academic functioning to provide more refinement, and the use of adjustment ratings to address a second major concern of stigmatization and self-esteem problems resulting from labeling. In this study, achievement scores were collected because of their practical, legal, and historical significance. Recent
studies have employed the use of teacher ratings with some success (Reschly, 1981), therefore these were also collected. Grades were considered but rejected because they are generally composite estimates based on uncertain criteria as far as special education students are concerned.III. Performance of Students Within Special Education
CategoriesIQ and ELP scores are basically competing estimates of
intellectual competence. For reasons noted earlier, it was hypothesized that IQ scores would be better estimates of current and future academic achievement, and that ELP scores would tend to overestimate achievement. Remembering these factors and looking at the various special education categories (Appendix B), an individual student's scores can fall into one of three combinations:
1. The ELP score lies within the specified category range and the IQ score lies below the range. This was termed an ELP-Match.

70
2. The IQ score lies within the category range and the ELP score lies above the range. This was termed an IQ- Mat ch.
3. Both the ELP and IQ scores lie within the category range. This was termed Both-Match.
Obviously, the fourth logical possibility is that neither IQ nor ELP would fit the category range. This
would involve disregard of mandatory guidelines and would imply that achievement scores are the predominant factor. This category was expected to be small and not of particular interest.
For example, the specified category range for Mildly Retarded is 55-70. A student who has an ELP of 73 and IQ of 63 would fall into the IQ-Match group. If his ELP were 63 and his IQ 53, he would fall into the ELP-Match group.If his ELP were 67 and his IQ 57, he would fall into the Both-Match group.
Since ELP scores were presumed to give an inflated estimate of achievement, it was hypothesized that within each category (GT, ME, LD, SL, MiMR, MoMR):
1. IQ-Match students would achieve best in reading and arithmetic. In this case, the ELP score would say that the student actually "should be" in the next higher category, and the IQ score should tend to be near the top of the category range.

71
2. Both-Match students would perform next best in reading and arithmetic. In this case, the ELP score suggests that the student should be nearer the higher end of the category range, while the IQ score would tend to be toward the lower end.
3. ELP-Match students would perform worst in reading and arithmetic. In this case the IQ score suggests that the student "should be" in the next lower category.
As Appendix B illustrates, whether there are two or three groups for comparison depends on whether a category has both upper and lower boundaries. For the categories with only lower boundaries (LD, NE, GT), there would be no IQ-Match group since there is no upper boundary for the ELP score to exceed. Categories with two boundaries (SL, MiMR) should have three groups. The MoMR category posed special problems that will be addressed in the results section.
To summarize, it was hypothesized that students within a particular category would achieve highest if their IQ score alone fits the category range, at an intermediate level if both IQ and ELP fit the range, and lowest if only ELP fits the range.IV. Rating of Adjustment
How well students adjust to special education placement has been a subject of equal importance to that of academic achievement for many researchers. Four specific areas were selected as representing the most logically consistent and previously studied factors: a) Self

72
motivation, b) Peer group participation, c) Observance of school rules, and d) Self concept. Adjustment rating results were hypothesized to follow the same patterns as the achievement scores, with the highest rating for the IQ- Match group, next highest for the Both-Match group, and lowest for the ELP-Match group. The rationale for these hypotheses held that students who achieve more poorly than their peers would also be more poorly adjusted.
METHODSubjects
Data were gathered from the files of the East Baton Rouge Parish School system, one of the largest school systems in Louisiana and possessing one of the most comprehensive special education programs in the state. The Pupil Appraisal section, responsible for special education
evaluations, is considered to be a model in terms of c o m pliance with Bulletin 1508 standards for such evaluations.
The special education population in East Baton Rouge parish is currently near 7700. All students being or having been served within the past five years are registered on computer files, with the exception of students classified as "not exceptional" before 1979.
A minority of students were classified in other categories (e.g., sensory or speech handicaps, etc.), but the majority fell into categories requiring consideration of IQ scores. Data were obtained from each of these six categories (LD, GT, etc.) for students evaluated during the years 1978-1983. A computer search of special education files was done with instructions to locate all students who w e r e c l a s s i f i e d w i t h i n one of the six c a t e g o r i e s of interest whose birthdates allowed possible application of SOMPA (at least age 6 in 1983 and no more than 12 in 1978). Although names were used to help in locating student files, permanent identification was by code number only and no personally identifiable data was kept.
73

74
The computer search generated totals by category as seen in Table 2. The NE category did not include cases prior to 1979, as these were not originally entered on the computer. The search included primarily active (students still receiving services) files, but inactive files were used for the NE category (students generally being served in regular education) and as a minor supplement to increase the size of the retardation category samples.Procedure
Sampling decisions for numbers of observations from the six special education categories were based on two factors: (a) number of students in the category and (b)current ratings of achievement. For categories with relatively small numbers of cases (MiMR and MoMR), it was possible to solicit ratings on all students and thus all files were used in the data pool. For the four larger categories, time and agency constraints did not allow the use of all files. Current ratings were therefore solicited on randomly selected proportions of the LD, GT, SL, and NE categories. A master roll of special education students and teachers was used, and every other student was selected from those who appeared in the category on the original printout. The original number identified for each category, number of ratings solicited, and number of ratings returned are listed in Table 2, along with relevant percentages. An example of the rating form and instructions (collected in May 1983) can be found in Appendix C. All

75
Table 2Teacher Ratings Solicited and Returned
RatingsTotal
Category Sample Solicited Returned % ReturnedSL 976 465 421 91MIMR 259 175 150 8 6
MOMR 1 1 0 1 0 0 83 83NE 1033 915 525 57LD 2285 675 615 91GT 1549 670 519 77TOTAL 6212 3000 2313 77
Note Total cases are those printed out from the original computer search (active and inactive cases). The NE category represents ratings mailed to schools for distribution to teachers rather than mailings to individual teachers.

76
other data was collected from protocols in student records or computer printouts of achievement scores. Percentages of data located are listed in Table 3.
Data collection proceeded in the larger categories by first examining available files on students who had had achievement ratings returned, and thereafter randomly selecting additional cases from those for which ratings
were solicited but not returned or not solicited until an adequate sample size was obtained.
In obtaining data, the earliest evaluation and/or one which used SOMPA was considered the evaluation of record.A student who had more than one evaluation was considered to have a special education "placement" consisting of the time between the evaluation of record and the date of the most recently available achievement scores.
The final set of data collected involved the racial proportions of students classified within the six categories of interest for the years 1978-1982. A computer search of Pupil Appraisal records generated these figures. Figures by race and category for students already being served within those categories were not available except for current 1983 figures, which do allow comparisons as far as racial proportions are concerned.Measures
Data collected on each student involved (at a minimum) age, sex, race, initial evaluation date, and at least one set of achievement scores in reading and arithmetic.
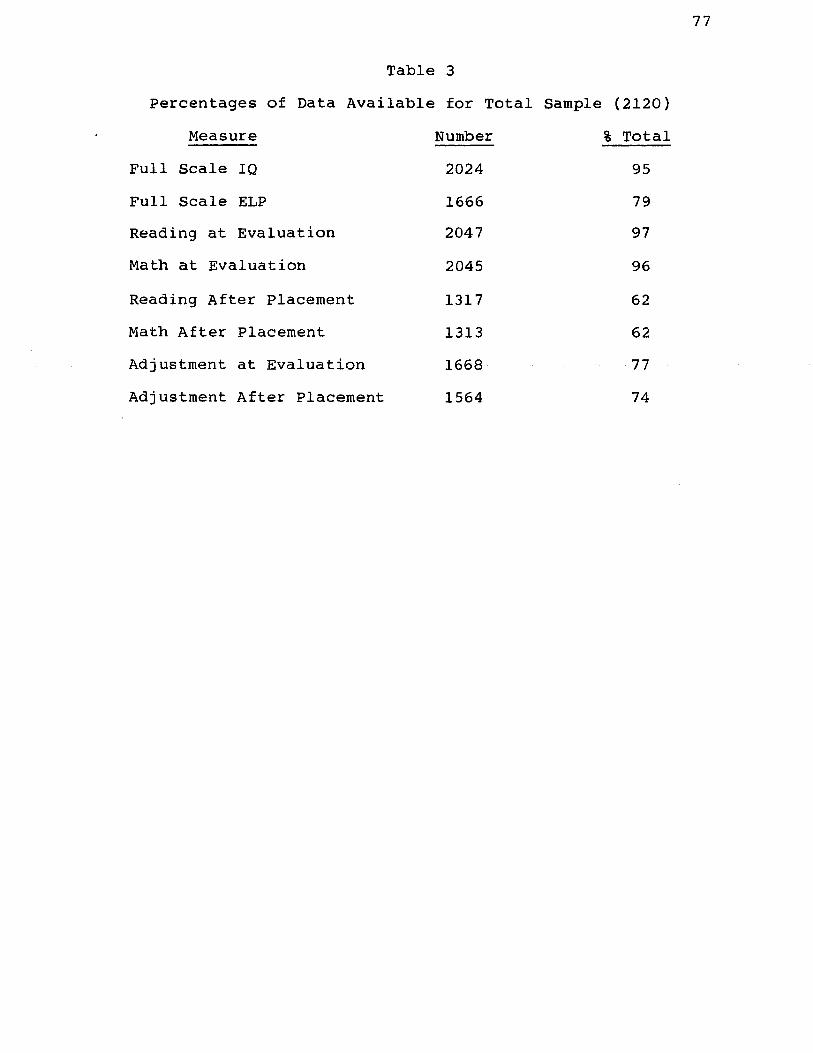
77
Table 3Percentages of Data Available for Total Sample (2120)
Measure Number % TotalFull Scale IQ 2024 95Full Scale ELP 1666 79Reading at Evaluation 2047 97Math at Evaluation 2045 96Reading After Placement 1317 62Math After Placement 1313 62Adjustment at Evaluation 1668 77Adjustment After Placement 1564 74
WISC-R Verbal, Performance, and Full Scale IQ scores, SOMPA ELP versions of these scores, reading and arithmetic scores after placement, teacher ratings of reading and math performance, and ratings of adjustment before and after placement were collected as available (See Table 3).
WISC-R and SOMPA scores had been obtained by standard administration and scoring procedures noted in the respec
tive test manuals (Weschler, 1974; Mercer & Lewis, 1979). Achievement test scores were obtained from one of four tests: (a) the Woodcock-Johnson Psychoeducational Battery(cluster scores), (b) the Wide Range Achievement Test (WRAT), (c ) the Peabody Individual Achievement Test (PIAT), and (d) the Metropolitan Achievement Test (MAT). Standard scores derived from these tests were assumed to be comparable due to previously shown high intercorrelations, as noted by Hansche (1982).
The vast majority of scores (approximately 80%) were derived from the Woodcock-Johnson, with less than 2% from the PIAT and the remainder evenly divided between the WRAT and the MAT. All scores were converted to the IQ metric of mean = 100 and sd = 15. All manuals except that of the MAT provided tables with these values. The Woodcock-Johnson tables did not extend below a standard score of 65 and percentile of 1 , and it was necessary to extrapolate scores below this level by using tables for the mean scores by age group and the standard deviation of 23 for conversion to the IQ metric. This was done to avoid an artificial
79
restriction in range that would have affected low achievers, who comprised the majority of the sample and who exhibited differences in test performance but in a practical sense were not exhibiting any meaningful academic "achievement". Achievement scores above the 99th percentile were handled in a similar manner.
Teacher ratings collected in May 1983 involved the use
of a six-point rating scale for reading and arithmetic performance compared to peers plus four adjustment ratings: (a) Self motivation, (b) Peer group participation, (c) Observance of school rules, and (d) Self concept (Appendix C). Initial ratings done at the time of the original special education evaluation were available for the four adjustment factors.Data Analysis
To address the changes in racial proportions over the period 1978-1983 a chi square analysis was performed utilizing frequencies of black and white students given special education classifications during those five years. The location of specific significant changes in minority frequencies was determined by inspection of the largest observed/expected differences.
Predictive validity of IQ vs. ELP scores was assessed by a series of correlations on the various dependent measures (Proc/Corr, SAS 1982). Comparisons of ELP and IQ correlations involved the use of a t test for significant

80
differences between dependent correlations. (Cohen & Cohen, 1975; Guilford & Fruchter, 1973).
The relative performance of groups classified consistent with IQ scores (IQ-Match), ELP scores (ELP-Match), or both scores (Both-Match) was assessed by a series of ANOVAs (Proc/Anova, SAS 1982) for each special education category.

RESULTSTable 4 lists the characteristics of the total special
education sample in turns of numbers, minority percentage, mean IQ, and mean reading and achievement scores for each category. Totals for the MIMR and MOMR categories represent all available file records. For the GT category, all available minority file records were used together with a random sample of white student files, since the actual minority percentage currently in that category is less than 10. With the exception of GT, all minority percentages closely approximate those historically found and currently in placement (Tables 5 and 6 ). All basic psychometric data was obtained from student records in files or on computer printouts, with the exception of teacher ratings obtained directly. (Table 3 lists the proportions of data available for the measures of interest, while Table 2 indicates the degree of compliance with requests for teacher ratings for each of the special education categories and for the total sample.) The particular levels in each category differed according to whether categories had only lower or upper and lower boundaries. Thus, there were two possible levels (Both-Match or ELP-Match) for match status in some cases and three levels (IQ-Match, ELP-Match, and Both-Match) for others.
The only other major SOMPA study involving a Louisiana population is that of Hansche (1982). Table 5 provides a comparison of the current sample with Hansche's sample in
81

82
Table 4Characteristics of Total Sample
Category N Minority % Mean IQbMeanReading*3
Mean.Math
MOMR 106 64 40 50 42MIMR 228 79 53 56 59SL 514 75 69 67 70LD 468 63 94 77 82NE 409 47 89 92 91GT 394 48 130 126 1 2 0
TOTAL 2 1 2 0 61 87 8 6 87
a. All percentages are consistent with previous andcurrent ratios for children in placement with the exception of the GT category, where all available minority cases were selected to provide an adequate sample size.
b. All scores (set to IQ metric of mean = 100 and £d = 15) are those recorded at initial evaluation.

83
Table 5Comparison of Current Findings
With Hansche (1982) Statewide SampleCurrent Study Hansche (1982)
Total SampleMinority Percentage 61 53Black Mean IQ/ELP 80/96 82/97
White Mean IQ/ELP 99/104 94/98
Mean Achievement (B) 81a 84Mean Achievement (W) 97a 92
Mean IQ By CategoryMOMR 40 54bMI MR 53 57bSL 69 69LD 94 93NE 89 82
Minority % By CategoryMOMR 64 63MIMR 79 93SL 75 75LD 63 40NE 47 51Note. All scores are standard scores (mean = 100, sd = 15)
unless otherwise noted.a 0 btained by combining means from the current study. Hansche's N less than 30.

84
terms of general characteristics, which suggests an overall similarity when sample sizes are sufficiently large. Specific comparisons will be noted as appropriate.Hypothesis I - Minority Percentage
Patterns of change in minority percentage for special education categories are depicted in Table 6 , which covers all special education classifications given during the
years 1978-83. A chi square analysis of the actual numbers of black and white students was significant for the SL (16.96, p < .005), LD (62.52, p < .001), Mo MR (13.03, p < .025), and GT (39.17, p < .001) categories, while M i M R results were non-significant. It had been predicted that there would be an increase in minority percentage for the SL, LD, GT and no increase for the M o M R and M i M R categories. The NE category was expected to reflect team decisions as to whether to rely on achievement scores and classify as LD vs denying special education services. Students were not maintained indefinitely on file if classified as NE, and a direct analysis of the "current" NE group and its composition was necessary (See Table 9 and later discussion).
The largest increases in the SL category occurred in the years 1979 and 1982. For the GT and LD categories, these two years also registered increases. MoMR percentages indicated an increase in 1979 followed by a gradual decline.
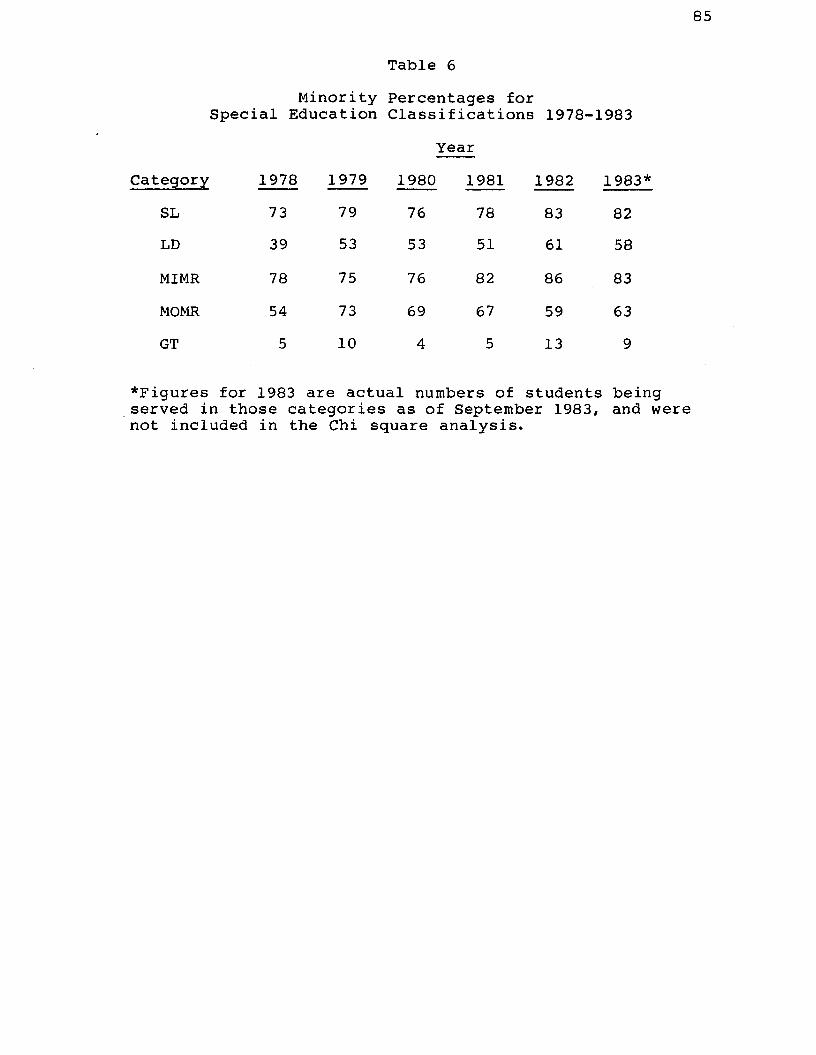
85
Minority Special Education
Category 1978 1979SL 73 79LD 39 53
MIMR 78 75MOMR 54 73GT 5 1 0
Table 6Percentages for Classifications 1978-1983
Year1980 1981 1982 1983*76 78 83 8253 51 61 5876 82 8 6 8369 67 59 634 5 13 9
♦Figures for 1983 are actual numbers of students being served in those categories as of September 1983, and were not included in the Chi square analysis.

86
Table 7 illustrates the percentage of classifications given for students referred for poor achievement and indicates a trend to describe proportionately more students as LD over the five-year span and a lesser trend over the last three years to classify proportionately fewer students as MiMR or MoMR, culminating with only eight percent for these categories in 1982. The increase in minority students as a percentage of the LD category (Table 6 ) suggests that a movement of minority students from lower categories (particularly MiMR) was taking place. Tables 8 and 9 shed further light on the constitution of the various categories.
1. M o M R . As Table 9 indicates, 37% of the students in the M o M R category have IQ scores in the severe (below 40) range. Another 12% were "untestable" and presumably in the severe range as well. Of a total 190 students with IQ scores in the M o M R range, only 28% remained in the M o M R category, with the remainder located in the MiMR category. Black students comprise 78% of the MoMR IQ students in the MiMR category.
2. M iMR. Examination of the MiMR category indicates that 60% of its students actually have IQ scores consistent with M o M R criteria (Table 9). A large number of M i M R students (by IQ) are located in the SL category, making up 37% of that category's total. A smaller number make up 9% of the LD category total. Of all students with IQs in the M i M R range, less than 28% are actually classified as such

Table 7Percentage Distribution Across LD, SL, MiMR, and MoMR Categories of Students Referred for Academic Problems
1978-1982
LD SL MiMR MoMr
1978 42 34 1 1 141979 46 32 13 9
1980 54 27 8 1 1
1981 50 29 1 2 91982 61 31 5 3

88
Table 8IQ "Movement" Between Special Education Categories
IQ Actual Number of % ActualClassification within Category Students CategorySevere MOMR 39 37MOMR MIMR 136 60MI MR SL 189 37MIMR LD 44 9MI MR NE 4 2
SL LD 1 1 1 24SL NE 36 16
Note. Percentages are based on number of students actually given the upper category classification.

89
Table 9IQ Percentages in Special Education Categories
(Total Samples)Category Title Total N Category of IQ % Total N
MOMR 106 Severe 37MOMR 51N.A. 12
MIMR 228 MOMR 60MIMR 38SL 2
SL 514 MOMR 6MIMR 37SL 37NE 10N.A. 10
LD 468 MIMR 9SL 2LD 67N.A. 20
NE 227 MIMR 4SL 16NE 70N.A. 10

90
in the Mi MR category. Black students with MiMR IQs number 157 in the SL category, but constitute only 63 of the students who remain in the MiMR category. Thus, more than twice as many black students with IQ scores in the M i M R range are found in the SL category than are classified as MiMR. A lesser number (44) of students classified as LD are black students with MiMR range IQ scores.
Considering all students who have IQ scores in the MiMR range (N = 323), 73% (N = 237) are found in categoriesother than MiMR. Black students make up 92% (N = 205) of this group.
3. SL. Thirty-seven percent (190) of the students classified as SL have IQ scores within that category range. The LD category contains 111 students with scores in the SL IQ range. An additional 36 such students are found in the NE category. Of a total of 337 students with SL IQ scores, 44% are located in other categories. Black students make up 85% of the "SL IQ" group in the LD category, and 83% of the same group in the NE category.
4. LD and NE . Approximately one third of the students in the LD category (Table 9) have IQ scores consistent with lower categories. A similar group constitutes approximately one fifth of the NE categories.
5. GT. A total of 43% of the GT category have IQ scores below 130. Of this group, 72% (122) are black students.

91
Table 8 illustrates a general pattern of migration (largely involving black students) upward through special education categories, with each upper category (by classification given) receiving a significant contribution from a lower category (by IQ score). The amounts of these contributions ranged from 2 0 to 60 percent, becoming smaller as category criterion levels neared the "not exceptional" range. Fewer than 20% of the NE category represented students who by IQ "should have" received a special education classification. Thirty of the 36 students who were SL by IQ score but classified as NE were black. All 4 students classified NE but with M i M R IQ scores were black.
The preceding results establish the amounts and directions of IQ movement from lower to upper categories. Table 10 indicates percentages of agreement with IQ or ELP scores for various categories. Substantial agreement for the upper categories suggests that ELP scores were being used to help justify placement of students whose IQ alone might suggest a lower category.Hypothesis II - IQ and ELP Prediction
Tables 11-14 list the results of correlations for black, white, and total groups on the various achievement and adjustment measures. For the total sample, both IQ and ELP scores account for more than 60% of the variance in reading and math scores. IQ correlations are significantly (p < .001) higher than ELP correlations on achievement

92
Table 10Category Agreement with ELP Scores v s . IQ Scores
% ELP or both % i q Only No Agreement or Category Agreement Agreement Not IndicatedMoMRa 9 91MiMR 47 1 2 41SLb 32 2 1 47LD 71 0 29NE 81 0 19GT 79 0 2 1
NE(G)c 78 2 0 2
a. ELP is not a factor in this category since ELP scores do not go below 60. IQ agreement, however, does indicate IQ = MoMR range and ELP = MiMR range.
b. A significant number of SL cases (48) were not given IQ tests due to recent assessment policy changes. This category also contained a large number of cases where both IQ and ELP were above and below the category range. Achievement scores seemed to be larger factors in this category.
c. NE(G) = referrals for gifted classes.
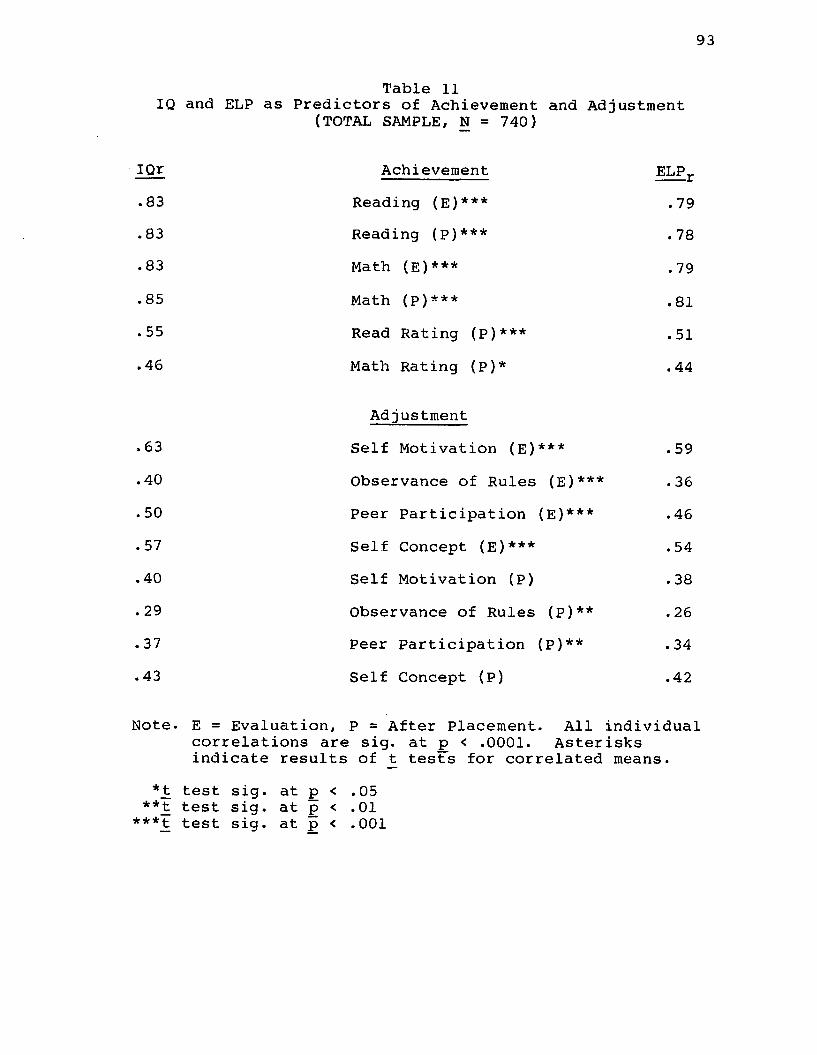
93
Table 11IQ and ELP as Predictors of Achievement and Adjustment
(TOTAL SAMPLE, N = 740)
IQr Achievement ELPr.83 Reading (E)*** .79.83 Reading (p)*** .78.83 Math (E)*** .79.85 Math (p)*** .81.55 Read Rating (p)*** . 5 1
•46 Math Rating (P)* .44
Adjustment.63 Self Motivation (E)*** .59•40 Observance of Rules (E)*** .36.50 Peer Participation (E)*** .46•57 Self Concept (E)*** .54.40 Self Motivation (P) .38•29 Observance of Rules (p)** .26.37 Peer Participation (P )* * .34•43 Self Concept (P) .42
Note. E = Evaluation, P = After Placement. All individual correlations are sig. at p < .0001. Asterisks indicate results of _t tests for correlated means.
*t test sig. at p < .05**jt test sig. at p < . 0 1
***t test sig. at p < . 0 0 1

94
IQELP
Table 12IQ v s . ELP Correlations for White Students R1 R2 Ml M2 RR MR.84 .84 .82 . 8 6 .44 .33.83 .83 .81 .85 .45 .34
IQELP
Motivationj
.64*
.62
OBS Rules-
.43*
.41
Peer Part-j
.49
.48
Self Conceptj .56 .55
Motivation* IQ .32ELP .32
OBS RULES. .27 .27
Peer Part. .32
.32
Self Concept0 .37 .32
Note. R = Reading Score, M = Math Score, RR = Reading Rating, MR = Math Rating, 1 = At Evaluation, 2 =After Placement. Analyses were t tests for dependent correlations, N = 304
kp < .001

95
Table 13IQ vs. ELP Correlations for Black Students
R1 R2 Ml M2 RR MRIQ .71*** .7 !*** .76*** .76*** .45 .44ELP .67 .67 .71 . 70 .43 .44
Motivation^ OBS Rules^ Peer Partj^ Self Concept^IQ .50*** . 2 2 .35* .46**ELP .46 . 2 1 .32 .42
Motivation^ OBS RULES -5 Peer Part^ Self Concept 9
IQ .37 . 2 0 .33 .39ELP . 35 . 18 .29 .37
Note R = Reading Score, M = Math Rating, MR = Math Rating, 1 = at
Score, RR = evaluation,
Reading 2 = after
placement. Analyses were t tests for dependent correlations, N = 436
*p < .05**p < . 0 1
***p < . 0 0 1

96
Table 14IQ vs. ELP Prediction of Achievement
and Adjustment by Race
Measure BIQ WIQ BELP WELPReading Score 1 .71 .84*** .67 .83***Reading Score 2 .71 .84*** .67 .83***Math Score 1 .76 .82* .71 .81***Math Score 1 .76 .86*** .70 .85***Reading Rating .45 .44 .43 .45Math Rating .44 .33* .44 .34Self Motivation 1 .50 . 64** .46 .62**Observance of Rules 1 .22 .43*** .21 .41**Peer Participation 1 .35 .49* . 32 .48**Self Concept 1 .46 .56* .42 .55*Self Motivation 2 .37 .32 . 35 .32Observance of Rules 2 .20 .27 .18 .27Peer Participation 2 .33 .32 .29 .32Self Concept 2 .39 .37 . 35 8 . 32
Note. B = Black, W = WhiteAnalysis by z test for independent correlations (Black vs. White).Asterisks indicate significant differences.
*p < .05**p < .01
***p < .001

97
scores, but the amounts are small (less than one percent of the variance for the greatest differences). Correlations are much lower for IQ/ELP and achievement ratings, and again there are slight but significant differences in favor of IQ scores. Predictive validity is no better for the various adjustment measures, but again IQ scores show consistently higher correlations.
Correlations prove equally high for concurrent (at evaluation) and predictive (after placement) relationships for achievement scores. However, IQ and ELP scores are generally better concurrent (mean £ = .53 for IQ, .49 for ELP) than predictive (mean £ = .37 for IQ, .35 for ELP measures as far as adjustment ratings are concerned. IQ and ELP scores are slightly more successful in predicting late motivation and self concept measures than on peer group participation and observance of rules.
For whites, IQ and ELP scores are almost identical in predictive accuracy across all measures (Table 12). The few significant differences are primarily artifacts of sample size, although IQ score correlations continue to be generally higher than those of ELP. The previously noted equivalence in terms of concurrent versus predictive accuracy for achievement measures but distinct superiority of concurrent measures for adjustment factors continues for the white subsample.
For blacks, (Table 13), IQ and ELP correlations tend to show more nearly the same patterns noted for the total

98
sample. IQ is a consistently better predictor than ELP across most measures. Accuracy again dropped slightly for adjustment factors on later versus current measures but was equivalent for achievement measures.
Table 14 indicates the results of comparisons on IQ and ELP correlations by race for dependent measures. Both IQ and ELP scores are better predictors for white than for black students. Black ELP scores are the poorest measures for the prediction of achievement scores. As a group, the same tends to be true for adjustment measures at evaluation. However, black IQ/ELP scores tend to be slightly (but not significantly) better than white scores on measures of self motivation and self concept after placement.
Both IQ and ELP scores show fairly strong predictive power for achievement scores (lowest r = .67) regardless of race. For whites, this power is nearly identical for IQ versus ELP. For blacks, IQ is a significantly better predictor than ELP but not by large amounts. Both measures are clearly better predictors for whites than for blacks. IQ/ELP prediction of teacher achievement ratings drops into a moderate range for both blacks and whites, and there is a slight superiority in IQ/ELP predictions for black students. Neither IQ nor ELP scores are good predictors for adjustment ratings, but prediction is clearly better on concurrent as opposed to later measures. There are no large black/white differences on the latter, but white
99
IQ/ELP scores tend to be stronger predictors of adjustment on concurrent measures.
The accuracy of ELP versus IQ prediction of achievement for black students is fairly close in this sample, but there is a considerable difference in the means for achievement as predicted by these scores. Table 15 indicates that, for the total sample, the means on reading and
math achievement are almost exactly predicted by IQ scores for both concurrent and predictive measures, while ELP scores overestimate those means by 12 to 13 points.
The major difference in current findings about IQ/ELP prediction of achievement and earlier studies involves the high correlations for black student ELP scores. Since IQ and ELP scores are nearly identical when SOMPA is used for whites, the finding of similar correlations for that group was expected. There are several factors involved in the current data that might explain why ELP seemed to predict so well for blacks. Table 16 indicates that in the current sample sociocultural scales used to generate ELP scores are much more highly correlated with IQ than was the case in the original SOMPA sample. ELP scores are basically IQ scores plus an adjustment factor based on sociocultural background. To the extent that these factors are correlated with IQ scores, they will tend to function as a constant, and their application to the IQ score will tend to be consistent. That is, relatively higher standing on sociocultural factors will tend to be correlated with

100
Table 15Differences Between IQ, ELP, and Achievement Means For
Total Sample and By Race
IQ ELP Read 1 Read 2 Math 1 Math 2B 80 96 80 76 81 79W 97 104 96 98 95 97T.S. 87 99 86 86 87 87
Note. Standard scores, mean = 100, sd = 15.1= At Evaluation, 2 = After Placement

101
Table 16Correlations of Sociocultural Scales with IQ for
Black Students - Current Study vs. Mercer's Original Group
F. Size F. Structure SES UACurrent (N=973) .25 .30*** .56*** .51***SOMPA (N=696) .20 .13 .25 .30
Note. F. = Family, SES = Socioeconomic Status, UA = UrbanAcculuration. Asterisks indicate z scores of 3.14 or greater. Mercer's group included regular education students (Mercer & Lewis, 1979, p. 130).
***p < .001

102
higher IQ scores in a more consistent fashion. This appears to be the case in the current sample. The differences in IQ, ELP, and achievement means (Table 15) suggest that in this sample ELP scores were basically adding a constant of nearly 16 points to the IQ scores of black students (SOMPA sample mean = 11.41). SOMPA adds relatively more points as sociocultural factors are lower. Table 17 indicates that three of those scale means are significantly lower for the current sample. In general, this should result in IQ/ELP similarity if the goal is prediction of the relative order on achievement based on the relative order on IQ or ELP. However, the data indicate that when group performance is to be predicted, the ELP score overestimates eventual achievement. It may be noted that the black IQ mean is as close as the white IQ mean in terms of predicting achievement. Use of the ELP score mean for blacks would equate the estimate of intellectual potential for the two races, but the results clearly show that achievement averages after placement do not follow this transformation.Hypothesis III - Student Performance
At the outset of this study it was assumed SOMPA could be an instrument applied to both blacks and whites, although it was clearly designed for blacks. Whether this was so, and whether there would be enough meaningful comparisons available for whites, depended on the data characteristics. In the original model for analysis, match

103
Table 17Means on Sociocultural Scales for Black Students
Current Study vs Mercer's Original Group
F . Size F . Structure SES UACurrent Sample
(N=973) 7.63 10.31 4.25 45.56Original Group
(N=696) 7.80 12.20 4.80*** 53.40***
Note. F = Family, SES = Socioeconomic Status, UA = Urban Acculturation. Asterisks indicate significant t tests for independent means (Smallest _t = 12.85) Mercer's samples were students in regular education (Mercer & Lewis, 1979, p. 130).

104
status (IQ-Match, ELP-Match, or Both) and race were included as the independent variables. However, examination of the sample characteristics revealed that the treatment of IQ and ELP scores for blacks and whites is considerably different. As Table 15 suggests, there were very little differences between white IQ and ELP means.This generally eliminated the possibility of an ELP-Match category for whites (ELP in the category, IQ below the category). It also tended to place most whites in a Both- Matched category, since an IQ match generally guaranteed an ELP match. In addition to these factors, SOMPA was simply not used (in terms of ELP) on large numbers of whites.Total N = 1018 for ELP scores available on blacks, while the white N = 558.
The combination of these factors essentially rendered black/white comparisons in terms of match status impossible. ELP, in general, played no significant part in the classification of white students that could be distinguished from the use of IQ scores. Following is a summary of the results for ANOVAs on black students by category (Tables 18-24).
1. M o M R . Although there are significant differences in reading and math scores favoring IQ-Match students, these are based on an extremely low N (<6) and thus unrepresentative. There are no significant differences on any other variables. In general, MoMR students simply did

105
Table 18Results of ANOVA on Match Categories for
Achievement and Adjustment Measures(MoMR Black Students)
MeasureReading 2Math 2
ReadingRatingMathRatingSelfConcept 2Observance of Rules 2
IQMatch69
67
4.50
4.50
3. 33
3.00
ELPMatch
PeerParticipation 2 3.33SelfMotivation 2 2.67
BothMatch2736
3.00
3.67
3.00
3.43
4.00
2. 71
F (if sig, 10.51, p < 19.61. p <
1.05.03
Note. 2 = After Placement. All Rating Scores from six -point scales, mean = 3.5
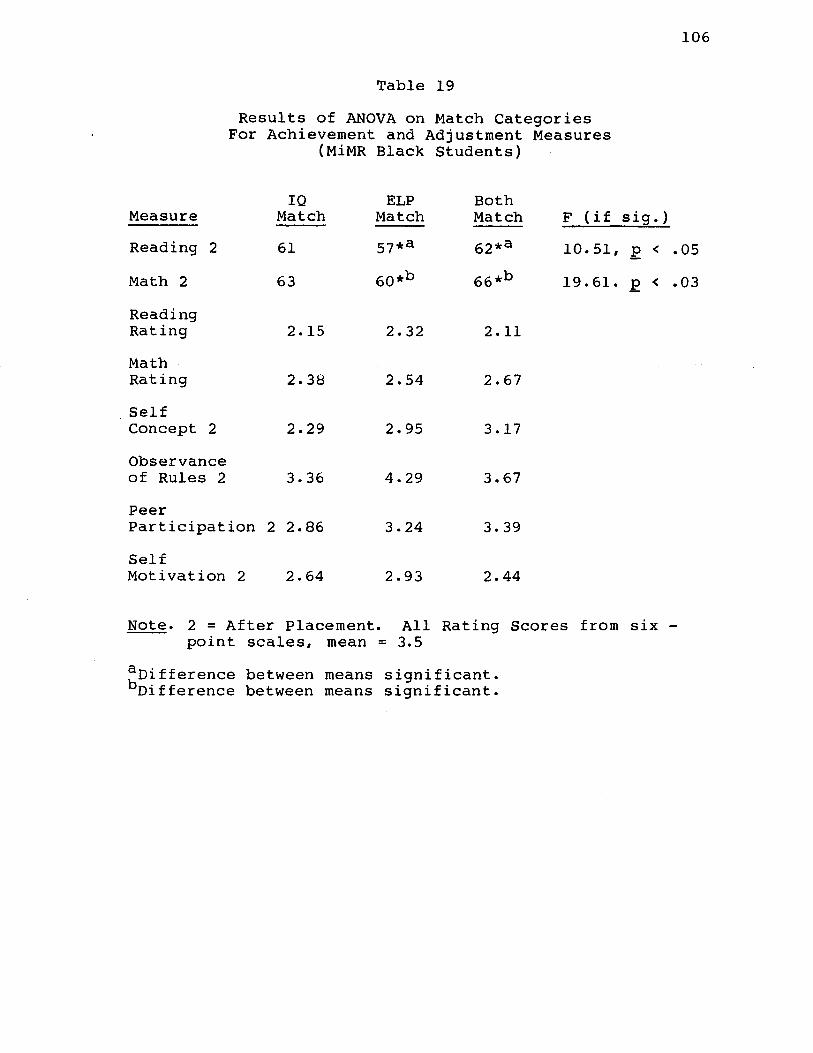
106
Table 19Results of ANOVA on Match Categories
For Achievement and Adjustment Measures(MiMR Black Students)
MeasureReading 2
Math 2Reading RatingMath RatingSelfConcept 2Observance of Rules 2PeerParticipation 2 2.86 3.24 3.39SelfMotivation 2 2.64 2.93 2.44
Note. 2 = After Placement. All Rating Scores from six - point scales, mean = 3.5
^Difference between means significant.Difference between means significant.
IQ ELP BothMatch Match Match F (if sig.)61 57*a 62*a 10.51, p < .0563 60*b 66*b 19.61. p < .03
2.15 2.32 2.11
2.38 2.54 2.67
2.29 2.95 3.17
3.36 4.29 3.67
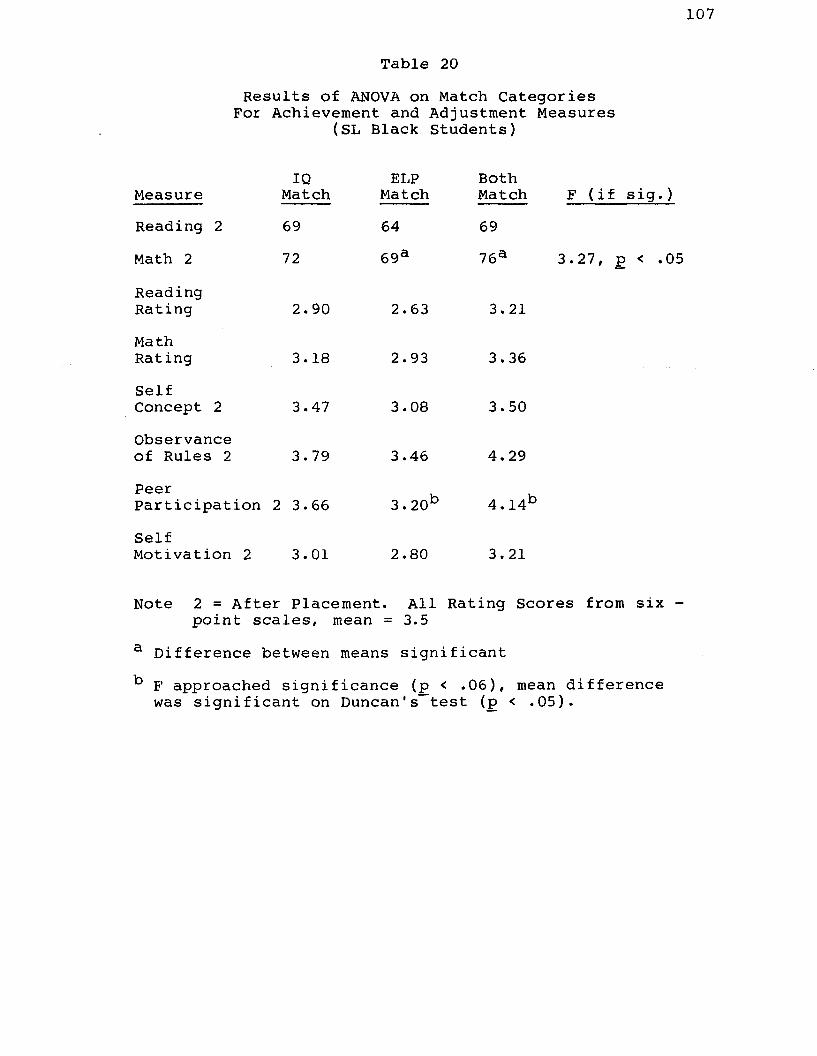
107
Table 20Results of ANOVA on Match Categories
For Achievement and Adjustment Measures(SL Black Students)
MeasureReading 2Math 2ReadingRatingMathRatingSelfConcept 2Observance of Rules 2
IQMatch6972
2.90
3.18
3.47
3.79PeerParticipation 2 3.66
ELPMatch6469a
2.63
2.93
3.08
3.46
BothMatch6976a
3. 21
3.36
3.50
4. 29
F (if sig.)
3.27, p < .05
3.20b 4.14bSelfMotivation 2 3.01 2.80 3.21
Note 2 = After Placement. All Rating Scores from six - point scales, mean = 3.5
a Difference between means significantb F approached significance (p < .06), mean difference
was significant on Duncan's test (p < .05).

108
Table 21Results of ANOVA on Match Categories
For Achievement and Adjustment Measures(LD Black Students)
MeasureReading 2
Math 2ReadingRatingMathRatingSelfConcept 2Observance of Rules 2PeerParticipation 2 SelfMotivation 2
IQMatch
ELPMatch7581
3.32
3.57
3.62
3.70
3.68
3.28
BothMatch7679
3.40
3.84
3. 71
3.97
4.10
3.72
F (if sig.]
6.03, p <
5.01, p <
.02
.03
Note. 2 = After Placement. All Rating Scores from six -point scales, mean = 3.5

109
Table 22Results of ANOVA on Match Categories
For Achievement and Adjustment Measures(NE Black Students)
MeasureReading 2Math 2ReadingRatingMathRatingSelfConcept 2Observance of Rules 2PeerParticipation 2 SelfMotivation 2
IQMatch
ELPMatch8480
2.78
3.00
3.17
3.08
3.67
2.67
BothMatch9192
3.60
3.73
3.53
3.76
3.71
3.53
F (if sig.
13.20, p <
)
.001
Note. 2 = After Placement. All Rating Scores from six -point scales, mean = 3.5
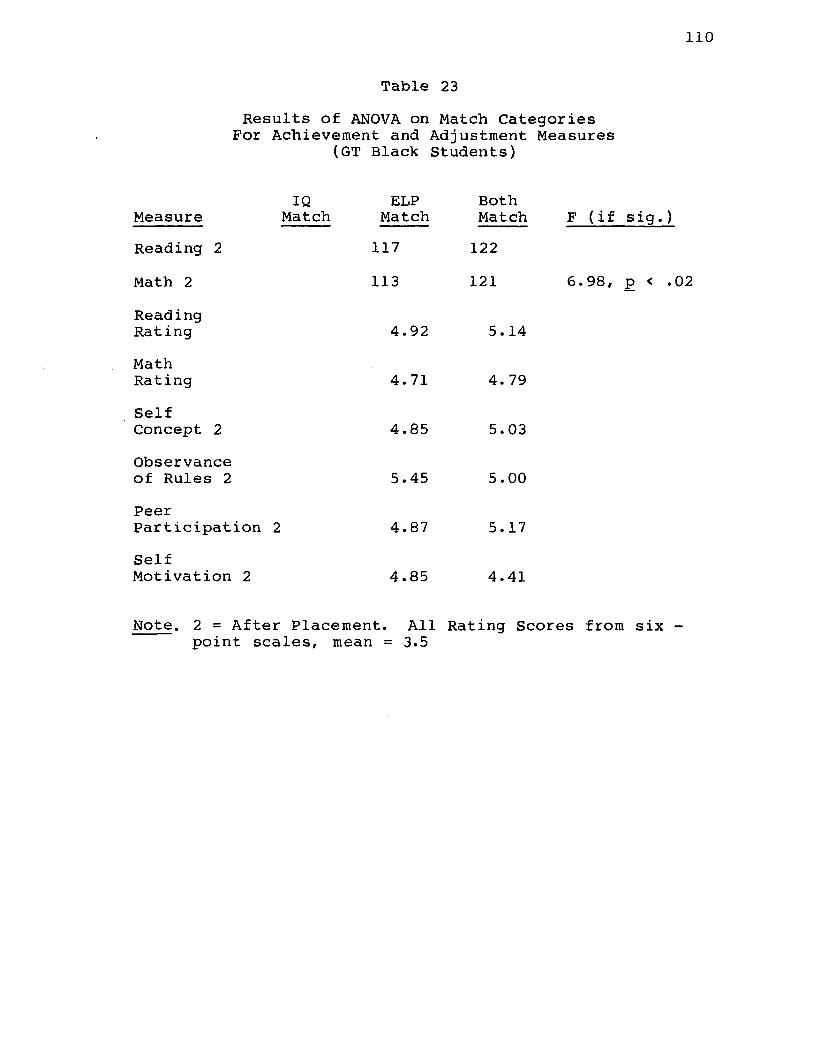
110
Table 23Results of ANOVA on Match Categories
For Achievement and Adjustment Measures(GT Black Students)
MeasureReading 2
Math 2ReadingRatingMathRatingSelfConcept 2Observance of Rules 2PeerParticipation 2 SelfMotivation 2
IQMatch
ELPMatch117
113
4.92
4.71
4.85
5.45
4.87
4.85
BothMatch122121
5.14
4. 79
5.03
5.00
5.17
4.41
F (if sig,
6.98, p <
)
.02
Note. 2 = After Placement. All Rating Scores from six -point scales, mean = 3.5

Ill
Table 24Results of ANOVA on Match Categories
For Achievement and Adjustment Measures(NE Black Students Referred for Gifted Classes)
IQ ELP BothMeasure Match Match Match F (if sig.)Reading 2 110 115Math 2 109 109
ReadingRating 5.25 5.07MathRating 5.17 4.89SelfConcept 2 5.17 4.89Observanceof Rules 2 4.75 4.89PeerParticipation 2 5.08 4.93SelfMotivation 2 4.75 4.89
Note. 2 = After Placement. All Rating Scores from six -point scales, mean = 3.5
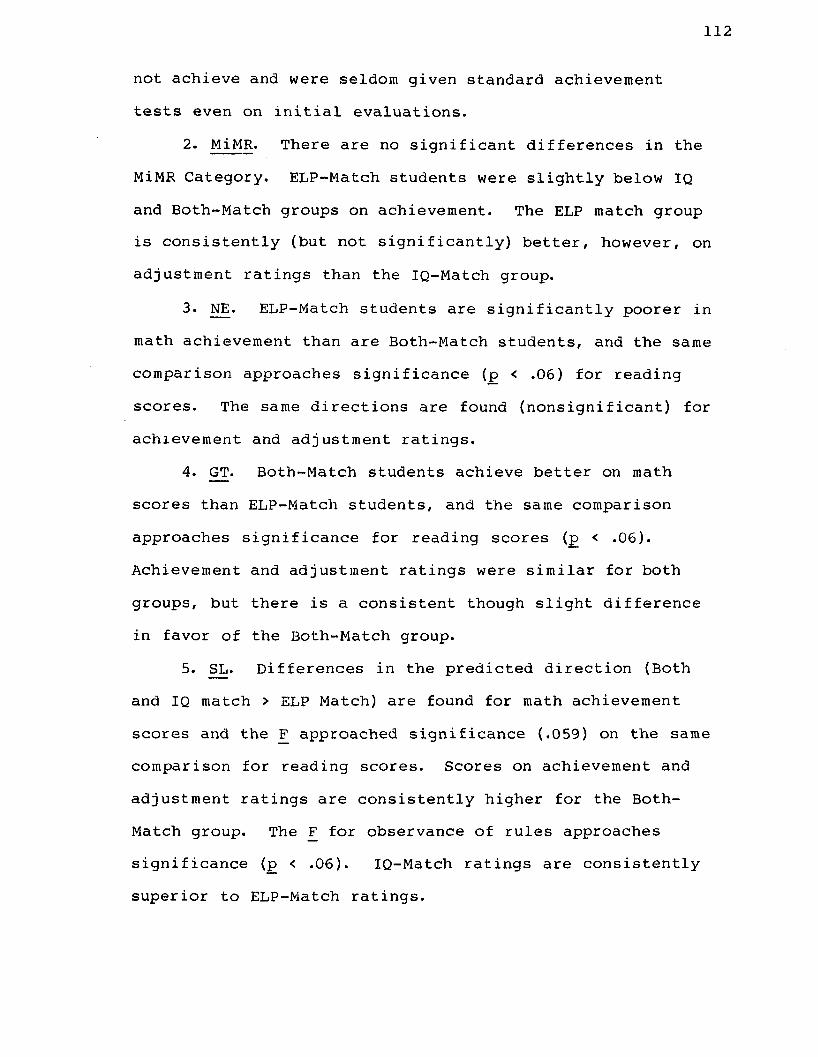
112
not achieve and were seldom given standard achievement tests even on initial evaluations.
2. MiMR. There are no significant differences in the MiMR Category. ELP-Match students were slightly below IQ and Both-Match groups on achievement. The ELP match group is consistently (but not significantly) better, however, on adjustment ratings than the IQ-Match group.
3. NE. ELP-Match students are significantly poorer in math achievement than are Both-Match students, and the same comparison approaches significance (p < .06) for reading scores. The same directions are found (nonsignificant) for achievement and adjustment ratings.
4. GT. Both-Match students achieve better on math scores than ELP-Match students, and the same comparison approaches significance for reading scores (p < .06). Achievement and adjustment ratings were similar for both groups, but there is a consistent though slight difference in favor of the Both-Match group.
5. SL. Differences in the predicted direction (Both and IQ match > ELP Match) are found for math achievement scores and the F approached significance (.059) on the same comparison for reading scores. Scores on achievement and adjustment ratings are consistently higher for the Both- Match group. The F for observance of rules approaches significance (p < .06). IQ-Match ratings are consistently superior to ELP-Match ratings.

113
6. LD. No significance was found on achievement measures. On achievement and adjustment ratings, the Both- Match group was consistently higher, with the differences reaching significance for peer participation and self motivation .
7. NE (Referred for gifted). No comparisons were significant for this group, with IQ and Both-Match groups generally quite similar.
DISCUSSIONThe introduction to this study framed three major
questions about the possible utility of SOMPA: (a) as aninstrument to lower percentages of minority students in special education, particularly in mildly retarded categories; (b) as a predictor of achievement, and (c) as atool to aid in locating more appropriate special education
placements. Discussion of the results will follow the same order .Percentage of Minority Students
As noted earlier (Larry P. v. Riles, 1972), a commoncourt finding and factor in decisions about special education assessment practices (Mercer, 1979; Talley, 1981) has been a philosophy of reducing the minority percentage in classes for mildly retarded students and in special education generally. The usual standard advocated has been a goal of minority percentage equal to the minority percentage in the general school population.
The current minority enrollment in East Baton Rouge Parish schools is slightly more than 50% of the total population, and the same percentage applies to special education as a whole. However, the latter figure includes gifted students. If only "problem" categories are considered the black proportion becomes 62%. Black students make up 83% of the MiMR category and a similar percentage of the SL category. These figures have remained essentially unchanged throughout the period 1978-83. Minority
114
115
student percentage has clearly been unaffected by use of SOMPA.
When actual numbers of students are considered, h owever, there have been significant changes in students who formerly (by IQ) would have been classified as MiMR. The majority of these students were classified into other cate
gories, primarily SL and LD. Thus, very few students with MiMR IQ scores were classified as nonexceptional and denied services, but large numbers were transferred to less controversial categories. Similar patterns obtained for all categories, as there was a consistent migration from lower to upper categories until a choice between LD and NE remained. At that point, it appears that there was a tendency to prefer giving access to services rather than avoiding a label. (Anecdotally, reference was often made in NE classifications to the fact that the assessment team was aware of a student's academic deficits and recognized a need for further assistance.)
Figures for the five year period 1978-83 indicate a large increase in the minority percentage for the LD category, which has sometimes been contrasted with SL and MiMR categories as a "segregated" category in special education. The same is true for the GT category, which also registered a slight increase. In these instances there is evidence of changes consistent with advocacy of "fairer" minority percentages .

116
Analysis of IQ and ELP "match" status by category (Table 10) suggests that the use of SOMPA did play an important role in the classification changes observed, since black students were most affected by SOMPA and comprised the majority of those who "migrated" to other categories. The two other variables (achievement and adaptive behavior) which might have affected classification decisions do not show strong evidence that this was the case.
Black students in SL and LD categories had achievement means consistent with lower categories (See Table 25). Adaptive behavior measures were primarily used in the MiMR, MoMR and to some degree the SL categories. Mean scores on these measures were the prescribed number of standard deviations below the average score appropriate to their "achievement" as opposed to actual category. Thus, there is little evidence that achievement or adaptive behavior scores contributed greatly to the migration from lower to upper categories.
In summary, the major effect of SOMPA ELP scores appeared to be in aiding reclassification of students who would have been called mildly retarded by IQ and shifting them to other categories. This did not result in reducing minority percentage in the MiMR and SL categories, but did result in increases for minority percentage in the LD category, which would be highly desirable in view of recent court decisions. Assessment teams appeared to stop short

117
Table 25Achievement Means for Categories
by Race and IQ Range
NormalBlack White Category
Category Reading Math Reading Math IQ RangeMoMR 41 43 43 41 40-55MiMR 58 61 61 65 55-70SL 65 69 74 74 70-78LD 75 79 82 85 85+NE 88 85 92 91 78+GT 119 116 125 123 130+
Note. IQ correlation with achievement scores for both races is very high and mean performances for groups on achievement tests were almost perfectly predicted. All scores on scale of mean = 100, sd = 15.
118
of excluding students with M i M R IQ scores from special education services, using low achievement scores (for which there was no "ELP" equivalent) to justify placement in other categories. The school system could certainly point to large reductions in numbers of students classified as mildly retarded in response to charges of disproportionate placement.
Additionally, Reschly (1981) has pointed out that misleading percentages have been used in court cases complaining of disproportionate minority percentages, with a simplistic reliance on minority percentage in MR categories vs. minority percentage in the school population. He indicated that a more appropriate ratio would involve total black students in MR categories vs. students in the system; to be compared to the same ratio for white students. For example, the figure of 83% for black students in the M i M R category appears to be quite large. However, the p e r c e n tage for numbers of black students in M i M R (244) divided by number of black students in the system (27660) is .009. The same ratio for white students is .002. These figures are dramatically less than the usual reported MR incidence of two to three percent (Patrick & Reschly, 1982).
A second type of comparison restricted to students in the special education categories studied indicates more disporportionate numbers. Black MiMR students make up six percent of all black students in the special education classes studied, while the figure is three percent for

119
white students. Thus, critics could still point to the odds for finding black students placed in MiMR categories as being twice as great as for white students.Prediction of Achievement
Previous studies (Oakland & Feigenbaum, 1979; Reschly, 1979) have found IQ to be superior to ELP in predicting achievement. Results of the present study exhibit a simi
lar pattern, but the differences are not as great. For whites, IQ and ELP are essentially equal as predictors, as would be expected since IQ/ELP differences for whites are small. For blacks, IQ is superior to ELP but not to a great extent. For both races in the current study, ELP is much more strongly correlated with achievement than in previous studies. The explanation for this findings appears to lie in ELP scores functioning as "IQ plus a constant", as implied by very high correlations but a large difference in means predicted by IQ and ELP. The correlations for sociocultural scales with IQ are much higher than those noted in the original SOMPA sample, and IQ and ELP are highly correlated with each other in the current study. The number of points "added" by ELP would be more consistent with IQ and thus achievement than was the case for the original SOMPA sample. As Mercer (1979) implied, the success of ELP scores as predictors of achievement depends on how much they differ from IQ scores. The more inconsistent the relationship between IQ and ELP the more likely the ELP will fail to predict achievement well.
120
Mercer (1979) appeared to consider this a "given" but she did not accept a definition of validity that allowed direct comparison of these scores.
Results from the current study do not indicate a reason to prefer ELP scores as predictors of achievement, since IQ scores yield equal or higher correlations for both races. ELP scores predict a higher mean performance that does not occur, and this relationship is much more pronounced for black students. Therefore, the use of ELP scores is no guarantee of better achievement performance.
A second type of achievement measure, teacher ratings, was used as an alternative dependent variable. Such ratings are probably intermediate between grades and achievement scores in terms of popularity among researchers. Correlations involving IQ/ELP scores and ratings were in a more moderate range (generally .40 to .45). Such correlations are fairly typical in the literature, and probably reflect their status as less global than grades but less specific than test scores. In view of the low correlations, there were no clearcut indications in terms of IQ versus ELP superiority that would offer any practical utility.
Adjustment ratings constituted the third independent measure. It was not anticipated that correlations with these measures would be substantial. IQ/ELP correlations with adjustment at the time of evaluation were in the same moderate range noted for achievement ratings, but those for
121
adjustment after placement were lower. Again, there were no clearcut indications of superiority on IQ versus ELP or black vs white comparisons, except that correlations for whites on adjustment at evaluation were somewhat higher than those for blacks.Student Performance
B'or all categories together, there is a general trend
favoring the original predictions of better achievement for IQ or Both-Match groups as compared to ELP-Match groups. Significant or near significant findings occurred in the SL, NE, and GT groups. Nonsignificant results were highly consistent in favoring the same general comparisons.Reading and Math ratings probably had too little variablity to serve as good measures (note previously stated low correlations with IQ/ELP). However, the same overall pattern of lower ELP-Match scores occurred with adjustment ratings.
The most consistent and greatest pattern of differences occurred in the NE group, with fairly distinct differences in groups excluded from special education.This would generally be the main focus of concern for possible negative effects of ELP scores which might deny special education services.
Achievement was generally not an issue for MoMR and MiMR categories, since these were primarily students with MoMR or below IQs who did not achieve and generally were not tested.
122
As noted earlier for correlation results, examination of student performance fails to show an increase in student achievement for ELP Match groups relative to their "new" categories, and thus little realization of the predicted potential. Adjustment rating results suggested that ELP- Match groups probably adjusted less well to their cate
gories than peers who "belonged" in the same groups.In summary, some basic findings noted in previous
research are replicated in the present study: (a) IQ astrong predictor of achievement scores, (b) IQ more accurate in such prediction than ELP, and (c) teacher ratings on achievement/adjustment prove to be less satisfactory as dependent measures. The more unusual finding of high correlations for ELP/Achievement is felt to be due to ELP's very close relationship to IQ scores in this sample. The current sample indicates significant differences on sociocultural factors (a poorer population) and their correlation with IQ than does Mercer's California sample. This finding is compatible with Patrick and Reschly's findings in 1982 that MR labels (and thus IQ scores) tend to be related to socioeconomic factors.Efficacy of Special Education
Mercer (1979) and others have based many criticisms on an assumption that special education has a negative impact on minority students, if not students in general. Data from the current study suggests that this may well depend on the quality of the particular special education system.
123
Achievement means for special education students, based on standard scores for age peers, indicated that students generally maintained their achievement standing while in special education classes (Table 15), but their adjustment was significantly better (Table 26). These findings are similar to those noted in previous studies (Goldstein et al, 1965; Gottlieb & Davis, 1973) and are not consistent with the "deadend street" view of the Larry P. decision. Implications for Further Research
The current study generally supports findings of earlier SOMPA research (Oakland, 1979; Reschly, 1978;Hansche, 1982). Table 5 indicates the comparison of data from East Baton Rouge Parish with that found in Hansche's study of several other school systems and suggests that the use and impact of SOMPA may be similar statewide. East Baton Rouge Parish data, however, may represent the closest adherence to ELP use requirements, and as such would prove ideal for the application of Hansche's (1982) computer model to assess accuracy of classification decisions based on IQ, ELP, and actual clinician models.
Issues specific to SOMPA itself would include the comparison of sociocultural norms from the Louisiana sample to those reported in California (Mercer, 1979), Arizona (Reschly, 1978), and Texas (Oakland, 1979) to determine the degree of generalization possible from the original norm group. New regression equations could be developed and compared to those obtained by Mercer. Finally, students
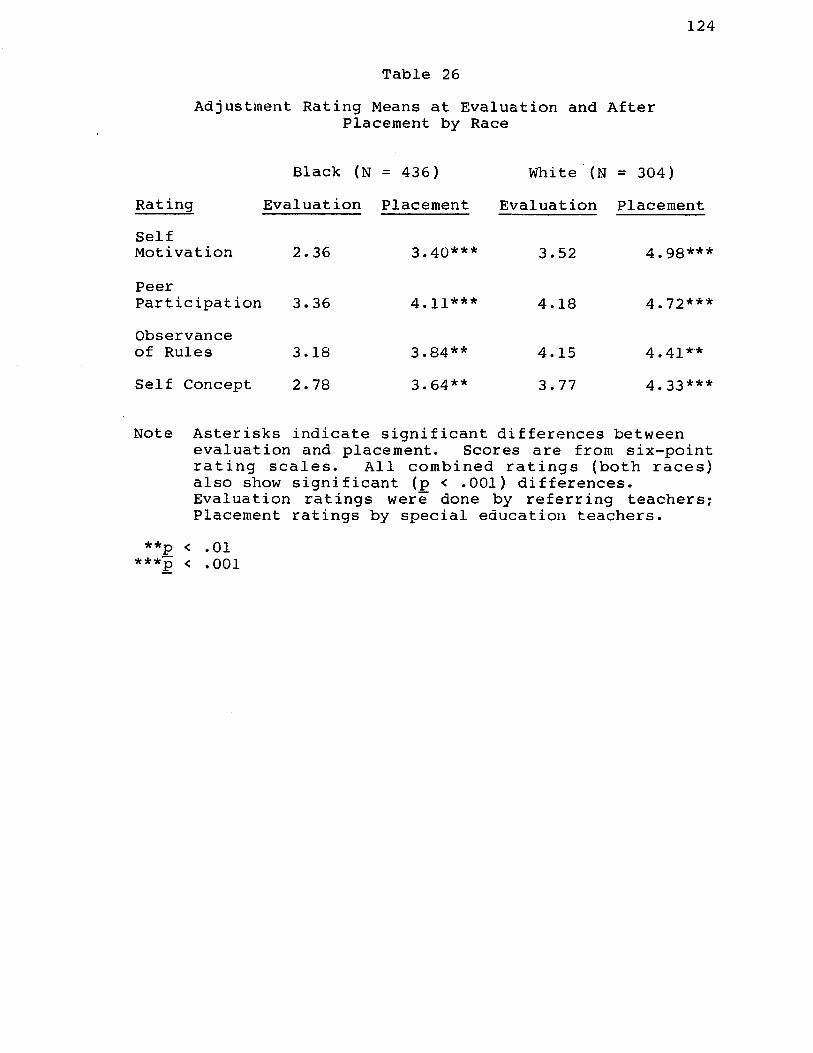
124
Table 26Adjustment Rating Means at Evaluation and After
Placement by Race
Black (N = 436) White (N = 304)Rating Evaluation Placement Evaluation PlacementSelfMotivation 2.36 3.40*** 3.52 4.98***PeerParticipation 3.36 4.11*** 4.18 4.72***Observanceof Rules 3.18 3.84** 4.15 4.41**Self Concept 2.78 3.64** 3.77 4.33***
Note Asterisks indicate significant differences betweenevaluation and placement. Scores are from six-point rating scales. All combined ratings (both races) also show significant (p < .001) differences. Evaluation ratings were done by referring teachers; Placement ratings by special education teachers.
**p < .01***p < .001

125
having certain IQ and ELP ratios could be compared in terms of achievement prediction according to the amount of the IQ/ELP discrepancy.Recent Changes and Future Trends
The adoption of SOMPA ELP score requirements in Louisiana occurred in 1978 and ended in 1981 with a revision of assessment handbook Bulletin 1508. Use of ELP
scores was made optional but collection of data on sociocultural background factors was still required. At the same time, criteria for special education categories were tightened so that more severe levels of academic deficit were necessary to qualify for services. This trend was reinforced further in 1983, when standards were again revised to eliminate the category of Slow Learner. These changes reflect a philosophical movement in special education that holds regular education responsible for a broader range of student ability. Examination of student files from 1982 suggests that assessment practices were becoming consistent with this trend. Many SL cases from 1982 were not given IQ tests at all, but relied strictly on adaptive behavior and educational data, suggesting adherence to the practice advocated by Mercer (1979) of refusing to classify students as retarded who were not at severe deficit levels on both IQ and adaptive behavior. In these instances it appeared that adaptive behavior served as a screening device to determine whether IQ tests were necessary, when the reverse was true for earlier assessment practices. A
126
general trend to move away from IQ scores altogether was evident when the 1981 criteria for the Slow Learner category made no reference to IQ. As criteria currently stand, a black student up for consideration as possibly mildly retarded would probably first be given an adaptive behavior measure, next an IQ test with an option to use ELP, and finally would have to have uniformly severe deficiencies in
all academic areas to quality as MiMR.The changes noted are also in parallel with the idea
of generic special education in which no distinctions are made as to the "cause" for the condition (SL vs. LD vs. MiMr), but students are grouped according to academic functioning levels. Students at "mild" levels are served in a combination of regular and resource classes, while students at moderate to severe levels tend to be placed in self-contained settings.
Many of the above changes were made in assessment policy and criteria and are the most simple and direct ways to "solve" the problem of "disproportionate" minority numbers in either MiMR categories or special education generally. The present study indicates that ELP scores could have been but were not used to exclude students from special education. Rather, ELP scores aided in reclassifying students to other, less pejorative categories than MiMR.

127
There is currently an increasing emphasis on accountability in regular education and the introduction of pupil progression plans which require remediation in the regular system as well as retention if students fail in academic subjects. Thus, more of the responsibility to deal with poor achievement is passing to the regular school systems, while special education criteria have nearly defined the "mildly retarded" or indeed any mildly handicapped population out of existence. Current standards also require extensive screening and intervention programs before an "evaluation" is done (Bulletin 1508, 1983 revision).
SOMPA's history in Louisiana has been extremely controversial and subject to many objections as to the validity, meaningfulness, or utility of the ELP score.Since special education departments in Louisiana are now taking the direct actions mentioned above to limit the intake of mildly deficient students, SOMPA would appear to be unnecessary as a current or future mechanism for accomplishing these goals. It appears that there is growing acceptance of the observations by Cronbach (1975) and Flaugher (1978) that dealing with the mildly handicapped is a social and educational policy issue that cannot be solved by designing the ultimately "fair" test.

REFERENCESAnastasi, A. Psychological testing (4th ed.) New York:
Macmillan, 1976.Bersoff, D. N. Testing and the law. American Psychologist,
1981, 36, 1047-1056.Binet, A. & Simon, T. Methods nouvelles pour le diagnostic
du niveau intellectual des anormaux. L'Annee
Psychologique, 1905, 1_1, 191-244.Brown v. Board of Education of Topeka, 347 U.S. 483, 493,
1954.Brown, F. The SOMPA: A system of measuring potential
abilities? School Psychology Digest, 1979, 8, 37-46.Bureau of Education for the Handicapped. Better Education
for the Handicapped. Annual Reports FY 1968 and FY 1969. Washington, D.C.: Author.
Carrol, J. B. & Horn, J. L. On the scientific basis ofability testing. American Psychologist, 1981, 36, 1012- 1020.
Cattell, R. B. A culture-free intelligence test, part I. Journal of Educational Psychology, 1940, 3_1, 161-179.
Cattell, R. B. Theory of fluid and crystallizedintelligence: A critical experiment. Journal of Educational Psychology, 1963, 54, 1-22.
Cleary, T. A. Test bias: Prediction of grades of Negro and white students in integrated colleges. Journal of Educational Measurement, 1968, 5, 115-124.
128

129
Cleary, T. A., Humphreys, L. G., Kendrick, S. A., & Wesman,A. Educational uses of tests with disadvantaged students. American Psychologist, 1975, 30, 15-41.
Cohen, J. & Cohen, P. Applied multiple regression/ correlation analysis for the behavioral sciences. Hillsdale, New Jersey: Lawrence Erlbaum Associates,1975.
Cole, N. S. Bias in testing. American Psychologist, 1981, 36, 1067-1077.
Cronbach, L. J. Essentials of psychological testing (3rd ed.) New York: Harper & Row, 1970.
Cronbach, L. J. Five decades of public controversy over mental testing. American Psychologist, 1975, 30, 1-14.
Darlington, R. B. Another look at "cultural fairness." Journal of Educational Measurement, 1971, 8, 71-82.
Diana v. California State Board of Education. UnitedStates District Court; Northern District of California (consent decree) 1970.
Doll, E. E. A historical survey of research and management of mental retardation in the United States. In E. P. Trapp & P. Himelstein (Eds.) Readings on the Exceptional Child. New York: Appleton-Century-Crofts.
Dunn, L. M. Special education for the mildly retarded: Is much of it justified? Journal of Exceptional Children, 1968, 35, 5-24.

130
Eells, K., Davis, H., Havighurst, R. J., Herrick, R. fie Cronbach, L. J. Intelligence and cultural differences. Chicago: University of Chicago Press, 1951.
Elkind, D. Piagetian and psychometric concepts ofintelligence. Harvard Educational Review, 1969, 39, 319-337.
Farber, B. Mental retardation: Its social context and
social consequences. Boston: Houghton-Mifflin, 1968.Flaugher, R. L. The many definitions of test bias.
American Psychologist, 1978, 3_3' 671-679.Goddard, H. H. The Kallikak family. New York: MacMillan,
1912.Goldberg, I. I. Trainable but noneducable, a debate with W.
M. Cruickshank. National Education Association Journal, 1958, £7, 622-623.
Goldman, R. D. & Hartig, L. K. The WISC may be a valid predictor of school performance for primary-grade minority children. American Journal of Mental Deficiency, 1976, 80, 583-587.
Goodman, J. F. Is tissue the issue? School Psychology Digest, 1979, 8, 47-62.
Green, B. F. In defense of measurement. American Psychologist, 1978, 3_3, 664-670.
Grossman, H. (ed.) Manual on Terminology and Classification in Mental Retardation. Washington, D.C.: American Association of Mental Deficiency, 1973.
131
Grossman, H. (Ed.) Manual on terminology and classification in mental retardation. Washington, D.C.: American Association of Mental Deficiency, 1977.
Guilford, J. P. The structure of intellect. Psychological Bulletin, 1956, 53, 267-293.
Guilford, J. P. & Fruchter, B. Fundamental statistics in
psychology and education. New York: McGraw-Hill, Inc., 1973.
Gutkin, T. B. & Reynolds, C. R. Factorial similarity of the WISC-R for White and Black children from the standardization sample. Journal of Educational Psychology, 1981, 73, 227-231.
Hale, R. L. The WISC-R as a predictor of WRAT performance. Psychology in the Schools, 1978, h5, 172-175.
Hansche, J. Evaluation of the descriptive validity of special education classification in Louisiana: A discriminant analysis of pupil appraisal records. Unpublished doctoral dissertation, Louisiana State University, 1982.
Heber, R. A. A manual on terminology and classification in mental retardation (2nd ed.). American Journal of Mental Deficiency, 1961, 6 4 .
Hobson v. Hansen, 269F, Supp. 401 (D.D.C.) 1967.Hunter, J. E. & Schmidt, F. L. Critical analysis of the
statistical and ethical implications of various definitions of test bias. Psychological Bulletin, 1976, 83, 1053-1071.

132
Jensen, A. R. Test bias and construct validity. Phi Delta Kappan, 1976, _58, 340-346.
Jensen, A. R. An examination of culture bias in theWonderlic Personnel Test. Intelligence, 1977, 1, 51-64.
Jensen, A. R. Bias in mental testing. New York: The Free Press, 1980.
Kanner, L. Medicine in the history of mental retardation:
1800-1965. American Journal of Mental Deficiency, 1967, 72, 165-170.
Kamin, L. J. The science and politics of IQ. New York: Halstead Press, 1974.
Kaufman, A. S. Factor analysis of the WISC-R at 11 age levels between 6 1/2 and 16 1/2 years. Journal of Clinical and Consulting Psychology, 1975, 43>, 135-147.
Kaufman, A. S. Intelligent testing with the WISC-R. New York: Wiley Interscience, 1979.
Lambert, N. M. Psychological evidence in Larry P. v. Wilson Riles. An evaluation by a witness for the defense. American Psychologist, 1981, 36, 937-952.
Larry P. v. Riles. 343 R. Supp. 1306 (N.D. Calif. 1972).Larry P. et al v. Wilson Riles et al. U.S. District Court,
N.D., Calif., Case No. C-71-2270 RFP, 1974, 1979.Leinhardt, G., Seewald, A. & Zigmond, N. Sex and race
differences in LD classrooms. Journal of Educational Psychology, 1982, 74, 835-843.
MacMillan, D. L. Mental retardation in school and society. Boston: Little, Brown, 1982.

133
Mercer, J. R. Labeling the mentally retarded. Berkeley: University of California Press, 1973.
Mercer, J. In defense of racially and culturallynondiscriminatory assessment. School Psychology Digest, 1979, 8, 89-115.
Mercer, J. & Lewis, J. SOMPA technical manual. New York:The Psychological Corporation, 1979.
Mills v. Board of Education, 348 F. Supp. 866 (D.D.C.1972).
Oakland, T. Research on the Adaptive Behavior Inventory for Children and the estimated learning potential. School Psychology Digest, 1979, 8, 63-70.
Oakland, T., & Feigenbaum, D. Multiple sources of test bias on the WISC-R and the Bender Gestalt. Journal of Clinical and Consulting Psychology, 1979, 47_, 968-974.
Office of Mental Retardation Coordination. MentalRetardation Activities of the Department of Health, Education, and Welfare. DHEW Publication No. 05-72-27, 1972.
Olmedo, E. L. Acculturation: A psychometric perspective. American Psychologist, 1979, 11_, 1061-1070.
PASE v. Hannon. 506 F. Supp. 831 (N.D. 111. 1980).Patrick, J. L. & Reschly, D. J. Relationship of state
educational criteria and demograhic variables to school- system prevalence of mental retardation. American Journal of Mental Deficiency, 1982, 86, 351-360.
134
Public Law 94-142. The Education for All Handicapped Children A c t . November 29, 1975.
Raven, J. C. Progressive Matrices; A perceptual test of intelligence: Individual form. London; H. K. Lewis,1938.
Reschly, D. J. WISC-R factor structures among Anglos,
Blacks, Chicano, and Native American Papagos. Journal of Clinical and Consulting Psychology, 1978, 46, 417- 422.
Reschly, D. J. Psychological testing in educationalclassification and placement. American Psychologist, 1981, 36, 1094-1102.
Reschly, D. J. & Phye, G. D. School Psychology;Perspectives and Issues. New York: Academic Press, 1979.
Reschly, D. J. & Reschly, J. Validity of WISC-R factorscores in predicting achievement and attention for four sociocultural groups. Journal of School Psychology, 1979, U_, 355-361.
Reschly, D. J. & Sabers, D. L. Analysis of test bias in four groups with the regression definition. Journal of Educational Measurement, 1979, _16, 1-9.
Reynolds, C. R. Differential construct validity of a preschool battery for Blacks, Whites, males, and females. Journal of School Psychology, 1980, 18, 112- 125.
Reynolds, C. R. The problem of bias in psychological assessment. In C. R. Reynolds, & T. B. Gutkin,
135
(Eds.) The Handbook of School Psychology (pp. 178- 209). New York: John Wiley and Sons, 1982.
Reynolds, C. R. & Hartlage, L. C. Comparison of WISC and WISC-R regression lines for academic prediction with Black and White referred children. Journal of Clinical and Consulting Psychology, 1979, 4_7, 589-591.
Reynolds, M. C. A framework for considering some issues in special education. Exceptional Children, 1962, 28, 367-370.
Robinson, H. B. & Robinson, N. M. The mentally retarded child: A psychological approach. (2nd ed.) New York: McGraw-Hill, 1976.
Sandoval, J. The WISC-R and internal evidence of test bias with minority groups. Journal of Clinical and Consulting Psychology, 1979, 4 7, 919-922.
Sandoval, J. & Miille, M. Accuracy of judgements of WISC-R item difficulty for minority groups. Journal of Consulting and Clinical Psychology, 1980, 48, 249-253.
Sattler, J. M. & Gwynne, J. White examiners generally do not impede the intelligence of black children: To debunk a myth. Journal of Clinical and Consulting Psychology, 1982, 50, 196-208.
Spearman, C. E. The abilities of man. New York: MacMillan, 1927.
State of Louisiana, Department of Education. Pupil Appraisal Handbook, Bulletin 1508, 1978.
State of Louisiana, Department of Education.

136
Nondiscriminatory Intellectual Assessment Procedures, 1978.
Talley, R. C. Evaluating the effects of implementing the SOMPA: A qualitative perspective. School Psychology Digest, 1979, 8, 71-78.
Terman, L. M. Feeble-minded children in the public schools of California. School and Society, 1917, 5, 161-165.
Terman, L. M. & Merrill, M. A. Measuring intelligence.Boston: Houghton-Mifflin, 1937.
Thorndike, R. L. Concepts of culture fairness. Journal of Educational Measurement, 1971, 8, 63-70.
Thurstone, L. L. Primary mental abilities. Psychometric Monographs, 1938, No. 1.
Tredgold, A. F. Mental deficiency. London: Bailliera, Tindall, and Fox, 1908.
United States Office of Education. Estimated Number of Handicapped Children in the United States 1971-1972. Washington, D.C.: Author, 1972.
Washington v. Davis. 426 U.S. 229 (1976).Williams, R. L. The BITCH 100: A culture-specific test.
Paper presented at the annual meeting of the American Psychological Association, Honolulu, September, 1972.
APPENDICES
137

138
APPENDIX A SPECIAL EDUCATION CATEGORIES INVOLVING
CONSIDERATION OF IQ SCORES
CategoryNot Exceptional*
Slow Learner
Mild Mental RetardationModerate Mental RetardationLearning Disabled
Gi fted
RequirementIQ score less than 1 1/2 s.d. below the mean
IQ score 1 1/2 to 2 s.d. below the meanIQ score 2 to 3 s.d. below the meanIQ score 3 to 4 s.d. below the meanIQ score less than 1 s.d. below the meanIQ score more than 2 s.d. above the mean
Score above 78
70-78
55-70
40-55
above 85
130 and above
Note aNot an official category.

139
APPENDIX BELP/IQ SUBGROUPS WITHIN SPECIAL EDUCATION CATEGORIES
MatchCategory IQ Range Status Subgroup*Not Exceptional above 78 Both
ELPELP and IQ both above 78 ELP above 78, IQ below 78
Slow Learner 70-78 Both
ELP
IQ
ELP and IQ both 70-78 ELP 70-78,IQ below 70 IQ 70-78, ELP above 78
Mild Mental Retardation
55-70 BothELP
IQ
ELP and IQ both 55-70 ELP 55-70,IQ below 55 IQ 55-70, ELP above 70
Moderate Mental Retardation
40-55 IQ IQ 40-55, ELP above 60
Learning Disabled above 85 BothELP
ELP and IQ both above 85 ELP above 85, IQ below 85
Gifted above 130 Both
ELPELP and IQ both above 130 ELP above 130, IQ below 130
*Not an official category-students referred back to regular education.

140
APPENDIX C STUDENT RATING FORM
TEACHER _____________________________STUDENT _____________________________EXCEPTIONALITY (SL, LD, GT, ETC.; or, if not
exceptional, NE)
One of the most common complaints from teachers involves the range of abilities and behaviors in the students they are expected to teach. We would like to ask your help in some research we are doing on the variety of students found in or tested for special education classes. If you would provide some brief information on each of your students, this will document the variety of students you serve and help in future special education planning. This form should not take more than a few minutes per child. If you are in regular education, you should only rate the specific child or children named on the attached sheet.DIRECTIONS
For each rating, compare the student to others in your class or caseload. Circle the number that applies. Number 1 represents the lowest rating, and number 6 the highest. For example, 1 = the lowest 10%, 2 = 15-40%, 3 = 40-55%, 4 = 55-70%, 5 = 75-90%, and 6 = the highest 10%.COMPARED TO OTHER CHILDREN IN MY CLASSROOM/CASELOAD, I WOULD ESTIMATE:1. The READING performance of this child as being on
level:1 2 3 4 5 6
2. His/her MATHEMATICS performance as being on level:1 2 3 4 5 6
3. His/her SELF-CONCEPT as being on level:1 2 3 4 5 6
4. His/her PEER GROUP PARTICIPATION as being on level:1 2 3 4 5 6
141
5. His/her COMPLIANCE WITH SCHOOL RULES as being on level:1 2 3 4 5 6
6 . His/her SELF-MOTIVATION as being on level:1 2 3 4 - 5 6
Thank you very much for your time. Please return this form to:

VITAAlan L. Taylor
Address: 148 W. Ardenwood, Baton Rouge, Louisiana 70806Birthplace: Alexandria, Louisiana, September 1, 1947Marital Status: Married March 2, 1973 to Judy Lynn KitchenChildren: Lesley Allison Taylor, born September 18, 1976
EducationUndergraduate: B.A. summa cum laude, 1969, Louisiana
Polytechnic InstituteDouble Major: Psychology and English
Postgraduate M.S., 1971, Iowa State University, Ames,IowaMajor: Psychology
Postgraduate: Ph.D., 1983, Louisiana State University, Baton Rouge, Louisiana
CertificationLouisiana School Psychologist (S.P. 55), State Department of Education
Professional Experience1968: Worked three months in summer as psychological
assistant at the Alcoholism Treatment Unit, Central Louisiana State Hospital, Pineville, Louisiana. Duties: testing, group therapy, case management.Supervisor: Mr. Edward Canoy.
1968 Worked two semesters at the Louisiana Polytechnicto Institute Psychology Department. Duties: Substi-
1969 tute teaching of Introductory Psychology.Supervisor: Dr. Wilbur Bergeron. Served as president of Louisiana Tech Psychological Society. Duties: Arranged for speakers, conducted fieldtrips, supervised committees, sponsored research. Supervisor: Dr. Robert Benefield.
1969 Worked four semesters as instructor for Adultto Education classes in practical psychology for
1971 the Ames Community College, Ames, Iowa.1971 Worked as Psychologist Assistant I, II, and III atto the Alexandria Mental Health Center, Alexandria,
1974 Louisiana. Duties: Administration, scoring, andinterpretations of tests to patients and professionals. Treatment of child and adult patients
142
143
1974to
1977
1977
1977to
1981
1978
individually and in groups. Supervision of Psychologist Assistant I. Conducted educational programs in psychology for inservice training. Clinical research on assessment of therapeutic results and effectiveness. General case consultation to community agencies and schools.Supervisors: Dr. Ronald Pryer, Central LouisianaState Hospital, and Dr. Frank Gremillion,Alexandria Mental Health Center.Research Associate and Clinical Instructor (Faculty appointment) at the Developmental Disability Center for Children, Louisiana State University Medical School, New Orleans, Louisiana. Duties: Interdisciplinary team member at a comprehensive center for the creation and provision of services for the multiply developmentally disabled. As a team member provided psychological evaluations and individual and group treatment for children and adults. As an instructor provided workshops and training for medical students, other professional, and the public. Appointed to Visiting Medical Staff, Charity Hospital of New Orleans, 1976. Supervised undergraduate psychology practicum students. Presented addresses, papers, and workshops at conventions and professional meetings. Supervisors: Dr. Randolph Harper, Louisiana StateUniversity Medical School, and Dr. J. Steven York, Developmental Disability Center for Children.Teaching assistant for two semesters in the L.S.U. Psychology Department. Duties: Assisting insupervision of testing practica, class assistant for a course in psychotherapy. Supervisor: Dr.Virginia Glad.Staff member at the Pscyhological Clinic, Baton Rouge, Louisiana. In 1980 this position was classified as an externship by agreement with the L.S.U. Psychology Department. Duties: Evaluationand treatment of children and adults. Evaluations of persons for Social Security Diability Determination, Vocational Rehabilitation, and the East Baton Rouge Parish school system. Consultation to the above agencies and various correctional and mental health agencies. General experience within a clinical psychology private practice setting. Supervisor: Dr. Richard H. Rolston.Summer work providing psychological evaluations for the Louisiana State School for the Deaf. Duties: Special education evaluation and classification of

144
deaf and hearing impaired students. Supervisor:Dr. Richard Rolston.
1979 Two practicum placements (approximately 225 hoursto each). One, at Greenwell Springs Hospital, Baton
1980 Rouge, Louisiana, involved an inpatient emotionallydisturbed adolescent population. Duties: Evaluation and group treatment of emotionally disturbed adolescents. Supervisor: Dr. Ronald Boudreaux.The second, at the L.S.U. Student Counseling Service, involved a college population. Duties: Evaluation and individual and group treatment. Supervisor: Dr. Susanne Jensen.
Professional SocietiesAssociate Member, American Psychological Association Associate Member, Louisiana Psychological Association
Research and Training AwardsNDEA Fellowship, Iowa State University, 1969-1971
Papers and Invited Addresses"Internal-External Control and Other's Susceptibility to Influence as Determinants of Interpersonal Attraction". Midwestern Psychological Association Convention, Detroit, Michigan, May, 1971."The Coat-Hanger Kid-Whose Hang-up is it?". (Emotional disturbance in retarded children). Region V Conference of the American Association of Mental Deficiency, New Orleans, Louisiana, October, 1974."The University Affiliated Facility in Community Consultation". Regional Conference, Child Welfare League, New Orleans, Louisiana, May, 1975."Classes for Autistic Children in the Public School System". Council of Exceptional Children convention, Chicago, Illinois, April, 1976.
PublicationsHaslett, N., Bolding, D., Harris, J., Taylor, A., Simon,
P., & Schedgick, R. The attachment of a retarded childto an inanimate object: Translation into clinicalutility. Child Psychiatry and Human Development, 1977, 8 , 54-60.
145
References1. Dr. Joseph G. Dawson, Professor Emeritus
Louisiana State University7510 Highland RoadBaton Rouge, Louisiana 70808
2. Dr. Richard H. Rolston, Director The Psychological Clinic126 N. Beck St.Baton Rouge, Louisiana 70806
3. Dr. Susanne Jensen, Director Student Counseling Service Louisiana State University Baton Rouge, Louisiana 70803
EXAMINATION AND THESIS REPORT
Candidate:
Major Field:
Title of Thesis:
Alan Lesley Taylor
Psychology
The Impact of SOMPA ELP Scores on Special Education Evaluation and Placement
Major Pro) and Chairman
EXAMINING COMMITTEE:
Date of Examination:
November 21, 1983