The Impact of Soaring Cotton Prices on Consumer … Impact of Soaring Cotton Prices on Consumer...
16
The Impact of Soaring Cotton Prices on Consumer Apparel Prices Esteban Balseca International Price Program 19 Jan 2012
Transcript of The Impact of Soaring Cotton Prices on Consumer … Impact of Soaring Cotton Prices on Consumer...

The Impact of Soaring Cotton Prices on Consumer Apparel
Prices
Esteban Balseca International Price Program
19 Jan 2012

Cotton Prices
Soaring cotton prices
300% to 400% increases in 2 year period
Why has this sharp increase occurred?
How will it affect consumer prices?
2
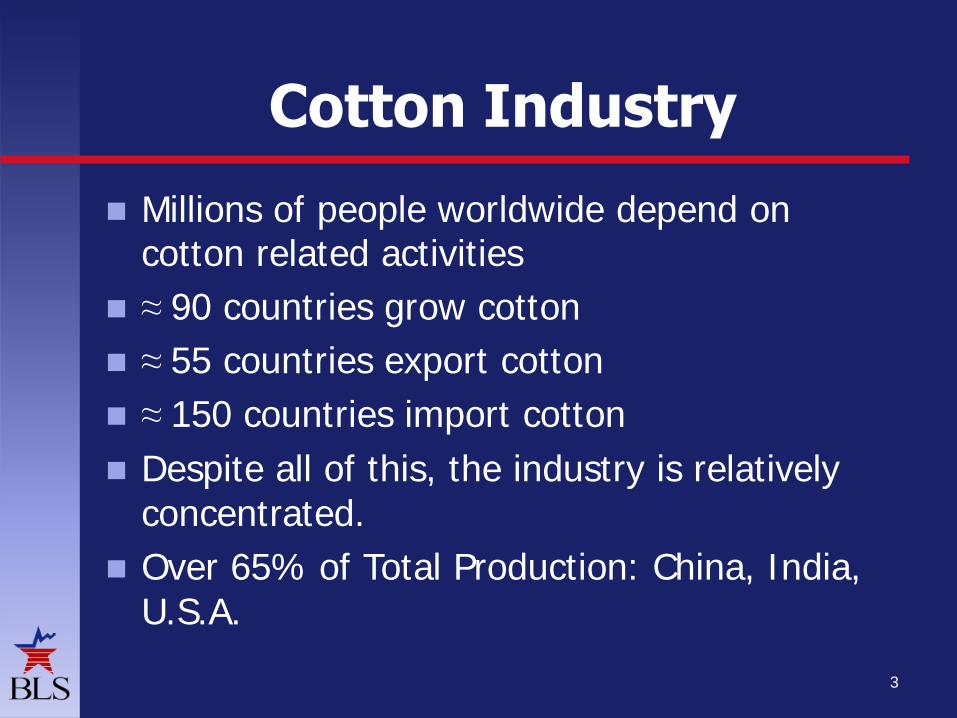
Cotton Industry
Millions of people worldwide depend on cotton related activities
≈ 90 countries grow cotton
≈ 55 countries export cotton
≈ 150 countries import cotton
Despite all of this, the industry is relatively concentrated.
Over 65% of Total Production: China, India, U.S.A.
3

China
World’s largest producer
World’s largest consumer
World’s largest importer
4
Aug-July Seasons: 2007/08 2008/09 2009/10 2010/11
Production 30.91% 34.20% 31.50% 26.45%
Consumption 41.26% 39.89% 42.02% 40.28%
Imports 29.26% 22.95% 30.03% 33.61%Source: USDA
China Cotton
Relative to World Totals

India
World’s second largest exporter
World’s second largest producer
World’s second largest consumer
5
Aug-July Seasons: 2007/08 2008/09 2009/10 2010/11
Production 20.05% 21.06% 22.64% 22.03%
Consumption 15.05% 16.14% 16.64% 18.13%
Exports 19.18% 7.95% 18.54% 14.33%Source: USDA
India Cotton
Relative to World Totals

United States
World’s largest exporter
World’s third largest producer
6
Aug-July Seasons: 2007/08 2008/09 2009/10 2010/11
Production 16.04% 11.93% 12.01% 15.70%
Exports 34.78% 44.04% 33.71% 40.45%Source: USDA
US Cotton
Relative to World Totals
0
10
20
30
40
50
2007/08 2008/09 2009/10 2010/11
Exports
USA India World

7
0
20
40
60
80
100
120
140
2007/08 2008/09 2009/10 2010/11
Production
USA China India World
0
20
40
60
80
100
120
140
2007/08 2008/09 2009/10 2010/11
Consumption
China India World
Production and Consumption:

Export Prices
2008 Financial Crisis Five consecutive months of export price decreases, for a total
decline of 21% 2009 China and India governments increase purchase of local cotton Demand for U.S. exports increases Prices begin to rise
8
50
70
90
110
130
150
IPP
Ind
ex
Val
ue
s
US Cotton Exports

Export Prices
2010 Unfavorable weather conditions
India bans exports
High commodity prices
Post-recession consumption
Prices increase 153.8%
9
50
100
150
200
250
300
350
400
Dec
-09
Jan
-10
Feb
-10
Mar
-10
Ap
r-1
0
May
-10
Jun
-10
Jul-
10
Au
g-1
0
Sep
-10
Oct
-10
No
v-1
0
Dec
-10
Jan
-11
Feb
-11
Mar
-11
IPP
Ind
ex
Val
ue
s
US Cotton Exports

Export Prices
The market reacted: volumes and prices trended downward.
10
-
500
1,000
1,500
2,000
2,500
0
50
100
150
200
250
300
350
400
Mar
-08
May
-08
Jul-
08
Sep
-08
No
v-0
8
Jan
-09
Mar
-09
May
-09
Jul-
09
Sep
-09
No
v-0
9
Jan
-10
Mar
-10
May
-10
Jul-
10
Sep
-10
No
v-1
0
Jan
-11
Mar
-11
May
-11
48
0 lb
bal
es
(10
00
)
IPP
Ind
ex
Val
ue
s
US Cotton Exports
Volume of U.S. Cotton Exports IPP Cotton Export Index
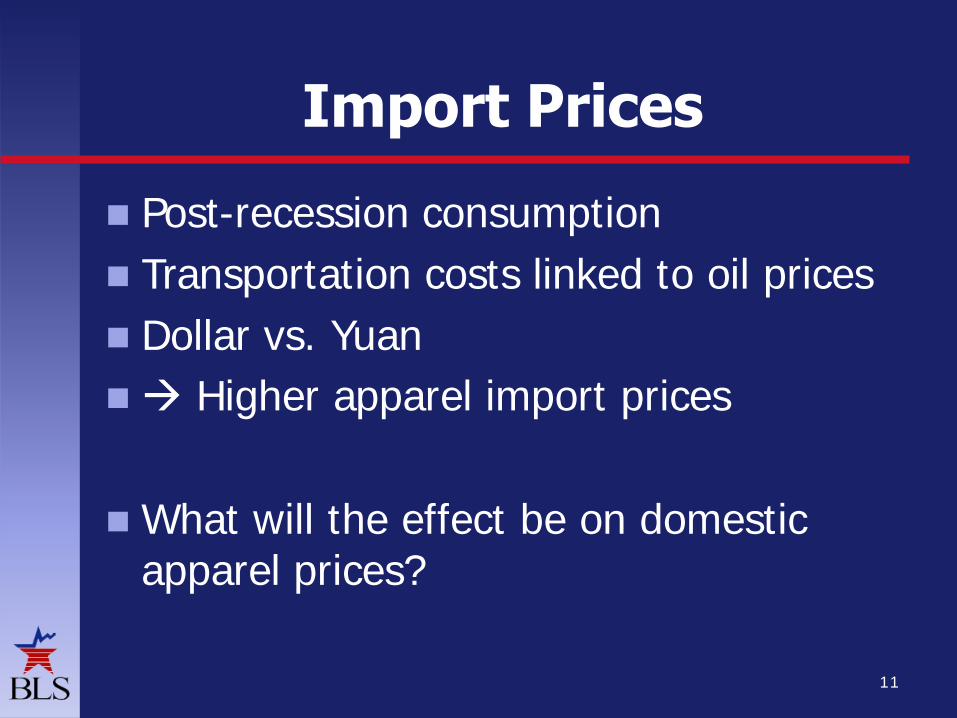
Import Prices
Post-recession consumption
Transportation costs linked to oil prices
Dollar vs. Yuan
Higher apparel import prices
What will the effect be on domestic apparel prices?
11
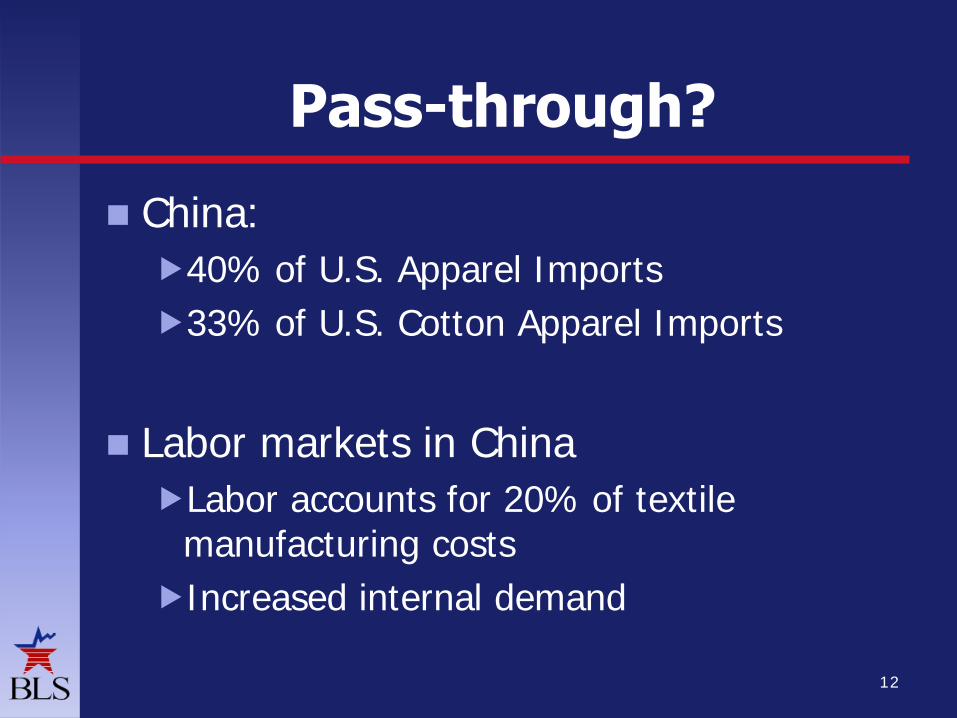
Pass-through?
China:
40% of U.S. Apparel Imports
33% of U.S. Cotton Apparel Imports
Labor markets in China
Labor accounts for 20% of textile manufacturing costs
Increased internal demand
12

Pass-through?
Consumer apparel prices have been on the rise and bear watching in the near future
13
92.0
94.0
96.0
98.0
100.0
102.0
104.0
106.0
108.0
110.0
112.0
IPP Cotton Apparel Index CPI Apparel less Footwear

Updates
14
-
500
1,000
1,500
2,000
2,500
0
50
100
150
200
250
300
350
400
Mar
-08
May
-08
Jul-
08
Sep
-08
No
v-0
8
Jan
-09
Mar
-09
May
-09
Jul-
09
Sep
-09
No
v-0
9
Jan
-10
Mar
-10
May
-10
Jul-
10
Sep
-10
No
v-1
0
Jan
-11
Mar
-11
May
-11
Jul-
11
Sep
-11
48
0 lb
bal
es
(10
00
)
IPP
Ind
ex
Val
ue
s
US Cotton Exports
IPP Cotton Export Index Volume of U.S. Cotton Exports
Prices and U.S. exports have continued to drop

Updates
15
90.0
95.0
100.0
105.0
110.0
115.0
120.0
Jun
-09
Au
g-0
9
Oct
-09
Dec
-09
Feb
-10
Ap
r-1
0
Jun
-10
Au
g-1
0
Oct
-10
Dec
-10
Feb
-11
Ap
r-1
1
Jun
-11
Au
g-1
1
Oct
-11
IPP Cotton Apparel Index CPI Apparel less Footwear
However, textile import prices have continued their upward trend and seasonally adjusted U.S. apparel prices have followed.

Contact Information
Victor Esteban Balseca Economist
International Price Program (IPP) www.bls.gov/mxp
202-691-7123 [email protected]