The Impact of Risk Management and CSR on Energy Efficiency ...
299
HAL Id: tel-02354220 https://tel.archives-ouvertes.fr/tel-02354220 Submitted on 7 Nov 2019 HAL is a multi-disciplinary open access archive for the deposit and dissemination of sci- entific research documents, whether they are pub- lished or not. The documents may come from teaching and research institutions in France or abroad, or from public or private research centers. L’archive ouverte pluridisciplinaire HAL, est destinée au dépôt et à la diffusion de documents scientifiques de niveau recherche, publiés ou non, émanant des établissements d’enseignement et de recherche français ou étrangers, des laboratoires publics ou privés. The Impact of Risk Management and CSR on Energy Effciency within Supply Chain : Institutional Organization Management Jaka Aminata To cite this version: Jaka Aminata. The Impact of Risk Management and CSR on Energy Effciency within Supply Chain : Institutional Organization Management. Business administration. Université Sorbonne Paris Cité, 2017. English. NNT : 2017USPCD071. tel-02354220
Transcript of The Impact of Risk Management and CSR on Energy Efficiency ...

HAL Id: tel-02354220https://tel.archives-ouvertes.fr/tel-02354220
Submitted on 7 Nov 2019
HAL is a multi-disciplinary open accessarchive for the deposit and dissemination of sci-entific research documents, whether they are pub-lished or not. The documents may come fromteaching and research institutions in France orabroad, or from public or private research centers.
L’archive ouverte pluridisciplinaire HAL, estdestinée au dépôt et à la diffusion de documentsscientifiques de niveau recherche, publiés ou non,émanant des établissements d’enseignement et derecherche français ou étrangers, des laboratoirespublics ou privés.
The Impact of Risk Management and CSR on EnergyEfficiency within Supply Chain : Institutional
Organization ManagementJaka Aminata
To cite this version:Jaka Aminata. The Impact of Risk Management and CSR on Energy Efficiency within Supply Chain :Institutional Organization Management. Business administration. Université Sorbonne Paris Cité,2017. English. �NNT : 2017USPCD071�. �tel-02354220�

Co positio du jury
NOM Pré o Grade Fo tio au sei du jury
Eta lisse e t de ratta he e t
SMIDA Ali
Professeur d'u iversit Dire teur de th se U iversit Paris
13
BENSEBAA Faouzi
Professeur d'u iversit Rapporteur
U iversit Paris 8
GRENIER Cori e Pr, HDR Rapporteur Kedge Busi ess
S hool, Marseille.
GIL TOVAR Her a do
Professeur d'u iversit
Suffraga t
U iversit Sur olo ia a, Neiva, Colo ie
MANIN Stéphane MCF Suffraga t U iversit de la
R u io
PAUGET Bertrand
Pr, HDR
Suffraga t
U iversit de Karlstat, Su de. Me re titulaire du CEPN, U. Paris13. U iversit Sor o e
UNIVERSITE PARIS 13 – UNIVERSITE SORBONNE PARIS CITE
U.F.R. de Sciences Economiques et Gestion
N° Attribué par la bibliothèque
T H E S E
Pour obtenir le grade de DOCTEUR DE L’UNIVERSITE PARIS 13
Discipline : Sciences de Gestion Présentée et soutenue publiquement
le 2 7 / 0 6 / 2 0 1 7 Par
Jaka AMINATA THE IMPACT OF RISK MANAGEMENT AND CSR ON ENERGY EFFICIENCY WITHIN SUPPLY CHAIN: INSTITUTIONAL ORGANIZATION MANAGEMENT
Directeur de thèse : SMIDA Ali

GENERAL INTRODUCTION

In this research, we investigate these functions at global level where the energy consumption is
a major issue to maintain a high level of the several outputs, with the perspective of management
science. However, we applied quantitative method to see all possibilities to know the level of energy
efficiency.
We intend to develop and show how the concept of energy efficiency is critical for global supply
chain. Many questions are possibly and legitimately to ask:
1. from economic side,
2. environmental side,
3. social side,
4. political and geopolitical side;
Therefore, based on the literature review and what they are the real life problems, my methodology
aims at studying the concepts hey are figured out in this work. To figure out all these research
questions, I have read a literature review to examine all the up to date references and bibliography in
order to support the understanding and knowledge of the energy efficiency concept in the global
supply chain. The logical arguments can be redesigned in all ways that are methodologically accepted.
The path ways of our thinking can be described as follows:
Table 0.0.1.: The Basic Path of Think-Tank

The general issues have been taken from real business cases and the literature reviews. However,
there are a lot of arguments that can lead the energy efficiency on significant other methodologies and
system requirements based on technology level.
The most challenging here is how to make an approval that energy efficiency has been approved
in production, warehouse and transportation at global level.
The basic idea in the initial stage is to reduce the CO2 pollution by reducing the amount of CO2
emissions yearly. The indicator of CO2 will decrease if there is energy management. The energy
management shows on energy efficiency indicator. The efficiency indicator shows on single
manufacture, region, national or international agreements. On the other hand, if there is efficiency
energy in micro level then it would be more easier to meet with energy efficiency at national level,
even at the international level. There are a lot of indicators showing how to know and to measure the
energy efficiency. If an enterprise or a manufacture have been allocated all resources in efficiency ways,
then the manufacture will create the price competitiveness. By the price competitiveness, the
enterprise can create the competition. Starting from basic competitiveness in price scale, the enterprise
can also go further up to hyper competition.
Table 0.0.2.: The General Idea on Hyper Competition
The hyper competition is built up from the basic matter, namely CO2 efficiency or the so called
minimizing the CO2 pollution. The point is how to produce, to manage the storage and to deliver to
the end users.

The purpose of CSR in responsibility level which is undertaken by the company to deal with the
pollution level. It is explained which set of criteria for environmental indicators is to be consider.
All requirements indicators could be energy resources type with regards to the method of product
deliveries, etc. Every single product should be distinguished and considered as a potential pollutant
for the environment which all the problems can arise from the enterprise operations and business
activities. At the final enterprise operations, the company has also to deal with the corporate social
responsibility. Otherwise, the future of business development will suffer from hyper competition and
a big future prospect.
Table 0.0.3.: The Sample Work on CSR
It shows that from the dimension of production, transportation and warehousing, one can describe
the energy efficiency scheme. The initial idea is that the production procedure has to be executed
in efficient manner, and particularly from the energy efficiency point of view within the production
process, followed by an efficient energy consumption within the warehouse management process and
followed by an efficient transportation for delivering products.

Table 0.0.4.: The Framework
Efficiency of Production + Efficiency Warehouse Management + Efficiency of Transportation
=
In order to get better understanding the managerial level and technical level are necessary to
explore them. Authors, Aminata et al. (2014c) applied and got closer to the gap of managerial and
technical problems. So that, all research works approached by bibliography and related reference were
intensively explored and exploited for the development of our research method.
One can also recall that many research works cleared get similarities and in various methods, used
methodologically and procedures, White (2009), Wilson and Giligan (2005), p. 406.
The general purpose of literature review for some extent will provide conceptual development,
research question based on the real condition and simulation possibilities, White (2009), Mouton and
Marais (1996), and Hillier and Hillier (2003). The content of literature review, Ridley (2012):
1. prevent from duplication.
2. the general body of knowledge.
3. to help the design of original research.
4. to reveal the conceptual problem based on assumptions.
We used these methodologies, because all are useful and closer to three dimensions. Based on that
arguments, all methodologies.
The Meaning of Energy Efficiency
There exist many kinds of definitions for energy efficiency. One can cite: (i) fuel efficiency, (ii)
fuel economy and (iii) fuel consumption. Moreover, energy efficiency in transportation is a relative
term used to describe how effectively fuel is used to move a vehicle. The fuel efficiency is connected
to the amount derived from the used fuel. Fuel economy is expressed as miles per gallon of consumed
fuel. Fuel consumption is the inverse of fuel economy. It refers to the fuel consumed by the vehicle or
type of transport as it travels a given distance. Widely used in the Europe (expressed in liters per 100
km), this metric is a clearer measure of fuel than the fuel economy (“real future energy efficiency in
USA”, p.121). For wide source of study in energy efficiency, I traced many possibilities from previous
Energy Efficiency in Global Supply Chain

research works, included related references. I noticed that all studies listed closer to energy efficiency
development in certain perspectives.
Our research is discussing the energy efficiency in global supply chain in the three identified
dimensions that are production, transportation, and warehousing. The objective is to formalize a model
aiming at optimizing energy consumption throughout supply chain for a minimal environmental impact
(energy efficiency). Referring to Wei et al. (2011), Varma and Clayton (2010), and Hall Dorson (2013)
explained that efficiency means: “doing things in an optimal way, for example; doing it the fastest
or inexpensive way and it was done by optimal ways. In other words: “efficiency refers to how well
something is done. Effectiveness refers to how useful something for certain business purpose.” For
example, a car is a very effective form of transportation mode and able to move people across long
distances, to specific places, but a specific car may not transport people efficiently because of the
way how to consume the fuel. The driving style (eco-driving) is one of the important variable when
utilizing vehicles.
To set the context of our research work, we, first, attempt to give a definition of global supply chain
as follows: all process networks that procure raw materials, transform into intermediate goods, and
produce final products at a global level. Then, to deliver the products to customers through a global
distribution systems, Albino et al. (2002).
The aim of the dissertation is to achieve the link between supply chain, logistics and energy matter
by management science. Some extents is how to organize well according to managerial level. To
develop the concept based on the competition.
It is not only achieved by a good supply chain. But, also the energy matter is managed as an engine
source of business development. However, the competition can be achieved in any other forms.
Following the question also, how the energy efficiency work well in a global supply chain?
The major research question is how the energy efficiency strategy is applied to the three dimensions
of global supply chain, therefore authors applied the research work on:
A. research design of the energy efficiency for the transportation function.
B. research design of the energy efficiency for the production function.
C. research design of the energy efficiency for the warehousing function.
Kotzab et al. (2005), explained that the research methodologies in supply chain management are
mainly focusing on who, what, where, why, and how, this perspective is a part of one of my work to
explain these issues.
Perlmutter (1969), has identified three positions on the globalism spectrum. Geo-centrism, as de-

fined earlier, represents the highest degree of integration and the highest degree of globalization. Poly-
centrism is associated with a worldwide presence, but operations in the multiple locations are largely
independent of one another. Ethnocentrism is also associated with a worldwide presence, but in this
profile the focus of the organization is the home country. Other possibilities, regional operations that
serve multiple countries.
Based on the three dimensions of global supply chain; we can distinguish the business activities
connected to global value or not. This definition is the key aspect before we run down the best
definition of global business as usual.
Dissertation’s Objective The research work detailed on the supply chain from top to bottom contains:
- efficiency production management,
- efficiency transportation management,
- efficiency warehousing management.
Three dimensions defines the objective that is the specification of the consumed energy. We need
to specify how to manage energy consumption at (i) strategic level, (ii) logistics level, and (iii)
operational level in order to drive the company to solve the problem directly linked to the core of
the problem. For example, time windows scheduling, negotiating market price, dealing with
technical problems.

Figure 0.0.1.: The Energy Efficiency in Global Supply Chain
ENERGY EFFICIENCY STRATEGY IN GLOBAL SUPPLY CHAIN
(Hyper Competition)
▽
▽
Operations Management (OM) and Global Operations Management (GOM)
▽
▽
Transportation Management (Efficiency)
Production Management (Efficiency)
Warehousing Management (Efficiency)
▽
▽
The energy efficiency could be seen from three dimensions:
▽
▽
Supply Chain Dimension (Strategical Level)
Logistics Dimension (Tactical Level)
Operator Management Dimension (Operational Level)
The most important one is how the flow of energy efficiency strategy in global supply chain can face
hyper competition. Through, transportation, production, and warehouse. We can make identification
of all competitors, collecting information data and focusing on the selection of energy sources. There-
fore, the company can prepare anything before launching its capacity level on hyper-competition.
The link between backward and forward linkage process should be run in a very efficient method
up to the product delivery to all end users, without any fail. Particularly, in the transportation it
is interesting to show, that the total company sales volume influenced by the geographical market
sales areas (distance), time, type of product, and speed of truck. Mapping all distance areas, total
volume or total sales (price) are importance key factors. Another purpose is to argue that expensive
product is more correlated with long distances. On these parameters, the company will run well in
the competitiveness to sustain its business.

The research work gave a new perspective for transportation industries by setting up a new strategy
on managing their own fuel consumption with a basis on the concept of energy efficiency. The work
was based on the area of the transportation of oleo chemicals business as a case study. As a spotlight
in this research, EU and particularly France should be more efficient in transportation performance
and their availability to promote oleo chemicals business once some best practices are identified with
regards to the energy efficiency in all transportation operations. For example, as follows:
To evaluate outcomes by the consensus agreement of stakeholders. Otherwise, the valuation can
only be considered to be that of the experts and decision-makers alone:
Figure 0.0.2.: Freight Transportation
Source: Energy Efficiency: A Compelling Global Resources, McKinsey and Company, 2010, p.35
This idea refers to the fact that a technologically complex system is often embedded within a
complex institutional structure. This added dimension of complexity is what makes the design and
management of an engineering system a great challenge. More information studies can be found at
company’s perspective in energy efficiency in global supply chain1
Bertrand and Fransoo (2002), explained empirical scientific research should be carefully
distinguished from axiomatic research results within the projects improvement. Therefore, improving
the performance underlying process models are valid and the theoretical solutions are useful to solve
It happe ed whe there is heap oil pri e, or ased o oil pri e flu tuatio s, To ias Meyer, , M Ki sey, “i gapore. It is a report o lusio fro u lo ki g E ergy Effi ie y i U“ July

the problem. So, we can elaborate, the empirical scientific research tests to demonstrate the validity
of the theoretical models.
The methodology’s design has been constructed based on the development of existing research
question and problem. Particularly, on energy efficiency in global supply chain. However, case studies
can be an excellent study to test the existing problem. Because, by certain case studies we can looked
up the progress of theoretical perspective and existing real problem, Bertrand and Fransoo (2002) and
Aminata et al. (2014c).
Also, in the dimension of production gave us a lot of ideas and we can deliver case studies in
various aspect and industrial sector. These works shows that in production dimension, authors easily
found, constructed, and formulate the raw data base became ready for use for research purpose.
The nuclear power plant could be one of the best example here to produce electricity output. Pro-
viding global supply chain materials to support availability of electricity source by nuclear power is
an excellent example, see IEA (2011); IEC MSB (2011), also see Dagpunar (2007); Depoues et al.
(2015).
However, by input output analysis will be a strong analysis to promote the strength of backward and
forward linkage, especially in manufacturing sectors. The availability of data base is one of indicator
to successful on database construction, see Miller and Blair (2009) and Aminata et al. (2014e), also
see Wood (2013); Wu et al. (2012).
To point out warehousing dimension refer to energy efficiency in global supply chain shows that
authors a bit difficult to construct the data. Especially, real time data that connected to global
connection. However, by latest technology and financial innovation the bitcoin mining
(cryptocurrency) is the best example to construct the perspective within warehousing dimension, see
Dagpunar (2007), also see Wilson and Giligan (2005).

Table 0.0.5.: The Flow Chart of Methodology - Part A

Table 0.0.6.: The Flow Chart of Methodology - Part B
The research question can be formulated as follows:
Major research question:
- how to formulate energy efficiency in global supply chain and its impact on the enterprise-business
development (MNCs) ?

The energy efficiency gives impact in any sector of business activities. Based on the concept of
efficiency by Archer (2010), explained that the future is now. Most of the people need efficient
society, especially energy efficiency in global supply chain. To make answer the question of efficiency
philosophy which is a need formulation of the harmony system in all type of business. Therefore, I
constructed the major research question and minor research question.
Complementary research question:
- how to build up energy efficiency in a case of transportation in global supply chain and its impact
on their enterprise-business development?
- how to build up energy efficiency in a case of production in global supply chain and its impact on
their enterprise-business development?
- how to build up energy efficiency in a case of warehousing in global supply chain and its impact on
their enterprise-business development?
Starting hyper competition discussion in energy efficiency within global supply chain. I delivered
some approval from scientific papers done in previous years. Also, research work in global supply
chain should be connected to hyper competition to know the real impact in business development,
Grandval and al. (2009). First of all, dimension of energy efficiency could be seen from three
dimensions, Sbihi and Eglese (2007); supply chain dimension (strategic level), especially in long term.
Logistics dimension (tactical level) is in medium term. Operations management dimension (day to
day term).
The competition level in transportation system, production, and warehouse system cannot be seen
as part of business. For example production system in oleo chemical and electricity level. However,
there is no single judgment that all kind of type business activities can be seen as hyper competition.
All transportation in the first step making an offering to company for transportation services. Due to,
there are a lot offers from many companies. The oleo chemical company offering the bidding system
to find out the most cheapest price among them (ex: transportation services which provided by other
supplier).
Hyper competition, Akhter (2003), Hulsmann et al. (2008), and Sandberg and Abrahamsson (2011),
global supply chains (GSCs) are confronted with the phenomenon of hyper competition. For this

reason, there seems to be an increasing necessity for GSCs to build up competitive advantage in order
to survive. Strategic of flexibility is assumed to have positive effects on generating required
competitive advantage by replicating and reconjuring competences to manage GSCs, while keeping
GSCs stable, Sandberg and Abrahamsson (2011).
Using a theoretical framework, this research elaborates the link between operational, dynamic
logistics capabilities and sustainable competitive advantage. The findings conclude that a sustainable
competitive advantage is based on a combination of efficient and effective logistics operations, see
more Shay and Rothaermel (1999), Hauswirth et al. (2004), Dentico (1999), Farahani (2009), and
Bironneau et al. (2015).
Gereffi and Lee (2012), state that global supply chains have been a familiar part of the international
business landscape for decades. From a management perspective, there are always issues connected
with the efficient and timely distribution of goods that flow across supply chains. From an industry
perspective, there are questions on how the industry is organized in terms of the size and ownership
of major manufacturers and their suppliers, and where these companies are located. From a national
competitiveness perspective, countries are concerned whether they can gain and maintain the
production, sales and research capabilities needed to develop and make low-cost, high-quality or high-
tech products (Pisano and Shih 2009).
As the ability of countries to prosper depends on their participation in the global economy, which
is their role in global supply chains. Despite its relevance on many levels, the literature on global
supply chains tends to appear in a specialized set of publications oriented to a business audience.
However, since the early 2000s, the global value chain concept has gained popularity as a way to
analyze the international expansion and geographical fragmentation of contemporary supply chains.
Further studies on CSR and energy efficiency can be traced on Pirsch et al. (2006),Crowther and Aras
(2008),Crowther and Aras (2009),Visser et al. (2010). Finally; Crowther and Aras (2008) stated the
principles of CSR;
• on sustainability is means that all action based on all options available for future needs.
• on accountability is means that both internal and external responsibilities of organization.
• on transparency is means that all stake holders can access the information.
The research design in this section is to design all possibilities, how to work in an inter-firm and
an inter-stakeholder, including how to manage the relationship with the local or regional government,
moreover at national level. Collecting and delivering all questioners needs a team collaboration, that is
the point to have a good degree of information. The degree is the score value collected from customer
or all stakeholders.

As Persson (1991) stated; (i) the best competitor in strong competition is materials flow segment.
It shows cost-effective in the business. (ii) the new competitor has a superior logistics performance.
So that, the implication is the logistics performance can be seen as a strategy driver. This view is suit-
able in logistics service as a significant element and by developing effectiveness in basic operational
capabilities.
Abrahamsson et al. (2003), exposed that in the type of three logistics towards external relations in
the supply chain shows the link from producer to final customer. If production is used as a buffer
stock. Therefore, logistics has to carry out a speculation stock to support marketing expansion, Also,
Abrahamsson et al. (2003) p. 88, explained that if there is a change of size market the logistics need
as a resource to support new marketing or production strategies.
The type of three logistics must be able to support the firm, then it can be formulated as
strategic decision. Furthermore, the logistics function should be able to support kind of strategies
such as: broadening of assortment, additional marketing channels, geographical expansion, support
global customers, expansion by company acquisitions and downsizing. He has defined logistics
platform in type three logistics which centrally manages and controls.
Table 0.0.7.: Methodology and Modeling - Type Logistics
Type 1 Logistics Type 2 Logistics Type 3 Logistics Main focus Optimization of logistics
activities
Logistics structure. Dynamic capabilities
Priorities in Logistics
1). Internal efficiency and
resource utilisation. 2).
Customer service related
to geographical distance to
customers
1). Reduction of total
logistics cost from
economies of scale.
2)Customer service
related to time to
1). Logistics as a
resource base for new
market positions and
marketing strategies 2).
Develop new offers toStructure and Organisation
Logistics tightly
connected to production
or sales. 2).
Decentralized
responsibility for design
and control.
1). Centralised logistics,
organisationally
separated from
production anad sales. 2).
Centralised resposibility
for design and control of
the logistics systel - high
1). Centralised logistics
responsibility in relation
to the business system
rather than the logistics
system. 2). Standardised
process with adaptions to
market segments. Flexibility Operational flexibility,
ex. the ability speed
operations aon a rush
Operational flexibility
from ability to respond to
unique customer
Strategic flexibility from
ability to reposition faster
and more cost-effective
Abrahamsson et al. (2003) and updated by Kihlen (2007).

The logistics platform included the concept of logistics operations, physical structure, processes
and its activities as well as the information systems, operations and reporting. Abrahamsson et al.
(2003) p. 104., delivered the scheme of design to formulate the energy efficiency intelligence for
global supply chain transportation by empowering international logistics and its opportunity for pro-
moting market and economic activities
Based on an assumption that improving industrial development will have impact on the
environment, ie. pollution level (C02). Developing supply chain strategy will face on complexity
problems and challenges for enhancing business development at global level. A lot of sociological
aspects of
global business can be traced back to the article of Perlmutter (1969). Especially on his article referred
to the evolution of the multinational corporation.
On multinational corporation existed worldwide approach in both headquarters and subsidiaries.
The firm as a whole concentrate on worldwide objectives as well as local objectives. The point here is
in each part contributes to the unique competence. Dickens (1998), providing the transport from their
country of origin to the country of which market at international level.
They utilized six categories (management teams, strategy, operations and products, R&D, financing
and marketing), which each of them consists of multiple dimensions. Also, Bartlett and Ghoshal
(1989) defined multiple dimensions to identify a firms position on the multinational to complex global
chain. Kanter and Dretlet (1998) attempted to define what global really means. Their approach is to
identify six aspects:
• global is synonymous with international.
• global strategy means doing the same thing everywhere.
• globalizing means becoming stateless, with no ties to a home country.
• globalizing requires abandoning images and values of a home country.
• globalizing involves acquisitions without integration.
• a firm must engage in foreign country to be considered global.
The conclusion shows that all findings have significant results. Precisely, the management strategy
should be the key concept for long period to promote three dimension in transportation, production,
and warehouse. It has to refer on the concept of management in energy efficiency. Utilizing straight
forward point analyzed for all cases studies shown that the point of global supply chain must be

established by strong chain for each business activities. Furthermore, energy efficiency also push us
for greening management strategy. Back to all dimensions in this works: I delivered some conclusion
that matched with current issues of greening effort which matched to Mathers (2015):
1. by setting up the performance goals for improving the quality of environment via
management approach.
2. by tracking logistics emission should as a reference for a standard practice. Also, improving
the the tracking performance by various indicators and methodology.
3. by seeking and building the external factor so called a leadership practice.
Discussing in energy issues, particularly on energy efficiency which creating efficiency output level
must be coherence and high linkages from backward and forward linkages. Especially for global
market and global product should be traced. Focusing on energy used for each business activities is
useful one. Therefore, all products assured by using energy intensity and global supply chain properly.
By optimizing energy source in proper way, it would be give minor impact on environmental. This
is the main idea for increasing industrial intensity with small environmental impact. So that, using
CSR’s matrix will contribute the knowledge capacity to the global business and global community.
However, from the management side shows that the management strategy is a role play for pro-
moting energy efficiency in scale and geographical areas. By establishing and constructing a strong
logistics and well-connected global supply chain will enhance global supply chain performance.
Mathematical approach and statistical approaches shown technics on energy efficiency calculation.
The innovation of this research is the discussion through corporate social responsibility and energy
efficiency. It seemed that enterprises or small, medium even large size of company for future compe-
tition, as D’aveni (1995). It should be able to handle energy efficiency. Moreover, energy efficiency
as one of tool to know company is efficient or not.
Finally, the energy efficiency in global supply chain shows that efficiency energy in global level
could be perform by any type of product, mainly on energy matter. By focusing on how to transport
them, the way of production system, and how to build warehouse system to keep source of energy
become more efficient to serve inter-links of chain and end users.

The Impact of Risk Management and CSR
on Energy Efficiency within Supply Chain:
Institutional Organization Management

2
This page intentionally left blank

Contents
I General Introduction 11
1 Framework 21
1.1 CSR - Risk Management Concept . . . . . . . . . . . . . . . . . . . . . . . 21
1.2 Organization of CSR Management . . . . . . . . . . . . . . . . . . . . . . . 27
1.3 Institutional Organization . . . . . . . . . . . . . . . . . . . . . . . . . . . 28
1.3.1 Management Strategy on CSR and Risk Management . . . . . . . . 34
1.3.2 Organization Management to Support CSR - Risk Management . . 35
2 Literature Review 37
2.1 Overview . . . . . . . . . . . . . . . . . . . . . . . . . . . . . . . . . . . . . 37
2.1.1 Management Strategy on Competition . . . . . . . . . . . . . . . . 43
2.1.2 Review on Transportation: CSR and Risk Management . . . . . . . 55
2.1.3 Review on Production: CSR and Risk Management . . . . . . . . . 60
2.1.4 Review on Warehouse: CSR and Risk Management . . . . . . . . . 64
2.1.5 Sample on Energy Resource Management . . . . . . . . . . . . . . . 69
3 Problem of CSR and Risk Management 71
3.1 Introduction . . . . . . . . . . . . . . . . . . . . . . . . . . . . . . . . . . . 71
3.1.1 CSR Organisation . . . . . . . . . . . . . . . . . . . . . . . . . . . . 72
3.2 Problem of CSR . . . . . . . . . . . . . . . . . . . . . . . . . . . . . . . . . 72
3.2.1 CSR and Energy Management on Decision Sciences . . . . . . . . . 72
3.3 Problem of Risk Management . . . . . . . . . . . . . . . . . . . . . . . . . 73
3.3.1 CSR in Supply Chain and Its Organization . . . . . . . . . . . . . . 76
3.4 Conclusion . . . . . . . . . . . . . . . . . . . . . . . . . . . . . . . . . . . . 78
3.4.1 Application AHP Matrix on Energy Management . . . . . . . . . . 79
3.4.2 Conclusion . . . . . . . . . . . . . . . . . . . . . . . . . . . . . . . . 79
3.5 Energy Efficiency Management . . . . . . . . . . . . . . . . . . . . . . . . 79
4 Risk Management in Supply Chain Organization 83
4.1 Introduction . . . . . . . . . . . . . . . . . . . . . . . . . . . . . . . . . . . 83
4.1.1 All case studies Concern to CSR and Its Risk Management . . . . . 83
4.2 Transportation . . . . . . . . . . . . . . . . . . . . . . . . . . . . . . . . . 84
4.2.1 The Oleo Chemicals Market and Supply Chain . . . . . . . . . . . 89
4.2.2 Result . . . . . . . . . . . . . . . . . . . . . . . . . . . . . . . . . . 92
1

2 CONTENTS
4.2.3 Conclusion . . . . . . . . . . . . . . . . . . . . . . . . . . . . . . . . 93
4.3 Airline Business Operations and Aircraft Industry . . . . . . . . . . . . . . 94
4.3.1 Introduction . . . . . . . . . . . . . . . . . . . . . . . . . . . . . . . 94
4.3.2 The Consumption of Fuel-Kerosene . . . . . . . . . . . . . . . . . . 95
4.3.3 A Case of Indonesian Airline Business Development . . . . . . . . . 96
4.3.4 Conclusion . . . . . . . . . . . . . . . . . . . . . . . . . . . . . . . . 98
4.4 Energy Efficiency Measures for International Shipping . . . . . . . . . . . . 99
4.4.1 Introduction . . . . . . . . . . . . . . . . . . . . . . . . . . . . . . . 99
4.5 Real Time Data Observation in Singapore . . . . . . . . . . . . . . . . . . 99
4.6 Real Time Data Observation in Indonesia . . . . . . . . . . . . . . . . . . 99
4.6.1 Difficulties . . . . . . . . . . . . . . . . . . . . . . . . . . . . . . . . 100
4.6.2 Methodology Challenges . . . . . . . . . . . . . . . . . . . . . . . . 101
4.6.3 Data Envelopment Analysis . . . . . . . . . . . . . . . . . . . . . . 101
4.6.4 Real Time Analysis, Dwelling Time Analysis . . . . . . . . . . . . . 102
4.6.5 Energy Efficiency Operations . . . . . . . . . . . . . . . . . . . . . 102
4.6.6 Interview Method Analysis . . . . . . . . . . . . . . . . . . . . . . . 102
4.6.7 Discussion and Result . . . . . . . . . . . . . . . . . . . . . . . . . 104
4.6.8 Conclusion . . . . . . . . . . . . . . . . . . . . . . . . . . . . . . . . 104
4.7 Production . . . . . . . . . . . . . . . . . . . . . . . . . . . . . . . . . . . 105
4.7.1 CSR - Production Efficiency in Risk Management within Manufac-
turing Industries . . . . . . . . . . . . . . . . . . . . . . . . . . . . 105
4.7.2 Production Efficiency in Manufacturing Industries . . . . . . . . . . 105
4.7.3 Introduction . . . . . . . . . . . . . . . . . . . . . . . . . . . . . . . 106
4.7.4 Methodology . . . . . . . . . . . . . . . . . . . . . . . . . . . . . . 107
4.7.5 Production Function . . . . . . . . . . . . . . . . . . . . . . . . . . 107
4.7.6 Estimation for Selected Sector . . . . . . . . . . . . . . . . . . . . . 107
4.7.7 Three Digits Manufacturing Industries . . . . . . . . . . . . . . . . 108
4.7.8 Conclusion . . . . . . . . . . . . . . . . . . . . . . . . . . . . . . . . 108
4.8 Production Process in A Case of Footwear . . . . . . . . . . . . . . . . . . 109
4.8.1 Introduction . . . . . . . . . . . . . . . . . . . . . . . . . . . . . . . 109
4.8.2 Energy Efficiency in Footwear Industry . . . . . . . . . . . . . . . . 110
4.8.3 Global Supply Chain in Footwear Industries . . . . . . . . . . . . . 114
4.8.4 Basic Formula in Efficiency . . . . . . . . . . . . . . . . . . . . . . 115
4.8.5 Efficiency Calculation . . . . . . . . . . . . . . . . . . . . . . . . . . 115
4.8.6 Conclusion . . . . . . . . . . . . . . . . . . . . . . . . . . . . . . . . 116
4.9 Energy Application Planning Model . . . . . . . . . . . . . . . . . . . . . . 117
4.9.1 Introduction . . . . . . . . . . . . . . . . . . . . . . . . . . . . . . . 117
4.9.2 The Estimation of Energy Demand . . . . . . . . . . . . . . . . . . 119
4.9.3 Demand Model . . . . . . . . . . . . . . . . . . . . . . . . . . . . . 120
4.9.4 Conclusion . . . . . . . . . . . . . . . . . . . . . . . . . . . . . . . . 125
4.10 Energy Efficiency Measures for Coffee Production . . . . . . . . . . . . . . 126

CONTENTS 3
4.10.1 Market Information . . . . . . . . . . . . . . . . . . . . . . . . . . . 127
4.10.2 The Competition of Green Coffee . . . . . . . . . . . . . . . . . . . 128
4.10.3 The Basic Idea of Supply Chain Approach . . . . . . . . . . . . . . 128
4.10.4 Positioning . . . . . . . . . . . . . . . . . . . . . . . . . . . . . . . 130
4.10.5 Methodology . . . . . . . . . . . . . . . . . . . . . . . . . . . . . . 131
4.10.6 Conclusion . . . . . . . . . . . . . . . . . . . . . . . . . . . . . . . . 131
4.11 Nuclear Power Plant in Global Supply Chain . . . . . . . . . . . . . . . . . 132
4.11.1 Introduction . . . . . . . . . . . . . . . . . . . . . . . . . . . . . . . 132
4.11.2 Input Output Estimation Model . . . . . . . . . . . . . . . . . . . . 141
4.11.3 Estimation Analysis . . . . . . . . . . . . . . . . . . . . . . . . . . 145
4.11.4 Theoretical Background of Input Output . . . . . . . . . . . . . . . 146
4.11.5 The Basic Elements . . . . . . . . . . . . . . . . . . . . . . . . . . . 149
4.11.6 The Balance equation . . . . . . . . . . . . . . . . . . . . . . . . . 149
4.11.7 The Flowchart Component . . . . . . . . . . . . . . . . . . . . . . . 154
4.11.8 Indonesia’s Nuclear Power Plants Location . . . . . . . . . . . . . . 154
4.11.9 Nuclear Power Plants Construction Phase . . . . . . . . . . . . . . 155
4.11.10The Input Demand for Construction . . . . . . . . . . . . . . . . . 155
4.11.11The Cost of Decommissioning Nuclear Power Station . . . . . . . . 159
4.11.12Conclusion . . . . . . . . . . . . . . . . . . . . . . . . . . . . . . . . 159
4.12 Warehousing . . . . . . . . . . . . . . . . . . . . . . . . . . . . . . . . . . . 160
4.12.1 CSR - Risk Management on Warehouse Management . . . . . . . . 160
4.12.2 Special Section on Warehouse Management . . . . . . . . . . . . . . 160
4.13 Electric Warehouse Intelligence . . . . . . . . . . . . . . . . . . . . . . . . 160
4.13.1 Current Issues and Technology Development . . . . . . . . . . . . . 161
4.13.2 Methods . . . . . . . . . . . . . . . . . . . . . . . . . . . . . . . . . 163
4.13.3 Result . . . . . . . . . . . . . . . . . . . . . . . . . . . . . . . . . . 164
4.13.4 Conclusion . . . . . . . . . . . . . . . . . . . . . . . . . . . . . . . . 165
4.14 A New Perspective of Energy Consumption . . . . . . . . . . . . . . . . . . 165
4.14.1 Introduction . . . . . . . . . . . . . . . . . . . . . . . . . . . . . . . 166
4.14.2 Methodology . . . . . . . . . . . . . . . . . . . . . . . . . . . . . . 169
4.14.3 Data Construction . . . . . . . . . . . . . . . . . . . . . . . . . . . 170
4.14.4 Result . . . . . . . . . . . . . . . . . . . . . . . . . . . . . . . . . . 170
4.14.5 Advantages . . . . . . . . . . . . . . . . . . . . . . . . . . . . . . . 170
4.14.6 Conclusion . . . . . . . . . . . . . . . . . . . . . . . . . . . . . . . . 170
5 The Impact of Institutional Organization 173
5.1 The Role of Institutional on Supply Chain Organization . . . . . . . . . . 173
5.1.1 Institutional Organization at Local and Global Level . . . . . . . . 174
5.1.2 Conclusion . . . . . . . . . . . . . . . . . . . . . . . . . . . . . . . . 174
5.2 Conclusion . . . . . . . . . . . . . . . . . . . . . . . . . . . . . . . . . . . . 174

4 CONTENTS
II General Conclusion 1755.3 Institutional Organization on Supply Chain Management . . . . . . . . . . 181
5.4 Contribution for Management Science . . . . . . . . . . . . . . . . . . . . . 181
5.4.1 Value Added . . . . . . . . . . . . . . . . . . . . . . . . . . . . . . 181
5.4.2 All Highlight of Research Findings . . . . . . . . . . . . . . . . . . 182
5.4.3 The Global Theoretical Contribution . . . . . . . . . . . . . . . . . 183
5.5 Research Work Achievement . . . . . . . . . . . . . . . . . . . . . . . . . . 183
5.5.1 Transportation Optimization . . . . . . . . . . . . . . . . . . . . . . 184
5.5.2 Production Optimization . . . . . . . . . . . . . . . . . . . . . . . . 185
5.5.3 Warehouse Optimization . . . . . . . . . . . . . . . . . . . . . . . . 185
5.5.4 Theoretical Contribution for Scientific Development . . . . . . . . . 185
5.5.5 Strengthen to Theoretical Aspects . . . . . . . . . . . . . . . . . . . 186
5.6 The Impact of Institutional Organization . . . . . . . . . . . . . . . . . . . 186
5.6.1 The Role of Institutional on Supply Chain Organization . . . . . . 186
5.6.2 Institutional Organization at Local and Global Level . . . . . . . . 187
5.6.3 Conclusion . . . . . . . . . . . . . . . . . . . . . . . . . . . . . . . . 187
5.7 Managerial Contribution . . . . . . . . . . . . . . . . . . . . . . . . . . . . 187
5.8 Conclusion . . . . . . . . . . . . . . . . . . . . . . . . . . . . . . . . . . . . 188
III Appendix 213

List of Figures
1.1 The Whole Framework for Institutional Organization . . . . . . . . . . . . 24
1.2 The Way of Thinking . . . . . . . . . . . . . . . . . . . . . . . . . . . . . . 25
1.3 The Flowchart of General Idea . . . . . . . . . . . . . . . . . . . . . . . . . 26
1.4 The Sample Work on CSR . . . . . . . . . . . . . . . . . . . . . . . . . . . 27
1.5 The Framework of Energy Efficiency . . . . . . . . . . . . . . . . . . . . . 27
1.6 Energy Efficiency in Global Supply Chain . . . . . . . . . . . . . . . . . . 30
1.7 Freight Transportation . . . . . . . . . . . . . . . . . . . . . . . . . . . . . 31
1.8 The Flow Chart of Methodology-Part A . . . . . . . . . . . . . . . . . . . 32
1.9 The Flow Chart of Methodology-Part B . . . . . . . . . . . . . . . . . . . 33
1.10 Type of Logistics Model . . . . . . . . . . . . . . . . . . . . . . . . . . . . 35
2.1 The Experience Curve, Source: Martin M., 2005 . . . . . . . . . . . . . . . 37
2.2 Interaction Project Partners and the Stakeholders . . . . . . . . . . . . . . 67
2.3 Supply Chain Construction . . . . . . . . . . . . . . . . . . . . . . . . . . 67
2.4 Primary Energy Sources and Energy Carriers . . . . . . . . . . . . . . . . 70
3.1 Mapping of the Perspective of CSR for Society and Business, Source: Keys
and Graaf, 2009. . . . . . . . . . . . . . . . . . . . . . . . . . . . . . . . . 75
3.2 The Perspective of Trilemma for Managing Complex and Dynamic Supply
and Demand Networks . . . . . . . . . . . . . . . . . . . . . . . . . . . . . 81
4.1 The Distance and Total CO2, CR4 . . . . . . . . . . . . . . . . . . . . . . 92
4.2 The Distance and Total CO2, CR8 . . . . . . . . . . . . . . . . . . . . . . 93
4.3 Fuel Efficiency Gains Since the Early Jet Age . . . . . . . . . . . . . . . . 98
4.4 All Vessels Type, 30 Days . . . . . . . . . . . . . . . . . . . . . . . . . . . 100
4.5 Energy Consumption Monitoring . . . . . . . . . . . . . . . . . . . . . . . 105
4.6 The Simulation of Cost-Effectiveness Results . . . . . . . . . . . . . . . . . 112
4.7 Top EU Supplier, Share of 2012 Imports . . . . . . . . . . . . . . . . . . . 114
4.8 Top 10 EU 27 Market in Million Euros . . . . . . . . . . . . . . . . . . . . 115
4.9 LEAP Calculation Flows . . . . . . . . . . . . . . . . . . . . . . . . . . . . 122
4.10 Refinery Module, LEAP . . . . . . . . . . . . . . . . . . . . . . . . . . . . 123
4.11 Electric Reactor Module . . . . . . . . . . . . . . . . . . . . . . . . . . . . 124
4.12 Final Energy Demand . . . . . . . . . . . . . . . . . . . . . . . . . . . . . 126
4.13 The Paths of Coffee Producer to EU Market . . . . . . . . . . . . . . . . . 127
5

6 LIST OF FIGURES
4.14 Continuous Development in the Energy Efficiency System . . . . . . . . . . 130
4.15 Maintenance Supply Chain Model . . . . . . . . . . . . . . . . . . . . . . . 139
4.16 Macro Scheme of Global Nuclear Supply Chain . . . . . . . . . . . . . . . 140
4.17 Transaction of Input Output Table . . . . . . . . . . . . . . . . . . . . . . 141
4.18 Policy Measures Given General Policy Objectives and Options to Reduce
GHG Emission from the Energy-Supply Sector . . . . . . . . . . . . . . . . 151
4.19 The Flowchart Component Cost Identification and Construction Cost . . . 154
4.20 Accumulation Cost on Nuclear Power Plant Cost, S Curve. . . . . . . . . . 156
4.21 Income Effect 2005-2016 . . . . . . . . . . . . . . . . . . . . . . . . . . . . 156
4.22 The Impact for Labor Force 2005-2016 . . . . . . . . . . . . . . . . . . . . 157
4.23 The Share Level of Commercial Exchange to Total Energy Production
within Inter Countries Connection . . . . . . . . . . . . . . . . . . . . . . . 162
4.24 Forecast for Total Energy Consumption Level . . . . . . . . . . . . . . . . 163
4.25 Strategic Programs and Objectives . . . . . . . . . . . . . . . . . . . . . . 163
4.26 The Emergence of Permissioned, Distributed Ledger Systems . . . . . . . . 167
4.27 Tokenize Everything . . . . . . . . . . . . . . . . . . . . . . . . . . . . . . 168
5.1 The Production Function, Isoquant . . . . . . . . . . . . . . . . . . . . . . 218
5.2 Elastic Demand for Work Full . . . . . . . . . . . . . . . . . . . . . . . . . 222
5.3 Inelastic Demand for Work Full . . . . . . . . . . . . . . . . . . . . . . . . 222

List of Tables
1.1 CSR Theories and Approaches-1 . . . . . . . . . . . . . . . . . . . . . . . . 22
1.2 CSR Theories and Approaches-2 . . . . . . . . . . . . . . . . . . . . . . . . 23
4.1 Global Oleo Chemicals Production 2009, (000 tons) . . . . . . . . . . . . . 90
4.2 Estimated Oleo-chemical and Detergent Alcohol Capacity Additions . . . . 90
4.3 Synthetic Fatty Alcohols . . . . . . . . . . . . . . . . . . . . . . . . . . . . 91
4.4 The Calculation Concentration Ratio 8, CR8 . . . . . . . . . . . . . . . . . 93
4.5 The Range of Allowable Cost Index for Given Boeing Airplane . . . . . . . 95
4.6 Comparing Result for Cost index values of Zero and Maximum . . . . . . . 95
4.7 Calculated Values for a Typical 757 Flight . . . . . . . . . . . . . . . . . . 95
4.8 Cost Index Impact . . . . . . . . . . . . . . . . . . . . . . . . . . . . . . . 96
4.9 Supply Chain Management in Boeing Business Program . . . . . . . . . . 96
4.10 Vessel Arrivals,Singapore . . . . . . . . . . . . . . . . . . . . . . . . . . . . 99
4.11 The Main Ports Administered by Pelindo . . . . . . . . . . . . . . . . . . . 101
4.12 Observed Ports . . . . . . . . . . . . . . . . . . . . . . . . . . . . . . . . . 102
4.13 Indonesian Port Data . . . . . . . . . . . . . . . . . . . . . . . . . . . . . . 103
4.14 Sample in Global Dwelling Time . . . . . . . . . . . . . . . . . . . . . . . . 103
4.15 Collaborative Project to Implement EMS in Two Shipping Companies . . . 104
4.16 Top Footwear Retailers in Europe - Turnover in Europe 2011 in Billion . . 111
4.17 Real Fact and List of Current Footwear Technology Development . . . . . 111
4.18 EU 27 Structural Data in Million Euros . . . . . . . . . . . . . . . . . . . . 113
4.19 Production, Consumption and External Trade . . . . . . . . . . . . . . . . 113
4.20 Top EU Supplier as Share of 2012 Imports in Million . . . . . . . . . . . . 113
4.21 Top EU Supplier as Percentage Growth 2008-2012 in Million . . . . . . . . 114
4.22 Energy Savings and Emission Reductions . . . . . . . . . . . . . . . . . . . 116
4.23 Cost Effectiveness Analysis . . . . . . . . . . . . . . . . . . . . . . . . . . . 116
4.24 Percentage of Distribution for Green Decafeine by Frances Import . . . . . 127
4.25 Nuclear Power Plants World-Wide-1 . . . . . . . . . . . . . . . . . . . . . 134
4.26 World Nuclear Power Reactors and Uranium Requirements-1 . . . . . . . . 136
4.27 World Nuclear Power Reactors and Uranium Requirements-2 . . . . . . . . 137
4.28 France’s Warehouse Energy Nuclear for Commercial Exchange . . . . . . . 162
4.29 Random Value with Iteration, from the raw data . . . . . . . . . . . . . . 164
4.30 Mining Bitcoin-The Devices Tested . . . . . . . . . . . . . . . . . . . . . . 171
7

8 LIST OF TABLES
4.31 Real Time of Block chain 1 . . . . . . . . . . . . . . . . . . . . . . . . . . 172
4.32 Real Time of Block chain 2 . . . . . . . . . . . . . . . . . . . . . . . . . . 172
5.1 Energy Savings and Emission Reductions . . . . . . . . . . . . . . . . . . . 215
5.2 Cost Effectiveness Analysis . . . . . . . . . . . . . . . . . . . . . . . . . . . 215
5.3 The Matrix Simulation-1 . . . . . . . . . . . . . . . . . . . . . . . . . . . . 220
5.4 The Matrix Simulation-2 . . . . . . . . . . . . . . . . . . . . . . . . . . . . 221
5.5 The Matrix Simulation-3 . . . . . . . . . . . . . . . . . . . . . . . . . . . . 221
5.6 Oleo Transport-1 . . . . . . . . . . . . . . . . . . . . . . . . . . . . . . . . 226
5.7 Oleo Transport-2 . . . . . . . . . . . . . . . . . . . . . . . . . . . . . . . . 227
5.8 Oleo Transport-3 . . . . . . . . . . . . . . . . . . . . . . . . . . . . . . . . 228
5.9 Oleo Transport-4 . . . . . . . . . . . . . . . . . . . . . . . . . . . . . . . . 229
5.10 Oleo Transport-5 . . . . . . . . . . . . . . . . . . . . . . . . . . . . . . . . 230
5.11 Oleo Transport-6 . . . . . . . . . . . . . . . . . . . . . . . . . . . . . . . . 231
5.12 Oleo Transport-7 . . . . . . . . . . . . . . . . . . . . . . . . . . . . . . . . 232
5.13 Oleo Transport-8 . . . . . . . . . . . . . . . . . . . . . . . . . . . . . . . . 233
5.14 Oleo Transport-9 . . . . . . . . . . . . . . . . . . . . . . . . . . . . . . . . 234
5.15 Oleo Transport-10 . . . . . . . . . . . . . . . . . . . . . . . . . . . . . . . . 235
5.16 Oleo Transport-11 . . . . . . . . . . . . . . . . . . . . . . . . . . . . . . . . 236
5.17 Oleo Transport-12 . . . . . . . . . . . . . . . . . . . . . . . . . . . . . . . . 237
5.18 Oleo Transport-13 . . . . . . . . . . . . . . . . . . . . . . . . . . . . . . . . 238
5.19 Oleo Transport-14 . . . . . . . . . . . . . . . . . . . . . . . . . . . . . . . . 239
5.20 Oleo Transport-15 . . . . . . . . . . . . . . . . . . . . . . . . . . . . . . . . 240
5.21 Oleo Transport-16 . . . . . . . . . . . . . . . . . . . . . . . . . . . . . . . . 241
5.22 Oleo Transport-17 . . . . . . . . . . . . . . . . . . . . . . . . . . . . . . . . 242
5.23 Oleo Transport-18 . . . . . . . . . . . . . . . . . . . . . . . . . . . . . . . . 243
5.24 Annex-1: The Part of Sample Data Base: The Oleo Chemical Transporta-
tion in France/E-U. . . . . . . . . . . . . . . . . . . . . . . . . . . . . . . . 244
5.25 Annex-2: The Part of Sample Data Base: The Oleo Chemical Transporta-
tion in France/E-U. . . . . . . . . . . . . . . . . . . . . . . . . . . . . . . . 246
5.26 Vessel Arrivals, Belawan Port . . . . . . . . . . . . . . . . . . . . . . . . . 250
5.27 vessel arrivals, Pekanbaru Port . . . . . . . . . . . . . . . . . . . . . . . . . 251
5.28 Vessel Arrivals, Dumai Port, Sumatra . . . . . . . . . . . . . . . . . . . . . 252
5.29 Vessel Arrivals, Tanjung Pinang Port . . . . . . . . . . . . . . . . . . . . . 253
5.30 Vessel Arrivals, Lhokseumawe Port . . . . . . . . . . . . . . . . . . . . . . 254
5.31 Vessel Arrivals, Tanjung Priok Port . . . . . . . . . . . . . . . . . . . . . . 255
5.32 Vessel Arrivals, Panjang Port . . . . . . . . . . . . . . . . . . . . . . . . . 256
5.33 Vessel Arrivals, Palembang Port . . . . . . . . . . . . . . . . . . . . . . . . 257
5.34 Vessel Arrivals, Teluk Bayur Port . . . . . . . . . . . . . . . . . . . . . . . 258
5.35 Vessel Arrivals, Pontianak Port . . . . . . . . . . . . . . . . . . . . . . . . 259
5.36 Vessel Arrivals, Cirebon Portt . . . . . . . . . . . . . . . . . . . . . . . . . 260
5.37 Vessel Arrivals, Jambi Port . . . . . . . . . . . . . . . . . . . . . . . . . . . 261

LIST OF TABLES 9
5.38 Vessel Arrivals, Bengkulu Port . . . . . . . . . . . . . . . . . . . . . . . . . 262
5.39 Vessel Arrivals, Banten Port . . . . . . . . . . . . . . . . . . . . . . . . . . 263
5.40 Vessel Arrivals, Pangkal Balam Port . . . . . . . . . . . . . . . . . . . . . . 264
5.41 Vessel Arrivals, Tanjung Pandan Port . . . . . . . . . . . . . . . . . . . . . 265
5.42 Vessel Arrivals, Tanjung Perak Port . . . . . . . . . . . . . . . . . . . . . . 266
5.43 Vessel Arrivals, Tanjung Emas Port . . . . . . . . . . . . . . . . . . . . . . 267
5.44 Vessel Arrivals, Banjarmasin Port . . . . . . . . . . . . . . . . . . . . . . . 268
5.45 Vessel Arrivals,Benoa Port . . . . . . . . . . . . . . . . . . . . . . . . . . . 269
5.46 Vessel Arrivals, Tenau Kupang Port . . . . . . . . . . . . . . . . . . . . . . 270
5.47 Vessel Arrivals, Makassar Port . . . . . . . . . . . . . . . . . . . . . . . . . 271
5.48 Vessel Arrivals, Balikpapan Port . . . . . . . . . . . . . . . . . . . . . . . . 272
5.49 Vessel Arrivals, Samarinda Port . . . . . . . . . . . . . . . . . . . . . . . . 273
5.50 Vessel Arrivals, Bitung Port . . . . . . . . . . . . . . . . . . . . . . . . . . 274
5.51 Vessel Arrivals, Ambon Port . . . . . . . . . . . . . . . . . . . . . . . . . . 275
5.52 Vessel Arrivals, Sorong Port . . . . . . . . . . . . . . . . . . . . . . . . . . 276
5.53 Vessel Arrivals, Biak Port . . . . . . . . . . . . . . . . . . . . . . . . . . . 277
5.54 Vessel Arrivals, Jayapura Port . . . . . . . . . . . . . . . . . . . . . . . . . 278

10 LIST OF TABLES

Part I
General Introduction
11


13
In this research, we investigate these functions at global level where the energy con-
sumption is a major issue to maintain a high level of the several outputs. We intend
to develop and show how the concept of energy efficiency is critical for global supply
chain. Many questions are possibly and legitimately to ask: 1. from economic side, 2.
environmental side, 3. social side, 4. political and geopolitical side;
Therefore, based on the literature review and what they are the real life problems, my
methodology aims at studying the concepts hey are figured out in this work. To figure
out all these research questions, I have read a literature review to examine all the up to
date references and bibliography in order to support the understanding and knowledge
of the energy efficiency concept in the global supply chain. The logical arguments can
be redesigned in all ways that are methodologically accepted. The general issues have
been taken from real business cases and the literature reviews. However, there are a lot of
arguments that can lead the energy efficiency on significant other ways. The most difficult
here is how to make an approval that energy efficiency has been approved in production,
warehouse and transportation. The basic idea in the initial stage is to reduce the CO2
pollution by reducing the amount of CO2 emissions yearly. The indicator of CO2 will
decrease if there is energy management. The energy management shows on energy effi-
ciency indicator. The efficiency indicator shows on single manufacture, region, national
or international agreements. On the other hand, if there is efficiency energy in micro level
then it would be more easier to meet with energy efficiency at national level, even at the
international level. There are a lot of indicators showing how to know and to measure the
energy efficiency. If an enterprise or a manufacture have been allocated all resources in
efficiency ways, then the manufacture will create the price competitiveness. By the price
competitiveness, the enterprise can create the competition. Starting from basic compet-
itiveness in price scale, the enterprise can also go further up to hyper competition. The
hyper competition is built up from the basic matter, namely CO2 efficiency or the so called
minimizing the CO2 pollution. The point is how to produce, to manage the storage and
to deliver to the end users. The purpose of CSR in responsibility level which is undertaken
by the company to deal with the pollution level. It is explained which set of criteria for
environmental indicators is to be consider. All requirements indicators could be energy
resources type with regards to the method of product deliveries, etc. Every single product
should be distinguished and considered as a potential pollutant for the environment which
all the problems can arise from the enterprise operations and business activities. At the
final enterprise operations, the company has also to deal with the corporate social respon-
sibility. Otherwise, the future of business development will suffer from hyper competition
and a big future prospect. It shows that from the dimension of production, transporta-
tion and warehousing, one can describe the energy efficiency scheme. The initial idea is
that the production procedure has to be executed in efficient manner, and particularly
from the energy efficiency point of view within the production process, followed by an
efficient energy consumption within the warehouse management process and followed by
an efficient transportation for delivering products. In order to get better understanding

14
the managerial level and technical level are necessary to explore them. Authors, Aminata
et al. (2014c) applied and got closer to the gap of managerial and technical problems. So
that, all research works approached by bibliography and related reference were intensively
explored and exploited for the development of our research method. One can also recall
that many research works cleared get similarities and in various methods, used method-
ologically and procedures, White (2009), Wilson and Giligan (2005), p. 406. The general
purpose of literature review for some extent will provide conceptual development, research
question based on the real condition and simulation possibilities, White (2009), Mouton
and Marais (1996), and Hillier and Hillier (2003). The content of literature review, Ridley
(2012): 1. prevent from duplication. 2. the general body of knowledge. 3. to help the
design of original research. 4. to reveal the conceptual problem based on assumptions.
We used these methodologies, because all are useful and closer to three dimensions.
Based on that arguments, all methodologies.
The Meaning of Energy Efficiency
There exist many kinds of definitions for energy efficiency. One can cite: (i) fuel
efficiency, (ii) fuel economy and (iii) fuel consumption. Moreover, energy efficiency in
transportation is a relative term used to describe how effectively fuel is used to move
a vehicle. The fuel efficiency is connected to the amount derived from the used fuel.
Fuel economy is expressed as miles per gallon of consumed fuel. Fuel consumption is
the inverse of fuel economy. It refers to the fuel consumed by the vehicle or type of
transport as it travels a given distance. Widely used in the Europe (expressed in liters
per 100 km), this metric is a clearer measure of fuel than the fuel economy (“real future
energy efficiency in USA”, p.121). For wide source of study in energy efficiency, I traced
many possibilities from previous research works, included related references. I noticed
that all studies listed closer to energy efficiency development in certain perspectives. Our
research is discussing the energy efficiency in global supply chain in the three identified
dimensions that are production, transportation, and warehousing. The objective is to
formalize a model aiming at optimizing energy consumption throughout supply chain for a
minimal environmental impact (energy efficiency). Referring to Wei et al. (2011), Varma
and Clayton (2010), and Hall Dorson (2013) explained that efficiency means: “doing
things in an optimal way, for example; doing it the fastest or inexpensive way and it was
done by optimal ways. In other words: “efficiency refers to how well something is done.
Effectiveness refers to how useful something for certain business purpose.” For example,
a car is a very effective form of transportation mode and able to move people across
long distances, to specific places, but a specific car may not transport people efficiently
because of the way how to consume the fuel. The driving style (eco-driving) is one of the
important variable when utilizing vehicles. To set the context of our research work, we,
first, attempt to give a definition of global supply chain as follows: all process networks
that procure raw materials, transform into intermediate goods, and produce final products
at a global level. Then, to deliver the products to customers through a global distribution
systems, Albino et al. (2002). The aim of the dissertation is to achieve the link between

15
supply chain, logistics and energy matter. The developed concept is that the competition
is not only achieved by a good supply chain. But, also the energy matter is managed as
an engine source of business development. However, the competition can be achieved in
any other forms. Following the question also, how the energy efficiency work well in a
global supply chain? The major research question is how the energy efficiency strategy
is applied to the three dimensions of global supply chain, therefore authors applied the
research work on:
A. research design of the energy efficiency for the transportation function. B. research
design of the energy efficiency for the production function. C. research design of the
energy efficiency for the warehousing function.
Kotzab et al. (2005), explained that the research methodologies in supply chain man-
agement are mainly focusing on who, what, where, why, and how, this perspective is a
part of one of my work to explain these issues. Perlmutter (1969), has identified three
positions on the globalism spectrum. Geo-centrism, as de- fined earlier, represents the
highest degree of integration and the highest degree of globalization. Poly- centrism is
associated with a worldwide presence, but operations in the multiple locations are largely
independent of one another. Ethnocentrism is also associated with a worldwide presence,
but in this profile the focus of the organization is the home country. Other possibilities,
regional operations that serve multiple countries. Based on the three dimensions of global
supply chain; we can distinguish the business activities connected to global value or not.
This definition is the key aspect before we run down the best definition of global business
as usual.
Dissertation’s Objective
The research work detailed on the supply chain from top to bottom contains:
- efficiency production management, - efficiency transportation management, - effi-
ciency warehousing management.
The figure 0.0.1 shows that the energy efficiency strategy concept can be derived to
understand the global supply chain whole agenda and issues. Three dimensions defines
the objective that is the specification of the consumed energy. We need to specify how to
manage energy consumption at (i) strategic level, (ii) logistics level, and (iii) operational
level in order to drive the company to solve the problem directly linked to the core of
the problem. For example, time windows scheduling, negotiating market price, dealing
with technical problems. The most important one is how the flow of energy efficiency
strategy in global supply chain can face hyper competition. Through, transportation,
production, and warehouse. We can make identification of all competitors, collecting in-
formation data and focusing on the selection of energy sources. There- fore, the company
can prepare anything before launching its capacity level on hyper-competition. The link
between backward and forward linkage process should be run in a very efficient method
up to the product delivery to all end users, without any fail. Particularly, in the trans-
portation it is interesting to show, that the total company sales volume influenced by
the geographical market sales areas (distance), time, type of product, and speed of truck.

16
Mapping all distance areas, total volume or total sales (price) are importance key factors.
Another purpose is to argue that expensive product is more correlated with long dis-
tances. On these parameters, the company will run well in the competitiveness to sustain
its business. The research work gave a new perspective for transportation industries by
setting up a new strategy on managing their own fuel consumption with a basis on the
concept of energy efficiency. The work was based on the area of the transportation of oleo
chemicals business as a case study. As a spotlight in this research, EU and particularly
France should be more efficient in transportation performance and their availability to
promote oleo chemicals business once some best practices are identified with regards to
the energy efficiency in all transportation operations. For example, as follows: To evalu-
ate outcomes by the consensus agreement of stakeholders. Otherwise, the valuation can
only be considered to be that of the experts and decision-makers alone: This idea refers
to the fact that a technologically complex system is often embedded within a complex
institutional structure. This added dimension of complexity is what makes the design and
management of an engineering system a great challenge. More information studies can be
found at company’s perspective in energy efficiency in global supply chain Bertrand and
Fransoo (2002), explained empirical scientific research should be carefully distinguished
from axiomatic research results within the projects improvement. Therefore, improving
the performance underlying process models are valid and the theoretical solutions are
useful to solve the problem. So, we can elaborate, the empirical scientific research tests to
demonstrate the validity of the theoretical models. The methodology’s design has been
constructed based on the development of existing research question and problem. Particu-
larly, on energy efficiency in global supply chain. However, case studies can be an excellent
study to test the existing problem. Because, by certain case studies we can looked up
the progress of theoretical perspective and existing real problem, Bertrand and Fransoo
(2002) and Aminata et al. (2014c). Also, in the dimension of production gave us a lot of
ideas and we can deliver case studies in various aspect and industrial sector. These works
shows that in production dimension, authors easily found, constructed, and formulate
the raw data base became ready for use for research purpose. The nuclear power plant
could be one of the best example here to produce electricity output. Pro- viding global
supply chain materials to support availability of electricity source by nuclear power is an
excellent example, see IEA (2011); IEC MSB (2011), also see Dagpunar (2007); Depoues
et al. (2015). However, by input output analysis will be a strong analysis to promote
the strength of backward and forward linkage, especially in manufacturing sectors. The
availability of data base is one of indicator to successful on database construction, see
Miller and Blair (2009) and Aminata et al. (2014e), also see Wood (2013); Wu et al.
(2012). To point out warehousing dimension refer to energy efficiency in global supply
chain shows that authors a bit difficult to construct the data. Especially, real time data
that connected to global connection. However, by latest technology and financial innova-
tion the bitcoin mining (cryptocurrency) is the best example to construct the perspective
within warehousing dimension, see Dagpunar (2007), also see Wilson and Giligan (2005).

17
The research question can be formulated as follows:
Major research question: - how to formulate energy efficiency in global supply chain
and its impact on the enterprise-business development (MNCs) ? The energy efficiency
gives impact in any sector of business activities. Based on the concept of efficiency
by Archer (2010), explained that the future is now. Most of the people need efficient
society, especially energy efficiency in global supply chain. To make answer the question
of efficiency philosophy which is a need formulation of the harmony system in all type
of business. Therefore, I constructed the major research question and minor research
question. Complementary research questions:
• how to build up energy efficiency in a case of transportation in global supply chain
and its impact on their enterprise-business development?
• how to build up energy efficiency in a case of production in global supply chain and
its impact on their enterprise-business development?
• how to build up energy efficiency in a case of warehousing in global supply chain
and its impact on their enterprise-business development?
Starting hyper competition discussion in energy efficiency within global supply chain.
I delivered some approval from scientific papers done in previous years. Also, research
work in global supply chain should be connected to hyper competition to know the real
impact in business development, Grandval and al. (2009). First of all, dimension of en-
ergy efficiency could be seen from three dimensions, Sbihi and Eglese (2007); supply chain
dimension (strategic level), especially in long term. Logistics dimension (tactical level)
is in medium term. Operations management dimension (day to day term). The compe-
tition level in transportation system, production, and warehouse system cannot be seen
as part of business. For example production system in oleo chemical and electricity level.
However, there is no single judgment that all kind of type business activities can be seen
as hyper competition. All transportation in the first step making an offering to company
for transportation services. Due to, there are a lot offers from many companies. The oleo
chemical company offering the bidding system to find out the most cheapest price among
them (ex: transportation services which provided by other supplier). Hyper competition,
Akhter (2003), Hulsmann et al. (2008), and Sandberg and Abrahamsson (2011), global
supply chains (GSCs) are confronted with the phenomenon of hyper competition. For
this reason, there seems to be an increasing necessity for GSCs to build up competitive
advantage in order to survive. Strategic exibility is assumed to have positive effects on
generating required competitive advantage by replicating and reconfiguring competences
to manage GSCs, while keeping GSCs stable, Sandberg and Abrahamsson (2011). Using
a theoretical framework, this research elaborates the link between operational, dynamic
logistics capabilities and sustainable competitive advantage. The findings conclude that
a sustainable competitive advantage is based on a combination of efficient and effective
logistics operations, see more Shay and Rothaermel (1999), Hauswirth et al. (2004), Den-
tico (1999), Farahani (2009), and Bironneau et al. (2015). Gereffi and Lee (2012), state

18
that global supply chains have been a familiar part of the international business landscape
for decades. From a management perspective, there are always issues connected with the
efficient and timely distribution of goods that flow across supply chains. From an industry
perspective, there are questions on how the industry is organized in terms of the size and
ownership of major manufacturers and their suppliers, and where these companies are
located. From a national competitiveness perspective, countries are concerned whether
they can gain and maintain the production, sales and research capabilities needed to de-
velop and make low-cost, high-quality or high-tech products (Pisano and Shih 2009). As
the ability of countries to prosper depends on their participation in the global economy,
which is their role in global supply chains. Despite its relevance on many levels, the liter-
ature on global supply chains tends to appear in a specialized set of publications oriented
to a business audience. However, since the early 2000s, the global value chain concept
has gained popularity as a way to analyze the international expansion and geographical
fragmentation of contemporary supply chains. Further studies on CSR and energy ef-
ficiency can be traced on Pirsch et al. (2006),Crowther and Aras (2008),Crowther and
Aras (2009),Visser et al. (2010). Finally; Crowther and Aras (2008) stated the principles
of CSR;
• on sustainability is means that all action based on all options available for future
needs.
• on accountability is means that both internal and external responsibilities of orga-
nization.
• on transparency is means that all stake holders can access the information.
The research design in this section is to design all possibilities, how to work in an
inter-firm and an inter-stakeholder, including how to manage the relationship with the
local or regional government, moreover at national level. Collecting and delivering all
questioners needs a team collaboration, that is the point to have a good degree of infor-
mation. The degree is the score value collected from customer or all stakeholders. As
Persson (1991) stated; (i) the best competitor in strong competition is materials flow
segment. It shows cost-effective in the business. (ii) the new competitor has a superior
logistics performance. So that, the implication is the logistics performance can be seen as
a strategy driver. This view is suit- able in logistics service as a significant element and
by developing effectiveness in basic operational capabilities. Abrahamsson et al. (2003),
exposed that in the type of three logistics towards external relations in the supply chain
shows the link from producer to final customer. If production is used as a buffer stock.
Therefore, logistics has to carry out a speculation stock to support marketing expansion,
Also, Abrahamsson et al. (2003) p. 88, explained that if there is a change of size market
the logistics need as a resource to support new marketing or production strategies. The
type of three logistics must be able to support the firm, then it can be formulated as
strategic decision. Furthermore, the logistics function should be able to support kind of

19
strategies such as: broadening of assortment, additional marketing channels, geographical
expansion, support global customers, expansion by company acquisitions and downsizing.
He has defined logistics platform in type three logistics which centrally manages and
controls. The logistics platform included the concept of logistics operations, physical
structure, processes and its activities as well as the information systems, operations and
reporting. Abrahamsson et al. (2003) p. 104., delivered the scheme of design to formulate
the energy efficiency intelligence for global supply chain transportation by empowering
international logistics and its opportunity for pro- moting market and economic activities
Based on an assumption that improving industrial development will have impact on the
environ- ment, ie. pollution level (C02). Developing supply chain strategy will face on
complexity problems and challenges for enhancing business development at global level. A
lot of sociological aspects of global business can be traced back to the article of Perlmutter
(1969). Especially on his article referred to the evolution of the multinational corpora-
tion. On multinational corporation existed worldwide approach in both headquarters and
subsidiaries. The firm as a whole concentrate on worldwide objectives as well as local
objectives. The point here is in each part contributes to the unique competence. Dick-
ens (1998), providing the transport from their country of origin to the country of which
market at international level. They utilized six categories (management teams, strategy,
operations and products, R and D, financing and marketing), which each of them consists
of multiple dimensions:
• global is synonymous with international.
• global strategy means doing the same thing everywhere.
• globalizing means becoming stateless, with no ties to a home country.
• globalizing requires abandoning images and values of a home country.
• globalizing involves acquisitions without integration.
• a firm must engage in foreign country to be considered global.
The conclusion shows that all findings have significant results. Precisely, the man-
agement strategy should be the key concept for long period to promote three dimension
in transportation, production, and warehouse. It has to refer on the concept of manage-
ment in energy efficiency. Utilizing straight forward point analyzed for all cases studies
shown that the point of global supply chain must be established by strong chain for each
business activities. Furthermore, energy efficiency also push us for greening management
strategy. Back to all dimensions in this works: I delivered some conclusion that matched
with current issues of greening effort which matched to Mathers (2015): 1. by setting
up the performance goals for improving the quality of environment via management ap-
proach. 2. by tracking logistics emission should as a reference for a standard practice.
Also, improving the the tracking performance by various indicators and methodology. 3.
by seeking and building the external factor so called a leadership practice. Discussing

20
in energy issues, particularly on energy efficiency which creating efficiency output level
must be coherence and high linkages from backward and forward linkages. Especially for
global market and global product should be traced. Focusing on energy used for each
business activities is useful one. Therefore, all products assured by using energy intensity
and global supply chain properly. By optimizing energy source in proper way, it would
be give minor impact on environmental. This is the main idea for increasing industrial
intensity with small environmental impact. So that, using CSR’s matrix will contribute
the knowledge capacity to the global business and global community. However, from the
management side shows that the management strategy is a role play for promoting en-
ergy efficiency in scale and geographical areas. By establishing and constructing a strong
logistics and well-connected global supply chain will enhance global supply chain perfor-
mance. Mathematical approach and statistical approaches shown technicals on energy
efficiency calculation. The innovation of this research is the discussion through corporate
social responsibility and energy efficiency. It seemed that enterprises or small, medium
even large size of company for future competition, as D’aveni (1995). It should be able to
handle energy efficiency. Moreover, energy efficiency as one of tool to know company is
efficient or not. Finally, the energy efficiency in global supply chain shows that efficiency
energy in global level could be perform by any type of product, mainly on energy matter.
By focusing on how to transport them, the way of production system, and how to build
warehouse system to keep source of energy become more efficient to serve inter-links of
chain and end users.

Chapter 1
Framework
Three main supply chain functions that are production, transport and warehousing at
global level where the energy consumption is a major issue to maintain a high level of
several outputs. We intend to develop and show how the concept of energy efficiency is
in critical pressure for energy global supply chain. Because, the sustainability of energy
supply chain is the key part of business activities, moreover for human needs.
1.1 CSR - Risk Management Concept
Friedman, 1970 stated an example about investment in the local community:”It will be in
the long run interest of a corporation that is a major employer in a small community to
devote resources to provide amenities to that community or to improve its government.
That makes it easier to attract desirable employees, it may reduce the wage bill or
have other worthwhile effects.
Concerning the CSR and risk management theory and its application must be inter-
connected well. Because, in the long term the company will take care of action which
correlated with all consequences by all business activities. These activities, particularly
in CSR aspect gave much influenced on environmental aspects mainly in the business of
natural resources. Why do we concerned for these matters, due to business in natural
resources exploited a lot of environmental impacts. Both positive and negative actions
and their impacts on communities, company and regional development.
Naturally, risk management concept delivered to clients even to stake holders before
launching the project or business project. The aims is to know more about the size of
impact. Also, how much the business action can be sustain to maintain their business
sustainability.
However, it can not be neglect by any company which concern about their sustainabil-
ity and high competition level. So that, in table, below shows about the CSR theories and
approaches to enhance about management strategy and what kind of action to compete
with other companies based on strategies and existing conditions.
21

22 CHAPTER 1. FRAMEWORK
Tab
le1.1:
CSR
Theories
andApproaches-1
Source:Journal
ofBusinessEthics53
:51
–71,
2004
.Kluwer
Academ
icPublishers.

1.1. CSR - RISK MANAGEMENT CONCEPT 23
Tab
le1.2:
CSR
Theories
andApproaches-2
Source:Journal
ofBusinessEthics53
:51
–71,
2004
.Kluwer
Academ
icPublishers.

24 CHAPTER 1. FRAMEWORK
Jensen (2000) has proposed what he calls ‘enlightened value maximization’. We can
conclude that most of current CSR theories are focused on four main aspects:
1. using business power in a responsible way
2. integrating social demands
3. long term profits oriented
4. contributing to a good society. The most relevant theories on CSR and related
concepts into four groups; instrumental, political, integrative and value theories.
Overview: The energy consumption is a major issue to maintain a high level product.
The concept of energy efficiency is the principal part in global supply chain, . Many
questions are possibly and legitimately to ask:
1. Economic side,
2. Environmental side,
3. Social side,
4. Political and Geopolitical pattern.
5. Tax Policy
Figure 1.1: The Whole Framework for Institutional Organization

1.1. CSR - RISK MANAGEMENT CONCEPT 25
Therefore, based on the literature review and what they are the real life problems,
my methodology aims at studying the concepts are figured out in this work. To figure
out all these research questions, I have read a literature review to examine all up to
date references and bibliography in order to support the understanding and knowledge of
the energy efficiency concept in the global supply chain. The logical arguments can be
redesigned in all ways that are methodologically accepted. The path ways of our thinking
can be described as follows:
Figure 1.2: The Way of Thinking
The general issues have been taken from real business cases and the literature reviews.
However, there are a lot of arguments that can lead the energy efficiency on significant
other ways.
The most difficult here is how to make an approval that energy efficiency has been
approved in production, warehousing and transportation.
The basic idea in the initial stage is to reduce the CO2 pollution by reducing the
amount of CO2 emissions yearly. The indicator of CO2 will decrease if there is energy
management.
The energy management shows on energy efficiency indicator. The efficiency indicator
shows on single manufacture, region, national or international agreements. On the other
hand, if there is efficiency energy in micro level then it would be easier to meet with energy
efficiency at national level, even at the international level. There are a lot of indicators
showing how to know and to measure the energy efficiency.
If an enterprise or a manufacture have been allocated all resources in efficiency ways,
then the manufacture will create the price competitiveness. By the price competitiveness,
the enterprise can create the competition. Starting from basic competitiveness in price
scale, the enterprise can also go further up to hyper competition.

26 CHAPTER 1. FRAMEWORK
The hyper competition is built up from the basic matter, namely CO2 efficiency or so
called minimizing the CO2 pollution. In a general point of view, is how to produce, to
manage the storage and to deliver to the end users. This argument is also supported by
the concept of the social responsibility of the enterprise.
The purpose of CSR in responsibility level is undertaken by the company to deal with
the pollution level.
Also explains which set of criteria for environmental indicators is to consider. All
requirements indicators could be energy resources type with regards to the method of
product deliveries, etc. Every single product should be distinguished and considered as a
potential pollutant for the environment which all the problems can arise from the enter-
prise operations and business activities. At the final enterprise operations, the company
has also to deal with the corporate social responsibility. Otherwise, the future of business
development will suffer from hyper competition and a big future prospect.
Figure 1.3: The Flowchart of General Idea
The hyper competition is built up from the basic matter, namely CO2 efficiency or
the so called minimizing the CO2 pollution. In a general point of view, is how to produce,
to manage the storage and to deliver to the end users. This argument is also supported
by the concept of the social responsibility of the enterprise. The purpose of CSR in
responsibility level is undertaken by the company to deal with the pollution level. Also
explains which set of criteria for environmental indicators is to consider. All requirements
indicators could be energy resources type with regards to the method of product deliveries,
etc. Every single product should be distinguished and considered as a potential pollutant
for the environment which all the problems can arise from the enterprise operations and
business activities. At the final enterprise operations, the company has also to deal with
the corporate social responsibility. Otherwise, the future of business development will

1.2. ORGANIZATION OF CSR MANAGEMENT 27
suffer from hyper competition and a big future prospect.
Figure 1.4: The Sample Work on CSR
It shows that from the dimensions of production, transportation and warehousing, one
can describe the energy efficiency scheme. The initial idea is that the production procedure
has to be executed in efficient manner, and particularly from the energy efficiency point of
view within the production process, followed by an efficient energy consumption within the
warehouse management process and followed by an efficient transportation for delivering
products.
Figure 1.5: The Framework of Energy Efficiency
1.2 Organization of CSR Management
In order to get better understanding the managerial level and technical level are necessary
to investigate them. Authors applied and got closer to the gap of managerial and technical
problems. So that, all research works approached by bibliography and related references
were intensively explored and exploited for the development of our research method. One
can also recall that many research works cleared get similarities and in various methods,
used methodologically the procedures, White (2009), Wilson and Gilligan, (2005), p.
406. The general purpose of the literature review for some extent will provide conceptual
development, research question based on the real condition and simulation possibilities,
White (2009), Mouton and Marais (1996), and Hillier and Hillier, (2003). The objective
of the of literature review is Ridley (2012): 1. to prevent from duplication, 2. the general

28 CHAPTER 1. FRAMEWORK
body of knowledge, 3. to help the design of original research, 4. to reveal the conceptual
problem based on assumptions.
In general, there are many kinds of definitions for energy efficiency. One can cite: (i)
fuel efficiency, (ii) fuel economy and (iii) fuel consumption. Moreover, energy efficiency
in transportation is a relative term used to describe how effectively fuel is used to move
a vehicle. The fuel efficiency is connected to the amount derived from the used fuel.
Fuel economy is expressed as miles per gallon of consumed fuel. Fuel consumption is the
inverse of fuel economy. It refers to the fuel consumed by the vehicle or type of transport
as it travels a given distance. Widely used in the Europe (expressed in liters per 100
km), this metric is a clearer measure of fuel than the fuel economy (“real future energy
efficiency in USA”, p.121). For wide source of study in energy efficiency, I traced many
possibilities from previous research works, included related references. I noticed that all
studies listed are closer to energy efficiency development in certain perspectives.
Our research is discussing the energy efficiency in global supply chain in the three
identified dimensions that are production, transportation, and warehousing. The objective
is to formalize a model aimining at optimizing energy consumption throughout supply
chain for a minimal environmental impact (energy efficiency). Referring to Wei et al.
(2011), Varma and Clayton (2010), and Halldorsson and Svanberg (2013) explained that
efficiency means: “doing things in an optimal way, for example; doing it the fastest or
inexpensive way and it was done by optimal ways. In other words: “efficiency refers
to how well something is done. Effectiveness refers to how useful something for certain
business purpose?” For example, a car is a very effective form of transportation mode and
be able to move people across long distances, to specific places, but a specific car may
not transport people efficiently because of how it is consuming fuel. The driving style
(eco-driving) is one of the important variable when utilizing vehicles.
To set the context of our research work, we, first, attempt to give a definition of global
supply chain as follows: all process networks that procure raw materials, transform into
intermediate goods, and produce final products at a global level. Then, to deliver the
products to customers through some global distribution systems, Albino et al.(2002).
The aim of the dissertation is to achieve the link between supply chain, logistics and
energy matter. The developed concept is that the competition is not only achieved by a
good supply chain, but, also the energy matter is managed as an engine source of business
development.
1.3 Institutional Organization
However, the competition can be achieved in any other forms. Following the question
also, how the energy efficiency works well in a global supply chain? The major research
question is how the energy efficiency strategy is applied to the three dimensions of global
supply chain, therefore we have applied the research work on:
• research design of the energy efficiency for the transportation function,

1.3. INSTITUTIONAL ORGANIZATION 29
• research design of the energy efficiency for the production function,
• research design of the energy efficiency for the warehousing function.
Kotzab et al. (2005), explained that the research methodologies in supply chain man-
agement are mainly focusing on who, what, where, why, and how. This perspective is a
part of one of my work to explain these issues.
Perlmutter (1969), has identified three positions on the globalism spectrum. Geocen-
tricism, as defined earlier, represents the highest degree of integration and the highest
degree of globalization. Ethnocentrism is associated with a worldwide presence, but oper-
ations in the multiple locations are largely independent of one another. Ethnocentrism is
also associated with a worldwide presence, but in this profile the focus of the organization
is the home country. Other possibilities, regional operations that serve multiple countries.
Based on the three dimensions of global supply chain; we can distinguish the business
activities connected to global value or not. This definition is the key aspect before we run
down the best definition of global business as usual.
Dissertation’s Objective
The research work detailed on the supply chain from top to bottom contains:
- efficiency production management, - efficiency transportation management, - effi-
ciency warehousing management.
The figure 0.0.1 shows that the energy efficiency strategy concept can be derived to
understand the global supply chain whole agenda and issues.
Three dimensions defines the objective that is the specification of the consumed energy.
We need to specify how to manage energy consumption at (i)strategic level, (ii)logistics
level, and (iii)ope- rational level in order to drive the company to solve the problem
directly linked to the core of the business model. For example, time windows scheduling,
negotiating market price, dealing with technical problems.
The most important one is how the flow of energy efficiency strategy in global supply
chain can face hyper competition through transportation, production, and warehouse.
We can make identification of all competitors, collecting information data and focusing
on the selection of energy sources.
Therefore, the company can prepare anything before launching its capacity level on
hyper-competition. The link between backward and forward linkage process should be
run in a very efficient method up to the product delivery to all end users, without any
fail. Particularly, in the transportation it is interesting to show, that the total company
sales volume influenced by the geographical market sales areas (distance), time, type of
product, and speed of truck. Mapping all distance areas, total volume or total sales (price)
are importance key factors. Another purpose is to argue that expensive product is more
correlated with long distances. Based on these parameters, the company will run well in
the competitiveness to sustain the business.
The research work gave a new perspective for transportation industries by setting up
a new strategy on managing their own fuel consumption with a basis on the concept of

30 CHAPTER 1. FRAMEWORK
Figure 1.6: Energy Efficiency in Global Supply Chain
energy efficiency. The work was based on the area of the transportation of oleo chemicals
business as a case study. As a spotlight in this research, EU and particularly France
should be more efficient in transportation performance and their availability to promote
oleo chemicals business once some best practices are identified with regards to the energy
efficiency in all transportation operations. As in Energy Efficiency: A Compelling Global
Resources, McKinsey, 2010, p.35.
This idea refers to the fact that a technologically complex system is often embedded
within a complex institutional structure. This added dimension of complexity is what
makes the design and management of an engineering system a great challenge. More
information studies can be found at company’s perspective in energy efficiency in global
supply chain.
Bertrand and Fransoo (2002), explained empirical scientific research should be care-
fully distinguished from axiomatic research results within the projects improvement.
Therefore, improving the performance underlying process models are valid and the the-
oretical solutions are useful to solve the problem. So, we can elaborate, the empirical
scientific research tests to demonstrate the validity of the theoretical models.
The methodology’s design has been constructed based on the development of existing
research question and problem. Particularly, on energy efficiency in global supply chain.
However, case studies can be an excellent study to test the existing problem. Because,
by certain case studies we can have looked up the progress of theoretical perspective and
existing real problem, Bertrand and Fransoo (2002).

1.3. INSTITUTIONAL ORGANIZATION 31
Figure 1.7: Freight Transportation
Also, the dimension of production gave us a lot of ideas and we can deliver case stud-
ies in various aspect and industrial sectors. These works shows that in the production
dimension, authors easily found, constructed, and formulate the raw data base that be-
comes ready for use for research purpose. The nuclear power plant could be one of the
best example here to produce electricity output. Providing global supply chain materials
to support availability of electricity source by nuclear power which an excellent example,
see Board (2011), also see Dagpunar (2007); Depoues et al. (2015).
However, input output analysis will be a strong analysis to promote the strength of
backward and forward linkage, especially in manufacturing sectors. The availability of
data base is one of indicators to successful database construction, see Miller and Blair
(2009) and, also see Wood (2013); Wu et al. (2012).
To point out warehousing dimension referring to energy efficiency in global supply
chain shows a big difficulty to construct the data. Especially, real time data is linked
to global connection. However, by latest technology and financial innovation the bitcoin
mining (Cryptocurrency) is the best example to construct the perspective within ware-
housing dimension, see Dagpunar (2007), also see Wilson and Giligan (2005). However,
bitcoin mining is still close to the dimension of production (part of warehousing which
consumed electricity).
We tried to deliver for initial research work intra region in France, especially energy
efficiency among hypermarket warehousing. So that, we proposed this possibility at intra-
region, see Mannino et al. (2008) and Gokce and Gokce (2013). Because, at this moment
we had difficulty for data construction at global level.
We have to create conceptual model to understand the details of refresh processes
including constraints on data sources and data ware-houses. In related work is notable
to emphasis on data quality. These conceptual representations and architectures provide

32 CHAPTER 1. FRAMEWORK
the proper size of hypermarket size. By proper sizing the evaluating operational efficiency
can be identified. Younger (1995), Pope (2010), We delivered here the type of surface and
also we gave the definition: 1).hypermarket, 2). gallery, 3).supermarket, 4).magazine.
Figure 1.8: The Flow Chart of Methodology-Part A
The research question can be formulated as follows: Major research question: -
how to formulate energy efficiency in global supply chain and its impact on the enterprise-
business development (MNCs)?
The energy efficiency gives impact in any sector of business activities. Based on the
concept of efficiency by Archer (2010), explained that the future is now. Most of the
people need efficient society, especially energy efficiency in global supply chain. To make
answer the question of efficiency philosophy which is a need formulation of the harmony
system in all type of business. Therefore, I constructed the major research question and
minor research question.
Complementary research question:
• how to build up energy efficiency in a case of transportation in global supply chain
and its impact on their enterprise-business development?

1.3. INSTITUTIONAL ORGANIZATION 33
Figure 1.9: The Flow Chart of Methodology-Part B
• how to build up energy efficiency in a case of production in global supply chain and
its impact on their enterprise-business development?
• how to build up energy efficiency in a case of warehousing in global supply chain
and its impact on their enterprise-business development?
Starting hyper competition discussion in energy efficiency within global supply chain. I
delivered some approval from scientific papers done in previous years. Also, research work
in global supply chain should be connected to hyper competition to know the real impact
in business development, Grandval (2009). First of all, dimension of energy efficiency
could be seen from three dimensions, Sbihi and Eglese (2007); supply chain dimension
(strategic level), especially in long term. Logistics dimension (tactical level) is in medium
term. Operations management dimension (day to day term).
The competition level in transportation system, production, and warehouse system
cannot be seen as part of business. For example, production system in oleo chemical
and electricity level. However, there is no single judgment that all kind of type business
activities can be seen as hyper competition. All transportation in the first step making
an offering to company for transportation services. Due to, there are a lot offers from
many companies. The oleo chemical company offering the bidding system to find out the
cheapest price among them (ex: transportation services which provided by other supplier).

34 CHAPTER 1. FRAMEWORK
Hyper competition, Akhter (2003), Hulsmann et al. (2008), and Sandberg and Abra-
hamsson (2011), global supply chains (GSCs) are confronted with the phenomenon of
hyper competition. For this reason, there seems to be an increasing necessity for GSCs
to build up competitive advantage in order to survive. Strategic exibility is assumed
to have positive effects on generating required competitive advantage by replicating and
reconquering competences to manage GSCs, while keeping GSCs stable, Sandberg and
Abrahamsson (2011).
Using a theoretical framework, this research elaborates the link between operational,
dynamic logistics capabilities and sustainable competitive advantage. The findings con-
clude that a sustainable competitive advantage is based on a combination of efficient
and effective logistics operations, see more Shay and Rothaermel (1999), Hauswirth et al.
(2004), Dentico (1999), Farahani (2009), and Bironneau et al. (2015).
1.3.1 Management Strategy on CSR and Risk Management
Gereffi and Lee (2012), state that global supply chains have been a familiar part of the
international business landscape for decades. From a management perspective, there
are always issues connected with the efficient and timely distribution of goods that flow
across supply chains. From an industry perspective, there are questions on how the
industry is organized in terms of the size and ownership of major manufacturers and
their suppliers, and where these companies are located. From a national competitiveness
perspective, countries are concerned whether they can gain and maintain the production,
sales and research capabilities needed to develop and make low-cost, high-quality or high-
tech products (Pisano and Shih 2009).
As the ability of countries to prosper depends on their participation in the global
economy, which is their role in global supply chains. Despite its relevance on many levels,
the literature on global supply chains tends to appear in a specialized set of publica-
tions oriented to a business audience. However, since the early 2000s, the global value
chain concept has gained popularity as a way to analyze the international expansion
and geographical fragmentation of contemporary supply chains. Further studies on CSR
and energy efficiency can be traced on Pirsch et al. (2006),Crowther and Aras (2008),
Crowther and Aras (2009), Visser et al. (2010). Finally; Crowther and Aras (2008) stated
the principles of CSR; • on sustainability is means that all action based on all options
available for future needs. • on accountability is means that both internal and external
responsibilities of organization. • on transparency is means that all stake holders can
access the information. The research design in this section is to design all possibilities,
how to work in an inter-firm and an inter-stakeholder, including how to manage the re-
lationship with the local or regional government, moreover at national level. Collecting
and delivering all questioners needs a team collaboration, that is the point to have a
good degree of information. The degree is the score value collected from customer or all
stakeholders.

1.3. INSTITUTIONAL ORGANIZATION 35
1.3.2 Organization Management to Support CSR - Risk Man-
agement
As Persson (1991) stated; (i) the best competitor in strong competition is materials flow
segment. It shows cost-effective in the business. (ii) the new competitor has a superior
logistics performance. So that, the implication is the logistics performance can be seen
as a strategy driver. This view is suitable in logistics service as a significant element and
by developing effectiveness in basic operational capabilities. Abrahamsson et al. (2003),
exposed that in the type of three logistics towards external relations in the supply chain
shows the link from producer to final customer. If production is used as a buffer stock.
Therefore, logistics has to carry out a speculation stock to support marketing expansion,
Also, Abrahamsson et al. (2003) p. 88, explained that if there is a change of size market
the logistics need as a resource to support new marketing or production strategies. The
type three logistics must be able to support the firm, then it can be formulating as
strategic decision. Furthermore, the logistics function should be able to support kind of
strategies such as: broadening of assortment, additional marketing channels, geographical
expansion, support global customers, expansion by company acquisitions and downsizing.
He has defined logistics platform in type three logistics which centrally manages and
controls.
Figure 1.10: Type of Logistics Model
The logistics platform included the concept of logistics operations, physical structure,

36 CHAPTER 1. FRAMEWORK
processes and its activities as well as the information systems, operations and reporting.
Abrahamsson et al. (2003) p. 104., delivered the scheme of design to formulate the energy
efficiency intelligence for global supply chain transportation by empowering international
logistics and its opportunity for promoting market and economic activities.
Based on an assumption that improving industrial development will have impact on
the environment, ie. pollution level (C02). Developing supply chain strategy will face on
complexity problems and challenges for enhancing business development at global level. A
lot of sociological aspects of global business can be traced back to the article of Perlmutter
(1969). Especially on his article referred to the evolution of the multinational corporation.
On multinational corporation existed worldwide approach in both headquarters and
subsidiaries. The firm as a whole concentrate on worldwide objectives as well as local
objectives. The point here is in each part contribute to the unique competence. Dickens
(1998), providing the transport from their country of origin to the country of which market
at international level.
They utilized six categories:
1. management teams,
2. strategy,
3. operations and variation of products,
4. R and D,
5. financing and marketing.
Bartlett and Ghoshal (1989) defined multiple dimensions to identify a firm’s position
on the multi-national to complex global chain. Kanter and Dretlet (1998) attempted to
define what global really means. Their approach is to identify six aspects:
• global is synonymous with international,
• global strategy means doing the same thing everywhere,
• globalizing means becoming stateless, with no ties to a home country,
• globalizing requires abandoning images and values of a home country,
• globalizing involves acquisitions without integration,
• a firm must engage in foreign country to be considered global.

Chapter 2
Literature Review
In this research, we investigate three main supply chain functions that are production,
transport and warehousing at global level where the energy consumption is a major issue to
maintain a high level of several outputs. We intend to develop and show how the concept
of energy efficiency is critical for global supply chain. Many questions are possibly and
legitimately to ask and investigate even in interdisciplinary approaches.
2.1 Overview
Martin (2005) stated; “logistics is the process of strategically managing the procurement,
movement and storage of materials, parts and finished inventory through the organization
and its marketing channels. In such a way that current and future profitability are
maximized via cost-effective of orders.”
Figure 2.1: The Experience Curve, Source: Martin M., 2005
Some literatures review listed below shows evidents:
1. William Stanley Jevons, (1865), the objective is observed that technological im-
provements that increased the efficiency of coal-use led to the increased consump-
tion of coal in a wide of range of industries. He argued that, contrary to common
37

38 CHAPTER 2. LITERATURE REVIEW
intuition of technological progress couldn’t be relied upon to reduce fuel consump-
tion. Study focus: Consumption rebound effect from improved energy efficiency.
Key findings: Technological progress that improves energy efficiency will tend to
increase overall energy use. People will make and buy new products as efficiency
improvement enables “progress” to spread to other industries. Any sort of efficiency
gains, at least the same amount of flour, worker, energy, ability, and tools remain.
Paralleling “Jevons profitability” argument, he notes that capital gets formed only
if greater production and capital formation is a fact.
2. Joseph Schumpeter, (1911), objective is how to describe or making a new com-
bination are condition for profitability. Study focus: efficiency and profitability.
Methods: using Lauderdale’s example of the loom. Key findings: Surpassing single-
sector analysis and taking the marginal consumer seriously. The demonstration
growth effects of the “perfectionism de les arts”. the findings shown paradoxical
matter which the augmentation of “employment and population”.
3. M.G. Patterson, (1911), the objective is energy efficiency and its conceptual. Study
focus: What is energy efficiency: concepts, indicators and methodology. Methods:
Methodological issues. Key findings: The role of value judgments in the construction
of energy efficiency indicators, the energy quality problem, the boundary problem,
the joint production problem and the question of isolating the underlying technical
energy efficiency trend from the aggregate indicator.
4. Blake Alcott, (2005), the objective is Jevons paradox. Methods: Survey. Key find-
ings: Today ecological economics must give advice on this surely not un answerable
question. The impact growing rapidly, but a firm consensus is lacking. Certainly,
theoretical work must see whether the environmental “efficiency strategy” is rec-
oncilable with standard growth theory. One conclusion can be delivered if Jevons
is right. Then efficiency policies are simply counterproductive. Even taxes on fuel
or CO2 will be compensated by efficiency increases, and moreover they face the
problem that tax revenue also gets spent on material and energy. Additional critics:
“Inelastic Demand for Work. A doubling of fuel efficiency does not double work
demanded, the amount of fuel used decreases. Jevons paradox does not occur”.
5. Capehart et all, (2007), the objective is to guide energy management. Study focus:
improving energy management. Methods: survey. Key findings: covers many oper-
ations from services to product and equipment design through product shipment.
6. Steve Sorrell, (2009), the objective is Jevons paradox revisited: the evidence for
backfire from improve energy efficiency. Methods: historical and empirical studies.
Key findings: “Jevons paradox is extremely difficult to test empirically, but could
have profound implications for energy and climate policy. While the evidence in
favor of “Jevons Paradox” is far from conclusive, it does suggest that economy - wide

2.1. OVERVIEW 39
rebound effects are larger that conventionally assumed the energy plays important
role in driving productivity improvements and economic growth.
7. Nick Hanleya, Peter G, McGregorb, C., J.kim swalesb, c., and Karen Turner, (2009),
the objective is to take a responsibility that energy efficiency is a role aspect for
sustainability. Study focus a computable general equilibrium (CGE) model of the
scottish economy. Methods: Computation and CGE modeling. Key findings: The
economic factors underpinning rebound effects are straight forward, energy efficiency
improvement result in an effective cut in energy prices, which produces output, sub-
stitution, competitiveness and income effect that stimulate energy demands. How-
ever, the presence of strong rebound or even backfire does not mean that efficiency
enhancing policies are irrelevant: rather just suggest that such policies operating
alone are insufficient to generate environmental improvement. The implication is
that a coordinated portfolio of energy policies is required.
8. Timothy M. Smith and Jennifer Schmitt, (2011), the objective is global supply chain
energy efficiency in small and medium sized enterprises. study focus: global supply
chain energy ef- efficiency in small and medium enterprise. Methods: survey. Key
findings: to evaluate the role of private sector companies in delivering cost effec-
tive energy savings to end users across the supply chain. Such as energy service
companies (ESCO) are devising innovative methods to deliver complete packages
of technologies, operational support and financing to clients. The optimization
function from cost reduction or profit maximization to a multi criteria approach.
Implementing this transition will require an additional set of supplier external to the
material supply chain implementing energy efficiency upgrades and legitimizing car-
bon reduction strategies: suppliers assembled and coordinated toward identifying,
assessing, accrediting, financing, and implementing energy and carbon improvement.
9. Aminata et al. (2013); the objective logistics a,d supply chain in economics and
management. study focus: energy efficiency in global supply chain. Method: op-
timization and management approaches. Key findings: energy efficiency in global
supply chain should be reviewed from three dimension; transportation, production,
warehouse to link supply chain integration and creating a new “link” global supply
chain according to new type of resource of energy. for example, nuclear power plant
(electricity production), transportation (a new technology for chemical transport
vehicle) and production technical improvement in manufacturing industries).
Starting hyper competition discussion in energy efficiency within global supply chain.
I delivered scientific papers which have been done in previous years. Also, research works
in global supply chain should be connected to hyper competition, to know the real impact
in business development, Grandval (2009). First of all, dimensions of energy efficiency
in global supply chain could be seen from three dimensions; supply chain dimension
(strategic level), especially in long term. Logistics dimension (tactical level) is in medium

40 CHAPTER 2. LITERATURE REVIEW
term. Operations management dimension (day to day term). It will address to the real
world of business and moreover in scientific manner should have any proven research
works and necessary simulations. For example; production system in oleo chemical and
electricity level. However, there is no single judgment that all kind of type business
activities can be seen as hyper competition. for instant, so called monopoly. In many
ways the oleo company has been providing oleo’s transport with specific carrier. In their
oleo’s transportation system, at the first step asked to transport agent to provide special
transport services. In other cases, the oleo chemical company offering the bidding system
to find out the cheapest price among them.
Hyper competition, Akhter (2003), Hulsmann et al. (2008), Sandberg and Abrahams-
son (2011), global supply chains (GSCs) are confronted with the phenomenon of hyper
competition. For this reason, there seems to be an increasing necessity for GSCs to
build up competitive advantage in order to survive. Strategic is assumed to have posi-
tive effects on generating required competitive advantage by replicating and reconquering
competences to manage GSCs, while keeping GSCs stable. This research elaborates on
the link between operational, dynamic logistics capabilities and sustainable competitive
advantage. The findings conclude that a sustainable competitive advantage is based on a
combination of efficient and effective logistics operations and well-functioning. The role
of companies’ strategies, development behavior, and management style are keys role for
business development.
In major theoretical discussions of market-driven management, the management of
information flows has always been of crucial points. For example, Kohli and Jaworski
(1990), defined a market orientation as a company’s ability to generate, disseminate and
use better information for its customers and competitors. According to the authors, the
key processes are the implementation of market intelligence mechanisms and the con-
tinuous dissemination of the data acquired; their analysis and processing; and finally,
adequate and anticipated satisfaction of the market’s needs. Narver and Slater (1990)
retained that as well as orientation to demand and to competition, a market-driven com-
pany has a degree of inter-functional coordination that can optimize the acquisition of
information customers and rival companies, and spread it to the entire organization. Shay
and Rothaermel (1999), the two synergistic relationship can be divided:
1. combining strategic management process,
2. strategic models analysis consists of a variety levels of analysis (industry, product,
and firm),
3. the interconnection of strategic analysis models to enrich discussion strategic man-
agement model,
4. strategic management interrelationship between variables in competing strategic
analysis models,

2.1. OVERVIEW 41
5. examining firm-specific competencies as well environment through other model pos-
sibilities.
Furthermore, for some extension, Shay and Rothaermel (1999), said; a multi perspec-
tive and dynamic competitive strategy model consist of:
• combination of competitive advantage,
• service quality, and increasing consumer demand,
• the competitive nature in industry which their products compete each other’s,
• portfolio of product and service guarantee,
• comprehensive perspective,
• strategic degree of freedom, key success factors, and aggressive initiatives,
• relative superiority.
Collaboration issues, Hauswirth et al. (2004), Dentico (1999), explained the game by
using process simulations to develop collaborative and leadership. Moreover, leadership
in the industrial age has consisted of a hierarchical, command, and control structure.
In industrial environment, a production-line led to stable processes by a clearly defined
power structure. At the top owned and controlled the system and the information. In
the hierarchical model, people at the bottom of the organization were rewarded for hard
work and loyalty by the potential to move up in rank and seniority.
A network of connected and interdependent organizations mutually and cooperatively
are working together to control, to manage, and to improve the flow of materials and
information from suppliers to end users. “logistics and supply chain management can
provide a multitude of ways to increase efficiency and productivity and to reduced unit
costs.”
Porters framework is useful only if the competitive forces represented by competitors,
suppliers, buyers, and substitutes are relatively stable and independent. A company can
find an appropriate strategy for each industry configuration and barriers for protecting this
strategy. The traditional sources of competitive advantage, economies of scale, product
differentiation, capital investments, switching costs, access to distribution channels, and
government policy.
Jonker and Pennink (2010). There are three positions on the globalism spectrum.
Geo centrism, as defined earlier, represents the highest degree of integration and the
highest degree of globalization. Poly-centrism is associated with a worldwide presence,
but operations in the multiple locations are largely independent of one another. Ethno-
centrism is also associated with a worldwide presence, but in this profile the focus of the
organization is the home country. Region centrist involves regional operations that serve
multiple countries.

42 CHAPTER 2. LITERATURE REVIEW
This is a compromise position that offers some central control, see Yi-chen and Bhuvan
(2006) who identified five strategy levels for global level:
1. list of countries to conduct business and the market share level,
2. products and services across countries,
3. location and R and D,
4. marketing activities in different countries,
5. global competitive strategy.
Zhua 2007, Dul and Hak (2008) identified, the issue of globalization in and its ap-
plications to supply chain management (SCM) which have been presented difficulties on
supply chain management by regarding:
1. geographic distances,
2. forecasting barriers,
3. exchange rates and national economic policies,
4. infrastructure inadequacies.
Scientific management, Taylor (1911) said that it can be considered as the root of
the development of quantitative OM, although not only the root of quantitative OM.
Also Bertrand and Fransoo (2002) said; the essence of scientific management was the
analysis of instances of real life operational processes, based on systematic observations
and measurements of these process instances, and the re- design of these processes in
order to improve quality and productivity.
Furthermore, Taylor’s said; “scientific management fundamentally consists of certain
broad general principles, a certain philosophy, which can be applied in many ways, and a
description of what any one man or men may believe to be the best mechanism for applying
these general principles should in no way be confused with the principles themselves.” See
Rosenau (1997), for further related discussion and its development.
D’aveni (1995); on his frameworks for competitive strategy based on input-output
economics, then by Porters model, emphasize the important role of industry structure in
determining a firm’s strategy. Other competing frameworks question the determinism im-
plicit in this approach and focus instead on the firm. D’aveni proposed new 7S framework
to deal with the fleeting nature of competitive advantage. At its essence, the framework
assumes that every new strategy will be quick competitive retaliation. A strategy that is
continually seeking to change the rules of the game, even when a firm is successful and
ahead of its competitors.

2.1. OVERVIEW 43
2.1.1 Management Strategy on Competition
McClellan (2000); said “there are many faces to this idea, but the most significant is
the change of business buy and sell roles, from relationships to cooperative and then
collaborative arrangements, based on identified elements of mutual interest and trust.
The concept of collaboration means that participants contribute something the whole.
The relationship changes from traditional business rules to those based on mutual trust;
these are enhanced by performance and contribution. The global sup- ply chains (GSCs)
are simplified by the phenomenon of hyper competition. An increasing necessity for
GSCs to build up competitive advantage as survival guide. Strategic flexibility is to have
positive effects for competitive advantage by replicating and re-configuring competences
to manage GSCs. Autonomous cooperation and control as a management approach may
contribute to achieving flexibility in GSCs. for independence and an effort for energy
efficiency procedure should follow hyper transparency procedure.
Competition in Global Supply Chain
Time constrains for delivering the product and efficiency during loading and unloading
product is an important issue in oleo-chemical industries. For instance, one plant produces
more than hundreds tons per day which will have impact on energy consumption. More-
over, it will influence on the level of stock, logistics and supply-chain operations, Sbihi
and Eglese (2007). This is crucial for sustainability of multinational companies, because if
there is mistake in calculation, stock planning will take costly for all business operations.
Connecting to energy matter, there is a question; why energy efficiency is important for
all aspect? By improving the energy efficiency, its efficient consumption will be leading
to a better security, a quality improvement of the concerned industry. Also, by increasing
the energy security (supply, accessibility, and etc.), competitiveness and profitability will
increase and contribute to reducing the overall impact global warming.
The oleo chemicals industries must choose a good transport service to handle efficiency
energy matter and extended existing problems, see Commission (2013). The main problem
is to provide a best choice of transport service which is a challenge one in the range
of simple business up to complex business activities. Almost oleo chemicals industries
activities are supporting by transport service companies to help delivering product. They
have to assure that the product will arrive safely to all clients around the world. With
regards to the environmental impact, all companies which is included the transport service
must be careful with concern the environmental.
The report of Ademe, (2012), showed that between 2000 and 2007 from road transport
statistics, there was energy efficiency improvement. It could be happened by management
transportation and eco-driving when the car uses on the road. Precisely, the efficiency
of vehicles (measuring by the ratio ton/km) is efficient, year by year. The management
transport shows by the increasing of the ratio ton-km/vehicle. According to the legislation,
the oleo chemicals industries are one of the most dangerous output products. How to
produce, to maintain the product, to process, and to deliver all products is connected

44 CHAPTER 2. LITERATURE REVIEW
well in global supply chain system. It is not only in the industrial supply chain system
but follow the conduct of regional law and national law for some circumstances. The
storing and transporting the oil in oleo chemicals industries are really heavy treatment by
the company and their global supply chain network, to make a guarantee of best quality
product.
The reduction of company’s cost is derived from transport cost lower when delivering
the product; energy consumption within in industries which is appears in product pro-
cessing. See, Sbihi and W.Eglese, (2007), delivered the research finding; the relationship
between vehicle routing, scheduling, and green logistics. The proposed CO2 calculation
here is used CO2 efficiency by using an intensity calculation, in order to get energy effi-
ciency, Sbihi and Eglese (2010).
Moreover, for airline industries within global supply chain at glance will cover the one
of key success is how measure the sustainability of this industry. Focusing on global supply
chain that would be interesting and important one, in this matter. We can describe that
will be minimum awareness to be successful:
1. the level of responsiveness and efficiency factor for whole business schemes,
2. the measurement of efficiency supply chain and energy used or kerosene used is
efficient enough due to the fluctuation of kerosene price (energy price),
3. supporting IT system,
4. demand side and supply side from company to provide service and regular mainte-
nance,
5. supply chain management is to promote non value added activities that will give
much influence for this business.
Wei et al. (2011), p. 60; “due to nature of their manufacturing operations, many
chemical manufacturers have to coordinate their inbound and outbound transportation
of materials (raw materials and finished products) in bulk. They employ a wide variety
of transportation modes which include pipelines, tanker ships, tanker rail cars and tanker
trucks to support the movement of their materials. The latter are usually hazardous in
nature and their movement is usually governed by regulatory policies (that are legislated
to address environmental, safety and security concerns) such as those imposed on the
movement and tracking of hazardous materials.
Sbihi and Eglese (2007); the increasing of globalization spectrum is underlying on
reducing cost of procurement system and decreasing the risk of purchasing activities.
Moreover, it must be respectful for the global climate change. The amount of emitted
CO2 that has been produced in the plant, warehousing or even supplier warehousing up
to deliver the product to all consumers must be taken into account more than carefully.
The absences of regular transport though the special haulier services availability giving
the performance of the companies in some extend. It’s quite often the location of the oleo

2.1. OVERVIEW 45
chemicals plant in remote areas, in order to keep the environment clean and reduce the
emission factors. In normal condition, the direct impact of plant location in remote areas
is lowering the production cost, increased the producer price, and there is a probability
increasing the investment level. Discussing efficiency energy is continuous role in global
business sustainable showed, Karlheinz (2000).
The specific research in transportation palm oil is very limited. Though, there are
previous significant researches in the previous time. The proposed CO2 calculation here
is used CO2 efficiency by using an intensity calculation, in order to get energy efficiency.
To get better understanding, there are terminologies to find an appropriate list of
description: supply chain terminology is one of the contentious issues in the supply chain
literature is the difficulty in defining the boundaries of the supply chain concept since
there are so many different interpretations.
It has been suggested by Farahani, (2009), nevertheless, there are four major themes
which have been identified in the interpretations of the supply chain which revolve around
the following: distribution, production, strategic procurement and industrial organization
economics.
• distribution is a combination of distribution, logistics and marketing perspectives
combining upstream and downstream supplier management of materials and infor-
mation flow, as best exemplified by various definitions, including those, see Martin
(2011).
• production is the lean production and materials and work flow in organizations; on
production approach and the lean construction, see Aminata (2012).
• strategic procurement management is an organizational strategy management of
their suppliers for competitive advantage, see Sandberg and Abrahamsson (2011).
• industrial organization economics is a wide industry or market perspective on the
research problem; as best exemplified in construction, an early attempt by London
(2008) on supply chain procurement modeling.
• logistics is essentially a planning orientation and framework that seeks to create a
single plan for the flow of product and information through a business and that
supply chain management builds upon this framework and seeks to achieve linkage
and coordination between processes of other entities in the pipeline, that is, suppliers
and customers and the organization itself, see M. et al. (1999).
• other supply chain management definition is the management of upstream and down-
stream relationships with suppliers and customers to deliver superior customer value
at less cost to the supply chain as a whole, see Martin (2005).
To distinguish between supply chain management and the supply chain, the following
definition was provided:

46 CHAPTER 2. LITERATURE REVIEW
• supply chain definition is the network of organizations that are involved, through
upstream and downstream linkages, in the different processes and activities that
produce value in the form of products and services in the hands of the ultimate
customer. The modified definition explicitly declares the councils position that
logistics management is only a part of supply chain management, see Rushton and
Walker (2007).
• alternative supply chain management definition can be explained as the integration
of key business processes from end user through original suppliers that provide prod-
ucts, services and information that add value for customers and other stakeholders,
see Rizet et al. (2008).
Lesson learned from COOP 21, Paris: the agreement establishes an obligation for
industrialized countries to fund climate finance for poor countries, while developing coun-
tries are invited to contribute on a voluntary basis. Tracking commitments, which allows
developing countries a certain amount of flexibility, has also been set up in order to keep
track of everyones efforts, see Depoues et al. (2015).
For detailed one the information from COOP 21 can be summarized as follows: Belong
to the energy union means:
• to reduce the dependence on single suppliers and fully relying on their neighbours,
with more transparency.
• energy flows are free flow of energy across borders and strictly enforcing the current
rules in areas such as energy unbundling and the independence of regulators. Taking
legal action if needed. Redesigning the electricity market, to be more interconnected,
more renewable, and more responsive.
• energy efficiency referred to rethink and treating its own right so that equal to
generation capacity.
• transition to a low-carbon society aimed to ensure that locally produced energy,
including from renewable which can be absorbed easily and efficiently into the grid.
Also, promoting EU technological leadership through companies expand exports and
compete globally. Energy should be secure and sustainable with more competition
and a good choice for every consumer.
Key figures The EU:
1. the largest energy importer in the world, importing 53 percent of its energy, at an
annual cost of around 400 billion.
2. 12 EU member states do not meet the EU’s minimum interconnection target that at
least 10 percent of installed electricity production capacity be able to cross borders.

2.1. OVERVIEW 47
The EU has listed 137 electricity projects, including 35 on electricity interconnec-
tion: between them, these projects could bring that figure from 12 down to 2 member
states. An appropriately interconnected European energy grid could save consumers
up to 40 billion a year.
3. 6 EU member states are dependent on one single external supplier for all their gas
imports.
4. 75 percent of our housing stock is energy inefficient; 94 percent of transport relies
on oil products, of which 90 percent is imported.
5. over 1 trillion needs to be invested into the EU energy sector by 2020 alone.
6. wholesale electricity prices in Europe are 30 percent higher, and wholesale gas prices
over 100 percent higher, than in the US.
7. European renewable energy businesses have combined annual turnover of 129 billion.
The challenge is to retain Europe’s leading role in global investment in renewable
energy. EU greenhouse gas emissions fell 18 percent in the period 1990-2011. By
2030, the EU aims to cut.
greenhouse gas emissions by at least 40 percent, boost renewable energy by at least
27 percent, and improve energy efficiency by at least 27 percent.
By setting out the measures needed to achieve the target of 10 percent electricity
interconnection by 2020. The minimum necessary for the electricity to flow and be traded
between member states. It shows which member states currently meet the target which
projects are necessary to close the gap by 2020 .
The Dynamics of Innovation
By examining the social structure of coo-petition and internal knowledge sharing within
a multi-unit organization, this research suggests possible ways for coordinating organiza-
tional units to achieve synergy that is valuable to the organization as a whole. Knowl-
edge is distributed asymmetrically across different units inside an organization. Without
effective coordination, knowledge may not spread evenly across units within the same or-
ganization. Reducing hierarchical constraints and increasing inter unit social interaction
are the directions that managers may pursue to encourage internal knowledge flows and
enhance the capabilities of their organizations. For innovation dynamic should be take a
look supply chain and logistics in national, international and governmental environment
concepts and models, Farahani (2009).
General Studies in Energy Efficiency
Previously by Harod Hotelling, (1931), and then by Vine et al. (2003) shows that how
the management of energy system will be manage by just return to the classical theory of

48 CHAPTER 2. LITERATURE REVIEW
monopoly, duopoly and free competition. The discussion will be extensively running out
from the basic theory and its future planning and regulation through the characteristics
of each countries or problem may arise from existing problem.
Mohan Munashinge, 1980, in most of developing countries in oil, gas, refining, coal
mining and its distribution still has many problems. In most cases, energy prices influence
exploration agreement, royalty charges, and profit sharing scheme. Special policies; import
subsides, export bonus, government loan or grants, concession and kind of taxes.
However, the energy efficiency, global environmental problems, fast growing energy
demand related studies are in discussing intensively year by year. The energy use is
the total primary energy uses per unit of gross domestic product, aggregate indicator of
energy use efficiency.
Shadow price theory has been developed particularly for cost benefit analysis. The
investment decision in energy sector related to get an appropriate of energy price. Instead
of market price, shadow price can be one of alternative to describe economic opportunity
cost. Using shadow price, for example opportunity cost. If capital, shadow wage rate,
marginal cost, interventions in the market process, taxes, import duties, and subsidies.
The new directions for the future should be taken from interrelations between com-
mercial energy and traditional energy. Energy forecasting and policy decision should be
taking in both ways in commercial energy and traditional energy.
In energy policies were explained that market philosophy still difficult in application,
for instant; coal systems seems likely to remain in public sector for indefinite future.
Further development is toward a competitive for market for energy. Energy policies in
many countries face on difficulties to do so that, it must be underlying on market failure
and government failure. More over we need to focus on natural monopoly and artificial
monopoly.
In action for it, the regulation is needed to make for natural monopoly and com-
petition policy to ensure that there is fair competition among them. In effect there is
nationalization to find out the proper approach in issues of natural monopoly, by using
maximization to pursue the profit maximization and social welfare. In better condition
will be urgent to set up the competitive entry and efficiency in many ways.
The common competition is rise up from within industries, between industries and
international competitor. In within industries, the structure and pricing is main factor, in
between industries is in unregulated and in certain market only and better understanding
industrial structure, regulatory system, information system. There is need high attention
from government for energy market; the influences of monopoly and its combinations in
an economy especially in economics of energy concern with pricing, producers, consumers,
and etc. Energy use in developing country fails to show the fuel substitution process and
structural shift in their economies.
GDP statistics, often large subsistence non-market sectors, are important gap between
rich countries and poor nations. To convert a common currency, they using market
exchange rate, purchasing power parity. But also, using national income to international

2.1. OVERVIEW 49
dollar to avoid the volatility of exchange rate, and moreover to give the sign the difference
price of level. Using, PPP converted to GDP values. Comparing the differences between
energy/GDP ratios using exchange rate-based and PPP adjusted GDP.
Vose (1997) and previously by Amulya K.N. Reddy, 1991 said that there are four
essential factors that will help to facilitate the dissemination of efficiency energy measuring
the barriers of energy efficiency, employment policy, market mechanism, and technological
innovation. If there are barriers may consist of several of small barriers or sub barriers.
So that, combination or a package program will improve the energy efficiency. This is
referring to Bergs theorem; the introduction new technologies will create uncertainty and
vested interest for seeking “status quo”. A package is consisting of combination of fiscal
incentives, price control, technical R and D, publicity, education, legislation encompassing
public and private sectors, individuals and organizations.
In this article, I found that energy services company should have combination pack-
age because they are single window agencies for implementing all component of energy-
efficiency programs for example; providing information, assessing requirement, financing,
organization contractor, etc. Then, to be successful in large-scale program will capture all
economic potential for conservation: dealing with high consumer discount rate problem,
it will be profitable for companies to be involved. Avoiding penalizing non participant,
and ensure that estimated saving are close to actual saving.
Three type of potential for energy consist of efficiency improvement:
1. the market potential much less than the economic potential because of market dis-
tortions and high discount rate.
2. the economic potential is less than technical potential because the level of tech-
nologies have not yet been made cost-effective and economically and happened in
developing countries
3. if the level of price is well done will improve energy efficiency so why promoting
innovation will be successful with occur price, see Waters and Donald (1999).
A theoretical frame work, delivered by White (2009) shows that natural resources and
the macro economy. The large scale of exploitation of natural resources is a real than a
monetary shock to an economy. Why, because it will give particular impact on real income
and inter sectoral allocation of factor of production. All impact on natural resources can
be determined as follow:
• an analyzing the consequences, the real model and monetary approach regarding to
natural resources discoveries,
• using a simple framework to examine all increasing economic activity correlated
with relative prices,
• analyzing inter temporal allocation of resources,

50 CHAPTER 2. LITERATURE REVIEW
• the Implications of macro economy policy and exchange rate fluctuation.
From this article can be drawn some interesting point of view; de-industrialization
as the impact of declining output and employment in manufacturing sector. Focusing
on foreign competition, such thing of policy is not easy to be done to reach up the new
policy or set up the new equilibrium. For the case of Indonesia to run new discoveries is
exploitation oil and gas in the ocean and geothermal sources is more challenging. Com-
prehensive strategy should be done here because measuring in isolated ways at the policy
level is insufficient.
Also considering with decentralized source and centralized supplies. Making a treat-
ment both supply side and demand side. For instant, vehicle with petroleum product;
consider with; technological improvement, reduction vehicle miles traveled, using alter-
native fuels product. India has been successful in these matters; shifting passenger from
personal to public transportation, efficiency improvement in the use of petroleum product.
The more effectives energy efficiency, the less requirement of energy, the lower price
of energy then, the less demand for energy efficiency. What does it means? it means that
the price mechanism will not work alone, and market forces by themselves cannot achieve
efficiency energy (one of the paradox energy efficiency).
It is need policy assisted. Why, marginal cost pricing and regulations making conser-
vation investment profitable. Dentico (1999) globally has been explained, there are energy
policies and its mechanism for running better energy restructuring (even by leadership
practice);
• encouraging competition and establishing legal and regulatory framework,
• capital market discipline, privatization and de-privatization,
• monitoring state owned industries,
• international issues and environmental issues; for the cost of energy,
• an effort for wider ownership and risk on exploration,
• promoting energy efficiency.
Hobbs and Meier (2000) discussed the energy industries and has tried to analyze
its significance the economics with energy production and consumption. For example;
coal, oil, natural gas, electricity utility, nuclear power and alternative industries areas.
Combination with analytical concept; Nathan Rosenberg, energy and economic growth,
the relations between energy and economic growth. The most important and the point
of view itself is the growing of utilization of energy and economic growth. In this article
said that technological competence.
Some issues in transition of energy use, known as inter fuel substitution existing pro-
duction isoquant. The technology level is a very competitive in energy sector and tends to
be high technology. R and D process should hire here and sometimes high cost economy.

2.1. OVERVIEW 51
It is important to know well capacity of flexibility not only the level technology but also
the research of it. The diversification of the energy research portfolio is needed.
Kursunoglu et al. (1996); stated in economics and politics of energy, p.152; “a must
works to ensure the safety of nuclear power plants throughout the world. In the U.S.,
NRC regulation and institute of nuclear power operations (INPO) operations and training
standards continue to set the standards for the rest of the world. This same level of
standards has not been utilized by the rest of the world in the development of their
nuclear programs. Regarding to the operating Soviet-designed reactors in the former
Soviet Union and Eastern Europe.
In addition, the safety of the existing plants in the U.S. needs to be assured as these
plants age. In 1986, the dramatic accident at the Chernobyl nuclear power plant in
Ukraine focused international attention on Soviet-designed nuclear power plants, which
currently operate in Central and Eastern Europe and the new independent states. The
department works cooperatively with these countries, other countries with advanced nu-
clear power programs, and international organizations to improve the safety of operating
Soviet-designed nuclear power plants. The United States’ program originated with com-
mitments made in 1992 involving the older Soviet-designed power plants.
Horace (2006) stated that the trend of foreign investment in any scheme ought to
be full attention in institutional arrangement; the planning and practical framework has
to be fully understood. Economically, politically, and technologically is not enough to
manager energy system, Institutional system both domestic system and International
system respectfully. The ownership and production are points of views in the perspective
of vertical integration particularly in oil and gas industries.
The competitive strategic from any firm will influence the price and perhaps under
the normal rate. In international level, vertical integration will cross national frontiers,
difference level of production and could be stuck in political level (The Journal of De-
velopment Studies, volume 1 no 3, April 1965). The energy conservation especially for
government’s understanding is energy sector justified by market imperfections and ex-
ternalities. Then, how the mechanism of competitive market would ensure that energy
conservation measures are implemented optimally? (Source part II conservation, hand-
books energy economics volume I). In latest basic phase of study, there are the fives keys
or feature of statements in management and economics of energy industries see Aminata
et al. (2014b), also see more an article written by Atkinson and Dorfman, 2005 as follows:
• the paradox of energy efficiency=sources-technology development,
• energy-infrastructure and environment and in less-developing countries,
• firm behavior-strategic and regulation = government, private, joint venture (own-
ership), externalities (+/-); CSR etc development management,
• pricing=pricing policy and competition,
• local/regional, national and international trade-financial market.

52 CHAPTER 2. LITERATURE REVIEW
Fliszar. (2009) explained the atomic charges, bond properties, and molecular ener-
gies, p.5; “The difficulties encountered in the direct calculation of bond energies can be
overcome with hard labor and some approximations in only a few cases, but the good
news is that only a few reference bond energies need to be calculated for model systems.
Those determined for the CC and CH bonds of ethane, for example, are sufficient for
the description of saturated hydrocarbons; the addition of the reference bond energy de-
scribing the double bond in the range of applications. It is thus well worth the trouble
to calculate a few reference bond energies which can be done with reasonable accuracy”.
Wei et al. (2011) on their article explained CO2 emissions in China; “chemical supply
chains possess several characteristics which are distinctively different from those of supply
chains in other industries.
Clearly, understanding of these distinctive characteristics enables supply chain prac-
titioners to appreciate the unique set of constraints and challenges that they have to
contend. This is extremely crucial prior to the formulation and execution of any strate-
gies that aim to manage chemical supply chain efficiently and effectively. Based on their
areas of impact on supply chain decisions, we classify these distinguishing chemical supply
chain characteristics into four main categories, namely material sourcing, manufacturing
operation, demand and transportation management. For each of these categories, we now
describe concisely the distinguishing characteristics of chemical supply chains.”,Guizot
(2007).
In the book of fundamentals of risk analysis and risk management, on Monte Carlo
risk analysis modeling, Ch.14”, Vose (1997) said: Monte Carlo risk analysis should not be
thought of as the only technique for evaluating risk and uncertainty. There are a number
of other numerical tools available for analyzing risks, and other, non-quantitative aspects
will usually need to be considered also. The decision maker should use monte Carlo risk
analysis as one of several complementary inputs to the decision process.
Connected to nuclear energy and the international community that they have con-
tribution significantly to an improved nuclear safety awareness and culture in many of
the countries. For example, in Russia and Ukraine, as part of our cooperative activities,
advanced nuclear training centers have been established to assist those countries in devel-
oping and implementing modern staff training programs. At the Ignalina nuclear power
plant in Lithuania, there was contribution for the first-ever probabilistic risk assessment
of an RBMK type reactor.
The information gained from this risk assessment is now being used in the develop-
ment of emergency operating instructions for the Ignalina plant, and will contribute to
other safety improvements. The United States established a nuclear safety culture and
infrastructure in the countries that operate “Soviet-designed” nuclear power plants is vital
to our own national interests for several reasons:
-first, the stability of these emerging democracies would be threatened by the social,
economic and environmental impacts of another serious nuclear accident, such as the one
that occurred at Chernobyl.

2.1. OVERVIEW 53
-a serious accident could have many direct environmental and economic impacts on our
European allies. Third, a severe nuclear accident could dramatically affect the viability
of nuclear
power throughout the world. And finally, a serious nuclear accident could place at
risk rapidly expanding U.S. commercial investments in these countries”. Smida and Ben
Romdhane (2004), related to culture dimension and practice for management strategy.
Conkling (2011) on his article about energy pricing: economics and principles, p.232;
“when questioned the emphasis that the company placed on light bulbs in contrast to in-
creasing the energy- efficiency of equipment in industrial plants and commercial buildings,
and selling more air-conditioning that provided a faster and cheaper result.
In transportation; vehicles hybrid and battery-powered vehicles themselves generate
low or no emissions, but they need electricity generated by power plans. The company
AT and T spent up to 565 million US dollar over 10 years in alternative-fuel vehicles. The
federal government sets a standard of 25 mpg for new vehicles to apply in 2016. There
are two types of hybrids (full and mild) and two types of power train configurations
(series and parallel). Full hybrid: can go short distances on electric motor; after the
charge is used or the vehicle reaches a certain speed, gas engine turns on, driving wheels
and recharging. Mild hybrid: electric motor supplements gas engine, acting as a stop
start system. Series hybrid: propulsion entirely from electric motor; outboard gas engine
generates electricity directly for motor and batteries. Parallel hybrid: uses both gas and
electricity for propulsion”, see Herdman (1993).
Kovacevic et al. (2013) stated on his handbook of risk management in energy pro-
duction and trading, p.73; “risk management for energy production and trading affects
short-term and long-term decision making. A long-term decision is how to invest in energy
generation and transmission facilities. A shorter-term decision is how to operate facilities
and to trade energy. The decisions are linked: The expected profit of operation and trad-
ing influences the investment decision for a facility, and the uncertainty in operation and
trading increases the uncertainty of the return of the investment.”, see Garp (2009).
Carley and Lawrence (2014), stated energy based economic development: how clean
energy can drive development and stimulate economic growth, p.25; “the goal of energy
efficiency is to use less energy to achieve the same purpose. Energy efficiency efforts
generally encourage energy consumers (i.e., households, businesses, and governments) to
use less energy to receive the same level of energy output. Energy efficiency, which fits
under demand-side management. Generally, involves lighting, heating, and cooling.
Efficiency efforts on energy-generating technologies, where the technology is improved
to use less fuel inputs to generate energy outputs, or transmission technologies. However,
less power is lost through the electrical transmission and distribution process. Finally,
efficiency is possible in the transport sector through refinements to the internal combus-
tion engine or the introduction of other innovations such as electric vehicles. Efficiency
improvements offer several benefits, Carley and Lawrence (2014):
- assuming that the cost of improving efficiency of some good is less than the savings

54 CHAPTER 2. LITERATURE REVIEW
associated with reduced energy use, efficiency efforts save money, which can be applied
toward other goods, services, or development opportunities,
- reduction in energy consumption directly through reduction of emissions and other
environ- mental pollutants,
- improved electricity efficiency can reduce grid congestion and thereby save money
on grid management and new energy construction. The improvement of technological
efficiency other energy-related goals as well.
A variety of energy efficiency programs are being deployed across the world, in both
the public and private sector and also national and local levels. These activities include
the incorporation of energy efficient materials and products in building operations (e.g.,
light-emitting diode [LED] light bulbs, double insulation window panes, or recycled stone,
metals, industrial materials, and other green building products) or methods such as smart-
controls or targeted maintenance. These types of energy efficiency activities have the
potential to reduce energy use and costs to businesses and residents for heating, cooling,
and power. As a more concrete example, the rapidly growing city of Abu Dhabi is pushing
the limit of water and electricity use as it continues to develop.
The government understands that it must focus on conservation as it considers new
production capacity and, as a result, is working to evaluate the country’s demand for water
and electricity and eliminate inefficient uses of these resources to save money and extend
power and water supplies”, Midttun (1997). Franke et al. (2015) explained for improving
energy decision, towards better scientific policy advice for a safe and secure energy system,
p.37; “An analysis of measures in the European Union showed that the EU has made
some progress in the direction of climate change protection and an energy transition.
However, while ambitious targets have been set by its 20-20-20 by 2020 goals 20 percent
improvement in energy efficiency, 20 percent renewable energy, and 20 percent reduction
in greenhouse gas emissions by 2020, as compared to 1990 levels), further reforms will be
needed. Emission trading is a key policy measure for meeting European reduction goals
regarding greenhouse gas emissions. However, the major problem is in practice. The
emission trading is not bringing the significant effect. The separate support schemes is
the import of certified emission reductions (CER) in the context of the clean development
mechanism (CDM).
Conclusion
Wittmann (2008) also by Wenpin Tsai, (2002), in social structure of “coopetition” within
a multi unit organization: coordination, competition, and intra organizational knowledge
sharing organization science. The results of this research allowed conclusions at two levels.
First, it appears that both formal and informal coordination mechanisms influence intra
firm knowledge sharing. At a second level, the results indicate that the organizational
capability view of the firm should be extended to include a moderating role for intra
organizational competition. The findings of this research are particularly noteworthy given
that inter unit knowledge sharing can enhance overall organizational capabilities through

2.1. OVERVIEW 55
collective learning and synergistic benefits generated from the processes of exchanging in-
formation, know-how, or local expertise among competing units.
2.1.2 Review on Transportation: CSR and Risk Management
General Review on Transportation Case in Global Supply Chain, from Own
Perspectives
The role of transportation in global supply chain is the main key factor for success whether
for initial phase at local level up to higher level. In transportation section, I explored
on oleo chemicals transport and airline transport. Surely, for each sector both type
of industry and tools of transport are different. The point of this review has tried to
understand and to connect well studied for transport development.
Particularly for transport which supporting global supply chain business. The aim
of research on transport in global supply chain is to know the consumption of energy or
so called fuel consumption. If we traced on initial phase of oleo chemical industries in
origin country ex. Malaysia and Indonesia are needed to evaluate business and economic
impact. It’s so important to measure the environmental impact.
For inter-continental transport, oleo chemical industries utilizing shipping transport.
To reach Europe from Singapore the big vessel takes around six months via Rotterdam,
Netherlands. Then, from Netherlands to France and Germany utilizing train in a specific
mode of transport. The main plant in Europe are located in Germany and France. The
field research focused on case studies which well connected to literature review, the real
problem in business development, all application methodology and its tools, and also the
alternative solution in managerial level and solving problem based on business challenges.
Nothing is impossible in business development. The information system and all strate-
gies behind the professional to develop global supply chain will be evaluating by customers.
The direct and indirect approach to measure efficiency of running business in current
decade is complex one. The parameter of energy efficiency is one of the good indicator to
evaluate certain business which connected to global market.
The market shares of Indonesia and Malaysia for oleo chemicals product hold around 85
percent in global market. By this those percentage, both countries are taking important
role in global market. What happened in those real business is much expected by all
actors in this sector? moreover the origin of the ownership for palm oil plantation is also
interesting one to investigate for further research. However, this research work focus on
energy consumption.
In case of the European, its need all approvals that for every step of product processing
has been treating properly. No doubt, E-U has been trying to protect their industries to
be survival in global business. Therefore, the issue of labeling for minor environmental
impact become the urgent one. The most interesting one to explore this research work
used the real time data or original data that can be viewed as what’s going on in real
business.

56 CHAPTER 2. LITERATURE REVIEW
The linked with core problem, research question, methodology, and result findings:
Hyper com- petition in the context of energy efficiency on transportation within global
supply chain is the main parameters on current business development. The world slow-
down of economic performance should be understood as a situation of global supply chain
which happened in china. The indicator of supply chain measurement can be as an indi-
cator performance for business. Even though just in an initial phase, through medium,
and to distribute the final product to clients.
All literature reviews focusing on how to deal with core problem, research question,
methodology, and certainly with comprehensive result findings on this research work. The
hyper competition can be seemed as price matter only but how the supply and demand
meets on their business transactions. Solmes (2009), however to fulfill the satisfaction
of customer we have to engage closely with them. The business solution with optimized
the satisfaction of customer can be reach by multi purposed of business goals. It will
help to efficiency matters. For examples; accounting system, risk transfer, minimizing
energy budget, the combination policy to reach upper technology, implementation, and
ownership. By creating a good performance of risk management approach energy business
strategy: Data, functions, and communication as recommendations for a new energy
information age, Thollander et al. (2010).
Figure 1.2.1.: Energy Business Strategy Data Functions and Communication
Source: Thollander, p.176, Energy business strategy: Data, functions, and communi-
cation as Recommendations for a New Energy Information Age.
The question here is how to design the energy industry IT solution to be critical to
achieve the successful implementation of energy systems efficiency?
For building the sustainability of energy infrastructure as common that not only in-
cludes the stake- holders but also included equipment manufacturers, fuels suppliers,
engineers, equipment manufacturers, procurements specialist, and many others criteria of
stakeholders.
Oleo Transport
Oleo Chemical Transportation
This paper focused on global oleo chemicals supply chain. Mostly, in France and Europe
for general case cases, Wu et al. (2012). One must take into account some additional issues
relating to national legislation to deliver the specific product in specific time windows,
particularly for the hazardous products. The research work will give a new perspective
for transportation industries by setting a new strategy on managing their own energy
consumption with a basis on the concept of energy efficiency and oleo chemicals business
scheme, Larsen et al. (2013).
Among independent firms cleared that the fact of production is increasingly frag-
mented. They are spatially dispersed and responsible for different steps of the production
process. As Marchi et al. (2013); stated particular challenges to firms that seek to increase

2.1. OVERVIEW 57
the energy efficiency of the supply
chain Varma and Clayton (2010). Especially, its located in countries that characterized
by different environmental standards. Such kind of global supply chain and business
challenges. It will get in connection to India, China, and European consumers who are
the main consumers of palm oil.
According to global supply-chain management which is importance in global business
trading. One things can be asking here; how to make sure that global supply chain is
efficient for all aspects of business. Because, the efficiency of business cannot be seen as a
part of each activity itself. Therefore, it should be taken as a whole of business framework.
The increasing of globalization spectrum is underlying on reducing cost of procurement
system and decreasing the risk of purchasing activities. Moreover, it must be respectful
for the global climate change, Hu and Hsu (2010). The amount of emitted CO2 that has
been produced in the plant, ware- house or even supplier’s warehouse up to consumer’s
place. It must be taken into account more than carefully Varma and Clayton (2010),
Halldorsson and Svanberg (2013). Based on this perspective and global scenario, the
efficiency is looked for backward and at the end of forward linkage itself, moreover should
be more considered for all business link activities, Sbihi and Eglese (2007).
Time constrains for delivering the product and efficiency during loading and unloading
product is a crucial part in oleo-chemical industries. For instance, one plant produce
more than hundreds tons per day which will have impact on energy consumption. It
will influence on the level of stock, logistics and supply-chain operations. This step is
to promote sustainability of multinational companies. Due to, if there is a mistake in
calculation, stock planning will take costly for all business operations.
Connecting to energy matter, there is a question; why energy efficiency is important
for all aspect? By improving the energy efficiency which will lead a better security and
environment. Also, by increasing the energy efficiency (supply, accessibility, etc...), com-
petitiveness and profitability will increase and contribute to reduce the overall impact
global warming. Oleo chemicals industry must choose a good transport service to handle
energy efficiency matter, see Commission (2013). The main problem is to provide the
best choice of transport service which is a challenge in the range of simple business up to
complex business activities, see Smida (2006).
All business activities in transportation department is supporting by transport service
companies. They have to assure which is the product will arrive safely to all clients,
around the world. By regarding to the environmental impact, all companies which is
included in transportation service must be careful with environmental problem. However,
the report of Ademe. (2012), showed that between 2000 and 2007 from road transport
statistics, there was energy efficiency improvement. It could be happened by management
transportation and Eco-driving when the car uses on the road. Precisely, the efficiency
of vehicle (measuring by the ratio ton/km) is efficient, year by year. According to the
legislation, the oleo chemicals industries are one of the most dangerous output products.
It is not only in the industrial supply chain system but following the conduct of regional

58 CHAPTER 2. LITERATURE REVIEW
law and national law for some circumstances. The storing and transporting the oil in oleo
chemicals industries are really heavy treatment by the company and their global supply
chain network, to make a guarantee of best quality product, see Liu et al., (2010), El
Amraoui et al., (2008), El Amraoui et al., (2010), El Amraoui and Mesghouni, (2014).
Chapman, (2006) showed the reduction of company’s cost which is derived from trans-
port cost lower when delivering the product. As in real plant operations, energy consump-
tion appears in product processing. The absences of regular transport through the special
haulier services availability giving the performance of the companies in some extend. It’s
quite often the location of the oleo chemicals plant is in remote areas, Carapetis et al.,
(1984).
The Oleo-Chemicals Transnational Transportation
The research question of this research work pointed out:
how to calculated the CO2 efficiency (based on formula of CO2 Efficiency, shows in
equation N.1, as of intensity calculation on transportation efficiency) in oleo chemicals
transportation which is used truck with high viscosity products by crossing the European
Union?
how to calculate the concentration ratio of product (E and S France product) by
complex management strategy which faced on CO2 efficiency problem (basically, based
on formula of CR4, shows in equation No.2, as of Tirole (1998)?
The distance has been calculated in detailed to know the most efficient energy con-
sumption and minimum horse power of the truck. It can be allowed through the legislation
of road and driving rules. Especially, for the big container which carries oleo-chemical
products.
According to France’s law and E-U law that are no more 40 tones allowed to pass
the national or regional roads. They should be carrying out less than 40 tones. The
company has to treat build a method and selects the truck in very efficient ways. In
the real business, the consumer needs the maximum one (the maximum level of truck
load capacity). In this activity, loading and unloading factor is the main problem. More
time they need for loading and unloading more expensive or extra money will pay for
transportation, electricity, workers, additional invoice from the transport agents.
Wei et al. (2011), p.69; “Current chemical supply chain management issues shows that
the new trends among the chemical supply chains connected to socio political environment
over the years. Essentially, these issues are not new and many of them have existed for a
long time. However, the new business environment which has forced several issues among
supply chain practitioners.”
Financing the Energy Efficiency
The energy efficiency in transportation is how to make energy consumption or fuel less
than usual operations business. The energy efficiency could be determined by the level of
technology, the work method or organization system, time windows, and more specifically

2.1. OVERVIEW 59
is information system. The high quality of information system is used extensively in
MNC (multinational company) or global company which faced on time-line competitive
level. By good handling in management strategy in the energy efficiency project can
reached billions dollars during three to five years. Thumann and Wooddroof, (2005)
stated that with some purposed of capital in co-working mechanism between private and
public stakeholders will create useful linkages.
For example: 1. green ginnie mortgage backed securities, 2. building energy efficiency,
a standardized asset class, 3. CO2to energy efficiency.
Financing Issues
The energy efficiency gives impact in any sector of business activities. Based on the
concept of efficiency itself by Akhter (2003), explained that the future is now. Most of
the people need efficient society. To make answer the question of efficiency philosophy
is how we formulate the harmony in all type of business. The global efficiency here
is the critical point in energy efficiency in global supply chain in three dimensions of
logistics. The dimension could reach by transportation, production, and warehousing
within global supply chain framework. The direct impact of plant location in remote
areas is lowering the production cost and a probability to increase the investment level.
Discussing efficiency energy is continuous role in global business sustainable, see Grandval
and Soparnot (2005, 2008), also Martin (2005). The specific research in transportation
palm oil is very limited. Although, there are previous significant researches in the previous
time.
Airline Transport
Global Supply Chain Management
This section discussed aviation spare parts and all possibilities within its global sup-
ply chain management. There are complexities on aviation spare part supply chain; for
example: procurement level (picking zone, initial provisioning, inventory management),
inventory management (monitoring stock turnover, order and re-order spare part). Lo-
gistics problem-solving: Individual part shipments to reduce lead times and third party
logistics companies for certain spare part.
The triangle approaches are well connected and supported by each other. To do so,
the competitive strategy can be promoted by supply chain strategy. Both competitive
strategy and supply chain strategy should be maintenance well, in order to get strong
mechanism. The strong mechanism will create
Figure 1.2.2.: The Supply Chain Strategy: A Critical Success Factor for Sustainability
sustainability in the long run. Furthermore, in these cases many factories which are
involved in aircraft industry. In the case of global supply chain aircraft industries is a
good example. However, it is difficult to calculate energy efficiency in global supply chain
for this case study. But, the efficiency of aircraft engine has been formulated by engineers.

60 CHAPTER 2. LITERATURE REVIEW
The most important point is time to time their technological improvement. In the case
of low cost aircraft carrier model captive at least 45 percent market share in Indonesia.
A country spread across around 6,000 inhabited islands with a population of 250 million
people. There is the willingness to get international strongest at global supply chain level.
It should be take a think for very prospectus regional development, especially for
Indonesia’s future development. To execute the plan at regional level must be closer
to Singapore areas. To develop the idea has been constructed BATAM authority. It
is successful one for regional development which is main part of global supply chain
industries. The BATAM region so called “Free Trade Area”. The Indonesia’s authority
and international stake holder should take this chance. It would be importance one, if this
chance could be realized one. Due to, the biggest competitor is just in front of Indonesia
and Malaysia territory. The price of service delivery and time cost and supplier distance is
almost closer to Jakarta. Since the point of this business is going to get closer to Jakarta
without ignoring the international part.
The airline company is a good example, so called LION AIR has been proposed for
this initial stage of global supply chain. Private airline company (Lion Air) made a huge
business contract with Airbus. The next challenge is how to provide global supply chain
by managing international barriers. Such as: geographic challenges, time constraints, and
or distance constraints. The appropriate location proposed according to supply chain
issues will be located in Batam island authority. If the new factory efficient and keep the
level of competition with others, it will be better for Indonesia. Both for private sector
and government sector, see Hauswirth et al., (2004), also see Swanson, (2015).
Figure 1.2.3.: Overview the Energy Efficiency of Technology by Mode of Transport
Source: Bill Roberson, 2012.
According to fuel used and CO2 result from each trip is explained well in graphic.
Energy efficiency related to time, airplane operation and cost fuel (by Bill Roberson,
2012). The value of cost index related to relative effect cost on overall trip as compared
to time related direct operating costs. However, to find out the data from aircraft industry
is not easy at all. It might be possible one when we have research project with them.
2.1.3 Review on Production: CSR and Risk Management
General Review on Production Case in Global Supply Chain, From Own Per-
spective
The general review in production within global supply chain explored how to pointed
out how the production system contribute in energy efficiency. All product has been
produced have a significant impact to handle energy efficiency during production process.
Its cleared that energy efficiency will be hard to measure through global supply chain.
Our studies well explained for this issues, however the energy efficiency measurement can
be traced from global level down to local level. Therefore, all products could be traced
well whether the product has been product by international standard or not. This is

2.1. OVERVIEW 61
indicated on foot wear production section for coming challenges the evaluator or stake
holders should take an examination how the product originally has been manufactured.
One of solution is by putting labeling system on each product. The product shows crossed
from several examination and well treatment, particularly produced by energy efficiency
manufacturing system. This part will much easier to understand by look up at case study
on foot wear production. different method. Production in global supply chain, this section
is not possible to see whether exit or not exist in global supply chain scheme, Bullard et
al. (1978).
Production Efficiency in Manufacturing Industries
Openness and Production’s Strategy
Generally, the openness level and production strategy within trade liberalization are keys
role for some studies use plant and industry level data to know well productivity level.
Moreover, openness in trade refers to the degree to which countries or economies permit
to have trade with other countries or economies. This issue includes; foreign direct in-
vestment, borrowing, lending and repatriation of certain fund from abroad, Bueno Merino
and Grandval, (2012). Normally, open economies have greater market for opportunities.
However, at the same time they have great competitor at same sector in other countries,
too. The production strategy is where products ordered by customers and sending by
enterprises or transport agent to client, directly. The productive firms are which for those
able to have competence and survive from competition, also contribute to openness level.
This information provides for firms to compete abroad, see Grandval (2009) and Grandval
(2011).
As well, outsourcing and off-shoring are changing the nature of the firm, presenting
internalization or externalization decisions for international managers, and producing un-
precedented international relocation of economic activities, McClellan (2000). Its noted
that the historical trend in the atomization of the supply chain of the MNC in the world
involving the removal of the business activities of the center of MNCs strategy decision.
The division of the company’s value chain into smaller activities (micro-analysis) and
as an increasing in outsourcing locations which expanding the interaction with external
companies.
Thus, the recent willingness to divide all activities of the value chain: - Increasing
the proportion of the value added outside the organization; - Increasing the percentage of
transactions carried out abroad, McClellan, (2000) - Impact overall costs in total.
The disintegration of the supply chain and the dispersion of the global business of
the MNC activities involve more complexity to manage that can generate the progress of
coordination costs. In this case, the costs of coordination and transactions may outweigh
the benefits of the gradual disintegration and the disintegration of the supply chain Kotzab
et al. (2005). The task of the overall strategy is to determine the optimal level of
disaggregation of the supply chain, see Kotzab et al., (2005).

62 CHAPTER 2. LITERATURE REVIEW
The costs of complexity and coordination have still been contained for two main rea-
sons: Benefit from an experienced effect in the management and operation of a global
network of activities in the supply chain. The emergence of more sophisticated tech-
niques and management tools to retain the benefits of the expansion of a global network
of suppliers for keeping costs at a low level through ICT and ERP software, Mack, (2014).
According to D’aveni, (1995), the development of outsourcing and off-shoring observed
in recent years should lead to a greater degree of openness and a greater exchange of the
Indonesian economy with the rest of the world. Authors realized that this historical study
of the most significant period of these changes in corporate strategy for the period of 1975-
1995. According to Aminata (2012), principally, all kind of business activities are based
on where they can get the profit higher than other place”.
Manufacture Productivity
Miller and Blair, (2009) advised: to know the capacity of physical production in man-
ufacture; (1) measuring variations in the amount of labor and capital, and (2) defining
what relationships between labor, capital, and product. Making product differentiation
to make product more fascinating and satisfy consumer desired. The current condition is
in order to strengthen competitiveness.
A must to employ current best manufacturing technique, including plant layout, in-
ventory control, and improving machine reliability. The production inefficiency is not
because of not lack of manufacturing infrastructure but technological capabilities, also.
Government should make the non-discriminatory policy and select profitable industries.
Government and private firm have to work simultaneously each other in order to
achieve higher productivity for all sectors. Government and private sector should build
the network and center of education to create high level of productivity.
Industrial Development Efforts
Market intervention by policy makers to make change and to improve supply chain perfor-
mance can be considered. All comparisons can be made across related supply chains with
similar features. Then, how we consider overall properties of a supply chain and whether
or not we can find structural and behavioral appearances associated with different types
of supply chains: protectionist trade regimes are also more likely to favor large firms, both
because these firm’s products compete more directly with imports, and because sectors
with large, capital-intensive firms lobby the government more effectively Taudes, (2005).
According to Perlmutter, (1969), firm performance is based on economic efficiency,
which is com- posed of two components; (1) Technical efficiency, defined as capacity to
produce maximum possible output from a given set of inputs and technology. (2) Al-
locative efficiency, defined as the ability to equate marginal value products with marginal
costs. Outsourcing is used to describe all the subcontracting relationships between firms,
and the hiring of workers in non-traditional jobs.

2.1. OVERVIEW 63
For some extensions, Perlmutter, (1969) wrote that; following current issue is knowl-
edge for geography matters; economic interactions, it because of transport costs, time
costs, fixed costs of entering new markets, and informational barriers also, then how to
manage remote supply chains or production operations. As a note the agglomeration ap-
proach that we learned for profitable oriented, however the benefits coming from demand
and supply chain linkages, from pools of labour market skills, or from technical spill overs.
In addition, the matter of supply chain is the key role to sustain manufacture devel-
opment. London, (2008) stated: supply chain explores the market fragmentation concept
through the degree of firm integration along the supply chain in productive functions,
and structural fragmentation in numerous firms which in a highly level of competitive
environment. The results, we might like to improve profitability, efficiency, productivity
or innovation? The policies of governments towards supply chain management have been
of a direct and indirect type and have focused upon improvement of performance for small
to medium-sized enterprises (SMEs).
Supply chain management was evident at the manufacturing end of the chain, al-
though in varying degrees. Supplier development and co-ordination is evident, although
supply chain management is less. All possibilities for global supply chain which those
industries are profitable particularly as follows: food and beverages product, garment
and textiles product, paper and paper products, other chemical products, non-metallic
mineral product, basic metallic products and other, machinery except electrical, electrical
machinery apparatus, transport equipment product, and other industrial products, see
Herring, (1996).
Review on Foot Wear Production
Mostashari, (2011) explained, the exploration of current condition in global network and
framework. All companies have to promote the better machine by modern equipment,
and modern components assembling. Factory layout and internal management problems
are key factors to reach energy efficiency, by direct or indirect impact.
Figure 1.2.4.: The Continuous Development in the Energy Efficiency System
- Continuous Improvement
- Management Review
- Surveillance Action
- Implementation and Execution
- Planning
- Energy Policy
Source: Diagram adapted from ISO 14001
For continuing energy policy step by step, one should use a stable execution plan. En-
ergy policy can be implemented by planning and execution. Following this phenomenon,
it is urgent to use surveillance (control) and remedial action to get a good perspective in
management review. Well organized and well information systems are really needed to
back up resistant problem in company and related stake holder. The customer satisfaction

64 CHAPTER 2. LITERATURE REVIEW
is number one to get as many clients and captive market share increasing, and yearly.
Review on Long Range Energy Application Planning Model, LEAP
To estimate the demand of energy in the future, this research applies LEAP (Long Range
Energy Alternative Planning System) software. LEAP is useful to:
- identify or estimate the pattern of energy supply and demand in the future,
- identify the potent of problems,
- detect the impact of energy policy,
- it’s useful for analyzing various project and technology program,
- it’s useful analyzing other energy program initiative.
By using LEAP, the user will be able to calculate easily, with the aim to create
comprehensive simulation, including creation of data structure. Different from macro
economy model, LEAP does not estimate the effect of energy policy toward labor sector
or its impact toward GDP, though the model can be combined with LEAP. In other words,
LEAP does not automatically make a scenario of market equilibrium. It can be applied
to identify the scenario of micro cost. It is necessary to consider the advantage of the use
of LEAP, that is the rate of its usage flexibility, where the decision maker is allowed to
quickly switch their decision from the idea of policy into policy analysis without changing
the model fundamentally or changing the modeling principles that have been established.
2.1.4 Review on Warehouse: CSR and Risk Management
General Review on Warehouse Case in Global Supply Chain, From Own Per-
spectives
In this part, the research work focused on warehouse in global supply chain. The ware-
house here it means indicated that the warehouse is well being connected to global supply
chain management. The purpose of building research work on warehouse in global supply
chain is to get better understanding the impact of local business or project will deliver
specific impact to international business. Energy efficiency policy as of Anderson, (1993);
warehouse management should take care of inter-national, national and international reg-
ulation.
Review on Nuclear Warehouse Power Plants
Theoretical Review
Most of theoretical review in this section used input-output analysis and RAS method for
projection method, see Leontief, (1986) and Albino et al., (2002).
Energy Global Supply Chain
Four pillars of support for a fast globalizing nuclear industry focused on the nuclear
industry’s regulatory and policy environment Engage efficiently in nuclear commerce, a

2.1. OVERVIEW 65
global industry now representing nearly 15,000 reactor-years. International supply chains
for reactor new-build and ongoing nuclear operations Comprehensive presentation of the
facts on nuclear energy worldwide (public education). A threefold categorization of the
competencies necessary to run a nuclear power plant can be drawn, which includes:
- nuclear people with a specialized formal education in nuclear subjects (e.g. nuclear
engineering, radio-chemistry, radiological protection, etc.);
- nuclearized people with formal education and training in a relevant (non-nuclear)
area (e.g. mechanical, electrical, civil engineering, systems) but who need to acquire
knowledge of the nuclear environment in which they have to apply their competencies;
- nuclear-aware people requiring nuclear awareness to work in the industry (e.g. elec-
tricians, mechanics, and other crafts and support personnel).
Figure 1.2.5.: Typical of Power and Equipment
Sector Typical Equipment and Service Requirements Power Generation Reform and
New Build and Power Network Boilers Soot blowers, burners, waste handling, large
pumps, Compressors, Pipework, pressure vessel fabrication, Pollution, Control and Mon-
itoring.
Transmission Power Networks Switch Gear, Substations, Cables, Connectors, Pylon,
Fabrication and Installation, Heavy Duty Fuse Boxes. Smart Sensors, Electronic Con-
trol Systems, ICT Equipment, Services, Power Inverts, Grind Scale, Small Scale Energy
Storage Systems. Save Project (2012) and Wood (2013)
Economic Base Theory
The economic base theory stated that the main factor for economic growth correlated to
supply and demand for goods and services from out of region or border. The industrial
growth use local resource for example labor, raw materials and job creation.
Location Theory
The location theory explained how to expand the industrial location. The corporate
tend to minimize all cost by choose the best location and get closer to the market. In
the reality, industrial development is trying to get lower cost between production factor
(wages, energy cost, supply chain product end service, and communication) availability
in the market.
The corporate with difference of type need difference combination for production fac-
tors, especially to get lowest price. The one of limitation is technology level. By modern
communication contribute for production activity and good distribution. Principally, all
kind of business activities are based on where they can get the profit higher than other
place. Seemingly, the household looking for the suitable place based on the level of op-
portunity to get a job.

66 CHAPTER 2. LITERATURE REVIEW
Review on Electricity Warehouse Power Plants
Enrico (2013) in his book “the Monte Carlo simulation method for system reliability
and risk analysis”. It’s more cleared on introduction to simulation analysis which is
a simulation is the imitation of the operation of a real world process or system. The
behavior of a system is studied by generating an artificial history of the system through
the use of random numbers, Enrico (2013). These numbers are used in the context of
a simulation model, which is the mathematical, logical and symbolic representation of
the relationships between the objects of interest of the system. For further studies ex;
“simulation and Monte Carlo with applications in finance and MCMC explained” by
Dagpunar, (2007).
The effects of changes in the environment on the system, or the effects of changes in
the system on system performance can be predicted using the simulation model. Gnu-
meric includes a facility for performing Monte Carlo Simulation. Monte Carlo simulation
involves the sampling of random numbers to solve a problem where the passage of time
plays no substantive role. This is in contrast to discrete event simulation or continuous
simulation where the results from earlier in the simulation can effect successive samples
within a simulation experiment. The Monte Carlo simulation will be enabled through
the use of the random number functions as described in Gilks et al., (1996), and Fish-
man (1996), and the results presented along with statistics for use in analysis, Kalos and
Whitlock, (1996), and Kehr and Prasad, (2000). More detailed can be traced on articles
and books written by Taudes, (2005), Carriero, (2009), Kennedy, (2009), Suzuki, (2010),
Carrera, (2010), Zhua, (2007), Save Project, (2012), Manzini, (2011), Lan and Unhelkar,
(2006).
Conclusion
The point is the competition become a new form of collaboration era to make the world
of efficiency in many business aspects following those phase on competition, we should
get in touch on innovation. Because, if there is no comprehensive innovation the demand
of clients and necessity of human can not be well provided.
Everything should be managing carefully at any part of supply chain with intention
to global market, Aminata (2012). In overall company strategies in the long term policies
energy strategies should be the main part of company mission strategy. It could be an
increasing the use of renewable energies. there are the following energy strategies: F. J. M.
van Houten, Twente University of Technology, Netherlands by H. J. J. Kals, “Strategy in
Generative Planning of Turning Processes”; Annals of the ClRP Vol. 35/1/1986; passive
strategy: “there is no systematic planning”.
The issue of energy and environmental management is not perceived as an indepen-
dent field of action. The organization only deals with the most essential subjects. The
European Union has clear instructions for its members. The “20-20-20-targets” include,
that the member states have to reduce greenhouse gas emissions by 20% below 1990 levels,
increase energy efficiency by 20% and achieve a 20% share of renewable energy in total

2.1. OVERVIEW 67
energy consumption by 2020.
Figure 2.2: Interaction Project Partners and the Stakeholders
Ethical and normative basis of the energy strategies. The basis of every energy strategy
is the corporate culture and the related ethical standards applying in the company. Ethics,
in the sense of business ethics, examines ethical principles and moral or ethical issues that
arise in a business environment. Ethical standards can appear in company guidelines,
energy and environmental policies or other documents.
Existing Current Problems
The current existing problem is managing the energy trilemma. It is to answer the current
existing challenges and problems rose around the world. The challenge is so called energy
trilemma that consist of energy equity, energy security, and energy sustainability.
Figure 2.3: Supply Chain Construction

68 CHAPTER 2. LITERATURE REVIEW
Theory and Its Extension
Thumann and Wooddroof (2005); “Handbook of Financing Energy Projects”, p.120; “En-
ergy effi- ciency project developers claim the benefits associated with reduced emissions
from the implementation of energy efficiency projects:
1. importance of standardization to gather data and report savings,
2. development of a baseline model to distinguish between average and marginal energy
consumption,
3. length of baseline period; how to deal with all the uncertainties,
4. discussion on additional criteria vis-a-vis EE projects, the application of appropri-
ate emission factors to convert units of energy saved to units of emissions saved”,
William (2010).
Thumann, (2002) and Thumann and Dunning, (2008), deliver about plant engineers
and managers guide to energy conservation, p.16-22; “energy management is now con-
sidered part of every plant engineers job. The plant engineer needs to keep abreast of
changing energy factors which must be incorporated into the overall energy management
program. The accomplishments of energy management have indeed been outstanding.
Safety, maintenance and now energy management are some of the areas in which a plant
engineer is expected to be “knowledgeable”. A multi-divisional corporation usually orga-
nizes energy activities on a corporate and plant basis.
On the plant basis, energy activities are in many instances added on to the duties of
the plant manager. The other simplest definition for an energy assessment; “An energy
assessment serves the purpose of identifying where a building or plant facility uses energy
and identifies energy conservation opportunities”, Meyers and Laskowski (2001). Also,
Eliasson and Lee (2003), Integrated Assessment of Sustainable Energy Sys- tems in China,
The China Energy Technology Programs: A Framework for Decision Support in the
Electric Sector shandong Province.
Overview Energy Management in Global Supply Chain
World Energy Council, (WEC); reporting highlight the massive challenge to achieve har-
mony at the level world energy system management. As world energy congress, Daegu,
Korea, October 14th, 2013. The world is set to face several significant challenge for bal-
ancing global energy needs. At final stage, the energy trilemma that over four decades
has been focusing for construct energy future 2050. Total primary energy supply chain
is to set 2050 by between 61 percent and 27 percent, with fossils fuels remain the domi-
nant energy source by supplying 77 percent to 59 percent from the total of energy mix.
The WECs scenario exploring what happening in the world for current existing prob-
lem. In the future, the real impact of today’s choices on tomorrows energy landscape,
(infrastructure, open source scenarios project will distribute the well assessment output).

2.1. OVERVIEW 69
Conclusion
Strategy of short-term profit maximization: The management is concentrating exclusively
on measures that have a relatively short payback period and a high return. Measures
with low profitability are not considered. Strategy of long-term profit maximization:
This strategy included a high knowledge of the energy price and technology development.
Moreover, these measures can help to improve the image and increase the motivation of
the employees. Realization of all financially attractive energy measures: This strategy has
the goal to implement all measures that have a positive return on investment. Maximum
strategy; for the climate protection one is willing to change even the object of the company.
In reality, all hybrid forms applied by different strategies.
Energy strategies of companies show that many companies are trying to promote its
image and time protect the climate through a proactive and public energy strategy. Fur-
thermore, they have six principles: e.g. restoring and preserving the environment, reduc-
ing waste and pollutants, educating the public environmental conservation, collaboration
for the development of environmental laws and regulations.
When looking at the energy strategies of companies it is important to have the topic
green washing in mind. This is a form of propaganda in which green strategies are used
to promote the opinion that an organization’s aims are environmentally friendly.
2.1.5 Sample on Energy Resource Management
It shows of all research works’ position and all complex interaction. All categories can be
summaries as in primary source, energy type, energy market, and demand for energy. For
transportation section, the energy primary source used solar, for electricity warehouse
used uranium for energy production (paper work published). Theme is based on the
energy efficiency of the global supply chain in production, transportation and storage of
products. The objective is optimizing energy throughout the supply chain for a minus
impact on the environment.
1. supply chain set up via chain efficiency can be examined under there scenarios,
based on low costs,
2. reduce average transportation distance,
3. change the mix of transportation modes,
4. carrier should influence the priorities of manufacturers by clearly communicating
their needs and helping get energy efficient assets up to scale by pooling orders,
5. individual assets; applying load factor, maintenance regime, and route planning,
6. assess usage of collective assets; avoiding congestion, upgrading infrastructure, or
engaging in smart traffic management”.

70 CHAPTER 2. LITERATURE REVIEW
Figure 2.4: Primary Energy Sources and Energy Carriers
The most relevant ethical ideas for the energy management are utilitarianism. This
form of ethics has good or right, whose consequences are optimal for the welfare of all
those affected by the action (principle of maximum happiness). The energy management
concerned for the existing of external costs. They do not directly affect those who profit
from the economic activity but non-participants like future generations. This error in the
market mechanism can be solved by the internalization of external costs. The fundamental
ethical idea says that “everyone who is affected by the decision, must be involved in
decision making. This is done in a fair dialogue; the result is completely uncertain.
The de-ontological ethics assigns individuals and organizations certain obligations. A
general example is the golden rule: “One should treat others as one would like others to
treat oneself”. Listing related references: Darnell, (1994); Wickeren, (1973); Twiss and
Weinshall, (1980); Booth, (1980); Ethridge, (2004); Gujarati, (1999); Malinvaud, (1980);
Hal, (1996, 1997); Codaret, (2004); Verbeek, (2000); Magidson, (1981); Steven, (2004);
Bergh, (2002).

Chapter 3
Problem of CSR and Risk
Management
3.1 Introduction
Logistics activities include the transport, storage, and handling of products as they move
from raw material, to goods in process, and finally to finished goods ready to be moved
to the final point of sale for consumption. Despite its high contribution to the economic
development, it is only in the last fifty years that logistics started to be regarded as a ma-
jor determinant of business performance and a main field of academic study. During this
period, logistics activities were structured to maximize the profitability of all firms in the
supply chain. However, this calculation of profitability included only economic costs while
ignoring social and environmental costs. For the last fifteen years, public and governmen-
tal concern about social and environmental impacts of logistics firms has increased, as has
the pressure to reduce these impacts (McKinnon, 2010). The following section presents
the background of the topic in interest. It outlines the social and environmental impacts
resulting from logistics operations, a definition of Corporate Social Responsibility (CSR),
the development of CSR, the growth of CSR reporting, and the development of the Triple
Bottom Line Theory. These will be followed by a discussion of the problem at hand, which
will lead to the purpose of this paper and the main research questions. The introduction
chapter will be wrapped up with the outline of the thesis. Logistics Impacts, concerning
environmental impacts of logistics firms, distribution activities of goods cause harm to the
air quality, generate noise, cause accidents, and contribute to global warming (McKinnon,
2010). Freight transport accounts globally for almost 8 percent of CO2 emissions while
warehousing and material handling contribute a 2-3 percent to this total. The energy
consumed by freight transport is increasing at a faster rate than the energy used for cars
and busses (Ribeiro & Kobayashi, 2007). Although governments are working on cutting
down CO2 emissions from their national economies, shipping alone could account for up
to 50 percent of the total CO2 emissions by 2050 (Committee on Climate Change, 2008).
On the other hand, the social impacts of logistics firms according to Carter and Jennings
(2002) are associated with three main activities which are purchasing, transportation, and
71

72 CHAPTER 3. PROBLEM OF CSR AND RISK MANAGEMENT
warehousing. The social impacts of purchasing management include purchasing from mi-
nority suppliers; and collaborating with suppliers who use sweatshop labor, child labor,
offer low “living wage”, and operate in unsafe locations. The social impacts of trans-
portation activities can include the non-use of minority carriers, hiring and promoting
unequally, long operating schedules for drivers, and payment of inadequate wage. The
social impacts of warehousing management consist of hiring and promoting unequally,
dealing weakly with family issues such as helping employees find child care, offering poor
training programs to employees that teach them how to use equipments safely, and not
providing necessary equipment to workers such as gloves, hardhats, and hard-toed shoes.
3.1.1 CSR Organisation
Mission of the network, CSR Europe’s Network of National Partner Organisations (NPOs)
works with over 10,000 companies and key stakeholders in 30 countries across Europe to
raise awareness, build capacity, promote and support the development and implementation
of CSR practices. Through collaborative action and membership services, we strive to lead
a local, national and European movement towards responsible and sustainable business.
CSR Europe and its national partners work together on collaborative projects under
the European Pact for Youth, collaborative project on Business and Human Rights and
the European CSR Award Scheme. Members of the network actively collaborate on
development of CSR publications, share experience as well as inspiration during joint
meetings and events.
3.2 Problem of CSR
Today, many of the multinational corporations are trying to decrease stakeholders’ pres-
sures by ensuring that their suppliers comply with social and environmental standards.
This is achieved by using various codes of conducts (Andersen \{}& Skjoett-Larsen, 2009).
A code of conduct is a document stating a number of social and environmental standards
and principles that a firm’s supplier are expected to fulfill (Mamic, 2005).
3.2.1 CSR and Energy Management on Decision Sciences
The finding strategic of CSR’s matrix on business-economic, and social perspective sim-
ulation:
1). formal and informal coordination mechanisms for knowledge sharing, 2).the orga-
nizational capability views of the firm should be extended to include a moderating role
for intra organizational competition, 3).inter unit knowledge sharing can enhance over-
all organizational through collective learning and synergistic benefits from the processes
of exchanging information, know-how, 4).reducing hierarchical constraints and increasing
inter unit social interaction are the directions that managers may pursue to encourage
internal knowledge flows and enhance the capabilities of their organizations.

3.3. PROBLEM OF RISK MANAGEMENT 73
The point is how to develop inter relationship inter-stake holders, closely. The analytic
hierarchy process (AHP) is a mathematical theory for measurement and decision making
that was developed by Saaty (2000),1970’s when he was teaching at the Wharton Business
School of the University of Pennsylvania.
Applications of the analytic hierarchy process can be classified into two major cate-
gories:
1. the evaluation or prioritization of alternative courses,
2. the evaluation of alternative future outcomes (forecasting).
A decision support tool developed by Saaty (2000) in a theory and methodology for
modeling problems in the economic, social and management sciences. A problem solving
framework used for determining the best of several alternatives of each of the criteria.
expert choice is one commercial software tool based on the AHP. The process of AHP,
see the appendix A.3.
3.3 Problem of Risk Management
EU multi stakeholder forum on corporate social responsibility, (2015), stated that the
commission has defined CSR as the responsibility of enterprises for their impact on society.
CSR should be company led. Public authorities can play a supporting role through a smart
mix of voluntary policy measurement. Companies can become socially responsible by:
• following the law,
• social,
• integrating social,
• environmental,
• ethical,
• consumer,
• human rights concern into their business strategy and operations.
In the interest of enterprises shows that CSR is important:
1. CSR provides important benefits to companies in risk management, cost savings,
access to capital, customer relationships, HR management, and their ability to in-
novate.
2. CSR makes companies more sustainable and innovative, which contributes to a more
sustain- able economy.

74 CHAPTER 3. PROBLEM OF CSR AND RISK MANAGEMENT
3. in the interests of society - CSR offers a set of values on which we can build a more
cohesive society and base the transition to a sustainable economic system.
The EU’s policy is built on an agenda for action to support this approach. It includes:
1. enhancing the visibility of CSR and disseminating good practices.
2. improving and tracking levels of trust in business improving self and co-regulation
processes.
3. enhancing market rewards for CSR.
4. improving company disclosure of social and environmental information, then inte-
grating CSR into education, training, and research.
5. emphasizing the importance of national and sub-national CSR policies.
6. better aligning European and global approaches to CSR. To evaluate the CSR strat-
egy, the commission launched a public consultation on CSR 2011-2014.
Keys and Graaf (2009), on their article said that the CSR’s issue for some leaders
have started to perform at it as a creative opportunity to strengthen the businesses while
contributing to society at the same time. CSR as central to their overall strategies, and
key business issues. The lesson learned which can be taken from enterprise performance
which connecting to CSR within a practical way directly to the leaders to assess the right
opportunities of CSR.
Mapping of the perspective of CSR for society and business are important one. For
example, here is the pet project. Its indicated low impact for business and society. The
philanthropy tends to be an action how the enterprise gave donation and on propaganda is
the way how enterprise shows the effort of advertising. The best positioning is partnering
which delivering maximum benefit to society and business.
Finally, the energy efficiency in global supply chain shows that efficiency energy in
global level could be perform by any type of product, mainly by type of energy used.
By focusing on how to transport them, the way of production system, and how to build
warehouse system to keep source of energy become more efficient to serve inter-linked
of chains and end users. To point out the link between the subject and management.
This work explained the hyper competition which should lead the supply chain for energy
efficiency to which is added the CSR pressures to lower environmental impact. First of all,
the management strategy is a key role in hyper competition. The hyper competition can
be performing by energy efficiency. Because, each enterprise should each step of activities
in efficient manner. Included, the energy consumption and choice the type of energy.
The management of energy efficiency depends on the ability and capacity of performance
of each enterprise. The choice of energy source, type of energy used, and production
technology is the part of management strategy. Regarding the capacity of managerial

3.3. PROBLEM OF RISK MANAGEMENT 75
Figure 3.1: Mapping of the Perspective of CSR for Society and Business, Source: Keysand Graaf, 2009.
level for winning the competition in hyper competition. All managers should take all
decision for all sources in well-organized norm.
On this case, we put energy efficiency which is a leading issue in global supply chain
management. To handle all this things, especially for assessing the energy efficiency which
giving lower environ- mental impact. This action related to the managerial level. To do
this work, the analytical hierarchy process can be a tool for managerial decision. The
manager become independent to take the decision. Applying the the analytical hierarchy
process as a tool for decision in term of which type of energy and production process is
important one. We can propose on it, which one giving us lower environmental impact.
There are additional advantages for managerial decision when applied analytical hi-
erarchy process instead of ordinary questioner, Saaty (2000). Concerning integral policy,
Turner (2001) and Herring (1996) indicated that an ideal solution may be an integrated
policy of carbon taxes, energy efficiency and renewable to pressure corporate social re-
sponsibility. All type of enterprise covered small, medium and large size have to follow the
CSR regulation. The CSR regulation can be identified as aptitude of enterprise. The reg-
ulation of CSR can be regional, national, and international level. The CSR performance
as the guarantee of the enterprise to show that has capacity and ability concerning their
activities to do kind of responsibility to the community and environment. In the future,
the company’s CSR will be an advertisement. To do so, the company must create the an-

76 CHAPTER 3. PROBLEM OF CSR AND RISK MANAGEMENT
nual report of CSR for showing their capacity that responsible enough to the community.
The business activity particularly for industrial manufacture has environmental concern.
To do this purpose the enterprise follow their own regulation and the regulation of gov-
ernment. In term of international aspect must follows Kyoto protocol and the latest one
each enterprise or country level must respect the COP 21, 2015, Sbihi, 2015. In order to
increase the production level which at the same time reducing the smaller environmental
impact applying energy efficiency is the key solution. By the CSR scheme, the enterprise
will take an action for keeping energy efficiency at any business activities (transportation,
production system, and warehousing management). D’aveni (1995), stated that each en-
terprise should be able to handle energy efficiency. Moreover, energy efficiency as one
of tool to know that the company efficient or not. The parameter of energy efficiency
as the lead factor for hyper competition, Horace (2006), and D’aveni (1995), because,
without optimizing the capacity of managerial level, competitiveness level, and following
regulation the global supply chain strategy cannot be reached by enterprise. Normally,
by enterprise which already known internationally or so called, multinational company.
Widely Used AHP:
1. cost-benefit analysis,
2. strategic planning R and D,
3. priority setting and selection technology choice,
4. investment priority for developing tourism,
5. evaluation of for new telecommunications services,
6. other evaluation of alternatives.
In certain activities; Zorzoli, (1988), in a near future the wider and cheaper availability
of expert systems will also help the management of utilities in industrial plants. Last
but not least, the development of new sensors and sensor applications will improve the
capability of optimizing the management of such utilities.
The potential of these techniques is well illustrated by a tunable laser system, which
is measuring in real time the chemical composition inside a combustion chamber.
3.3.1 CSR in Supply Chain and Its Organization
Definition of Corporate Social Responsibility
If we took a look for the definition of CSR which is a concept of companies integrate
social and environmental. Concerning in their business operations and in their interaction
with their stakeholders on a voluntary basis. Being ”socially responsible” means not only
following law or legal expectations, but also refer into human capital, the environment
and the relations with stakeholders” (As noted in Commission of European Communities,
2001, p.6).

3.3. PROBLEM OF RISK MANAGEMENT 77
Development of CSR
Since 1950s, its cleared that the concept was SR(social responsibility) instead of CSR
(corporate social responsibility), it caused of the absence of modern corporations (Carroll,
1999). In 1953, Bowen started writing about SR after realizing that activities and decisions
making in large businesses affect the lives of citizens, and that managers (businessmen
back then) should be responsible for the consequences of their actions. Bowen defined SR
as “the obligations of businessmen to pursue those policies, to make those decisions, or
to follow those lines of action which are desirable in terms of the objectives and values of
our society.” Research on CSR continued to grow gradually between 1950s and 1990s. In
1994, Carroll conducted with academic leaders concerning social topics where the question
was “What topics do you see as most important for research in the social issues?” CSP
(corporate social performance) was rated third out of twelve issues; business ethics was
first and international social issues was second. Moving to the twenty-first century, Carter
and Jennings (2004) indicated that CSR is not limited only to business ethics, but it
rather extends to include community, philanthropy, safety, workplace diversity, human
rights, and the environment. Also because the nature of business relations is changing
from national to multinational due to integrated supply chains, the concept of CSR is also
transforming. Not only do companies have to be socially and environmentally responsible
on the national level, but also in relation with their global partners such as suppliers,
intermediaries, and third party logistics. The pressure exercised on these multinational
firms comes from various stakeholders such as customers, employees, unions, shareholders,
government, NGOs,and media who’s concern about social and environmental conditions
in off-shore production sites is increasing (Maloni & Brown, 2006). This concern has
largely resulted from multimedia communication that continuously shows irresponsible
practices such as violation of union rights, use of child labor, unsafe work conditions,
pollution, and discrimination. Famous examples that have been followed by media are
Nike, Gap, H&M, and Wal-Mart (Frost & Burnett, 2007).
Transportation
In example of Corporate Social Responsibility, the one of company operated in time of
dynamic change in the TFL market. In order to meet ever-increasing customer expecta-
tions, we do not limit our proposal to an attractive service price but we also engage in
community-oriented activities. When a customer buys a service from us, they can be sure
that its best quality is coupled with ”ethical background”. Corporate Social Responsi-
bility is actually at the core of SKAT Transport’s comprehensive business management
philosophy. CSR is not a strictly defined and finally shaped concept but rather a pro-
cess and a conscious attitude. What is valuable for the organizational culture of SKAT
Transport is the fact that formal top-down activities are supplemented by community in-
volvement of employees themselves. As a socially responsible company, we pay attention
to check our business partners – in terms of reliability but also as regards their respect for
labour rights, OHS rules and fair competition. In this way, we encourage other companies

78 CHAPTER 3. PROBLEM OF CSR AND RISK MANAGEMENT
to raise their own standards of business.
Basically, CSR activities consist in: community giving – mainly through sponsorship
and charity employee involvement.
As part of community giving projects, the Management Board sponsors or charitably
supports community welfare organisations and various events. These activities have been
conducted for several years now. The highlights include: We have had the pleasure of
being involved in a tour of the Stena Vision ferry, organised by our company and our
business partner, Stena Line Polska, for a group of Kazakh children of Polish origin.
Everyone enjoyed themselves, and the captain of the ferry was even kind enough to let
the children wear his captain’s hat! We also arranged a tour of the Tricity’s museums
and the most recognisable historical sites. We believe that every one of the 20 children
will fondly remember this great adventure for the rest of their lives, and perhaps visit us
again one day.
Production
Corporate social responsibility (CSR) reporting, sometimes referred to as the triple bot-
tom line (for ”people, planet and profit”), has seen significant growth in the past five
years, nearly tripling from 2,000 in 2007 to almost 6,000 in 2011, according to Corpo-
rate Register. Manufacturers in particular have taken to releasing these reports, if for no
other reason than to keep their customers happy or at least informed about the nature
of their sustainability initiatives. Companies are expected to be able to track the carbon
footprint not only of their own manufacturing activities, but also their transportation,
distribution and procurement activities, while monitoring the related activities of their
extended supply chains as well. They’re also expected to adhere to diversity and inclusion
in their hiring practices.However, such is the momentum toward full disclosure that even
the biggest and most successful companies are being held accountable by stakeholders for
incomplete reporting. ”If there is a production process that can be made safer, we seek
out the foremost authorities in the world, then cut in a new standard and apply it to the
entire supply chain.”
3.4 Conclusion
This text, however, goes beyond case studies. In it, the author analyzes, with masterly
skill, the fundamental concepts of data warehousing, data marts, and online analytical
processing (olap). He also devotes his attention to such important topics as data mining,
how to build a data warehouse, and potential applications of data warehousing technol-
ogy in government. This compact and well-organized text is intended for postgraduate
students of engineering (m.tech.) and computer applications (mca) as well as for soft-
ware professionals and database practitioners. The book, which beautifully blends the
principles and real-life case studies, should be cherished both by the student and the
professional for its clarity of exposition and its contemporary approach.

3.5. ENERGY EFFICIENCY MANAGEMENT 79
3.4.1 Application AHP Matrix on Energy Management
Thollander and Palm (2013), industrial energy management is perhaps the most important
factor in overcoming barriers to energy efficiency and closing the energy efficiency gap.
Energy management has been little emphasized in research or policy touching on industrial
SMEs, and is accordingly under developed in research and practice. Companies need to
address energy strategically to reduce the energy efficiency gap. Industrial companies
that take a strategic approach by adopting energy management practices may reduce
their total energy use by up to 40 % .
How successful ideas and values become established in companies, however, is not
so well documented, possibly because interviews and questionnaires have generally been
used in earlier research. Combining these methods with observational approaches would
foster better knowledge of these issues. Observational methods would also deepen our
understanding of energy management in general and introduce a more complex system
analysis, see Aminata et al., (2002), Aminata, (2012), Aminata et al., (2014c,e,f,a,d,b),
Berglund and et al. (2011).
3.4.2 Conclusion
There are a lot of decision analysis tools that can be done in this research. However, the
AHP has been chosen with a strong proof of concept from the theoretical background
up to research application for all customers. The CEO of the company can be a role
player to serve all clients’ needs or existing complain by delivering questioner built up by
interaction. For example, between company, government and other stakeholder to find the
best solution to promote corporate social responsibility. The CEO will lead the evaluation
team on making or break decision for the company. So, all decision is well known by all
members or stakeholders, fairly. This way can lead to follow up the research progress or
better service for customer. The result will prove the strong case studies since all data
based on questionnaire or by judgment of all clients how to improve all categories or all
variables in research or report analysis.
3.5 Energy Efficiency Management
Regarding energy efficiency development for global supply chain enterprises, it must be
an agreement for all stake holders to maintain and to improve the quality and quantity
energy efficiency to decrease of CO2 emission. Therefore, to make law enforcement and
make it real in business activities must be create in global supply chain.
By tracking supply chain until to the origin of first supplier which the first product
has been supplied by first enterprise. Respecting this current views, that there are many
regulation and agreement to do so. The real time simulation is to optimize the global
supply chain management and supply relationship management for the future research
possibilities, for example times series, cross section, and real time data development to

80 CHAPTER 3. PROBLEM OF CSR AND RISK MANAGEMENT
promote global business. Building up the effectiveness of supply chain from local to global
market vice versa and its impact for business development.
Why do we have to study the global supply chain that could be seen from trans-
portation production and warehouse perspectives? Because, of its function as well as the
definition of “supply chain management is a cross-functional approach that includes man-
aging the movement of raw materials into an organization, certain aspects of the internal
processing of materials into finished goods, and the movement of finished goods out of
the organization and toward the end consumer.
As organizations strive to focus on core competencies and becoming more flexible,
they reduce their ownership of raw materials sources and distribution channels. These
functions are increasingly being outsourced to other firms that can perform the activities
better or more cost effectively. The effect is to increase the number of organizations in-
volved in satisfying customer demand, while reducing managerial control of daily logistics
operations. Less control and more supply chain partners led to the creation of the concept
of supply chain management. The purpose of supply chain management is to improve
trust and collaboration among supply chain partners, thus improving inventory visibility
and the velocity of inventory movement”, Lambert, (2008). It would be more clear one
as figure 2.2.1:
The strategy establishes risk management as one of the key guiding principles of our
approach to promoting a secure, safe, efficient, and resilient supply chain system. The first
step to effective risk management is to identify and understand risks across the system
as a whole. The evolving and dynamic nature of threats and vulnerabilities make this a
challenging task, complicated further by the scope and complexity of the system itself,
White, (2013).

3.5. ENERGY EFFICIENCY MANAGEMENT 81
Figure 3.2: The Perspective of Trilemma for Managing Complex and Dynamic Supplyand Demand Networks

82 CHAPTER 3. PROBLEM OF CSR AND RISK MANAGEMENT

Chapter 4
Risk Management in Supply Chain
Organization
4.1 Introduction
In this research, we explored transport energy efficiency in global supply chain perspective.
Emphasizing on sales, based on geographical areas. Because, until now the company
group has been exporting the medium and final products to worldwide network. With
key markets in Asia Pacific, North of America, Latin America, and Europe.
Wei et al., (2011), p. 60; “due to the nature of their manufacturing operations, many
chemical manufacturers have to coordinate their inbound and outbound transportation
of materials (raw materials and finished products) in bulk. They applied a wide variety
of transportation mode which include pipelines, tanker ships, tanker rail cars and tanker
trucks to support global supply chain materials.
For hazardous products in nature usually is governed by regulatory policies (that are
legislated to address environmental, safety and security concerns) such as on the move-
ment goods and tracking system of hazardous materials. In addition, also it means that
transportation system has chosen to deliver the product in order to maintain required
documents such as cleaning inspection system. In wide broad perspective must respect
the environment law which which shows in CSR documents. In contrast, most manufac-
turers from non-chemical industry deal with raw materials and finished product which
are subjected to the regulatory institution and maintenance requirements. Moreover,
their inbound and outbound transportation of materials are usually undertaken in certain
volume. Surely, transportation management of products in global oleo chemicals supply
chains is complex than supply chains in non-chemical industry.”
4.1.1 All case studies Concern to CSR and Its Risk Management
we investigate three main supply chain functions that are production, transport and
warehousing at global level where the energy consumption is a major issue to maintain a
high level of several outputs. We intend to develop and show how the concept of energy
83

84 CHAPTER 4. RISK MANAGEMENT IN SUPPLY CHAIN ORGANIZATION
efficiency is critical for global supply chain. Many questions are possibly and legitimately
to ask
4.2 Transportation
In climate change issue, there is a need for logistics solutions for supply chains optimization
based on energy efficiency problem, Halldorsson and Kovacs, (2010). The idea of article
drew the questioning of the optimization practice in the palm oil sector. A little empirical
work has been carried out on the process by the firm to implement global perspective
of global transportation. According to Halldorsson and Kovacs, (2010), energy efficiency
has been largely neglected in logistics and SCM.
Energy efficiency required the important aspect of operational level, Dey (2011). For
example, supply chain management must perform new performance measurement that
included energy efficiency indicator. In order to adapt the environmental law, see Hall-
dorsson and Svanberg, (2013), Adeli and Karim, (2001), p.48.
CSR - Efficiency Risk Management in Global Oleo Chemicals
we investigate three main supply chain functions that are production, transport and
warehousing at global level where the energy consumption is a major issue to maintain a
high level of several outputs. We intend to develop and show how the concept of energy
efficiency is critical for global supply chain. Many questions are possibly and legitimately
to ask
Introduction
we investigate three main supply chain functions that are production, transport and
warehousing at global level where the energy consumption is a major issue to maintain a
high level of several outputs. We intend to develop and show how the concept of energy
efficiency is critical for global supply chain. Many questions are possibly and legitimately
to ask
Global Transportation
World Energy Council (WEC), stated that transportation policies and potential develop-
ments both fuels and technologies as driving force to examine and to combine transporta-
tion scenarios, so called “freeway” and “tollway”. The main difference between these two
scenarios are the degree and style of government intervention to regulate future transport
markets (WEC report, p.6, 2011):
• The freeway scenario envisages a world where pure market forces prevail to create
open global competition

4.2. TRANSPORTATION 85
• The tollway scenario describes a more regulated world where governments decide to
intervene the market and to promote technology, moreover infrastructure develop-
ment.
Furthermore, freeway and tollway scenarios describe the extreme ends of the potential
future problem. The reality exposed these two scenarios with differences playing major
role. Regarding the initiatives to restructure the manufacturing sectors are by making
the priority for intermediate goods. The high impacts between backward and forward
linkages are such as textiles, pulp-paper, food processing, rubber and wood-based prod-
ucts. Rationalizing trade policies and industrial regimes will create market, efficiently and
transparently, McClellan (2000). By helping small and medium enterprises will generate
employment and benefit consumers as well as to expand the distribution system.
Foreign direct investment had a moderate impact on the development of supplier and
supporting industries in Indonesia, due to foreign firms brought more than half of their
input from abroad. The government should continue all efforts to lower transaction cost
and to reduce unnecessary administrative and bureaucratic procedures to speed up the
approval of investment, Larsen et al. (2013). The important things are formulation and
implementation of the effective global trade strategy for any products, WTO, 2010.
An Energy Efficiency on Transportation in Global Supply Chain Framework
This research identified the way of efficiency in oleo chemical transportation within global
supply chain perspective. By emphasized on sales this based on geographical areas. The
company group has been exported the medium and final products to worldwide network.
The field research located in France and European customers. One must take into account
for some additional issues relating to national legislation to deliver the specific product
in specific time windows, particularly for the hazardous products.
The research work will give a new perspective for transportation industries by setting
up new strategy on managing energy (fuel) consumption with basis of the concept of
energy efficiency in oleo chemicals business scheme. So, it will give an advantage to
the transporter and oleo chemicals company itself by set up energy efficiency in various
methods and strategies.
Energy Efficiency in Global Supply Chain
Wu et al., (2012), energy efficiency, fuel efficient, and fuel saving are the most mentioned
keywords on the study of green supply chain management practices among large global
corporations. It has been taken by the company for paying attention environmentally
responsible (corporate social responsibility) and cost saving measures.
The Meaning of Energy Efficiency
To promote the advantage of energy efficiency is based on business development. We
focused on literature review and also, all possibilities on previous research works and

86 CHAPTER 4. RISK MANAGEMENT IN SUPPLY CHAIN ORGANIZATION
related articles. There are many kinds of definition of energy efficiency. It could be
distinguished on fuel efficiency, fuel economy, and fuel consumption. So, energy efficiency
in transportation is a relative term used to describe how effectively fuel is used to move
a vehicle. The fuel efficiency is connected to the amount derived from fuel used. The
fuel economy is ex- pressed as miles per gallon of fuel consumed (”taken from the book
of Real Future Energy Efficiency in USA”, 2010). It refers to the fuel consumed by the
vehicle as it travels a given distance. European case is expressed in liters per 100 km”).
Energy Efficiency: Cost Saving Issues
Energy efficiency in transportation is how to make energy consumption or fuel less than
usual method or within normal business operations, see Varma and Clayton (2010). The
energy efficiency could be determined by the level of technology, the work method or
organization system, time windows, and more specifically is information system.
The high quality of information system is used extensively in MNC (multinational
company) or global company which is most of them on time line competitive level. By good
handling in energy efficiency management project reached billions dollars during three up
to five years. Bertrand and Fransoo (2002), gave an idea for co-working mechanism
between private and public stakeholders. For example:
1. green ginnie mortgage backed securities,
2. building energy efficiency as standardized asset class,
3. CO2 to energy efficiency.
Time constrains for delivering the product, also efficiency during loading and unloading
product are crucial parts in oleo-chemical industries. For instance, one plant produce
more than hundreds tons per day which will deliver huge impact on energy consumption.
Influencing the level of stock, logistics and supply chain operations. In this step, promoting
the sustainability of multinational companies is the key point. because, if there is a
mistake in calculation, stock planning will take costly for all business operations.
Connecting to the energy matter, there was the question why energy efficiency is
important for all aspect? which is to improve energy efficiency which leads better security
environment aspect. Also, by increasing the energy efficiency (supply, accessibility, and
etc.), competitiveness and profitability will contribute to reduce the overall impact global
warming.
Oleo chemicals industry must choose a good transport service to handle energy effi-
ciency matter, Aminata et al. (2013). The main problem is to provide the best choice of
transport service which is a challenge in complex business activities. All business activi-
ties in their transportation section or department is to support sustainability of business.
They have to assure the product will arrive safely to all clients, around the world. Refer
to the environmental impact, transportation service must be careful with environmental
aspect. However, the report from Ademe, (2012) showed that between 2000 and 2007,

4.2. TRANSPORTATION 87
the road transport statistics, shows efficiency improvement. It happened by management
transportation and eco-driving when the car used on the road. Moreover, the efficiency
of vehicle (measuring by the ratio ton/km) is efficient, time to time.
According to the legislation, the oleo chemicals industries are one of the most danger-
ous output products. It is not only in the industrial supply chain system but following
the conduct of regional law and national law for some circumstances. The storing and
transporting the oleo chemicals product are really treated in secure system. So that,
the company and their global supply chain network have to make a guarantee that inter
country fulfilled the minimum requirements for keeping the best quality of product, Liu
et al., (2010). see, Aminata et al., (2013) shows that by procurement system reduced the
company’s cost when they delivered the products.As it happened in daily plant operations.
The absences of regular transport through the special haulier services availability
gave impact on company’s performance in some extension. It’s quite often the location
of the oleo chemicals plant in remote areas. The point located in remote areas is to
reduce the production cost and to increase the investment level. The specific research in
transportation palm oil is very limited. The significant research work by Sbihi and Eglese
(2007) delivered the findings; “the relationship between vehicle routing, scheduling, and
green logistics”.
The oleo Chemicals Transnational Transportation
The research question of this research work pointed out:
• how to calculate the CO2 efficiency in oleo chemicals transportation which used
truck with high viscosity products by crossing the European Union? (based on
formula of CO2 efficiency, shows in equation no.01, as of intensity calculation on
transportation efficiency)
• how to calculate the concentration ratio of product (ES France’s product) by com-
plex management strategy (basically, based on formula of CR4, shows in equation
No. 2, as of Tirole (1998))?
The distance has been calculated in detailed which is to know the most efficient energy
consumption and minimum horse power of the truck used. It can be allowed through the
legislation of road and driving rules. Especially, for the big container which carries oleo-
chemical products.
According to France’s law and E-U law that no more 40 tones allowed to pass the
national or regional roads. They should carry out the products less than 40 tones. The
company has to select the truck’s technology in very efficient ways (procurement system).
In the real business, the consumer needs the maximum one (the maximum load level of
truck’s capacity). In this activity, loading and unloading factor is the main problem.
More time they need for loading and unloading more expensive or extra money will be
paid by the company and stated on additional invoice from the transport agents. The

88 CHAPTER 4. RISK MANAGEMENT IN SUPPLY CHAIN ORGANIZATION
application in transportation case is really depends on which transportation mode. (ie.
air transport, mass transportation, maritime transport, etc.), see Varma and Clayton
(2010) and Clay and Shanahan (2006) said that mapping the business plan is a must
for successful business. However, the oleo chemicals company need at least one year for
creating success global supply chain (annual schedule time).
CO2 Efficiency : Intensity Calculation
It is a common sense that in oleo- chemical industries at initial phase faced on difficulties
to deliver the product. Refer to CO2 efficiency, we use formula in equation No.1 to
know the intensity of CO2 efficiency. As information, the final product of oleo chemicals
industries is still can be used for more than one year, after final processing. Using the
method of calculation shows of method-CO2 efficiency1, so called intensity calculation:
CO2 Efficiency = (D ∗ V/100) ∗ 2.63)/(1000 ∗M ∗D ∗ V ) (4.1)
Definition:
• L: fuel use in liters/100 km. D: distance in km. V: empty running Factor. M: tons
of loaded trip.
• 2.63: emission factor for CO2 emission per liter diesel fuel and the CO2 efficiency
is in gram of CO2 per tons’ kilometer.
• Note: Compiling basic data is used for estimation. The data base has been taken
from real daily business
The European commission intends to reduce the average carbon dioxide which is for
the car 140 gram per km for 2008. It has been increased by 120 grams per km in year
2005, and 2010. Furthermore, there was a good example that Great Britain applied the
tax of congestion. This policy influenced by the tax income. Many of foreign ambassadors
must pay additional tax for the fee of congestion.
Measuring fuel consumption with differentiation of eco-driving, distance, and calculat-
ing system will give impact on difference result of CO2. The cost assessment is difficult;
sometimes its depend on public infrastructure and the quality of vehicle itself.
The average emissions per 1,000 km is approximately 0.18 - 0.25 tons. The targets
of 0.12 tons per 1000 km would deliver savings of around 24 tons per vehicle during its
lifetime (250,000 km)2.
Concentration Ratio
It is allowed to develop concentration ratio calculation, see Aminata et al., (2013). We
identified concentration ratio to measure total products which have produced in this
1Source: Univ. Westminster, UK, INRETS, FR, and adapted by SBIHI. A, 20122Real Future Energy Efficiency in USA,2010

4.2. TRANSPORTATION 89
industry. Usually, this concentration ratio method is to show market control of the largest
firm in the industry and to illustrate the industrial sector is “oligopoly” or not.
The basic idea is the proportion of total output in industry which produced four largest
firm output in an industry. Commonly, there are CR 4, CR 8, and CR 16 which belong
to the aim of the research. As mentioned above, basically concentration ratio is only
providing an indication of oligopolies nature and the degree of competition itself. These
structures are based on market share. The methodology is well known by economist, busi-
ness strategies and the government agent, see Tirole (1998). The formula of concentration
ratio (CR):
CR4 = (4 largest Output)/(Total output within industries) (4.2)
Definition:
• CR 4: Concentration ratio by size of 4 largest categories.
• 4 largest Output: The 4 largest product or variable selected in plant.
• Total Output: Total output within industries.
The aim of this formula is to show the concentration ratio of output within industries
which have four largest in percentage within industry output. So, the top rank of product
within company or industries can be identified. As Tirole (1998) said; both in economics
or business management, a concentration ratio is a measure of the total output produced
in an industry by a given number of firms in the industry.
4.2.1 The Oleo Chemicals Market and Supply Chain
For additional information, some products can be produced by combining existing prod-
ucts. Mostly, the problem in oleo chemical industries is the cost of production process.
The cost unit per output becomes higher rather than import specific raw material.
In different countries the estimated oleo chemicals and detergent alcohol Malaysia is
the highest one, the following by Indonesia and China. However, the estimation for Africa
and Middle East is similar with India. Almost from the country listed for estimation of
supply of oleo chemicals and detergent alcohol are not so different from country to country.
Backward linkages as the case of automotive industry, growth of the steel industry
promotes the growth of the automotive industry, which will lead to higher incomes for
steel producer. Forward linkages happened when the growth of an industry leads to the
growth of other industries that used output as input. Then, on the scheme of business
development, the final product goes to consumers through retailers, minimizing or manage
the role of retailers in the transmission channel process.
The global supply chain has existed, from providing raw material, processing material,
producing the intermediate output, then delivering the output to the customer. Schedule
plan is the main problem for oleo chemical industries. How to estimate product need for

90 CHAPTER 4. RISK MANAGEMENT IN SUPPLY CHAIN ORGANIZATION
Table 4.1: Global Oleo Chemicals Production 2009, (000 tons)Country Fatty-Acid Fatty AlcoholMalaysia 2204 471Indonesia 1010 375Philippine - 130Thailand 104.5 100Japan 256 .Korea 45 .India 153 160China 1296 777Europe 1500 .USA 1000 .
Australia 100 .Total 7668.5 2013
Table 4.2: Estimated Oleo-chemical and Detergent Alcohol Capacity AdditionsCountry Supply
Africa/Mid East 200China 300India 200
Indonesia 450Malaysia 350Total 1500
daily business operation based on three and six months precise forecasting. The plan is
the importance one in order to be accurate on providing service to clients. The storage
problem and the fluctuation of demand tend to be challenging within certain periods.
Here, the transportation availability is one of the businesses obstacles. Mainly, it is for
high viscosity products. The temperature of product should be maintaining on average is
not more than 23 degree Celsius. Especially, during loading and uploading products. All
delivering system has been approval by product control quality and authorized by plant
site.
an example for all products interconnected with ES France is sugar alcohols, unsatu-
rated fatty alcohols, primary fatty amines, special esters, fatty alcohols, refined glycerin,
and lubricant applications. Especially, for France the company concentrated on fatty Al-
cohols, so called LOS 2 N 70. This product is one of the most marketable and nominated
product for France’s branch office.
The complex system of agriculture system up to manufacturing process is under control
by each product quality control. The product sent to international market via quality
control (especially in Singapore as international branch office, even though the plantation
located in Indonesia and Malaysia). Product processing provided by high technology
level. The main problem is how to maintain the standard of quality control. The claim
of customer will deliver by formal notice. Due to, if there is lower quality all products
must be re-evaluated, properly. The problem is all about finance and the competitiveness

4.2. TRANSPORTATION 91
level, particularly for business sustainability.
The pioneer of this actor in oleo chemical business is USA. After several decades, the
successful of such kind of business has been running well in Europe, and Japan. Japan
was combining the traditional industry leader to be stronger in international market.
The future prospect is to improve the technologies level. The rapid expansions of
several companies offered rapid improvement indicators. Mainly, it can be found in the
bio-diesel, and esterification technologies. The pioneer of this actor in oleo chemical
business is USA. After several decades, the successful business has been running well
in Europe, and Japan. Japan delivered business strategy which shows the traditional
industry leader tend to be stronger in international market. See Gold et al. (2012),
Larsen et al. (2013), Marchi et al. (2013), Hu and Hsu (2010), Wu et al. (2012), Aleman
and Sandilands (2008), Martin (2005).
Table 4.3: Synthetic Fatty AlcoholsCompany Raw MaterialsShell Linear OlefinShell Me-braced OlefinSasol EthyleneSasol Linear OlefinExxon Branched Olefin
There three companies are dominant here are Shell, Sasol, and Exxon. Shell is a main
distributor for E and S France. They have own technology how to produce synthetic fatty
alcohols. So, by newly technology companies are not really depend on raw materials,
(typically is ethylene processing scheme), Kaiser and Hurstel, (1988).
Taking care of transportation system will make sustainable of this business. This
method applied by Rockefeller company in years ago. It has been handled for the big
oil company and related industry. The company won the competition due to held the
transportation system in their owned (the case of oleo chemical products within USA).
The increasing of oleo chemical business activities has been involving to the degree of
environ- mental level. So those, for better transportation and respect for the environment
need to specify the vehicle labeling (OECD/IEA 2010). Labeling here that its means that
for oleo-chemical industries need specific transport. For example: for dangerous product
should be label as ADR and no dangerous product as NON-ADR. The label itself must
be put on the truck or put on the drum for small quantities, maximum deliveries is only
24 tons. The product with specific label is important one when crossed European border.
The environment aspect and labeling influenced the market price and demand volume.
Most of consumer are not really aware for their choice. But in oleo-chemical industries, the
specific or specimen of product are based on high treatment and pass from the laboratory
control system, strictly. There is double checked on input-output system. So that, fuel
economy and CO2 emissions labels were combined with fiscal incentives, as was done in
the Netherlands and the United Kingdom.
In the policy context and targets in an oleo-chemical transportation case shows that

92 CHAPTER 4. RISK MANAGEMENT IN SUPPLY CHAIN ORGANIZATION
the vehicle utilization here is how to measure the efficiency of the vehicle by using fuels
consumption from the company origin until to the final destination. These issues covering
the distance and the weight of vehicle. However, eco-driving style is the main aspect, also.
Many countries were applying for eco-drivingd include France and E-U members. The
legislation is not allowed for ADR (dangerous product is prohibited out of France after
19:00 pm, without any exception). But for Non-ADR could be maintain for delivering
entire France, after 17:00 pm, then delivering for next schedule.
In logistics term should respect for delivery the product within day A to B or de-
pending on the availability of product and final destination. In term of transportation,
vehicle utilization can be improved by using empty running and capacity maximum that
carry out the product in maximum way. The efficiency can be measure by fewer vehicle
movements. Tools and variables help to reduce total freight, vehicle traffic, measured by
vehicle per km. So, it will reduce congestion, emission, accident and other environment
impact. The plant site in France still has a chance to buy the product within a group.
Normally, from Germany, according to distance matter and price level negotiation within
a group (insider trading). There is price discrimination and priority for these business
relationships. However, it is normal phenomenon in the group of company at anywhere.
4.2.2 Result
The concentration ratio for 4 largest is IFRALAN L12 and RODALUBE product. Indi-
cated total CO2 in four largest product or total sales is not always smaller than CR8.
Figure 4.1: The Distance and Total CO2, CR4
It shows that almost total CO2 increased by specific distance with the exception of
delivering ro- dalube 680 products. This case could be happened by several reasons; 1).
The quality of vehicle, 2). the specific road type, 3). Eco-driving style, 4). Time windows.
To maintain the CO2 level is need all cooperation of all stakeholders. The company is
insufficient to handle CO2 problem, though as the main player and main contributor for
CO2 level.
The purpose of finalization of each product is different; its depending on the client
needed, however around 1305.6 Euros for each product. The distance is for each truck
to reach the customer address within radius 534.76 km. The consumption for fuels truck
is per km. To reach 100 km, the truck needs 165.93 with almost 222.37 gram CO2/km.

4.2. TRANSPORTATION 93
Figure 4.2: The Distance and Total CO2, CR8
The speed of truck quite safe 53 km/hours the average for the time truck is 10 hours to
reach the client’s address.
Table 4.4: The Calculation Concentration Ratio 8, CR8No. PRODUCT DISTANCE CO21 ROFALAN 5020 VRAC 565 127.492 IFRALAN L2 VRAC 909 172.33 RODALUBE 680 640 169.834 RODALUBE 718 958 254.225 IFRAPON LOS70RO 16 666 137.226 IFRAPON LOS2N70 587 115.897 IFRAPON D 0207 L 348 137.418 IFRAPON AOS 38 659 130.119 8 LARGEST 5332 1244.4710 TOTAL 117646.7 48922.0711 CR 8 4.53 2.54
The finding results from CR4 and CR8 shows that the number of CO2 in CR 8
percentage is smaller rather than CR 4. More product and added as concentration shows
that produced of CO2 is smaller rather only CR4. But, for total sales and distance in
percentage is higher rather in CR4.The product IFRAPON LOS 2N 70 that has high
viscosity and as a marketable product from this company can be found in CR8. Total
sales contribute to total sales and CO2.
4.2.3 Conclusion
The identification from the research work figured out that will be more efficient in oleo
chemicals transportation using high tech of truck (high pump tech) rather than conven-
tional truck, particularly for product with high viscosity products. By getting information
for more close distance with plant origin (product processing and product delivery). All
samples taken from the product crossed the continent and overseas which shows cost
of production, delivery cost, and all operational cost are being carried out by manage-
ment control systems. The complex management strategy faces on price competition by
minimize internal managerial problem, Hovelaque et al. (2010).

94 CHAPTER 4. RISK MANAGEMENT IN SUPPLY CHAIN ORGANIZATION
The efficiency matter is the key for hyper competition. The energy efficiency is sunk
cost that happening during operational or processing product. It’s happened when deliv-
ering products to the customer is a critical point. Because, it could be the product was
contained the hazardous product and viscosity product. The hazardous product and the
viscosity product are needed more time for delivering arrangement. The special treat-
ment of preparation, include here for loading and unloading process to all clients should
be treated prudently and strictly.
All advantages from this case study: 1). Mostly, the information system of specific
truck in France and other European Union refer to hyper competition, based on price
offers. 2). The specific distance with specific delivering system product should be handling
in transport planning. 3).by mapping the power of transportation system to promote oleo
chemicals transport. 4). Identified the comparative product within industrial level and
country level. 5). Minimize the fuel consumption by minimizing road distance, using
specific truck, and tight schedule planning for transportation order. 6).
Delivering an advantage to transporter agents and oleo chemicals industries itself in
various ways by minimizing fuel (energy) consumption through transportation planning
and enterprise organization.
4.3 Airline Business Operations and Aircraft Indus-
try
4.3.1 Introduction
How the aircraft industry resistance in global competition and survival from fluctuation
of energy price, and also global supply chain spare part availabilities. This part informed
the business development of aircraft industries toward intercontinental connection and
prospect of domestic’s market.
The point of this working paper is to improve energy efficiency, Barnhart and Laporte,
(2007); Beer, (2000); BSR, (2012). Energy efficiency is leading issue from time to time.6
Normally, the future of this industry depends on high impact solution which applied to
new design and aging fleets. In engineering field has been also trying to decrease the
weight and fuel burn efficiency. Moreover, the management airplane has contribution
for energy efficiency, for some ex- tension, White, (2013), Metaxiotis, (2010); McClellan,
(2000), Kovacevic et al., (2013). These kinds of proposed gave the direction to solve
the problem of energy efficiency in airline transport, Varma and Clayton, (2010). The
industrial development on aviation industry has to measure its technical progress and
efficiency method of aircraft engine. Time of ignition of engine while waiting for the
passenger after landing. The price of kerosene is one of the volatile prices in this business.

4.3. AIRLINE BUSINESS OPERATIONS AND AIRCRAFT INDUSTRY 95
4.3.2 The Consumption of Fuel-Kerosene
The links for those kinds of issues are reducing fuel use and environmental aspects. For
instance, method energy efficiency and its extension for updating the aircraft’s technology.
Recently, the level of efficiency 80 percent which is more efficient than in the 1960s. The
design was applied for such kind of turbofan engine, new type of all aircraft design and
incremental improvement of abstract design to real operations. The fuel is the single
biggest cost for airlines (more than labor cost).
In the mid of 1970s, the fuel conservation was set up to enhance flight management
systems. This method allowed to decrease the speed of aircrafts engine, engine power
based on all operational cost. Airline company has been trying to make up all proce-
dures by a wide range of operational procedure, maintenance, and tight schedule plan
procedures. All kinds of these procedures is to promote the optimal flying by using en-
ergy efficiency management. The possibility calculation for fuel conservation strategies
(energy efficiency):
Cost Index , CI = (T ime cost /hr)/(Fuel cost cents /l) (4.3)
Table 4.5: The Range of Allowable Cost Index for Given Boeing AirplaneAirplane 737-300 737-600 747-400 757 767 777
737-400 737-700737-500 737-800
737-900Cost Index Range 0-200 0-500 0-9999 0-999 0-999 0-9999
0-9999 0-9999
Table 4.6: Comparing Result for Cost index values of Zero and MaximumCLIMB CRUISE DESCENT
Cost index Minimum Fuel* Maximum Range Max L/DCost Index VMO/MMO VMO/MMO VMO/MMO
Entering zero for the cost index results in maximum range airspeed, minimum trip
fuel and entering the maximum value for cost index results in a minimum time speed
schedule.
Table 4.7: Calculated Values for a Typical 757 FlightCLIMB CRUISE DESCENT ALTITUDE RECMD
Cost Index 0 290/.778 .778 250 RECMD 310
Cost Index 9999 345/.847 .847 .819/334 RECMD 260
Cost Index 70 312/.794 .794 .80/313 RECMD 310
There is no sufficient information according to aircraft industries. However, there is
possibility for us to work closer in the aircraft industries by involving our team on their
global project. Therefore, in the near future we can explored the airline business data
and industrial development of aircraft industries in detail.

96 CHAPTER 4. RISK MANAGEMENT IN SUPPLY CHAIN ORGANIZATION
Table 4.8: Cost Index ImpactCLIMB CRUISE DESCENT
Cost index Minimum Fuel* Maximum Range Max L/DCost Index VMO/MMO VMO/MMO VMO/MMO
Table 4.9: Supply Chain Management in Boeing Business Program
4.3.3 A Case of Indonesian Airline Business Development
The one of prospectus airline company in Indonesia is Lion Air, or so called PT Lion
Mentari Airlines (officially). This company has been planning to order 234 aircraft from
Airbus company which is located at Toulouse, France. The type of aircraft order is; 109
A320neo, 65 A321neo and 60 A320ceo, all is in one type of A320 (medium size). This
order is to fulfill domestics market in Indonesia. By huge numbers of business order, the
Lion Air becomes a really new customer for Airbus Company.
The point is how to support global supply chain, especially for global spare part supply
chain. Due to the chain of global spare part of aircraft is a bit complicated between urgent
needs and availability of spare parts for just in time service. Supply chain management is
key successful for Boeing business operations. The breakdown from procurement agent,
procurement analysis, supply chain analyst, supply chain logistics and supplier quality.
The specific type of A320 is in high fuel efficiency. The one of biggest business oppor-
tunity from this company is making all over tariffs became the cheapest one among the
competitor’s tariff as CEO Lion Air said. The one aircraft will accommodate around 180
passengers, then with a new cabin style A321 can accommodate 236 passengers. The type
of A320 is the classic aircraft. The Neo A320 is more efficient in fuel consumption. The
value of this type aircraft is more than US$ 100 million. By 2011, the order of aircrafts
has been producing, particularly, for type Neo A320 will be deliver in 2016.
Job creation for European Union and especially for France shows that the demand
of aircraft is in high demand and a very prospectus for Indonesian market. A low cost
carrier is one of key success

4.3. AIRLINE BUSINESS OPERATIONS AND AIRCRAFT INDUSTRY 97
both in domestics and international airlines business competitiveness. The Lion Air
was established since 2000, with enormous growth expansion in Asia, which more than 70
destination routes. The job creation data shows 24.000 jobs (Tempo, 2015). This is not
only for creating the most excellent business aspect, but also economic aspect.
The Lion Air operated for the first time in 1999, the owner had the position at 33
ranked as the rich person in Indonesia, claimed with more than US$ 900 million within
a group of Airline company. The Boeing company remarked an order for 234 aircraft for
at least US$ 22.4 billion. The contract has been signed in 2011. The demand of airline
passenger has been increasing year by year, the average growth is around 20%. Bregier
said; the company will recruit 3.000 people from all over the world in 2013. The market
price for each Aircraft is US$ 91.5 billion for A320. The first signing contract was US$
20 billion.
Further business information, the state owned company so called Garuda Indonesia
shows the efficiency of kerosene used. For this purpose, this airline company has been
set up for more effectiveness in operations and replaces the air craft for the new one. All
operations from the Garuda operations has consumed US$ 1.45 billion per year with one
litter of avtur price US$ 1. The efficiency effort has been done well, reached 24 %. The
budget 2012 is US$ 1.21 million than used only US$ 1.18.
However, Garuda will purchase for the new aircraft yearly because high demand of air
transport. From the research center of CAPA (Centre for aviation), Garuda Indonesia
group, Citylink and with Lion Air became a winner in case of number of airplane compare
to Singapore Airline Group. The Garuda will operate 139 unit aircrafts, Lion 149 aircrafts.
There are several Airline companies, so called, Air Asia, Merpati Nusantara, Sriwijaya
Air, and Air Transport. In 2013, Garuda for full service class consumed jet A1 (avtur) 1.29
million Rupiah increased since 2011/2012 around 1.23 million Rupiah. In this full service
class is noted that Singapore Airline (SIA) is the biggest competitor. The efficiency of
avtur use is important to keep the CO2 emission, both in international level and domestics
level. Its why the level of CO2 emission is important for environmental aspect. The biofuel
is one of strategy to reduce CO2 emission. Aircraft A321 used the mixed fuel, i.e Avtur
and 50 % bio-synthetic kerosene. The research of PRESAV (The potential for renewable
energy sources in aviation) identified that there are several fuel can be adapted for aircraft:
Bio-diesel, methanol, ethanol, hydrogen, and bio-methane. The best value to reduce the
CO2 emission:
1. green airport
2. green flight
3. route efficiency
However, in Indonesian airline business used 1%-2% of bio-fuel and other used avtur.
The main supplier of fuel for Airline business is PT PERTAMINA. The bio-fuel is not
still enough for technology development, infrastructure development (holding system and
queue system before landing, especially for busiest airport traffic).
It shows the fuel efficiency from the early age until in the end of 2010 (estimation).

98 CHAPTER 4. RISK MANAGEMENT IN SUPPLY CHAIN ORGANIZATION
Figure 4.3: Fuel Efficiency Gains Since the Early Jet Age
There was fuel efficiency 49 % for engine fuel consumption and aircraft fuel burn per seat
82 %. It was clear that year by year that both engine fuel consumption and aircraft fuel
burn per seat were decreased. All cost of energy consumption to be continue for many
reasons that beyond to business purpose. These kinds of necessaries factors are cost
to transit, energy distribution, commodity prices, exchange rate level, and geopolitical
factors.
4.3.4 Conclusion
From this article what can be learned is how to perform global supply chain by refer to
regional development and inter-linked between companies and also the role of government.
Without, any of governments involvement in global supply chain will be very difficult in
international joint works, see Akhter (2003); Alexander (2005); Beer (2000).
Studying airlines industries gave information about the technology level, availabilities
and performance in global supply chain aspects. Due to each aircraft manufacture has a
client and the same time there are hyper competition for each step of aircraft construction
and business operations. The airline industry or airline transport will be an excellent
model how global supply chains work well at any chain of logistics level. Based on our
designed to promote future efficient research work within three dimensions will deliver
the best solution.

4.4. ENERGY EFFICIENCY MEASURES FOR INTERNATIONAL SHIPPING 99
4.4 Energy Efficiency Measures for International Ship-
ping
4.4.1 Introduction
Energy efficiency for minimizing CO2 emission is a matter for today’s world. There are
many barriers to enhance this research work. It has enabled to do kind of discussion to
solve all barriers and data construction. Especially, in managerial level. We argued that
the collaborative project will be enable for enhancing the quality as well. Especially, for
energy efficiency in maritime logistics chains, see Acciaro and Wilmsmeier, (2015).
4.5 Real Time Data Observation in Singapore
Table 4.10: Vessel Arrivals,Singapore
Source: http://www.marinetraffic.com/ais/details/ports/290/Singapore-port:Singapore,’16
Overall, Singapore has high quality of port management, included data management.
It also supporting by satellite in real time. The value added from Singapore’s port is only
in one authority area. This is a value of management to manage international shipping.
In case of Indonesia, there are 29 official ports and need an extra effort to manage them.
4.6 Real Time Data Observation in Indonesia
Indonesia would like to have maritime cooperation with Singapore for improving port
quality. Mainly, in efficiency ports management, and how to minimize energy efficiency
in global shipping management. For example, dwelling time. Due to dwelling time taken
for freight to load and unload at the port. In averaged seven to nine days in Indonesia,
this a matter to create efficiency in port management system. We are aiming four to
five days dwelling time, even less. Having better dwelling time, it means improving the
logistic system, and reducing the cost for all port operations.
The numerous number is Tanker, followed by cargo, sailing vessel, tug, special craft,
passenger ship etc. However, the port management shows the optimum capacity manage-
ment. Particularly, for aiming energy efficiency in international shipping standard.

100 CHAPTER 4. RISK MANAGEMENT IN SUPPLY CHAIN ORGANIZATION
Figure 4.4: All Vessels Type, 30 Days
Source: Marine Traffic at Singapore, 2016
Singapore has one of the busiest ports in the world, with a ship leaving or arriving every
two to three minutes. Indonesia is still upgrading ports as part of its vision to transform
them into a maritime power. This is also to maximize all potentials of maritime source,
commerce, and to connect many all islands (more than 17,000 islands, and sea ports are
needed to improve sea links in the country). The target is to build 29seaports in the
next five years. Its need around US$6 billion to develop all ports. The problem raised
here is the infrastructure developments shows a lot of opportunities for foreign investors,
but stake holders, also foreign companies are still looking for fixed factors when doing
business in Indonesia. By 2015, the government providing US$400 billion, over five years,
on building up overall infrastructure to stimulate economic growth.
The government authority said; the dwelling time problem is unsolved by Pelindo.
The port management has been treated in monopoly system. Therefore, there is no com-
petition for creating efficiency, particularly in energy efficiency in shipping management.
4.6.1 Difficulties
As mentioned above, all barriers to improve energy efficiency in shipping, between Singa-
pore and Indonesia are really challenging due to typography of Indonesian ports. Contrary
with Singapore located in one location.
This case study aimed for understanding an excellent energy management practices
in shipping companies. Its explored all barriers to support energy efficiency in shipping
through a case study. For example; a short sea shipping company in their process to
apply energy management system.
An action research design was chosen to contribute better practice in the research
community. For instance; project management capabilities, ship-shore communication,
division of responsibilities, access to performance measurements, and competence in en-

4.6. REAL TIME DATA OBSERVATION IN INDONESIA 101
Table 4.11: The Main Ports Administered by Pelindo
Source:Ray, 2009, adapted in OECD report, 2012.
ergy efficiency.
4.6.2 Methodology Challenges
From theoretical part, the energy efficiency in shipping is substantial. Coming from
technical ways up to business opportunities. The goal was to understand what are good
energy management practices, as well as what kind of barriers may hinder companies in
their work. Especially, we wanted to under- stand the role of energy management system
(EMS) standards, or best practices. Partly, because that they seem to have been a success
factor in other industries, and partly because a particular kind of EMS standard the ship
energy efficiency management plan (SEEMP). Moreover, there is a successful model in
this case study, so called data envelopment analysis.
4.6.3 Data Envelopment Analysis
Cooper and Seiford, (2011), there is an increasing concern with measuring and comparing
the efficiency of organizational units such as local authority departments, schools, hospi-
tals, shops, bank branches and similar instances where there is a relatively homogeneous
set of units. Data envelopment analysis (DEA)7 is a linear programming based tech-
nique for measuring the relative performance of organizational units where the presence
of multiple inputs and outputs makes comparisons difficult.
Data envelopment analysis (DEA) is a nonparametric method in operations research
and economics for the estimation of production frontiers. Empirically, to measure the
productivity of efficiency in decision making units (DMUs). Although, DEA has a strong
link to production theory in economics, the tool is also used for benchmarking in opera-
tions management, where a set of measures is selected to benchmark the performance of

102 CHAPTER 4. RISK MANAGEMENT IN SUPPLY CHAIN ORGANIZATION
manufacturing and service operations. In the circumstance of benchmarking, the efficient
DMUs, as defined by DEA, may not necessarily form a production frontier, but rather
lead to a best-practice frontier. DEA is referred to as ”balanced benchmarking” by Zhua
(2007).
4.6.4 Real Time Analysis, Dwelling Time Analysis
Table 4.12: Observed Ports
Source:PT. Pelindo II, Indonesia, 2012
4.6.5 Energy Efficiency Operations
To understand the nature of ship operations, two issues are key and concern as follows;
the commercial conditions for ship operations, and the organizational conditions for ship
operations. A shipping company may choose to outsource crewing and technical man-
agement to third parties to focus on core commercial capabilities or to get benefit from
economies of scale with third party managers. Cost reduction is a typical argument for
outsourcing. Energy efficiency operation index (EEOI): the “EEOI” is an approach to
assess the efficiency of a ship with respect to CO2 emissions.3
EEOI =(Environmental cost /Benefit to Society )
(measured as grams CO2 /tones x nauticalmile)(4.4)
EEOI = (Emitted CO2) / (Transport Work), i.e. the ratio of mass of CO2 (M) emitted
per unit of transport work.
4.6.6 Interview Method Analysis
The goal of understanding what are good energy management practices in shipping com-
panies through the study of the implementation of an energy management system (EMS)
3Source: Philip Tsichlis Naval Architect and Marine Engineer, 2011.

4.6. REAL TIME DATA OBSERVATION IN INDONESIA 103
Table 4.13: Indonesian Port Data
Source:JICT: Jakarta International Container Terminal, PT. Pelindo II, Indonesia, 2012
Table 4.14: Sample in Global Dwelling Time
Source:PT. Pelindo II, Indonesia, 2015
standard (ISO 50001) in such companies. Originally, it consists of for two shipping com-
panies, and a consultant that have been worked as part of a team in each company to
implement the international standard. The purpose of an EMS can be defined as organi-
zations to establish the systems and processes necessary to improve energy performance,
including energy efficiency, and consumption (ISO, 2011).
The company should make a target by international standard ISO 50001 upon which an
organization can develop and implement an energy policy, and establish objectives, targets
and action plans and also related to significant energy used (ISO, 2011). Briefly, the phases
of formation of an energy policy, the energy planning and auditing, and implementation
and operation are followed by constant checking.
This supported by an internal auditing system, processes for monitoring, measurement
and analysis as well as for non-conformities, correction, corrective and preventive action.
In interview analysis, there is energy consumption monitoring which can be a parameter
for analyzing shipping efficiency.
Poulsen and Johnson, (2016), data from ECM can be used as a basis for vessel fuel-
saving competitions. Typically, every quarter, the crew on-board the best-performing
vessel of the receives a bonus to share for on-board well-fare activities. This is seen as a
tool for raising awareness, though only used explicitly in two of the case companies.

104 CHAPTER 4. RISK MANAGEMENT IN SUPPLY CHAIN ORGANIZATION
Table 4.15: Collaborative Project to Implement EMS in Two Shipping Companies
Source:H. Johnson et al. / Journal of Cleaner Production 66 (2014) 317-327 Note: EMS=
Energy Management System. SEEMP: Ship Energy Efficiency Management Plan.
4.6.7 Discussion and Result
Exporter and importer which associated with ALFI (logistics association and forwarder
Indonesia) clearly stated that Tanjung Priok port service must be well develop because
there is a lack of energy efficiency measurement. Other problem, we have to make sure
for entire ports that must be integrated well within 29 ports.
4.6.8 Conclusion
We have also adhered to work in problem formulation, problem-solving, reflection, and
made sure that project participants from all parties have been able to discuss problems
and solutions. There are five main patterns or barriers to work with energy efficiency have
been discussed: low level of project management maturity, difficulties measuring energy
performance, fragmented responsibilities, lack of communication, lack of knowledge, and
resources. They were shown to have a match in the ISO 50001 standard.
Learning action research methodology as well as the practice of energy management
and complement gathering of the kind of rich data would presumably also be of interest
to organize the collaboration, see, Baan et al., (2015), Anas et al., (2013).

4.7. PRODUCTION 105
Figure 4.5: Energy Consumption Monitoring
4.7 Production
4.7.1 CSR - Production Efficiency in Risk Management within
Manufacturing Industries
4.7.2 Production Efficiency in Manufacturing Industries
Market intervention by policy makers is to improve supply chain performance that can
be considered. All comparisons can be made across related supply chains with simi-
lar features. Then, how we consider overall properties of a supply chain and whether
within find structural and behavioral appearances associated with different types of sup-
ply chains: protectionist trade regimes are also more likely to favor large firms, both
because these firms products compete more directly with imports, and because sectors
with large, capital-intensive firms lobby the government more effectively, Thollander and
Palm (2013).
Firm performance is based on economic efficiency, which is composed of two compo-
nents; (1) Technical efficiency, defined as capacity to produce maximum possible output
from a given set of inputs and technology. (2) Allocative efficiency, defined as the ability to
equate marginal value product with marginal costs. Outsourcing is used to describe all the
subcontracting relationships between firms, and the hiring of workers in non-traditional
jobs.
For some extensions, Kihlen (2007) stated that following current issue is knowledge
for geography matters. For example; economic interactions, it because of transport costs,
time costs, fixed costs of entering new markets, and informational barriers also, then how
to manage remote supply chains or production operations. As a note the agglomeration

106 CHAPTER 4. RISK MANAGEMENT IN SUPPLY CHAIN ORGANIZATION
approach that we learned for profitable oriented, however the benefits coming from de-
mand and supply chain linkages, from pools of labor market skills, or from technical spill
overs.
London (2008) stated; supply chain explores the market fragmentation concept through
the degree of firm integration along the supply chain in productive functions, and struc-
tural fragmentation in numerous firms in a highly competitive environment. The results,
we might like to improve profitability, efficiency, productivity, and or innovation. The
policies of governments towards supply chain management have been of a direct and indi-
rect type and have focused upon improvement of performance for small to medium-sized
enterprises (SMEs).
Supply chain management was evident at the manufacturing end of the chain, although
in varying degrees. Kihlen (2007), shows that supplier development and co-ordination is
evident, although supply chain management is less. All possibilities for global supply
chain which those industries are profitable particularly as follows: food and beverages
product, garment and textiles product, paper and paper products, other chemical prod-
ucts, non-metallic mineral product, basic metallic products and other, machinery except
electrical, electrical machinery apparatus, transport equipment product, and other indus-
trial products.
4.7.3 Introduction
The initiative to restructure manufacturing sectors are by making the priority for in-
termediate goods regulation, see, Aminata et al. (2002). The high impacts between
backward and forward linkages are such as textiles, pulp-paper, food processing, rubber
and wood-based products. Rationalizing trade policies and industrial regimes will create
market more efficient and transparent, see Mouton and Marais (1996). By helping small
and medium enterprises will generate employment and benefit consumers as well as to
expand the distribution scheme. Foreign direct investment had a moderate impact on
the development of supplier and supporting industries in Indonesia, since foreign firms
located in Indonesia brought more than half of their input from abroad. By this action,
it was cleared that the global supply chain has started. The government should continue
all efforts to lower transaction cost, reduce unnecessary administrative and bureaucratic
procedure to speed up the approval of investment. The important things are formulation
and implementation of the effective global trade strategy for any products. The research
question is how to identify the problem of openness and efficiency of production regarding
output level and value added in manufacturing level.4
4Aminata J., Grandval S., Sbihi A., (2014), ”The Impact of Organizational and Geographical Relo-cation of Firms Activity Trend on Openness and Production Efficiency in Indonesia’s Manufactures”,Journal Social Management, vol.12, n.1.

4.7. PRODUCTION 107
4.7.4 Methodology
4.7.5 Production Function
Following Cobb-Douglass production function, authors have tried to specify an industrial
production function for Indonesian manufacturing sectors, by following these definitions,
INDOUT =(CAP, OPENNESS, and TW) Definition: INDOUT: Manufacturing Output
(CBS) CAP : Machinery and Building include Equipment (CBS) OPENESS: Total Import
Manufacturing / Total Import Manufacturing + Total Output TW : Total worker by
sector in Manufacturing Industries (CBS).
The purpose of using openness, as input variable is to get better understanding how
much openness gave impact to the output. The openness factor is consisting of import
variables. Due to, most of manufacturing industries are really depend on importing of
the raw material or intermediate goods. Technological change in manufacturing industry
is very important as a main factor to increase the output level.
4.7.6 Estimation for Selected Sector
1. INDOUT 313 (1975-1995) = f (CAP313 (1975-1995), OPENESS 313 (1975-1995),
TW 313 (1975-1995))
2. INDOUT 321 (1975-1995) = f (CAP 321(1975-1995), OPENESS 321 (1975-1995),
TW 321 (1975-1995))
3. INDOUT 341 (1975-1995) = f (CAP 341(1975-1995), OPENESS 341 (1975-1995),
TW 341 (1975-1995))
4. INDOUT 352 (1975-1995) = f (CAP 352(1975-1995), OPENESS 352 (1975-1995),
TW 352 (1975-1995))
5. INDOUT 369 (1975-1995) = f (CAP 369(1975-1995), OPENESS 369 (1975-1995),
TW 369 (1975-1995))
6. INDOUT 381 (1975-1995) = f (CAP 381(1975-1995), OPENESS 381 (1975-1995),
TW 381 (1975-1995))
7. INDOUT 382 (1975-1995) = f (CAP 382(1975-1995), OPENESS 382 (1975-1995),
TW 382 (1975-1995))
8. INDOUT 383 (1975-1995) = f (CAP 383(1975-1995), OPENESS 383 (1975-1995),
TW 383 (1975-1995))
9. INDOUT 384 (1975-1995) = f (CAP 384(1975-1995), OPENESS 384 (1975-1995),
TW 384 (1975-1995))
10. INDOUT 390 (1975-1995) = f (CAP 390(1975-1995), OPENESS 390 (1975-1995),
TW 390 (1975-1995))

108 CHAPTER 4. RISK MANAGEMENT IN SUPPLY CHAIN ORGANIZATION
4.7.7 Three Digits Manufacturing Industries
• 313: food and beverages product
• 321: garment and textiles product
• 341: paper and paper products
• 352: other chemical products
• 369: non-metallic mineral product
• 381: basic metallic products and other
• 382: machinery except electrical
• 383: electrical machinery apparatus
• 384: transport equipment product
• 390: other industrial products
4.7.8 Conclusion
As the estimation result shows that openness contributed for positive impact to the man-
ufacturing output. The capital did not give impact to all manufacturing output. The
labor intensive contributed for production efficiency for certain sectors (food and bever-
ages product, garment and textiles product, non-metallic mineral product, basic metallic
products and other, machinery except electrical, electrical machinery apparatus, transport
equipment product, and other industrial products) than using capital intensive (however,
the variable of capital contributed to other chemical product, basic metallic products and
other, machinery except electrical, electrical machinery apparatus) particularly for In-
donesia’s manufactures between 1975-1995 period. In detail the description of estimation
result for output and value added as follows:
• food and beverages product: labor was significant. This sector is more labor inten-
sive.
• garment and textiles product: capital was not significant.Labor was significant.
Openness was significant.
• paper and paper products: labor was significant in paper sector but the capital and
openness did not contribute the output, significantly.
• other chemical product: the capital and openness contributed to the output, signif-
icantly.
• non-metallic mineral product the openness, and labor significantly contributed to
the output but capital was not significant.

4.8. PRODUCTION PROCESS IN A CASE OF FOOTWEAR 109
• basic metallic products and other: capital and labor contributed basic and metallic
output, significantly.
• machinery except electrical: capital and labor were significant, but for openness was
not significant.
• electrical machinery apparatus: capital and labor significantly contributed to the
output but openness did not significantly contribute to the output.
• Transport equipment product: labor was significant but the openness was not sig-
nificant.
• Other industrial products: labor and openness contributed to the output in other
industrial sector, significantly.
• Robust procedure shows: Total paid and unpaid workers and average supervisory
and professional workers contributed to value added within t-statistics, negatively.
Total payment to production workers, Total payment to non-production workers,
Total profit, and advertising and promotion contributed to value added within t-
statistics, positively.
The estimation shows all sectors have been linked to global supply chain network
for some extensions. Openness and production efficiency within industrial development
framework without any strong global supply chain network will be faced on difficulties.
4.8 Production Process in A Case of Footwear
4.8.1 Introduction
This case study explored footwear industrial development. Business activities within time
line on high competitiveness in global supply chain. All companies have been trying to
apply specific management strategy. In order to maintain sustainability of footwear global
business.
One of management strategy in their method is how to apply efficiency approach
at any level of business activities, precisely the energy efficiency approach. The energy
efficiency in footwear industries is an importance issue to enhance business development.
The actual business in domestic’s level and multinational companies level is to find out
the future business opportunity by using appropriate energy efficiency decision. Therefore,
it will be significant to deliver technology level of machine, location, and energy type.
Based on this phenomenon, the company has kind of decision to relocate their com-
panies, acquisition and merging (vertical and horizontal). The fashion style, consumer
behavior, geographical location is key factors to support powerful supply chain. The
meaning of energy efficiency gives influence for profit and competitiveness level to keep
sustainable the footwear industrial development.

110 CHAPTER 4. RISK MANAGEMENT IN SUPPLY CHAIN ORGANIZATION
The footwear sector intends to increase the energy efficiency in many ways. It is not
only for technology of machine but also how become less emission during processing the
product. It means that the energy efficiency in the industrial activities closer zero emission
level. One of the parameters to measure clean or not clean is to make identification by
green factor. The phase of product processing until finishing product, also they should
apply environmental indicators.
4.8.2 Energy Efficiency in Footwear Industry
The framework of this research work shows the link concept of energy efficiency in global
supply chain with regard to the operations management. The operation management
consists of efficiency production management, efficiency transportation management, and
efficiency warehousing management.
Again in this case study, authors gave the dimension of energy efficiency that could
be seen from three dimensions as mentioned in introduction. “Supply chain dimension
(strategy level), especially in long term. Logistics dimension (tactical level) is in Medium
term. Operations management dimensions (day to day term). The research work detailed
on the supply chain from top to bottom contains: (I) efficiency production management,
(II) efficiency transportation management and (III) efficiency warehousing management”.
It shows, there top 10 footwear retailers in Europe as in 2011 in billion Euros. The
first rank is Deichmann shows the turnover 4.1 as the highest one. Then, following by
Vivarte, Eram and Footlocker. The lowest number of outlets is Leder and Schuh 355
outlets only. Shoezone reached 570 outlets but the turnover is smaller one, 0.3 billion
Euros, only. We found that the main problem in footwear industries is:
1. low labor cost compared to European countries, mainly with China.
2. high level of globalized and trend fashion competition.
3. EU in the process of restructuration and relocation of the companies through the
world within three decades.
4. the energy efficiency matter; level of unstable/high volatility energy prices, unstable
demands, and corporate social responsibility, its means that corporate or company
gives contribution to the environment, for example pollutant or emission. Therefore,
the company should take care of environmental impact.
The energy efficiency in footwear industries explained the interaction started from
processing up to final phase. One of the interesting forms that energy can store energy
based on type of product materials.
The idea is divided by three categories; product list, main products, and enterprise
business development. Referring to the energy consumption, however in reality each
machine stands alone, and it is not consuming a lot of energy. But, when the job order is
up to thousands tons. For sure, it will need energy management.

4.8. PRODUCTION PROCESS IN A CASE OF FOOTWEAR 111
Table 4.16: Top Footwear Retailers in Europe - Turnover in Europe 2011 in BillionRank Retailer Turnover Outlets1 Deichmann 4.1 32002 Vivarte 3.0** 45003 Eram 1.8** 17554 Foot Locker 1.2e 21675 Garant 0.8 53606 Bata n/a 50007 ANWR Schuhe 0.8 31008 Macintosh 0.7 8739 Leder and Schuh 0.5 35510 Shoezone 0.3 570
Note: **= 2010 and e=estimate2011 data are the latest available data for comparisons,
Source: Compiled from http://www.retail-index.com, retrieved 01/02/2914
Pressing machine, automatic riveting machines, and automatic drilling machines in
certain condition need nonstop energy source to create massive products. The limit in
footwear industries is fashion style. It proves that’s not all manufactures or companies
can provide well both in price offer and quality level.
In the categories of enterprise development, initial cost for investment is not low. But,
energy efficiency for market orientation and R&D development are key roles to promote
footwear industries to be sustainable one. The footwear industry tends to be slow growth
in many aspects.
The strategy of supply chain method should perform well. For instance, how to ful-
fill the consumer demand, rapidly? In reality, comparing to the modern type of retail
management which existing of extreme fragmentation and diversification of purchasing
methods. The elasticity of the price that all this items relative to traditional retail. An
increasing method of supply chain or distribution method especially in new location or
store, and single brand outlet is really interesting for current competition.
Table 4.17: Real Fact and List of Current Footwear Technology Development
Source: http://www.eyelet-machine.com retrieved and update by Authors per 08/02/14

112 CHAPTER 4. RISK MANAGEMENT IN SUPPLY CHAIN ORGANIZATION
Footwear Industries
Green global supply chain management shows significant impact in industrial sectors and
academic fields. The future direction, using organizational theories provide some oppor-
tunities to make an objective and clear special target. By making good understanding and
the available field, to identify all opportunities for collaboration. According to mitigation,
environmental quality level being considered for producing, distributing products in global
markets act a central role. The exploration of current condition in global framework;
1. the cross linking of the machines network is one of the obstacles to promote certain
enterprises move up better.
2. the complexity of component and how to fulfill the fashion trends.
3. the diversity of factory layout.
4. the internal management problem.
Xin, (2010) explained energy consumption and energy intensity reduction opportuni-
ties where quite different from one enterprise to other. It is necessary to understand how
much energy is used at individual enterprise, where the most energy is consumed and
what the best opportunities to invest in energy efficiency. Auditing energy efficiency was
recently undertaken for the top 1000 largest Chinese enterprises.
Energy efficiency is as a corporate social responsibility (CSR) which company has
responsibility for sustainable of environmental quality improvement; for further reference
see Mannino et al., (2008), and Gokce and Gokce, (2013).
Figure 4.6: The Simulation of Cost-Effectiveness Results
Source: Ming Yang (2009): updated,Energy efficiency improving opportunities in a large
Chinese shoe-making enterprise
The paper work that has been done previously showed that CO2 reduction in ton per
year is the suitable one by using boiler, steam and mid sole mode. The technology system
by using medium and large induction motors showed the lowest one for CO2 reduction.

4.8. PRODUCTION PROCESS IN A CASE OF FOOTWEAR 113
However, boiler, steam system and mid sole mode was the highest one in investment $
US.
Table 4.18: EU 27 Structural Data in Million EurosNumber of Firms 2007 2008 2009 2010 2011 2012Turnover 26100 24000 21700 21100 18900 17170Production Value 30296 26515 21977 24000 19841 17498Added Value at factor cost 28927 25351 20000 15832 11369 6905Direct Employment 7631 6873 5589 4656 3635 2614
368600 325700 291000 250833 212033 173233Source: Euro stat-updated Apparent Consumption=Production + Import Export.
It shows EU 27 in structural data, from year to year the number of firms decreasing.
However, all variables; turnover, production value, value added and direct employment
showed that have decreased during duration of 6 years.
Table 4.19: Production, Consumption and External Trade1000 Pairs 2008 2009 2010 2011 % GrowthProduction 560231 470551 491006 505304 -10Exports 172369 153292 168402 191500 11.1Imports 2428402 2247836 2521994 2550505 5.0
Apparent Consumption 2816264 2565095 2844597 2864309 1.7Source: Euro stat-updated Apparent Consumption=Production + Import Export
It shows production, consumption, and external trade in 1000 pairs with variables;
production, exports, imports and apparent consumption. Regarding to percentage of
growth 2008-2011 the export value was the highest one, 11.1 %. The amazing recorded in
Cambodia’s in percentage growth, and then followed by Indonesia, Switzerland, and then
China. However, China holds the strong position during 2012.
Table 4.20: Top EU Supplier as Share of 2012 Imports in MillionCountries Share of 2012 ImportsChina 51.2
Vietnam 13.2Indonesia 8.2India 7.3Tunisia 2.7
Cambodia 2Morocco 1.8
Switzerland 1.7Brazil 1.6
Bosnia and Herz. 1.3Source: Euro stat - Update by Authors
The China, Vietnam, Indonesia, and India are the most significance countries which
act exporter or EU supplier as share 2012 import.
China, Vietnam, Indonesia and India are the main players for the business. Each of
them can be reach hyper competition for future business development.

114 CHAPTER 4. RISK MANAGEMENT IN SUPPLY CHAIN ORGANIZATION
Figure 4.7: Top EU Supplier, Share of 2012 Imports
Source: Euro stat - Update by Authors
Table 4.21: Top EU Supplier as Percentage Growth 2008-2012 in MillionCountries Share of 2012 ImportsChina 32.5
Vietnam -9.3Indonesia 75India 13.2Tunisia -9.7
Cambodia 167.1Morocco 24.2
Switzerland 36.8Brazil -48.6
Bosnia and Herz. 22.2Source: Euro stat - Update by Authors
4.8.3 Global Supply Chain in Footwear Industries
The number of imported shoes have been little difference between shoes brand name.
However, the local product quality is still lower than import quality. But, it is not to
mention Italy, German products, Korean products. The key findings are:
1. digital is the future development trend of the manufacturing sector, it convenient
and faster.
2. improving features of equipment, etc.
3. the automation section is to save the labor costs. It will have automated equipment
and many things.

4.8. PRODUCTION PROCESS IN A CASE OF FOOTWEAR 115
Figure 4.8: Top 10 EU 27 Market in Million Euros
Source: Euro stat - Update by Authors
4.8.4 Basic Formula in Efficiency
The Formula of General Efficiency
Energy efficiency equal output divided by input. To formulate this idea can be explained
as follows:
Efficiency =Output )
Input(4.5)
4.8.5 Efficiency Calculation
The measurement of relative efficiency where there are multiple possibly of inputs and
outputs. The construction of a hypothetical efficient unit, as a weighted average of efficient
units, to act as a comparator for an inefficient unit. A common measure for relative
efficiency:
EEOI =(WeightedSumOutput )
(WeightedSumInputs )(4.6)
On mathematical modeling of industrial energy management exposed the systems
theory in thermal and chemical engineering, see Sieniutycz and Jezowski (2009). They
proceed in a systematic way; a total system is often divided into subsystems. In an
industrial plant the technological subsystem (consisting of technological processes) and
the energy subsystem (energy management) are distinguished. The production of the
energy branches is intended to cover the needs of the technological branches and, partially,
also the plants own consumption.
Thus, the energy management of an industrial plant is a system defined as a set
of energy equipment and engines, as well as the inner relations between them and the
external relation between energy management and the environment. The aim of produc-
tion, conversion, transmission, and distribution of energy carriers consumed in industrial
plants.

116 CHAPTER 4. RISK MANAGEMENT IN SUPPLY CHAIN ORGANIZATION
Table 4.22: Energy Savings and Emission Reductions
Source: Source: adapted from Ming Yang, 2009
Table 4.23: Cost Effectiveness Analysis
Source: adapted from Ming Yang, 2009
This model is a development of the input-output analysis that applied to energy man-
agement of industrial plants. The productive branch of an industrial plant is a technolog-
ical and energy process producing a given major product, as well as optional by-products.
If there is more than one source of energy carrier produced as the major product, the
production must be divided into its basic part and peak part (e.g. the steam extraction
nozzle of the turbine and the steam from the pressure-reducing valve).
4.8.6 Conclusion
There are small numbers of researchers who are working in energy matter particularly
in footwear industry. However, energy availability will be key factor when discussing
industrial location (the location of companies) that energy is under construction or still in
difficulty for price and resource feasibility and availability. For example, most of companies
are always looking for industrial location to get the best industrial location based on global
market demand. Especially for the European market, most suppliers are coming from non

4.9. ENERGY APPLICATION PLANNING MODEL 117
EU 27. The market is dealing with a very recent trend style. It gives impact to keep
the enterprise giving quickly feedback to the market. Moreover, the labor cost gives
uncertain condition for footwear sustainability, mainly the enterprise based in the region
with unstable energy prices.
The future solution for energy matter is to construct relative less expensive energy price
for promoting footwear industries. Internal organization within footwear industries should
maintain, carefully. To avoid the worst of labor wage problem in certain position or level
at company. Energy efficiency that shows an amount of saving, total emission reduction
and cost effectiveness will take important role in global supply chain that stimulates trade
structure and international trade flows.
4.9 Energy Application Planning Model
4.9.1 Introduction
The long-range energy alternatives planning system (LEAP) is a scenario-based energy-
environment modeling tool. LEAP as a database, it provides a comprehensive system
for maintaining energy information; where the decision makers are allowed to switch
from policy idea to policy analysis as a policy analysis tool. Its scenarios are based on
comprehensive accounting of how energy is consumed, converted and produced in a given
region or economy under a range of alternative assumptions on population, economic
development, technology, price and so on.
LEAP allows for analysis as rich in technological specification and end-use detail as the
user chooses. In this research, Indonesian is a case study. However, LEAP has wide variety
of projects, programs, technologies and other energy initiative strategies that addressed
to environmental and energy problems.
Efficiency and intensity are seemingly to be understand as comparing energy consump-
tion and energy product. It means that knowing the pattern of output and the level of
consumption. There are two meaning of efficiency in engineering context and economic
context. Engineering efficiency is the amount of useful work output that a process or a
piece of equipment performs with a unit of energy input.
Economic efficiency highlights the cost performance of equipment and processes. A
machine or a process is more economically efficient than another if it is less costly or yields
greater benefits. For example, 40,000 Btu/barrel distillation columns is more efficient than
the 60,000 Btu/barrel columns only if it processes the oil at a lower cost.
Energy intensity focuses on the energy use of entire industries or countries. It is
expressed in units of energy per unit of physical or monetary output. It encompasses the
effects of both engineering efficiency and industrial structure It encompasses the effects
of both engineering efficiency and industrial structure.
Industrial structure refers to the mix of plants and facilities in the industry or country,
and manifests itself in the mix of raw materials, intermediate products, and finished goods

118 CHAPTER 4. RISK MANAGEMENT IN SUPPLY CHAIN ORGANIZATION
that are produced. A country can lower its energy intensity by installing more energy
efficient equipment and processes and/or shifting its industrial base away from heavy,
processing industries toward light, fabricating ones. Processing raw materials, such as
steel and petrochemicals production, generally requires much more energy per unit of
output than does fabricating finished goods, such as computer and automobile manufac-
ture. There were supporting services toward electricity providing, as like: consultancy,
construction, test and examination, operations and maintenance, research and develop-
ment, education and training. Each types of business must be operated by the different
business factors, to achieve fair competition for sake of market efficiency.
However; the business priority must be given to BUMN on the operation of the trans-
mission and distribution of electricity. In the future, the actors in electricity market will
be given chance to role as electricity providers; those are central or local government, busi-
ness corporation, and private sector. See in appendix A.8.1.; “leading issues in energy
management, a case of Indonesia”.
Currently, by the regulation shows that the effort of electricity provider could be
divide into: 1. generator of the electricity 2. transmission the electricity 3. distribution
the electricity 4. trading the electricity 5. stocks the electricity 6. operating system.
The regulation no. 22/2005 oil and natural gas (UU Migas) would be the solution
toward the oil and the free market. Management for oil and natural gas was restructured
both at the primary sectors and in the nature sectors. On the primary sectors the au-
thority for exploration and exploitation was taken over by the stated own Entreprise (PT.
Pertamina).
Management for exploration and exploitation were hold by the control body in ac-
cordance with legislative recommendation whereas same private sectors, co-operative,
BUMD and BUMN were allowed to exploited, due to PERTAMINA as part of BUMN
was given an even treatment as like the others by these regulations. Where upon the
primary activity on oil and natural gas will be implemented on the platform of fairness
and transparency. In the future electricity sector toward the trend to market of electricity.
However, electricity business become multi buyer and multi seller.
The government also has duty and authority to establish the aims of the development
of electricity, which is the grand plan of national electricity (RUKN). To accommodate
local aspiration, RUKN should consider the grand plan of local electricity (RUKD). To
support the development of electricity in remote and rural areas, and to subsidize the
poor, it is necessary to form social fund for electricity development (DPKS). DPKS will
be one of cost components in electricity price structure.
The amount of natural resources is limited compared with the increase of human need
that causes the scarce of energy. The need of energy fulfillment has created such efforts
to provide renewable energy sources. The existence of renewable energy sources has not
been explored optimally because of the availability of fund and technology. During the
period of 1980s and 1990s, the renewable and un-renewable based economic development
has been debated all over the world. The insistence of sustainable energy development

4.9. ENERGY APPLICATION PLANNING MODEL 119
needs comprehensive policy instrument. The oil crisis in 1970s, 1980s and millennium era
is one of considerable phenomenon that shows the energy management is still inadequate,
especially in developing countries where rich natural resources is often mismanagement.
The energy resources management has structured to overcome unlimited human needs.
The planning and estimation of energy consume will be useful for energy development
that will greatly affect other sectors. That energy estimation, especially production and
consumption directly contribute for energy development. Instead of good energy devel-
opment, it is also necessary to design development plan for environment recovery. It is
important to participate in energy sector.
Instead of development planning, it is important to develop energy sector. To handle
the environment problems as the impact of energy processes and energy consumption.
These are importance matters to support the future of sustainable human life. The
purpose of this research is to know the amount of the future energy demand (next 30
years).
This research is also aimed to know the impact of environment impact (electricity
generator) and the consumption of energy. As the fine oil imported country, Indonesia
depended on the world raw oil price. The energy management cover the role of department
of energy and mineral resources. The trend of global market already pushes the regulation
in energy market, especially electrical sector.
In the commodity of fuel energy and electricity management, government role through
the state own enterprise (BUMN). There were supporting services toward electricity pro-
viding, as like: consultancy, construction, test and examination, operations and mainte-
nance, research and development, education and training. Each types of business must be
operated by the different business factors, to achieve fair competition for sake of market
efficiency however; the business priority must be given to BUMN on the operation of the
transmission and distribution of electricity. In the future, the actors in electricity market
will be given chance to role as electricity providers; those are central or local government,
corporation, see Gu et al. (2013).
4.9.2 The Estimation of Energy Demand
The demand program available in LEAP can be applied to the project. This program is
a kind of disaggregation analysis instrument that covers the need of energy based on the
previous year’s data of energy up to the recent time. By using data time series, it can
project or estimate the rate of energy consumption totally or sectoral, such as household,
industry, transportation, agriculture, and other sectors. The demand data was formed in
to four hierarchical grades:
1. the meaning of sectors is the various economy sectors in examples: households sector,
transportation sector, industry sector, trading sector, public services sector, etc.
2. the meaning of sub-sectors for existing sectors were divided in to the sub-sectors
in examples: industrial sector was classified in to textile industry, steel, oil, papers

120 CHAPTER 4. RISK MANAGEMENT IN SUPPLY CHAIN ORGANIZATION
agriculture, etc. Even so in households could be classified in to several of rate of
income groups, habitant’s area (where they were live), etc.
3. the meaning of end use energy is in every sub-sectors that is classified into the end
user of energy. In examples: the consumption of energy in rural habitants used
for cooking, lighting, appliance, etc. The end use of energy in industrial sub-sector
in examples: the use of gasoline, fuel for diesel engine, Kerosene, heating (boilers)
etc. Since the end use of energy in agriculture sub-sector, in example: irrigation,
plantation, etc.
4. the meaning of device every end user of energy were classified into tools device:
in examples: in the household’s stoves were separated than into: Kerosene stove,
LPG stove, charcoal, store cool, bio-gas, electric etc. Also, for example for lighting
device, bulb, flour scent, and kerosene gas lamp.
Projection method or analysis method determine in to what activities are or the
prospective calculation result of the future energy intensity. The assumptions could be
based on the growth target of various sources or analysis, from macroeconomic projection
and from other sources. The use able methods are:
1. the meaning of “interpolation”; the method is used for the future projection of each
sector, based on each activity grade, However, the early year’s data is needed as the
way to look up the future projection.
2. the meaning of growth rate; by entering the annually growth rate and shown in to
percent. The future activity grade would be increased from the year first that the
research worker used by. These growth rate are various multi polar and its result
could be exponentially fluctuated.
3. the meaning of drivers and elasticity; the method is used to project the activity rate,
or the intensity as the function of one or more driver variable by using or without
using elasticity.
4.9.3 Demand Model
1. final analysis of energy sector: e = a x I e = energy demand a = rate of effective-
ness i = intensity of final energy (energy consumed per unit of activity) Example:
energy demand of the fertilizer industry that could be projected in to the rate of
effectiveness in the fertilizer process per one ton, it will be change in the future.
2. analysis of energy being operated e = a x (u/n) u = is the intensity of energy being
operated n = efficiency
Example: The exchange of energy demand of one building or office being happened
from time to time:

4.9. ENERGY APPLICATION PLANNING MODEL 121
1. the amount of reconstructed building being grew in to numerous (+u)
2. the amount of air conditioned being installed by the rich peoples continuously grow
(+u) or public service facilities being updated (+u) or preference exchange the use
of Kerosene in to electric energy or gas (+n) Demand Model.
3. stock analysis: c = s x d s = Stock d = device intensity (energy use per device)
Example: The implication of efficiency rate to energy stock in standardization.
Transformation program This program is used to calculate the amount of energy
supply and conversion process to find out the demand of primary energy.
This program is used to calculate the amount of energy supply and its conversion
process and to know the primary energy demand:
1. the rate of module; in this rate are shown the various sectors of energy or the types
of electricity generator, fuel energy processing and products of primary fuel energy
the calculation in this phase is based on the calculation result of the LEAP demand
as the program before. This module is used to find out the needs of domestic fuel
energy demands, or export targets of fuel energy.
2. the rate of process; in this rate of process, the technology of one energy generator or
combination of fuel energy generator is explained, in examples: electricity generator,
fuel energy refinery.
The four types of modules are:
1. this module is applied for limited analysis of process, as the small part of the energy
route entirely. In this part only three types of data process area needed, as follows:
feed stocks as the input, output or product of the conversion process, and the
efficiency rate of those conversion process.
2. transmission and distribution, it is applied to explain the lost energy during trans-
mission and energy distribution was operated. In each process is shown the percent-
age of the lost energy (example: lost = 5%, it is mean the secondary energy output
was 95% efficient).
3. this module is applied for details and complex of various energy conversion processes.
The use or various type of fuel in this process is aimed to product the various types
of refinery and capacity included.
Accounting Frameworks:
• accounting frameworks (1): physical description of energy system, costs and envi-
ronmental im- pacts optional. Rather than simulating decisions of energy consumers
and producers, modeler explicitly accounts for outcomes of decisions. So instead of
calculating market share based on prices and other variables, accounting frameworks

122 CHAPTER 4. RISK MANAGEMENT IN SUPPLY CHAIN ORGANIZATION
Figure 4.9: LEAP Calculation Flows
Source: LEAP Module
simply examine the implications of a scenario that achieves a certain market share.
Explores the resource, environment and social cost implications of alternative future
what if energy scenarios. Example: what will be the costs, emissions reductions and
fuel savings if we invest in more energy efficiency and renewable vs. investing in
new power plants?
• accounting frameworks (2) pros: simple, transparent and flexible; lower data require-
ments does not assume perfect competition. Capable of examining issues that go
beyond technology choice or are hard to cost. Especially useful in capacity building
applications. Cons: does not automatically identify least-cost systems: less suitable
where systems are complex and a least cost solution is needed. It does not auto-
matically yield price-consistent solutions (e.g. demand forecast may be inconsistent
with projected supply configuration).
This electric module is specially used for electric reactors. Those electric reactors are
arranged based on loading system capability, so that they will be able to fulfill the demand
every year by managing certain peak-load system. The picture 5.3.2 is a module for electric
reactors with various input (feed stock) as reactor power, which is then processed into
electric output to measure the demand per year and peak-load system.
Calculation of the environment impact. In every year from the base year to the finished
year of research, on the demand device and process of transformation in related with the
EDB trough the sources categories, each EDB sources could be taken some various from

4.9. ENERGY APPLICATION PLANNING MODEL 123
Figure 4.10: Refinery Module, LEAP
Source: LEAP Module
of the environment impact. The environment impact was based on the quantity of energy
consumed for energy years. Whereas, environment impact that emitted by the by the
transformations process was based on the quantity of the input and output of energy
year. Form the several demands and its transformations, was converse form the giga-
joules to the physic unit (i.e. ton). The point of the convention is to get the real data
as similar with the data was kept in the EDB. After the conversion in to the physic
unit form, then as similar with the real data in the three programs that are the demand
program transformation program and EDB than the amount of environment impact could
be calculated.
This calculation is divided into two parts; those are:
1. loading = physical ¡ coefficient. loading = the amount of emission in each year i.e.:
CO2, in kg physical = physical quantity of fuel energy i.e. coals in ton. coefficient
= EDB coefficient
2. adjusted loading = loading ¡ composition area composition EDB adjusted, loading:
the adjustment of data entry to show the fuel composition used in certain area.
Composition area: the percentage of emission content of every energy used in certain
area. Composition EDB: the percentage of emission content of every energy in EDB.
3. the type of final energy (energy supply) being used at this time are; fuel energy,
natural energy, gas energy, LPG, goal, coals bricket, electric, woods, charcoal.
In the future, it hoped types of renewable energy could be developed, in example:
ethanol as become the transportation energy and so other alternatives energy to be the
power of electric generators. In this time the could be supplied by the domestic energy
industry. Temporarily import of energy was relatively in small scale, it is only done when

124 CHAPTER 4. RISK MANAGEMENT IN SUPPLY CHAIN ORGANIZATION
Figure 4.11: Electric Reactor Module
Source: LEAP Module
the domestic production of energy is being disturbed. However, in the parts of domestic
oil refinery keep used the imported of crude oil (oil stock).
It shows the flows of energy supply in the scheme form it is coming from the primary
form into the final energy that ready to consumed. This scheme is called reference energy
system (RES) - in the quite right of the column is the various forms of primary energy:
wind, natural gas, oil, coal, woods and water power. The directly consumed of these
form to be the final energy are: natural gas, coal and woods. In the middle of the
column is transformation of energy. Electric was come from the transformation process
of geo-thermal, water power, natural gas, coals, and fuel energy; fuel energy were coming
from the transformation of oil mining; LPG comes from the transformation of oil mining
and gas, etc. Energy that comes from the transformation process is called secondary
energy that directly could be used to fulfill the final energy demand. The quite left of
column is the energy demand on the that figure, the demands its mean domestic energy
demand and export energy demand than in that figure shown the flows of LNG to the
demand box for export of LNG. The energy industries that produce the primary energy
are crude oil, gas and coals; whereas the secondary energy producers, LPG refinery, LNG
refinery, industry of coal bricket, charcoal manufacture and ethanol manufacture. In order
to fulfill the raising amount of energy demand it is needed the capacity extension from
energy industries. Data analysis in this part is contains of several parts:
data analysis of demand program: in this part, it would be shown some information
the demand projections of the industrial sector and households sector toward energy,

4.9. ENERGY APPLICATION PLANNING MODEL 125
including electricity energy.
data analysis of transformation program: the data processing of this part will give
information the amount of electricity reactor output (in joules), the amount of losing en-
ergy during transmit- ting and distributing process. The activities of energy consumption
are divided into household sector and industry sector. Model assumption the assumption
models used are:
• The growth in year 2002 2030, the GDP is projected to grow moderately 2.254
% per year. This GDP growth is a trigger for the growth of other sectors energy
consumption instead of household sector.
• The energy consumption in household sector instead of electricity is the average
consumption of total population, while for the electricity the calculation is only
considered for they who get electricity access. The electrification ratio assumption
per population group averagely in the year 2000 is 52.019%. The growth of energy
consumption is as followed: electricity 7.794 %, oil 2,51 %, natural gas 2,54 %, coal
1,08 %, and LPG 6,29 %. The growth rate of energy demand per year up to 2030
for:
• Electricity; 4,305%
• Oil; 2,7887 %
• Coal; 8,44 %
• LPG; 2,37%
Demand program on analysis energy demand was implicated by the variables of macro
economy and micro economy. The variable of macro economy that implicate the energy
demand is the price of energy, theoretically the price of energy must be relates toward
the energy stock level and market scarcity both. But, in the reality, the price of energy
was hanged on the government policy frequently. Regulation of subsidy policy to the
energy demand implicate toward this type of energy demand pattern. Even so regulation
of subsidy policy to the oil energy was implicating deeper toward the domestic energy
demand entirely.
4.9.4 Conclusion
The source of energy in Indonesia, for example: oil, gas, coals, geo thermal, and so the
raw material of nuclear, it is also the energy sources comes from the surface. In example;
biomass, water power, wind power, tides power and solar power. Few of these energy
could be directly consumed to fulfill the needs of final energy, but the other parts must
be exchanged in to the different form of energy through the transformation process, to
achieve the final energy that is ready to consume.

126 CHAPTER 4. RISK MANAGEMENT IN SUPPLY CHAIN ORGANIZATION
Figure 4.12: Final Energy Demand
Source: LEAP Module
4.10 Energy Efficiency Measures for Coffee Produc-
tion
The qualified production system is required for supporting global supply chain system.
The lag of management system in logistics and supply chain quality will give impact on
sustainability of business itself, both in short run and long run term. Indonesia has a big
challenge for coffee industries, especially for European market. All kind of management
skill is needed to handle the business by cooperation from all stake holders. The aim
of this paper is to trace the gap and lag of business opportunity, particularly in global
business through global supply chain. The combination of marketing intelligence and
supply chain approach are tools to support this business. Moreover, to get initial stage of
this business, the framework of construction supply chain in economics and management
science will perform in this paper. Finally, this paper will deliver such kind of description
and analysis, mainly the product system of Indonesia’s coffee. In addition to know more
the production and distribution of coffee in European market, clearly. The management
gap on the role of government, supply chain management and logistics or reverse logistics,
also in case studies of innovative business practice as follows:
• the lag of management system in logistics and supply chain quality
• a big challenge for coffee industries, especially for European market
• to trace the gap and lag of business opportunity, particularly in global business
through global supply chain, moreover to get initial stage of this business, the
framework of construction sup- ply chain in economics and management science
will perform in this paper.
• description and analysis, mainly the product system of Indonesia’s coffee. In addi-
tion to know more the production and distribution of coffee in European market.

4.10. ENERGY EFFICIENCY MEASURES FOR COFFEE PRODUCTION 127
Figure 4.13: The Paths of Coffee Producer to EU Market
Source: Fair trade Organization, 2012
4.10.1 Market Information
United Kingdom and France are best example in fair trade with certification or labeling,
generally. The organic coffee from Germany is key role in EU market without doubt.
Market for sustainable coffee has been achieving by Germany, Denmark, Dutch, Finland,
Austria, Luxembourg, and Sweden.
The smaller market for sustainable coffee product is South Asia and East Europe.
However, sustainable coffee product is more available in Spain, and Italia. The fair trade
and organic coffee time to time is become well known in small shops, especially in down
town.
More than 72 % of Frances population drink coffee, the market size shows that Frances
market has more various commodities in Europe. The Arabica coffee is the more popular
in France. The share of Robusta coffee is 32%. Frances import for green coffee 254.000
tons in 2009 and was increasing year by year.
Table 4.24: Percentage of Distribution for Green Decafeine by Frances ImportDescription 2007 2008 2009 2010 2011Arabica 51.5 52.7 49.8 49.6 48.8
Colombian Milds 7.2 8.6 6.8 7.1 6.8Other Mild 14.8 15.5 14.9 15.1 15.1
Brazilian Naturals 29.5 28.7 28.2 27.5 26.8Robustas 30.2 28.2 28.0 26.5 25.4Others 18.3 19.0 22.3 23.8 25.8Source: Source: International Trade 2007.
shows that Arabica, Colombian Milds, Brazilian, Natural Robustas, and etc has de-
creased, the exceptional is type of mild is still open to make more open market share.
Export and import regulation: all export and import for EU market is strictly and
high regulated. By taking Indonesia’s part for this research work can be finding easily,
particularly procedure and its requirements. Addressing to International Coffee Agree-
ment (ICA-1983) and its changed for international agreement, quota, price control, and
market intervention. By type of coffee product, Indonesia is exporter for 85 % of Robusta,
and 15% Arabica. The climate change and differences of climate for certain continent are

128 CHAPTER 4. RISK MANAGEMENT IN SUPPLY CHAIN ORGANIZATION
key factor for increasing demand of coffee. During winter is a good example for increasing
of coffee demand.
The market prospect for coffee product in France: the more interesting is the compe-
tition, for re- export coffee in France. This happened in France, due to France market is
a good market for big importer for both green coffee and roasted coffee. To the exporter
is important to taking care of tracing coffee product. How the original coffee product has
been produced in origin country? All products must be verified and certified to assure
the product quality by labeling. All exporters faced on difficulties to entry in European
market, due to the local regulations and European commission members. The impact of
certification scheme will be different country to country. For example; organic coffee from
Germany will be important, relatively.
4.10.2 The Competition of Green Coffee
The supply chain in re-export mechanism from EU is increase time to time. On average
19 % per year and the market share from companies from rest the world is noted 6.1 %,
only. The impact of comparative scheme from different certification is varieties. Coffee
organic from Germany is really important. But, in UK and France Fair trade scheme is
more important.
The market for sustainable coffee in UK, Denmark, Netherlands, Finland, Austria,
Luxembourg, Sweden, and Germany is quite high. The market shares for sustainable
coffee in south Asia, and east Europe is smaller. However, sustainable coffee could be
found easily in Spain and Italy. Indonesia has a good competitor in this product, mainly
for Robusta coffee. Namely: Vietnam, Cote d’ivoire and Cameron. The retail price for EU
2007 with price 5.71 Euros (ICO, 2008), year by year the price is increasing. Indonesia’s
coffee product has been decreased in the case of 2011 target, 633.990 tons only from
production target 689.920 tons. Meanwhile, Germany is the main coffee market for coffee
organic. Its so called Rainforest Alliance. EU has been imported coffee organic 50 %.
This trend will be increase year by year by support of Nespresso coffee brand.
The governments regulation based on No.27/M/-DAG/PER/7/2008, for coffee export.
In 2009/2010, Robusta’s export 85% and Arabica 15 %, 350 tons that is equal to US$
705.5 million.
It is natural when the demands of world coffee increase yearly; the supply from In-
donesian coffee companies could not provide the product sufficiently. Frances import
policy: the import is regulated by EU standard and all agriculture products are in double
supervision in order to get sanitary and phytosanitary certification.
4.10.3 The Basic Idea of Supply Chain Approach
How to maintain the coffee product in sustainable global supply chain? There is a high
competition from green coffee from EU members to be export to France. The market of
EU is promising market development.

4.10. ENERGY EFFICIENCY MEASURES FOR COFFEE PRODUCTION 129
The basic identification of international coffee product is from Vietnam, Cote d’ivoire,
and Cameroon. Supply chain framework in these cases described international coffee
product is need global supply chain complexity approach. There are a lot of barriers for
exporting coffee product:
1. the caffeine volume should not be exceeding 0.3 % from weight, net.
2. it should be noted well that without containing caffeine by specific label.
3. if there is additional ingredient should be marked on coffee product, officially.
4. if there is additional liquid on the coffee product less than 25 % from weight-net.
In global supply chain perspective shows that the one of the successful business
method in not make a deal, only. The action before enhance the business is a make
construction for supply chain coffee product.
How the supply chain business product can be sustainable one? especially for Euro-
pean market. Therefore, it is important to know what kind of coffee production system in
country origin. Further- more, the global supply chain system should follow certification,
social security insurance system, packaging, labeling, and etc. Somehow, the labeling
scheme is one of the non-tariff barriers.
The formal relationship should be maintaining, especially inter association coffee pro-
ducer. For example: the business relationship between importer and exporter. Interna-
tional trade, France seems to be stronger by making rebounded effect when their inter-
national trade become intensively with Asian countries. In business of coffee product can
be summarized as follows:
1. the statistics ICO (International coffee organization) shows the coffee consumption
in France, 72 % has been consuming coffee product, daily.
2. more than 90% of them have coffee machine in their home. This condition pushed
the consumption of coffee product become highest one. The culture of drink coffee is
one of their embedded cultures, also. The consumption of coffee product in France
is 333 thousand tonnes in 2009; it has been increased 8.0% from 2008.
3. from time to time, France becomes the third biggest in EU for coffee product market.
The coffee consumption is 14 % in entire of EU (ICO, 2010). Per capita consumption
as noted in 2008 was 5.5 KG (ECF, 2008).
4. The Fairtrade in coffee product has been increasing while the economic performance
in a country grows up as well. This perspective will take account that the farmer
should have a better welfare and quality of life, also.
5. the good sample as follow; in general, the consumption of coffee 100 % is Arabica
coffee, 36% is pure coffee, then mixed coffee containing Arabica coffee and Robusta
coffee 17 % is in single service packages (SSP).

130 CHAPTER 4. RISK MANAGEMENT IN SUPPLY CHAIN ORGANIZATION
6. the rest is 17 % as ethnic sector coffee or so called coffee espresso 10 and then mild
Arabica 6 % or is in a common sense so called green coffee which is low level of
caffeine.
4.10.4 Positioning
Indonesia has a chance to take over the Vietnam position as coffee exporter, particularly
on Robusta coffee product. These are following strategic could be done, comprehensively:
market share in EU market should be maintained and become greater periodically. How
to reach this strategic; it is by increasing the quality of product, and or certified coffee
organic. The certified coffee product is one of the best methods to find the barriers of
international coffee trade.
The potential EU market: while focusing on sustainable coffee product, the effort is
also how to go direct market penetration, efficiently. By increasing product quality and
sustainable of business are best key points in this business challenge. Based on current
issues there are a lot thing to do to make more efficiency in business development.
Promoting the environmental issues has linked to business coffee product. The linked
has been proposed in the concept of fair trade, organic rain forest alliance and UTZ
certified. The certified of fair trade in the main strategic for coffee product. By this
certification on fair trade, the consumer will be guaranteed that the international coffee
product price is competitive one. This policy is one of the method how government protect
the farmer and or producer coffee product. By exclusivity, part of coffee product in the
reality is produced by small farmer or enterprises.
Almost 54 % of fair trade coffee product certified at EU is closed to 91 thousand tons
of volume in coffee product trade. The coffee product sold has increased 24 %, started
from 2005. The fair trade put on his product by labeled coffee organic. By referring
the law enforcement of EU, 1994/4/EC for coffee extraction, the coffee product can be
distributing in EU market by putting labeling system which is contain the composition
and coffee extract.
Figure 4.14: Continuous Development in the Energy Efficiency System
Source: LEAP Module

4.10. ENERGY EFFICIENCY MEASURES FOR COFFEE PRODUCTION 131
The coffee extract: the extraction from roasted coffee by adding the certain of water
volume. The acid nitrate and hydraulics process is excluding in this process. For further
information, these are not kind of definition of coffee extract; the coffee instant, and or
other coffee extraction method that similar to coffee instant.
4.10.5 Methodology
Calculation of the Energy Efficiency:
For the calculation of the energy efficiency index (EE) of a domestic coffee machine,
the Annual Energy consumption of a domestic coffee machine is compared to its Standard
Annual Energy Consumption (a) The Energy Efficiency (EE) is calculated as follows and
rounded to one decimal place:
EE =(SAE )
(AE )(4.7)
Where,
SAE= calculated standard annual energy consumption of the domestic coffee machine, in
kWh/year with SAEC is 110 kWh/a for drip filter coffee machines, 137 kWh for portioned
filter coffee machines and 110 kWh/a for espresso machines;
AE = calculated annual energy consumption of the domestic coffee machine, in KWh/year
and rounded to one decimal place.
Trend setter: The last updated is Jamaica for trend setter in business coffee product.
Jamaica could entry easily to the European market by getting rainforest alliance certified.
The one of best product from them is the blue mountain coffee which is one of their best
products. See, Mannino et al. (2008), Gokce and Gokce, (2013).
4.10.6 Conclusion
However, it is still hard to measure energy efficiency in global supply chain of coffee
production. Because, the process of coffee production in developing countries or exporter
countries are different one. For example, we need a huge of water for coffee processing and
exported them in raw materials. so that, to make sense the energy efficiency which used
a huge of electricity for coffee processing were happen in large enterprise or developed
country as well. Furthermore, to follow up those kind of strategic method:
the first is by avoiding the excessive insecticide on coffee plantation and coffee price at
local price and international price. It’s a must how to make a balancing the international
price and local price competitiveness.
Second, business collaboration rather than collaboration to make more openness in France
or EU market. More specific, there are two markets segmentation which consist of users
and supplier in this business opportunity a). house hold consumer, market segmentation
become more various one, b). small medium coffee shop: super market, coffee shop, small
shop which is focus on selling coffee product.

132 CHAPTER 4. RISK MANAGEMENT IN SUPPLY CHAIN ORGANIZATION
4.11 Nuclear Power Plant in Global Supply Chain
Since the first construction phase through entire of finishing nuclear power plant is need
global supply chain both local and international level. Industrial supporting system will
survey to get feasible impact of nuclear power plants construction. During nuclear power
plants construction will absorb 4000 peoples both in international and domestic people.
The first construction cost will take 10 % from total cost of nuclear power plants con-
struction.
The positive impact is local people will get the job from road construction and nuclear
power plants pre-construction. Operational system of nuclear power plants construction
should well have connected to regional economy. Avoiding the negative impact from
plants construction. Moreover, it can promote local economy.
Discussing industry profile shows that all component analysis and nuclear power plant
construction based on local industrial linked with construction plant needs. From trac-
ing studies have found 63 industrial profile that can promote the project. However, it
will be first stage for local industry to be more efficient and high level of productivity to
support sustainability of nuclear power plants construction. The domestic cost in eco-
nomic sector on input-output table framework BOP, Balance of plant components price
has been determined in input output analysis and identify the necessities for power plants
construction.
Identification for local industries which can lead for produce plants equipment with
high quality. The good and all services can be trace form I-O tables. From I-O table
can be identified the price and goods based on economic sector activities. The same
methodology can be used for each power plants construction based on KSNP type to
know how much it will take cost for each year plants construction. Mapping all cost can
be done on I-O tables. Monte Carlo simulation on global electric management trading;
the present situation is due to the French government deciding in 1974, just after the first
oil shock, to expand rapidly the country’s nuclear power capacity, using Westinghouse
technology.
4.11.1 Introduction
In order to overcome the electricity crisis that exist in Indonesia. The head of the national
nuclear energy agency (BATAN), propose to the government to develop nuclear energy.
Building nuclear power plants will be able to overcome these problems with the selling
price is cheaper and stable. The pacific islands region as one of the ideal locations of
nuclear power plants, in addition to the northern region of the island of Java.
“The results of the poll last November, 72 percent of Indonesia supports. In the
pacific islands, 57 percent of the population has been supportive”. It calls nuclear power
plant technology (NPP) is now entering the third generation is much safer. In the latest
technology, the NPP will automatically stop operating in the event of an earthquake.
This technology is not owned nuclear power plant in Fukushima, which leaked during the

4.11. NUCLEAR POWER PLANT IN GLOBAL SUPPLY CHAIN 133
tsunami in 2011. “Fukushima was using the technology in the 1960s”.
How ready we build and manage human resources? A preparatory program of devel-
opment of nuclear power plants is actually quite a long time, so more than 30 years. But
until this last challenge, the community, public acceptance of nuclear power. Perhaps
the perception of some people, the nuclear scary, like the case of a recent accident in
Fukushima (2011), Chernobyl (1986), and the atomic bomb. We can understand it. The
tendency of poll results last? Post-traumatic in Fukushima, only 40 percent who favor
nuclear power plants.
This is a very good capital for the new government to harness nuclear power plants in
order to overcome the energy crisis. There is no single country that people 100 percent
supportive of nuclear, but many countries are rational. For example: America is a country
where Greenpeace was born but also operate 100 nuclear power plants. The growth in
nuclear energy: supply chain challenges, “Despite the Fukushima nuclear accident and
the withdrawal from the market by countries such as Germany, nuclear energy is experi-
encing a global resurgence as countries aim to diversify their energy mix and reduce their
carbon emissions”, John Wood, 2014. However, still make a hope for energy alternative
development for nuclear supply chain in developing countries such as Indonesia.
The research work can be drawn as follows; the location of project planning is in north
of central java island. The power plants construction is needed due to the massive energy
demand. The nuclear power plant will contribute to national demand 4 %. The estimation
for 2015 confirmed that the national demand for electricity 100 Gigawatt. However, in
this decade is available 34 Gigawatt, only. All need in this research work is management
skill; particularly on energy management logistics and supply chain management inter
islands.
This study is to measure the impact of nuclear power plant and its significance to
global supply chain that will occur to this site plant site. The economic activity will
increase if the site plants construction well executed. The study can be explored for prep-
construction and phase of construction. By certain condition this study estimates the
impact of site plants construction in specific scale of regional economic development. The
necessary of theoretical background and literature review will contribute in this research.
The nuclear site plants construction or installation as the main object. Moreover, to
understand well the mechanism of nuclear plant site.
Nuclear power plant need enormous of uranium stock. Fortunately, a huge amount of
uranium exists in Kalimantan Indonesia. The local administrative is waiting for central
government to build up nuclear power plants. Enormous amount of uranium closed to 900
tons, precisely at Melawi regency, west Kalimantan. The current of Indonesia’s uranium
reserve of at least 53,000 tons which might be used enough for basic material to build
nuclear power plants. Its included 29,000 tons in Bangka Belitung. Approximately 1,000
MW, Nuclear power plants needs 200 tons’ uranium per year. By reaching 29,000 tons
the plants can be operated for 145 years.
For Papua needs some research field, stated by the national nuclear energy agency

134 CHAPTER 4. RISK MANAGEMENT IN SUPPLY CHAIN ORGANIZATION
(BATAN-Indonesia). However, Economic development is the process of the local gov-
ernment and community to manage all resources to create economic growth and local
economic activities. The endogenous development, institutional developments are impor-
tant to support local government activities.
Table 4.25: Nuclear Power Plants World-Wide-1No. Country Number Electric.Net Number Elec.Net1 Argentina 2 935 2 7172 Armenia 1 375 - -3 Belarus - - 1 1,1094 Belgium 7 5,927 - -5 Brazil 2 1,884 1 -6 Bulgaria 2 1,906 - 27,7567 Canada 19 13,5 - -8 China 21 16,89 28 1,69 6 Reactor in Taiwan 6 3,804 - 1,610 Czech Republic 4 2,752 1 -11 Finland 58 63,13 1 -12 Germany 4 5,308 - -13 Hungary 21 915 6 1,32514 India 1 42,388 - 6,3715 Iran 48 20,71 2 -16 Japan 23 42,388 5 -17 Korea, Republic 2 20,71 - 63018 Mexico 1 1,33 - -19 Netherlands 1 482 2 8,38220 Pakistan 3 690 - 88021 Romania 2 1,3 10 -22 Russian Federation 33 23,643 2 -23 Slovakian Republic 4 1,815 - -24 Slovenia 1 688 - -25 South Africa 2 1,86 - -26 Spain 7 7,121 - -27 Sweden 10 9,474 - -28 Switzerland 5 3,308 - -29 Ukraine 15 13,107 2 1,930 UAE - - 2 2,6931 UK 16 9,231 - -32 USA 104 101,465 5 5,633
Total 435 372,022 72 68,344Source: Nuclear Power Plants World-Wide-3
Hungary, Japan, and Romania were trying to provide nuclear plant site with enough
sufficiency of energy sources, particularly on nuclear site. Regarding current issues of
nuclear energy Japan and Germany shows to decrease the number of nuclear power plant
site. The issue was environmental impact and concerned for earthquake problems.
After getting green light from US Government, the Iranian government in massive
activities to shows their capacity in energy source (nuclear energy), especially for recon-

4.11. NUCLEAR POWER PLANT IN GLOBAL SUPPLY CHAIN 135
struct their economic situation. USA is the giant for providing energy source in nuclear
system. It is correlated with historical and scientific development program. However,
France is in advance for nuclear scientific development.

136 CHAPTER 4. RISK MANAGEMENT IN SUPPLY CHAIN ORGANIZATION
Tab
le4.26:World
NuclearPow
erReactorsan
dUranium
Requirem
ents-1
Cou
ntry
Nuc.
Elec.Gen.
Reac.Op.
Reac.Und.Con
s.Reac.
Planned
billion
kW
h%
eNo.
MWeNet
No.
MWegross
No.
MWegross
Argentina
5.3
4.0
31627
127
00
Arm
enia
2.3
30.7
1376
00
11060
Ban
glad
esh
00
00
00
22400
Belarus
00
00
22400
00
Belgium
32.1
47.5
75943
00
00
Brazil
14.5
2.9
21901
11405
00
Bulgaria
15.0
31.8
21906
00
1950
Can
ada
98.6
16.8
1913553
00
21500
Chile
00
00
00
00
China
123.8
2.4
2623144
2325163
4552200
Czech
28.6
35.8
63766
00
22400
Egy
pt
00
00
00
22400
Finland
22.6
34.6
42741
11700
11200
France
418.0
76.9
5863130
11720
11720
German
y91.8
15.8
912003
00
00
Hungary
14.8
53.6
41889
00
22400
India
33.2
3.5
215302
64300
2221300
Indon
esia
00
00
00
030
Iran
3.7
1.5
1915
00
22000
Israel
00
00
00
00
Italy
00
00
00
00
Jap
an0
043
40480
33036
912947
Jordan
00
00
00
22000
Kazak
hstan
00
00
00
2600
Korea
DPR
North
00
00
00
00
Korea
RO
Sou
th149.2
30.4
2421657
45600
811600
Sou
rce:
World
NuclearAssociation,20
14

4.11. NUCLEAR POWER PLANT IN GLOBAL SUPPLY CHAIN 137
Tab
le4.27:World
NuclearPow
erReactorsan
dUranium
Requirem
ents-2
Cou
ntry
Nuc.
Elec.Gen.
Reac.Op.
Reac.Und.Con
s.Reac.
Planned
billion
kW
h%
eNo.
MWeNet
No.
MWegross
No.
MWegross
Lithuan
ia0
00
00
01
1350
Malaysia
00
00
00
00
Mexico
9.3
5.6
21600
00
00
Netherlands
3.9
5.6
21600
00
00
Pak
istan
4.6
4.3
3725
2680
00
Polan
d0
00
00
00
6Rom
ania
10.8
18.5
21310
00
21440
Rusia
169.1
18.6
3425264
97968
3132780
Sau
dia
Arabia
00
00
00
00
Slovakia
14.4
56.8
41816
2942
00
Slovenia
6.1
37.2
1696
00
00
Sou
thAfrica
14.8
6.2
21830
00
00
Spain
54.9
20.4
77002
00
00
Sweden
62.3
41.5
109487
00
00
Switzerlan
d26.5
37.9
53333
00
00
Thailand
00
00
00
00
Turkey
00
00
00
04
Ukraine
83.1
49.4
1513168
00
21900
UAE
00
00
34200
14200
UK
57.9
17.2
1610038
00
46680
USA
798.6
19.5
9998756
56018
56063
Vietnam
00
00
00
44800
Sou
rce:
World
NuclearAssociation,20
14

138 CHAPTER 4. RISK MANAGEMENT IN SUPPLY CHAIN ORGANIZATION
As of 21 April 2015, it has included only for those future reactors envisaged in specific
plans and proposals and expected to be operating by 2030. Then, making a plan for sort-
run developments and the prospective long-run to role nuclear power in national energy
policies.

4.11. NUCLEAR POWER PLANT IN GLOBAL SUPPLY CHAIN 139
Figure
4.15:Maintenan
ceSupply
ChainModel
Log
istics
andSustainab
leTransport,
Vol.
1,Issue4

140 CHAPTER 4. RISK MANAGEMENT IN SUPPLY CHAIN ORGANIZATION
Supply chain management is well-known concept in logistics. Cooper and Ellram
(1993) SCM is:an integrative philosophy to manage the total flow of a distribution channel
from the supplier to the ultimate user. Mentzer et al. (2001) define a supply chain as: A
set of three or more entities directly involved in the upstream and downstream flows of
products, services, finances, and/or information from a source to a customer. Conkling
(2011) stated that the integration of business processes from end user through original
suppliers that provides products, services and information that add value for customers.
There is an emphasis on flows of products, services and information between firms, which
have to be organized and managed as if they belong to one entity.
According to the energy scarcity, energy efficiency, energy supply chain inters coun-
tries, islands, and cities. The US administration deregulates for nuclear business de-
velopment:remove protectionist access to the global supply chain, promote commercial
nuclear industries in foreign markets, supplementary compensation for nuclear damage,
and restriction for extended scheme of loan guarantees.
Figure 4.16: Macro Scheme of Global Nuclear Supply Chain
Source:World Nuclear Association, Greg Kaser, 2014
Ensuring that the economics of nuclear power are competitive with other
generating sources First, economic challenges, and Second, developing reliable inter-
national supply chains:
a). capability challenges.
b). quality challenges.
c). challenges are inter-related.
Focusing on Capability Challenges Develop the supply base: - to create joint un-
derstanding; on safety culture, on quality management,

4.11. NUCLEAR POWER PLANT IN GLOBAL SUPPLY CHAIN 141
- knowledge transfer,
- building the capability of the workforce.
4.11.2 Input Output Estimation Model
To study interconnection or link between production sectors in economy, the best model
or methodology is input-output model, Leontief (1986). The first input-output model
developed by Wassily Leontief from Harvard University in 1930s.
The input output model is one of the powerful models to see the interaction between
economic sectors. The economic structure can be found easily in input output model.
The economy structure consists of a country, region, and metropolitan and inter region.
The input output analysis is the tools to know the general equilibrium. The economic
condition is reliable in this condition. Therefore, it is not theoretical approach only.
Remuneration of the production factor is called the value added. The factors of pro-
duction in the economy are not all used up in the production sectors. There are also
the factors of production are used as final demand. In addition of intermediate inputs
purchased from other sectors in the economy, and the primary input in the form of the
factors of production, the production process of certain sectors can also buy inputs from
abroad, in the form of imports.
Figure 4.17: Transaction of Input Output Table
Source:World Nuclear Association, Greg Kaser, 2014
It has referred as the input-output transactions table. It is assumed in the economy
there are only two production sectors (sector 1 and sector 2); There are four components
of final demand, household consumption (C), investment firms (I), government spending
(G), and foreign exports (E); two factors of production, namely labor wage remuneration
(L) and capital (N). In addition, the production sectors and end users can also buy goods
from abroad in the form of imports (M). Sims et al. (2007), noted that the IEA (2006b)
data on known reserves and estimated resources. The latter category may include some
quantities shown as resources as in Figure
1. the capacity of energy carriers is shown by the width of the lines.
2. energy conversion steps may take place in the end-use sectors, such as the conversion
of natural gas into heat and/or electricity on site at the individual consumer level.
3. buildings include residential, commercial, public service and agricultural.

142 CHAPTER 4. RISK MANAGEMENT IN SUPPLY CHAIN ORGANIZATION
4. organic waste is included with biomass.
5. the resource efficiency ratio by which fast-neutron technology increases the power-
generation capability per ton of natural uranium varies greatly from the OECD
assessment of 30:1 (OECD, 2006b). In this diagram the ratio used is up to 240:1
(OECD,2006c).
6. comparisons can be made with SRES B2 scenario projections for 2030, energy sup-
ply, Source: IEA, 2006b.
The output produced by sector, sector i is distributed to the two users. First, users
who use the output for further production process, and second, users who use the output
for final use. The first user is the production sector. Second, user is the end user. For the
first user, the output of sector i are the raw materials or intermediate inputs (intermediate
inputs), while for the second user, the output sector i is final demand. In the context of
intermediate inputs, movements of goods between sectors, from sector i to sector j. From
sector i to sector i itself, or the so-called displacement intra sector. In other words, the
displacement of sector i to sector j, where i = j. Say that the value of the money flow of
goods from sector i to sector j given notation zi j , the total output of sector i given the
notation Xi and the total final demand sector i is given the notation Yi . Thus can be
written that:
(4.8)
that there are n sectors in the economy. Thus, there will be n equations for the whole
economy, namely:
(4.9)
For each column, note that can be written a column vector containing:
(4.10)

4.11. NUCLEAR POWER PLANT IN GLOBAL SUPPLY CHAIN 143
Referred as the input-output transactions table. It is assumed in the economy there
are only two production sectors (sector 1 and sector 2); There are four components of final
demand, household consumption (C), investment firms (I), government spending (G), and
foreign exports (E); two factors of production, namely labor wage remuneration (L) and
capital (N). In addition, the production sectors and end users can also buy goods from
abroad in the form of imports (M).
Matrix with elements in the upper-left group called Environmental the input matrix. So
it can be made between the input matrix, Z, which read:
(4.11)
So it can be made a primary input matrix, W, which read:
(4.12)
While the matrix with elements in the upper-right group called the matrix of final
demand. The contents of this matrix are the final demand for each sector in the economy.
In the discussion, the matrix is usually used as a column vector, which each element is
the total final demand of each sector in the economy. The final demand matrix form is:
(4.13)
By knowing zij and Xij, can be calculated a technology coefficient, ai j , as follows:
(4.14)
which is often called the input-output coefficients, or direct input coefficients. These
coefficients can be interpreted as the number of input sector i required to produce one
unit of output of sector j. If there are n sectors in the economy, there will be as many as
the n x n coefficient ai j . All coefficients can be expressed in a matrix, A, in the form of:

144 CHAPTER 4. RISK MANAGEMENT IN SUPPLY CHAIN ORGANIZATION
(4.15)
A matrix is often called the technology matrix. A matrix of each column shows
the composition of inputs in the production process of the sector i, which reflects the
technology used by the production sectors. Algebraic manipulation of condition yields:
(4.16)
This equation confirms again that all the coefficients ai j other not reflect the rela-
tionship between the output and the input of sector j i sector. In the analysis of the
input-output relationship means the amount of the fixed nature of this relationship has
not changed despite improvements in the economy. After getting the technology coeffi-
cients ai j , then the system of equations can be written as follows:
(4.17)
By shifting all elements to the left, except Yi , obtained form:
(4.18)

4.11. NUCLEAR POWER PLANT IN GLOBAL SUPPLY CHAIN 145
Xi can be simplified into:
(4.19)
Where I, is the identity matrix of size n x n matrix A is as defined in advance, while
X and Y is the column vector of the form:
(4.20)
(4.21)
If there is a change in final demand, then there will be changes in the pattern of
national income. It can be written that:
(4.22)
4.11.3 Estimation Analysis
The input output table in particular year (ex: 1 year ), on the basis of the previous year IO
table ( ie. year 0 ) is to produce a table of I-O technology matrix is based on the technology
matrix 0 I-O years, used RAS method. This method does not require a detailed survey
to get the technology matrix, so it is appropriate to use I-O tables to predict the future
by combining RAS method with projection models developed previously. To explain the
use of the method in obtaining the future of I-O RAS Table, a survey conducted in this
method is replaced by the projection, which is done partially to obtain information from
the three vectors. First, the column vector which is the sum of each row of the matrix
Z in the usual 1 denoted by U (1). Second, the line vector is the sum of each column of
the matrix Z in the usual 1 denoted by V (1). Third, of course, is the matrix X (number
of output) in the first year, which is denoted by X (1). In principle, the method seeks to
obtain a matrix RAS technology in period 1, which is denoted by A (1). There are two

146 CHAPTER 4. RISK MANAGEMENT IN SUPPLY CHAIN ORGANIZATION
methods that can be used to predict the technology matrix A (1) on the assumption that
stable matrix technology or not all the time. If stable , then A (0) = A (1), whereas if the
technology matrix is not stable , then A (0) A (1) . The following describes the procedure
with the RAS method using three economic sectors of production, assuming that A is
unstable. This economy has data transactions between economic actors for years 0 to
note also that the technology matrix:
- input output model.
- input output system.
- construction of input output table.
- related concept of input output account.
4.11.4 Theoretical Background of Input Output
Recently, economic development decisions require information the impacts of economic
growth or decline and the relative benefits and costs. What will be the impact of a man-
ufacturing plant closure or what resources does the community have to offer to potential
industries seeking a plant location ? The fundamental underlying relationship of input-
output analysis is that the amount of a product (good or service) produced by a given
sector in the economy is determined by the amount of that product that is purchased
by all the users of the product, has not changed, see Leontief (1986), Samuelson (2004),
and for more recent article see Timmer et al. (2015). A specific input output modeling
for enterprise, see Lin and Polenske (1998). In this paper said: input-output modeling of
production processes for business management.
However, today input-output analysis has become important to all the highly industri-
alized countries in economic planning and decision making because of this flow of goods
and services that it traces through and between different industries. Input-output ta-
bles are capable of simulating almost any conceivable economic impact. Economists using
input-output analysis today generally adopt an eclectic approach. They classify the goods
in the tables into three classes which broadly match the three fields of trade theory:
1. ”heckscher-ohlin’s goods”, which have generally known and relatively stable tech-
nologies, with comparative advantage resting largely on factor endowments. Com-
parative advantage may shift around among countries in response to changes in
factor prices and factor availabilities, so that the so-called ”foot-loose”.
2. technological goods for which the production process is sophisticated and subject to
frequent change, with the most recent technology probably specific to certain coun-
tries, and with proximity to high income markets an important factor. Computers
and pharmaceutical products are examples of such goods.
3. “ricardo’s goods”, where can be found that comparative advantage depends largely
on production conditions. These usually include extraction industries (agriculture,
mining as mentioned previously) and industries which carry out the processing of

4.11. NUCLEAR POWER PLANT IN GLOBAL SUPPLY CHAIN 147
raw materials. Comparative advantage here may located within developing coun-
tries.
4. the ensuing relationships of goods between industries reflect the state of technology
of a particular region. Technology then is an essential feature of the input-output
analysis. By determining what can be produced, and quantity of each intermediate
product which must be used up in the production process, given the quantities of
available resources and the state of technology.
5. growth in a particular industry may be induced by growth in others and input-
output methods allow the effects of such inter linkages to be unraveled and the
components of growth to be identified consistently.
6. one of the interests in the field of input-output economics concerned with the fact
that it is very concrete in its use of empirical data and also very compact. All
changes in the endogenous sectors of an input-output table are results of changes
in the exogenous sectors. In the static model, one deals solely with the production
or “current account side” of an economy which provides a sound example of the
compactness of the model. However, investment or capital account activities are
not included. These are then generally included in final demand rather than in the
part of the input-output matrix representing flows between individual industries.
This then becomes a serious limitation of the static model because the changes in
the structure of an industry’s capital stock, and the changes in its pattern of capital
equipment sourcing, are one of the most important manifestations of technological
change and may have a direct impact on its output growth. Economies are dynamic
so it may be argued that dynamic input- output models should be used because
after all, input-output tables give the stance at a particular point in time, which
will be outdated extremely quickly. The types of matrices shown may then be used
to attain goals such as increasing employment within a region, or to compare output
figures of one economy to another.
Input-output tables have three advantages that make them particularly well suited to
analyzing structural change:
1. the data are usually comprehensive and consistent. By their nature, input-output
tables en- compass all the formal market place activity that occurs in an economy,
including the service sector which is frequently poorly represented. For some coun-
tries, over a hundred different data sources are used to ensure the completeness and
internal consistency of the data, making it probably the single most comprehensive
and complete source for economic data for most coun- tries. Consequently, input-
output tables frequently play a fundamental role in the construction of the national
accounts. This role means that the data are thoroughly has been checked for their
accuracy, and that the tables are intrinsically linked with many of the traditional
indicators of economic performance such as production and GNP.

148 CHAPTER 4. RISK MANAGEMENT IN SUPPLY CHAIN ORGANIZATION
2. the nature of input-output analysis makes it possible to analyses the economy as an
interconnected system of industries that directly and indirectly affect one another,
tracing structural changes back through industrial interconnections. This is espe-
cially important as production processes become increasingly complex, requiring the
interaction of many different businesses at the various stages of a product’s process-
ing. Input-output techniques trace these linkages from the raw material stage to the
sale of the product as a final, finished good. This allows the decomposition analysis
to account for the fact that a decline in domestic demand for autos not only affects
the auto industry, but also its suppliers like the steel industry and the steel suppliers
like the coal industry and so on. In analyzing an economy’s reaction to changes in
the economic environment, the ability to capture the indirect effects of a change is
a unique strength of input-output analysis.
3. the design of input-output tables allows a decomposition of structural change which
identifies the sources of change as well as the direction and magnitude of change.
Most importantly, an input-output based analysis of structural change allows the
introduction of a variable which describes changes in producer’s recipes - that is, the
way in which industries are linked to one another, in input-output language, called
the “technology” of the economy. It enables changes in output to be linked with
underlying changes in factors such as exports, imports, domestic final demand as
well as technology. This permits a consistent estimation of the relative importance
of these factors in generating output and employment growth. In a general sense,
the input- output technique allows insight into how macroeconomic phenomena such
as shifts in trade or
changes in domestic demand correspond to micro economic changes as industries re-
spond to changing economic conditions.
Although the field is widely practiced today, problems such as those Leontief encoun-
tered, still exist. The limitations of the input-output approach, according to the OECD
document, structural change and industrial performance:
1. the basic input-output analysis assumes constant returns to scale. The input-output
model assumes that the same relative mix of inputs will be used by an industry to
create output regardless of quantity.
2. assuming that each industry is to produce only one type of product. For example, the
automobile industry produces only cars. The distribution and sale of this product
is fixed.
3. on each product within the industry is assumed to be the same. Also, there is no
substitution between inputs. The output of each sector is produced with a unique
set of inputs.
4. technical coefficients are assumed to be fixed: that is, the amount of each input
necessary to produce one unit of each output is constant. The amount of input

4.11. NUCLEAR POWER PLANT IN GLOBAL SUPPLY CHAIN 149
purchased by a sector is determined solely on the level of output. No consideration
is made to price effects, changing technology or economies of scale.
5. assuming that there are no constraints on resources. Supply is infinite and perfectly
elastic.
6. assuming that all local resources are efficiently employed. There is no underemploy-
ment of resources.
7. timeliness of input-output data. There is a long time lag between the collection of
data and the availability of the input-output tables.
8. the sporadic nature of input-output tables means that continuous time series are
impossible to construct without estimating input-output tables for the years between
benchmarks. In effect, input-output tables provide a snapshot of the complete
economy and all of its industrial inter- connections at one time, see more; Magnus
and Neudecker (2007), Keith (2004), Hal (1996). Furthermore, for global approach
in input output database, we can work on world input output database (WIOD) in
detailed see; McKinnon and Ge (2004), Kalenojaa et al. (2011),Dietzen- bachera et
al. (2013b,c,a).
4.11.5 The Basic Elements
- Classifies economy into productive sectors, let say n sector.
- by considering both uses as intermediate and final product.
- consider availability of product with time dimension.
4.11.6 The Balance equation
• availability of a product = utilization of the product • opening stock + current produc-
tion + import = intermediate use + consumption + FCF + export + closing stock
• or: • intermediate use + consumption + FCF + export - import + change in stock
(closing - opening)= current production denote
Denote
Xij : output of ith product used input in jth industry Xi : output of the ith product Ci :
consumption of the ith product Fi : fixed capital formation of the ith product Ei : export
of the ith product Mi : import of the ith product Si : change in stock of the ith product
****** Technical considerations for efficient operational management for example:
safety margins, design margins, operational margins, security considerations, unit avail-
ability considerations, operating experience, materials assessment, maintenance and re-
fueling considerations. However, systems and topics for review included: NSSS, BOP,

150 CHAPTER 4. RISK MANAGEMENT IN SUPPLY CHAIN ORGANIZATION
electrical systems, civil, security and fire protection, operational consideration, and main-
tenance and refueling considerations. The concept of decision sciences in this section will
take an important role. By applying management science on specific decision analysis will
be an appropriate one. Management and development in millennium era will be much
delivering complex problem and taking complex system. In the modern era, the choice
of technology used been used and provided by “scientist”, government, enterprises and
other institution, enormously. The decision science for application analysis is a strong
tools to help how make a choice of alternative energy sources. Therefore, I applied AHP
analysis which is a part of decision tools for better decision and simulation analysis for
extended problem solving. Schaefer (1988), energy analysis as a basis for rational use
of energy an absolutely essential requirement in any plans and measures to rationalize
the use of energy is an analysis of the energy situation. An analysis of this kind, if it
is to provide a suitable basis, must have the support of actual measurements, regardless
of whether they are for individual installations, machines or entire plants. Fairly, large
areas (regions or entire countries) are statistically recorded in energy balance sheets or
data base (real time, cross section and times series data). Vine et al. (2003), explained
which electricity sector reforms affect energy efficiency and load management incentives
among various market actors through multiple pathways. These included: 1. changes
in the role of energy efficiency/load management in meeting public interest goals and
objectives and/or the addition of new goals to a country or states list of priorities for
the electricity sector. 2. electricity sector reforms that affect barriers to energy efficiency
eliminating barriers, creating barrier and/or changing the relative importance of barriers;
and structural changes that affect the funding, implementing organization, roles of key
players, basis for evaluation or general focus, and direction of mechanisms.
Global energy flows (EJ in 2004); from primary energy through carriers to end-uses
and losses. Re- lated carbon dioxide emissions from coal, gas and oil combustion are also
shown, as well as resources (vertical bars to the left). Energy carriers such as heat, elec-
tricity and solid, liquid and gaseous fuels deliver useful energy services. The conversion of
primary energy-to-energy carriers and eventually to energy services creates losses, which,
together with distribution losses, represent inefficiencies and cost of delivery.
****** Plant efficiency and fuel switching reductions in CO2 emissions can be gained
by improving the efficiency of existing power generation plants by employing more ad-
vanced technologies using the same amount of fuel. For example, 27% reduction in emis-
sions (gCO2/kWh) is possible by replacing 35% efficient coal-fired steam turbine with
48% efficient plant using advanced steam, pulverized-coal technology.
Replacing a natural gas single-cycle turbine with combined cycle (CCGT) of similar
output capacity would help reduce CO2 emissions per unit of output by around 36%.
Switching from coal to gas increases the efficiency of the power plant because of higher
operating temperatures, and when used together with the more efficient combined-cycle
results in even higher inefficiencies (IEA, 2006a). Emission savings (gCO2-eq/kWh) were
calculated before and after each substitution option (based on IPCC 1996 emission fac-

4.11. NUCLEAR POWER PLANT IN GLOBAL SUPPLY CHAIN 151
tors).
The baseline scenario (IEA, 2004a) assumed a 5% CO2 reduction from fossil-fuel mix
changes (coal to gas, oil to gas etc.) and further 7% reduction in the Alternative Policy
scenario from fuel switching in end uses. By 2030, natural gas CCGT plants displacing
coal, new advanced steam coal plants displacing less-efficient designs, and the introduction
of new coal IGCC plants to replace traditional steam plants could provide a potential
between 0.5 and 1.4 GtCO2 depending on the timing and sequence of economics and
policy measures (IEA, 2006a).
IEA analysis also showed that up to 50 GW of stationary gas-fired fuel cells could be
operating by 2030, growing to around 3% of all power generation capacity by 2050 and
giving 0.5 Gt CO2 emissions reduction (IEA, 2006j). This potential is uncertain, however,
as it relies on appropriate fuel-cell development.
Figure 4.18: Policy Measures Given General Policy Objectives and Options to ReduceGHG Emission from the Energy-Supply Sector
Source: Energy Supply in Climate Change: Mitigation, 2007.
Emission-reduction policies for energy supply subsidies, incentives and market mecha-
nisms presently used to promote fossil fuels, nuclear power and renewable may need some
redirection to achieve more rapid decarbonisation of the energy supply.
Subsidies and other incentives The effects of various policies and subsidies that support
fossil-fuel use have been reviewed (IEA, 2001; OECD, 2002b; Saunders and Schneider,
2000). Government subsidies in the global energy sector are in the order of 250-300
billion US$/yr, of which around 2- 3% supports renewable energy (de Moor, 2001; UNDP
2004a).
An OECD study showed that global CO2 emissions could be reduced by more than
6% and real income increased by 0.1% by 2010 if support mechanisms on fossil fuels used

152 CHAPTER 4. RISK MANAGEMENT IN SUPPLY CHAIN ORGANIZATION
by industry and the power-generation sector were removed (OECD, 2002b). However,
subsidies are difficult to remove and reforms would need to be conducted in a gradual and
programmed fashion to soften any financial hardship. For both environmental and energy-
security reasons, many industrialized countries have introduced, and later increased, grant
support schemes for producing electricity, heat and transport fuels based on nuclear or
renewable energy resources and on installing more energy efficient power-generation plant.
For example, the US has recently introduced federal loan guarantees that could cover up
to 80% of the project costs, production tax credits worth 6 billion US$, and 2 billion US$
of risk coverage for investments in new nuclear plants (Energy Policy Act, 2005).
To comply with the 2003 renewable energy directive, all European countries have
installed feed- in tariffs on permit schemes for renewable electricity (EEA, 2004; EU,
2003). Several developing countries including China, Brazil, India and a number of others
have adopted similar policies.
Time constrains for delivering the product and efficiency during loading and unloading
product is an important issue in oleo-chemical industries. For instance, one plant pro-
duces more than hundreds tons per day which will have impact on energy consumption.
Moreover, it will influence on the level of stock, logistics and supply-chain operations,
Sbihi and Eglese (2007). This is crucial for sustainability of multinational companies,
because if there is mistake in calculation, stock planning will take costly for all business
operations.
Connecting to energy matter, there is a question; why energy efficiency is important
for all aspect? by improving the energy efficiency, its efficient consumption will be leading
to a better security, a quality improvement of the concerned industry. Also, by increasing
the energy security (supply, accessibility, etc.), competitiveness and profitability will in-
crease and contribute to reducing the overall impact global warming. The oleo chemicals
industries must choose a good transport service to handle efficiency energy matter and
extended existing problems, see Commission, 2013. The main problem is to provide a
best choice of transport service which is a challenge one in the range of simple business
up to complex business activities.
They have to assure that the product will arrive safely to all clients around the world.
With regards to the environmental impact, all companies which is included the transport
service must be careful with concern the environmental. The report of Ademe. (2012),
showed that between 2000 and 2007 from road transport statistics, there was energy
efficiency improvement. It could be happened by management transportation and eco-
driving when the car use on the road. Precisely, the efficiency of vehicles (measuring by
the ratio ton/km) is efficient, year by year. The management transport shows by the
increasing of the ratio ton-km/vehicle.
According to the legislation, the oleo chemicals industries are one of the most dan-
gerous output products. How to produce, to maintain the product, to process, and to
deliver all products is connected well in global supply chain system. It is not only in the
industrial supply chain system but follow the conduct of regional law and national law

4.11. NUCLEAR POWER PLANT IN GLOBAL SUPPLY CHAIN 153
for some circumstances.
The storing and transporting the oil in oleo chemicals industries are really heavy
treatment by the company and their global supply chain network, to make a guarantee
of best quality product, see Liu et al. (2010), 1987. The reduction of company’s cost is
derived from transport cost lower when delivering the product; energy consumption within
in industries which is appears in product processing. The absences of regular transport
though the special haulier services availability giving the performance of the companies
in some extend. It’s quite often the location of the oleo chemicals plant in remote areas,
in order to keep the environment clean and reduce the emission factors.
In normal condition, the direct impact of plant location in remote areas is lowering
the production cost, increased the producer price, and there is a probability increasing
the investment level. Discussing efficiency energy is continuous role in global business
sustainable showed, see Karlheinz (2000). The specific research in transportation palm
oil is very limited. Though, there are previous significant researches in the previous time.
See, Aminata et al. (2013), delivered the research finding; the relationship between vehicle
routing, scheduling, and green logistics. The proposed CO2 calculation here is used CO2
efficiency by using an intensity calculation, in order to get energy efficiency.
Moreover, for airline industries within global supply chain at glance will covered how
measure the sustainability of this industry. Focusing on global supply chain that would
be interesting and important one, in this matter. We can describe that will be minimum
awareness to be successful:
1. the level of responsiveness and efficiency factor for whole business schemes.
2. the measurement of efficiency supply chain and energy used or kerosene used is
efficient enough due to the fluctuation of kerosene price (energy price).
3. supporting IT system for business sustainability.
4. demand side and supply side from company to provide an excellent service and
regular maintenance.
5. supply chain management should be strong one, to promote non value added activ-
ities.
Killeen et al., (2010) and Choi et al. (2008) explained, “the other controversial chem-
ical parameter is hydrogen concentration, applied to mitigate water analysis. For a long
time, a value of 25-35 ml/kg (within a range of 25-50) has been used. The US’s electric
power research institute (EPRI) is considering increasing the hydrogen concentration to-
wards 50 ml/kg and possibly beyond, depending on the results of the ongoing qualification
work on the risk of decreasing the time to crack initiation.
The intention is to minimize crack growth rates. However, Japanese utilities are
evaluating the action of decreasing hydrogen concentration to delay crack initiation. The
preferred strategy for PWR is to adjust chemistry in a series of small, controlled steps

154 CHAPTER 4. RISK MANAGEMENT IN SUPPLY CHAIN ORGANIZATION
towards the optimum values. The guiding principle is to avoid large changes at once and
to monitor progress as the desired option is approached.
Another important concern in PWR is the mitigation of CIPS (crud induced power
shift) also named AOA (axial offset anomaly) of neutron flux. The international atomic
energy agency program, FUWAC will provide relevant data on the phenomenon, “taking
into account high burn-up operation, mixed cores and plant aging”. Like in PWR plants,
BWR coolant chemistry is intended to meet the sometimes conflicting requirements of
mitigating inter-granular SCC (IGSCC), controlling radiation field and avoiding fuel per-
formance issues. Reduction in feed water iron ingress and maintaining feed water zinc
has mitigated fuel crud concerns, Nordmann et al. (2010), Coriou et al. (1959), and
Dobrovolska et al. (2006).
4.11.7 The Flowchart Component
Figure 4.19: The Flowchart Component Cost Identification and Construction Cost
Source: Energy Supply in Climate Change: Mitigation, 2007.
4.11.8 Indonesia’s Nuclear Power Plants Location
The component analysis of nuclear power plant on KSNP type; the reactor, all special
building purpose for radioactive and nuclear safety. There is non-nuclear island; building,
turbine, building system for electricity installation, computer network and control system,
electricity transmission, diesel platform, etc. Type of KNSP:
1. nuclear steam supply system (NSSS),
2. turbine and generator (T/G),

4.11. NUCLEAR POWER PLANT IN GLOBAL SUPPLY CHAIN 155
3. fuel,
4. balance of plant(BOP) only, which permitted by KSNP CO., Ltd (KHNP), particu-
larly for output product from stakeholder. There are in small number that will produce
in local industries NSSS and T/G.
BOP, balance of plant for nuclear power plants: 1. architecture,
2. building construction,
3. electric and electronic,
4. environmental aspects,
5. control and instrumentals,
6. mechanic,
7. nuclear,
8. pipe.
4.11.9 Nuclear Power Plants Construction Phase
Since the first construction phase through entire of finishing nuclear power plant is need
global supply chain both local and international level. Industrial supporting system will
survey to get feasible impact of nuclear power plants construction. During nuclear power
plants construction will absorb 4000 peoples both in international and domestic people.
The first construction cost will take 10 % from total cost of nuclear power plants con-
struction. The positive impact is local people will get the job from road construction
and nuclear power plants prep-construction. Operational system of nuclear power plants
construction should well have connected to regional economy. Avoiding the negative im-
pact from plants construction. Moreover, it can promote local economy. BOP, Balance
of plant components price has been determined in input output analysis and identify the
necessities for power plants construction. Identification for local industries which can lead
for produce plants equipment with high quality. The good and all services can be trace
form I-O tables. From I-O table can be identified the price and goods based on economic
sector activities. The same methodology can be use for each power plants construction
based on KSNP type to know how much it will take cost for each year plants construction.
Mapping all cost can be done on I-O tables.
4.11.10 The Input Demand for Construction
Component analysis and break down cost have been identified for demand and domestic
output within linked industries. All prices and all values of product using 2004 data to
predict all construction phase between 2005- 20016, inflation rate has been implied in this
studies. The inflation rate is the policy target from the government. The inflation rate is
7 % (Rp 10.000/US $ 1). The pessimistic scenario inflation rate 4 % with exchange rate
Rp 9.000/US $ 1). The estimation value based on final demand in the end of project:
Where V2000 was the final demand for final year of 2000 and from CCBS, and “t” is year.

156 CHAPTER 4. RISK MANAGEMENT IN SUPPLY CHAIN ORGANIZATION
Figure 4.20: Accumulation Cost on Nuclear Power Plant Cost, S Curve.
Source: GMU Data Base
Figure 4.21: Income Effect 2005-2016
Source: GMU Data Base
The increasing of economic sector activity will increase household production factors.
Its shown that household income dispersion happened during preparation and construc-
tion execution, 2005- 2016, ceteris paribus.
By the assumption of employment growth 1.57 % per year, it can be calculated the
additional job creation on existing nuclear power plants. It caused direct and indirect
impact within nuclear power plants construction.
All scenarios are based on assumption, ceteris paribus. The labor growth 1.57% per
year calculated as additional labor force due to nuclear power plant construction. The
job creation simulation was 475.197 people will get job place. In certain sector (39) the
lowest is 23 people and maximum 179.109 people.
If using the pessimist scenario (inflation rate 4 %, exchange rate Rp 9.000/US $1),
total labor force impacts during construction 2005-2016 475.197. Then, with optimistic
scenario, (inflation rate 7%, exchange rate Rp. 10,000/US $1), will give impact to labor

4.11. NUCLEAR POWER PLANT IN GLOBAL SUPPLY CHAIN 157
Figure 4.22: The Impact for Labor Force 2005-2016
force 735.909 people.
This includes oil producing countries seeking to reduce their oil and gas reliance. Saudi
Arabia’s projected energy demand, for example, means they would be a net importer of
oil by 2032. In January 2014, the world nuclear association reported 71 nuclear reactors
under construction, 172 on order or planned, and a further 312 proposed reactors. This is
in addition to ongoing projects to extend the life or increase capacity of existing nuclear
power plants.
This growth in demand presents considerable capacity and capability challenges for
the nuclear supply chain, not only for the design and construction of the plants, but
also their ongoing operation and maintenance. This also applies to consultancy services
where there are limited resources with nuclear experience. Construction and operation
of nuclear power plants is highly regulated and con- trolled. Requirements vary from
country to country, but some fundamental principles are the same.
UK site license holders are responsible for nuclear and radiological safety and security,
including contractors work. This has significant implications for the procurement of the
construction and operation services, to ensure compliance with the site license conditions.
This growth in demand presents considerable capacity and capability challenges for the
nuclear supply chain.
The site license holder is directly responsible for managing its suppliers, and this
should be cascaded down to the supply chain. Contractors engaged on works requiring
nuclear and radiological safety and security must be aware of the license conditions and the
licenses obligations. The licensee must ensure that all contractors are suitably experienced
and qualified.
In UK nuclear power stations have been constructed since the early 1990s, demon-
strating the necessary new build experience may be a challenge for many UK companies.
However there are organizations with experience in nuclear decommissioning and nuclear
generation who will be able to demonstrate nuclear capability. Whether the supply chain

158 CHAPTER 4. RISK MANAGEMENT IN SUPPLY CHAIN ORGANIZATION
has the capacity to handle nuclear new build as well as the existing nuclear generation
and decommissioning is a different question. The supply chain for the construction and
operation of nuclear power plants is complex. However, there are large parts of the nuclear
power plant that are no different to any other power station. In simple way the supply
chain can be categorized as nuclear related and non-nuclear related.
Construction Type: All type of it’s elements: nuclear island (NI), conventional is-
land (CI), and balance of plant facilities which supporting infrastructure (“construction
logistics center or construction worker’s accommodation”).
The number of nuclear technology vendors in the global market is limited. All have
well established supply chains to support the manufacture and construction of the nuclear
island. The key factor will be their current order books and whether their supply chains
have the capacity to meet delivery time lines, particularly the heavy forgings required
for the nuclear steam supply system (NSSS). Increasing capacity in existing suppliers or
certifying new suppliers can be costly and time consuming.
It’s quite often that all countries embarking on nuclear power at first time face on
additional challenges in obtaining the necessary agreements to enable nuclear suppliers to
export their technologies. For the non-nuclear elements of the nuclear power plant, market
capacity may not be an issue. However major equipment such as turbines, generators and
switch gear are likely to be long-lead items and again may be impacted by manufacturing
capacity. There are several elements to the nuclear fuel supply cycle:
Fuel Cycle: Mining enrichment milling manufacture reprocessing fuel for the current
generation of nuclear reactors is uranium, which is abundantly available but needs to
be enriched prior to manufacture of the fuel rods. The demand for new nuclear reactors
will need additional capacity in existing fuel enrichment, manufacturing, and reprocessing
facilities. New facilities are expensive and controlled through international treaties.The
demand for new nuclear reactors will need additional capacity in existing fuel enrichment,
manufacturing, and reprocessing facilities.
Operations and Maintenance:
The supply chain for operation and maintenance of the nuclear power plant varies de-
pending on how much the operating company for applying: HSSSEQ (health and safety,
security, health physics, environmental, quality assurance) O+M labour Spares/equipment
Hired in plant Support services (training, engineering, project, finance, legal, facilities
management, transport).
Countries with existing nuclear power stations have a well-established supply chain and
as existing stations reach the end of their operational life, there should be capacity to cope
with new stations coming on line. Countries with no existing nuclear power stations face
a major challenge in establishing a supply chain. One solution is to outsource the entire
operation and maintenance to an experienced nuclear operator, but challenges remain in
establishing a local supply chain to support the operator.
Solution: In example in UK government has published in 2012, nuclear supply chain
action plan which sets out the plan for identifying skills and increasing capacity through

4.11. NUCLEAR POWER PLANT IN GLOBAL SUPPLY CHAIN 159
training and funding. Emerging nuclear generating countries are seeking to establish
capability and capacity in country to support their nuclear ambitions but face tough
challenges in attracting the knowledge, capability and investment needed in the absence
of in-country capability. Long term strategies are needed to create a supply chain capable
of providing the necessary capacity and capability to support the nuclear program.
4.11.11 The Cost of Decommissioning Nuclear Power Station
It was certain that if demand for electricity rise time to time. If so, it should keep the
generation capacity to keep up with demand. The problem is exacerbated by the fact that
much of the country’s current power supply, especially its aging nuclear power plants, is
reaching the end of its design life and will shortly be closed down. In fact, by 2023, for
example in Great Britain even in France, or other developed countries currently operating
nuclear plants will have ceased operation, with the remaining reactor until 2035. By
attention of this phenomenon, the government paid a lot attention for generating energy
source, especially for nuclear energy.
4.11.12 Conclusion
The economic projection under activity of the nuclear power construction in peninsula
of Muria, central Java around 0.01 % in the first initial project and then in the final
preparation of construction phase around 0.03 % in 2009. During construction 2010-2016
the economics of central Java has been increasing from 0.53 % at 2010, 0.54 % at 2011. For
local economy, Jepara’s resident during construction phase economic growth around 0.75
% predicted happened in 2005 and 2.46% in 2009. The economic growth for central Java
predicted 3.13 % in 2010 and 3.18 % in 2010. The analysis of component and cost-break
down structure shows the ability of domestic’s company to supply part of components
in nuclear power plants construction at Peninsula of Muria. The construction cost 25 %
coming from domestic input. The pattern of construction planning is follows S-curve. Its
means, a small amount of cost at the first phase, then increasing in the second phase,
finally decreasing at final construction. The positive impact: 1). The national output
will increase Rp 22.398 Billion, 2). Increasing revenue from the owner of production
factors Rp 3.759 Billion, 3). Job creation: 735.909 people. In pessimist scenario shows
that nuclear power plants will gave impact on national output Rp. 22,398 Billion, the
increasing income of the owner of production factor around Rp. 3,759, and absorb labor
force 475,197 people.
The optimist scenario will give higher impact to national output Rp. 34,447, then the
increasing income of the owner of production factor Rp 5.761 Billion, absorb labor force
735.909 people. The most significant to attract labor force is construction sector, trade
cement industry, transportation, mining, mineral industry, bamboo, wood, rattan, metal
and other metal product5. This decision was taken in the context of France for having
5Aminata J., Grandval S., Sbihi A., (2014), Nuclear Warehouse: Emphasize on Energy Efficiency

160 CHAPTER 4. RISK MANAGEMENT IN SUPPLY CHAIN ORGANIZATION
substantial heavy engineering expertise but few indigenous energy resources. Nuclear
energy, with the fuel cost being a relatively small part of the overall cost, made good
sense in minimizing imports and achieving greater energy security.
4.12 Warehousing
4.12.1 CSR - Risk Management on Warehouse Management
4.12.2 Special Section on Warehouse Management
In this special section, we explored how the new perspective of global supply chain energy
efficiency on warehouse gave us a leading issue on certain point of views. The energy
efficiency in global supply chain emphasized on warehousing for creating sample case
study is the most difficult one. Therefore, I presented only one sample case study.
Its so difficult, because I must return back to the definition of warehousing supply chain
in order to create global supply chain level. The description of warehouse in classical way
is a building, or a part of one, in which wholesalers keep large stocks of merchandise,
which they display and sell to retailers. Also, warehouse can be describe as a building, or
a part of one, for the storage of goods, merchandise. These kinds of definition is classical
one to understand how traditional warehouse operated in business activities, see more
Manzini (2012), Manzini (2012), Mannino et al. (2008), Marchi et al. (2013)
4.13 Electric Warehouse Intelligence
This happened due to the French government decided in 1974, just after the first oil shock,
to expand rapidly the country’s nuclear power capacity, using Westinghouse Technology.
This decision was taken in the context of France having substantial heavy engineering
expertise but few indigenous energy resources. Nuclear energy, with the fuel cost being
a relatively small part of the overall cost, in order to minimized imports and achieving
greater energy security. As a result of the 1974 decision, France now claims a substantial
level of energy independence and almost the lowest cost electricity in Europe.
It also has an extremely low level of CO2 emissions per capita from electricity gener-
ation, since over 90% of its electricity is nuclear or hydro. In mid-2010 a regular energy
review of France by the International Energy Agency urged the coun- try increasingly to
take a strategy role as provider of low-cost, low-carbon base-load power for the whole of
Europe rather than to concentrate on the energy independence which had driven policy
since 1973. The low cost of French nuclear power generation is indicated by the national
energy regulator (CRE) setting the price at which EDFs electricity is sold to competing
distributors. In 2014, the rate is 42/MWh, but CRE proposed an increase to 44 in 2015,
46 in 2016 and 48 in 2017 to allow EDF to recover costs of plant upgrades, which it puts
Strategy in Global Supply Chain. Journal of International Logistics, Volume 12, n.2—August 2014,pp.61-80.

4.13. ELECTRIC WAREHOUSE INTELLIGENCE 161
at 55 billion to extend all 58 reactor lifetimes by ten years. In November 2014 the gov-
ernment froze the price at 42 to mid-2015. The re-sale price has represented a long-term
floor price for EDFs power, and is nominally based on the cost of production. The in-
dustrial group Uniden said that the proposed 2015 wholesale price of 44/MWh would be
14 higher than Germanys. French retail prices, without major effects from feed-in tariffs
for wind and solar, remain very low. In 2013 French prices for medium-size industrial
were 90% of EU-27 average, and those for medium-size households (at less than 8 c/kWh,
“currency unit / kWh”) were less than half of EU-27 average, Carrera (2010). RTE’s
France reported which all challenges for French’s electrical network, RTE (2013):
1. how to account for the growth of peak electricity consumption related to new elec-
tricity end-uses?
2. how to maximize the use value of the electricity system for the collectivity?
3. how to take into account the energy transition options as launched in France by
2050, in view of meeting decarbonisation legislation of the pan European electricity
system?
4. how to increase the flexibility of the electricity system at acceptable cost?
5. how to be more socially responsible (which requires: identifying, measuring, quan-
tifying and minimizing environmental impacts of the transmission network)?
6. how to integrate a wider and wider span of scientific and technological evolution to
serve the global performance of the company?
4.13.1 Current Issues and Technology Development
The green issues and CSR issues have been taking important parts in global business
development. For instance, is the current issue of the security electricity supplies chains
during winter session 2015-2018. The next challenge is how do we encourage SMEs in-
dustries for giving more proper contribution by developing smart-phone and tablets that
significance to societies demand (CSRs policies ex; nuclear, solar, winds, wave). The an-
droid system in smart-phone and tablets could be one of possibilities to market captive
and also to get response from CRSs implementation.
The objective is to full fill the global electricity supply chain that will reach the
remote areas, by using RTE business model. For instance, around 40 % the mobile spare
parts is produce by local enterprise. This issues faced on international competition. The
global competition required each company to develop their own path to survive from
global competition. The efficiency eCO2, CSR and competence level will take attention
of company’s policies as an important role model, Muller (2007) and Manzini (2011).
Single operation plant model like France is the best example how to produce and develop
commercial exchange in electricity supply chain.

162 CHAPTER 4. RISK MANAGEMENT IN SUPPLY CHAIN ORGANIZATION
The commercial exchange figured in period of March, particularly in Spain has been
went down but start from April has been increased. For period June and August are
certain period of Spain which indicated under zero level.
The lag of data for this data base before fixed one is in two years. The real time data
available for time line data and update every 30 minutes.
Table 4.28: France’s Warehouse Energy Nuclear for Commercial ExchangeGermany Britain Belgium Spain Italy Switzerland
January 16.0 4.4 10.1 5.4 9.8 9.9February 16.6 4.3 3.8 -17.9 10.1 9.1March 18.9 5.4 7.6 -37.3 7.6 8.9April 10.3 7.8 12.2 -27.2 6.6 7.8May 0.9 10.3 15.3 30.0 7.6 6.7June -1.9 8.9 11.6 31.8 8.4 7.5July -0.4 13.4 8.9 30.5 6.3 8.5August -2.5 11.5 11.2 39.5 5.9 10.3September 6.0 11.1 10.4 23.3 7.9 7.0October 10.2 8.4 5.8 16.7 11.7 7.1November 13.7 9.0 3.6 -16.2 9.5 7.0December 12.1 5.5 -0.6 21.5 8.8 10.1
Source: RTE, Calculated by Authors, 2013.
It shows that in January and February most of commercial exchange is in positive
exchange, but commercial exchange with Spain the number showing negative signed. It
means that Spain has unprofitable exchange supply chain or commercial exchange with
France. The same condition has been shown in other period of time, also. However, in
winter season, particularly for November and December 2013, only Belgium and Spain
which is in negative signed.
Figure 4.23: The Share Level of Commercial Exchange to Total Energy Production withinInter Countries Connection
Source: RTE, calculated by Authors
The commercial exchange with Spain has been fluctuated, sharply. Especially, during
February to mid of November. The positive commercial exchange can be seen on com-
mercial exchange with Germany, England, Belgium. With Swiss, shown that the data
was almost shown stagnant figured.
The commercial exchange figured in period of March, particularly in Spain has been
went down but start from April has been increased. For period June and August are
certain period of Spain which indicated under zero level.

4.13. ELECTRIC WAREHOUSE INTELLIGENCE 163
Figure 4.24: Forecast for Total Energy Consumption Level
The lag of data for this data base before fixed one is in two years. The real time data
available for time line data and update every 30 minutes.
Figure 4.25: Strategic Programs and Objectives
Source: RTE - Update, 2013
4.13.2 Methods
CO2 Emissions per kWh of electricity generated in France which provide by RTE as an
indicator of the carbon footprint of electricity generation, expressed in grams of CO2
per kWh generated. The “real-time” indicators are based on telemetry and estimation
method. The optimization approach is to minimize the eCO2 mix level within warehouse,
delivering time and up to customer’s house.
We applied productions efficiency and customers’ efficiency for it. Open up inter-
national strategy for global business on electricity sector, Save Project (2012). How to
encourage the RTE-European model which is feasible for global electricity business model?
How it works in a monte Carlo simulation, a random value is selected for each of the
tasks, based on the range of estimates. The model is calculated based on this random

164 CHAPTER 4. RISK MANAGEMENT IN SUPPLY CHAIN ORGANIZATION
value. The result of the model is recorded, and the process is repeated. A typical Monte
Carlo simulation calculates the model hundreds or thousands of times, each time using
different randomly and selected values. When the simulation is completed, we will have
a large number of results from the model, each based on random input values.
These results are used to describe the likelihood, or probability, of reaching various
results in the model. For estimating ranges of values in some cases, it’s possible to estimate
a range of values. In a construction project, it will take to complete a particular job; based
on some expert knowledge.
The same could be done for project costs. In a financial market, there is distribution
of possible values through the mean and standard deviation of returns. By using a range
of possible values, instead of a single guess, by creating a more realistic picture of what
might happen in the future. When a model is based on ranges of estimates, the output
of the model will also be a range.
4.13.3 Result
These results are used to describe the likelihood, or probability, of reaching various results
in the model. For estimating ranges of values in some cases, it’s possible to estimate a
range of values. By using a range of possible values, instead of a single guess, can create a
more realistic picture of what might happen in the future. If the same model were based
on ranges of estimates for each of the three parts of the project, the result would be a
range of times it might take to complete the project. When each part has a minimum and
maximum estimate, we can use those values to estimate the total minimum and maximum
time for the project. Monte Carlo simulation can describe a range of values as a result,
beginning to understand the risk and uncertainty in the model. The key feature of a
monte Carlo simulation is by creating the ranges of estimation, how likely the resulting
outcomes.
Table 4.29: Random Value with Iteration, from the raw dataMinimum Cost Maximum Cost Random Value Cont. to 231 iterations
January 101591.53 117732.24 111399.15 .February 88070.64 102063.17 95688.93 .March 88250.55 102271.67 96426.40 .April 75438.82 87424.42 83075.77 .may 74632.21 86489.66 77076.14 .June 68515.90 79401.60 74529.18 .July 73508.24 85187.12 76135.57 .August 71624.43 83004.01 80978.05 .September 71270.01 82593.28 77742.92 .October 74413.52 86236.22 82109.61 .November 82942.56 96120.36 86487.36 .December 96839.17 112224.84 102603.30 .
Calculated by Authors
For each month shows that a lot of differences for commercial exchanges values. Almost

4.14. A NEW PERSPECTIVE OF ENERGY CONSUMPTION 165
the random minimum cost shown in June. It was cleared that in June is the starting
month before summer session. Started, October until January the data shown seemingly
increasing. The maximum cost and random value increasing and decreasing based on
regular activities (the consumption level, monthly).
The highest score for Germany is in March, Britain in July, Belgium in May, Spain was
the highest one among commercial exchanges countries. Italy is in October for the highest
score. and the period of August is the maximum commercial exchanges with Switzerland.
Creating and promoting multi agents and efficient delivery service by reducing eCO2 mix
problems level. Looking for alternative solution based on the best decision criteria. The
expectation result is for better understanding all possibilities for global business expan-
sion based on RTE business model, instead of France-European countries. Furthermore,
developing and opening the international project feasibility and wider global network.
To develop a holistic approach for progressive scheduling of the construction for global
business electricity sector model that will apply as world electricity integration model
2020-2050.
4.13.4 Conclusion
Increasing and developing productivity level by giving full respect of CO2 mix problems
level, mainly for global business electricity sector to wider future marketing level of busi-
ness opportunities, also. In addition, as one of CSRs company policy to give transparency
data for CO2 emission, see Pilavachi (1993).
4.14 A New Perspective of Energy Consumption
An important remarkable scientific writing can be found on how we can construct a
simulation of warehouse based on a computer model and testing it by executing computer-
based experiments with different combination, in detailed see Ficko et al. (2012).
Bitcoin is virtual currency that has a lot of advantages than ordinary money. The
transaction cost is a very low one and anonym. Utilizing bitcoin gave us a lot opportunity
for economy, mining process, and also development of E-commerce. Although, Bitcoin
faced on volatility and anonym, see Agora (2013). The trend setter for information
technology in 2014 was Bitcoin. Bitcoin is only one of virtual currency. Virtual currency
produces by mining processing by using computer. It used for tradable and service on
real life or online. This virtual currency accepted by vendors in US dollar.
Bitcoin created and constructed by cryptography algorithm which s called also as
crypto currency. other samples are “Ripple, Litecoin, Peercoin, NXT and Dogecoin”. It
was anonym scientist so called “Satoshi Nakamoto” in 2009 using peer to peer so no need
special authority or specific banking system. Transaction event done well by computer
network. The natural design of crypto currency is open source and freely open. The
straight point from this work is computer network that need energy consumption. Because

166 CHAPTER 4. RISK MANAGEMENT IN SUPPLY CHAIN ORGANIZATION
there is no identity, anonym, no borders and authority who control the transaction cost
will be very
low one. The complexity of Bitcoin pushes up for regulation update and customer
protection. However, the way is a really supply chain revolution and a new perspective
on global supply chain. The main regulator is central bank will have faced on many
challenging issues if crypto currency become bigger which give impact their own currency
in deterioration condition. The strong infrastructure and high quality of computation.
Otherwise, the central bank focus how to eliminate the risk because the volume of Bitcoin
and other cryptocurrency overwhelming in society. So that their own currency will not
effective for the economy.
All prices and inflation will not have covered by the central bank. The dependence
of high technology is really high. It depends on high tech and high infrastructure. The
weakness of infrastructure will give impact on independency of Bitcoin. The business
activity of Bitcoin challenges has declared as follows: • bitcoin mining. • exchange of
Bitcoin in real transaction. • barter transaction for Bitcoin investor (IRS, 2004).
4.14.1 Introduction
This phenomenon shows the challenging topic, how a new perspective of supply chain
connecting with the global network of supply chain. It is not only glocalisation and
warehouse in ordinary classical of type warehouse. But, it would be more mining of
Cryptocurrency which so called bitcoin mining approach. Where, all mining methods
applied on these activities. The point is to get approval scientific approach by using
management scheme for sustainability, responsibility, and ability to develop efficiency
energy in mining process by modest infrastructure.
It is difficult for mining in a single block alone. But, by increasing hash rate speed of
the network become expensive one, unless by making significant investment in hardware
system. A hash function takes a long path ways and procedures in specific mining. How-
ever, we can calculate for mining Bitcoin by using simple hash rate formula, as equation
in 3.23, “solo and pool mining”.
Hash functions are deterministic, that is, the same input will always produce the same
output, see Selgin (2014); Ron and Shamir (2014); Bouallagui (2010). “But they are
designed to be unpredictable, in the sense that if you want to find an input that hashes to
a specified output, the best possible way is to try many effort, many random inputs until
one of them works”, Bouallagui (2010). To mine Bitcoin, miners must find an input that
includes a list of all of the most recent transactions that need to be verified, and whose
hash is smaller than some specified value. (This value is adjusted periodically to change
the difficulty.)
Simple Hash rate Formula =(OwnHashRate )
(NetworkHashRate )(4.23)
Farell (2015), the crypto currency market has evolved erratically and at unprecedented

4.14. A NEW PERSPECTIVE OF ENERGY CONSUMPTION 167
speed over the course of its short lifespan. Since the release of the pioneer anarchic crypto
currency, Bitcoin, to the public in January 2009, more than 550 crypto currencies have
been developed, the majority with only a modicum of success. Research on this industry
is still scarce.
The majority of it is singularly focused on Bitcoin rather than a more diverse spread of
crypto currencies and is steadily being outpaced by fluid industry developments, including
new coins, technological progression, and increasing government regulation of the markets.
Through the fluidity of the industry does, admittedly, present a challenge to research, also
through evaluation of the crypto currency industry. This paper seeks to provide a concise
yet comprehensive analysis of the crypto currency industry with particular analysis of
Bitcoin, Bouallagui (2010), the first decentralized crypto currency. Particular attention
will be given to examine theoretical economic differences between existing coins, Dwyer
(2014), Selgin (2014), Ron and Shamir (2014). The real think from imagination of bitcoin
being a unit of inventory which called as a digital wallet (“as bitcoin address”). As well
as being an inventory for keeping location, storing, center of distribution by using truck
transport. The block chain application can use as the balance and transfer of inventory
across a distributed supply chain network, Gonzalez, 2015. The good point is how to
measure the energy used during mining operations. Research question followed by 1).
how does energy efficiency supported by infrastructure facilities of bitcoin mining? 2).
how we can get the profit from bitcoin transaction? and 3). what is learned lesson from
crypto currency?
Figure 4.26: The Emergence of Permissioned, Distributed Ledger Systems
Source: Swanson (2015)
The consensus of mechanism is the process in which majority within network validators
goes into agreement on the state of ledger. This is the rule and a set of procedure that
allowed us for maintaining between the facts and multiple participating nodes. It the true
one that the longest chain need proof of work which considered to be proper and valid
ledger. There were many consensus mechanisms that have been explored in past three
decades. All ideas and innovations from distributed database required tolerance, (Leslie

168 CHAPTER 4. RISK MANAGEMENT IN SUPPLY CHAIN ORGANIZATION
Lamport) and distributed economic consensus methods. Its needs formalization, analysis,
and valid implementation. The secure transactions within a crypto currency system is
a must regulation that have to provide by the system itself and can be corrected by the
system if there is a failure detected. a crypto currency system assumes that transactions
are transmitted in a peer-to-peer fashion. Traditionally one way to undermine a peer-to-
peer network is by creating large amounts of pseudonymous identities in order to gain
a disproportional amount of influenced. Bitcoin was purposefully designed to make it
expensive to attack the network in this manner. It establishes an ordering for transactions
through a “proof-of- work” process.
An on-chain transaction is one which users settle transactions on the public block
chain. The block chain as there were no external intermediaries or custodians available.
Over the past several years, transactions that occur off of the block chain, on the edges,
have become increasingly popular as it allows for faster clearing. Furthermore, exchanges
and many other services now exist to provide off-chain services and are managed by their
own internal accounting records (e.g. exchanges perform buy/sell operations off the chain
via their own private database).
Figure 4.27: Tokenize Everything
Source: Roy (2014)

4.14. A NEW PERSPECTIVE OF ENERGY CONSUMPTION 169
4.14.2 Methodology
Level 1 is the phase of all Bitcoin inspired technologies that will fail to be mainstream.
Level 2 is the step token agnosticism. Level 3 is the level for Cryptocurrency maximization.
Level 4 is the step that Bitcoin reached maximalism. Then, at the end level 5 is Hyper
bitcoinisation. Essentially, Roy (2014) said that we can “absorb everything”.
The figured visualizes the conviction towards “a crypto currency based tokenized econ-
omy”. Every business, institution and organization has different business needs. In order
to determine whether or not integrating a new network is beneficial, so that the total
costs of ownership must be declared without failed.
Roy (2014), there are newly distributed consensus systems have been proposed and a
few have been built out into proofs-of-concept with the backing of venture capital. For
avoiding the very high risk. Tokens are being built without the intention of making these
coins available for purchase to retail customers. Because the developers are not necessarily
to create another currency or commodity. Therefore, the future challenge is to develop a
right auditing agencies. Although, peer to peer concept and actions have been approved
well done.
Over all the definition of energy efficiency is efficiency energy=output/input. In mining
process there is a need to calculate “profit and loss”. The formula shows how to calculate
the income of Bitcoin mining:
IBM =(OHashratee )
(NHashrate )X(RoundReward+ TXRewards )
(600s )X(Income(BTC) )
(s )(4.24)
IBM= the income of Bitcoin mining
The OHashrate is the users own hash rate, Nhashrate is the entire Bitcoins network
hash rate. Almost calculation of Nhashrate normaly changes every two weeks, Ala-Peijari
(2014). The final objective is to calculate the users portion of the “hash calculation” where
the user adds to the entire network system. Basically, the level of likelihood of the user
receiving the reward. The network reward illustrated as “Round-reward” is the lottery
reward that the network rewards one miner or pool on average every 10 minutes i.e 600
seconds, Ala-Peijari (2014). The winning miner also receives transaction rewards marked
as TXRewards in the total transaction reward is dependent on the number of transactions,
and to what extent the users making the transactions paid the transaction reward. For
assessing actual profit is necessary take into account the electricity and hardware costs as
shown:
EH − Cost =(Profit )
(s )=
(Income )
(s )−
(ecost )
(s )−
(Hcost )
(s )(4.25)
EH-Cost= electricity and hardware costs

170 CHAPTER 4. RISK MANAGEMENT IN SUPPLY CHAIN ORGANIZATION
In reality it is very difficult to estimate value for bitcoin, but also the electricity price,
transaction rewards, equipment, and also maintenance costs. Electricity cost per second
is shown in equation as “ecost/s”. The more difficult one to calculate is device cost per
second shown as “Hcosts/s”. Finally, at this section, to access the actual profit, it is neces-
sary to see electricity and hardware costs, see more in Davarpanah and Kaufman (2015),
Lewis (2014), Terra (2014), O’Dwyer and Malone (2014). It shows that all computers
used for mining testing to know how much electricity level consumed during operations,
Ala-Peijari (2014).
4.14.3 Data Construction
The interesting point and valuable point here is to discuss the supply chain in the context
of global chain perspective. The Bitcoin mining will not work and stop the operation when
they faced of network difficulty. They couldn’t work properly without well-constructed
network system. It was so called, the new perspective of global supply chain system.
4.14.4 Result
The old type of CPU and simple infrastructure will gave impact on mining performance.
However, latest type of computer and high-tech of computer infrastructure will create
efficient mining. But the the modest infrastructure will give impact in energy efficiency
issues. The interesting point here was the open source software system more efficient
rather than under- windows system. It could be that open source system there is no
much sophisticated software and the simpler softwares shows less consumed energy. This
way created strong reason that we should work on open source system for future crypto
currency challenges.
4.14.5 Advantages
The perspective of a new way of supply chain in Bitcoin mining is a very challenging for
scientist even for managerial level. Due to many Bank analysts were trying to analyst
what’s going on for the way of crypto currency. Because, without a good awareness of
banking sector even All government stake holder. The advancement of crypto currency
cannot be stop by any financial authority. It was just like when the first financial operation
by credit card delivered since 1938s and became most well-known by 80s or 90s in many
countries. By double decades or triple decades all possibilities of crypto currency will be
a think possible one on the real business transaction.
4.14.6 Conclusion
It was cleared enough that Bitcoin mining system was efficient rather than ordinary the
world banking system (energy consumption for building, computer system, ...etc). So
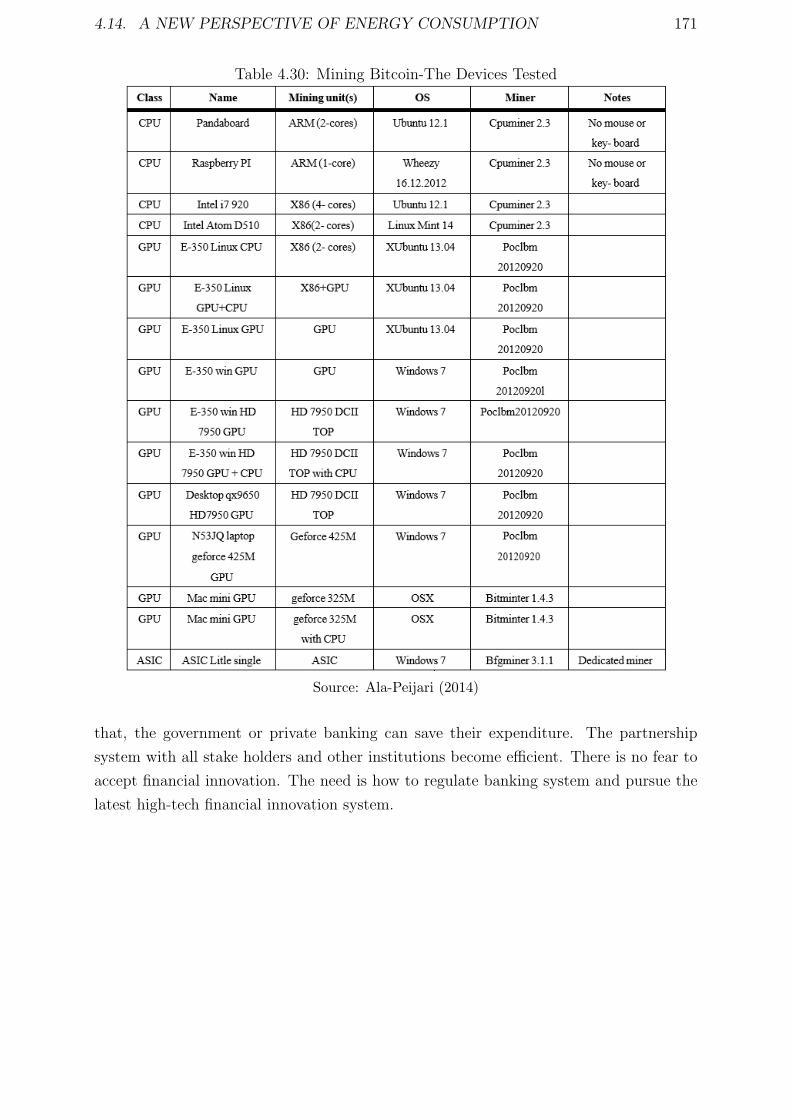
4.14. A NEW PERSPECTIVE OF ENERGY CONSUMPTION 171
Table 4.30: Mining Bitcoin-The Devices Tested
Source: Ala-Peijari (2014)
that, the government or private banking can save their expenditure. The partnership
system with all stake holders and other institutions become efficient. There is no fear to
accept financial innovation. The need is how to regulate banking system and pursue the
latest high-tech financial innovation system.

172 CHAPTER 4. RISK MANAGEMENT IN SUPPLY CHAIN ORGANIZATION
Table 4.31: Real Time of Block chain 1
Source: https://blockchain.info/ at 2/1/2016 10:59:54 PM
Table 4.32: Real Time of Block chain 2
Source: https://blockchain.info/ at 2/1/2016 11:00:54 PM

Chapter 5
The Impact of Institutional
Organization
Industrial energy use accounts for roughly one-third of global energy demand. While there
is significant potential to decrease energy consumption in this sector, opportunities to
improve energy efficiency are still under-exploited. Although energy efficiency measures
have frequently been demonstrated to contribute to the competitiveness of companies
and to raise their productivity, energy efficiency actions and improvements are still not
typically or widely viewed as a strategic investment in future profitability. A number of
barriers to industrial energy efficiency exist including limited access to technical know-
how and to capital, risk aversion and transaction costs. Source; 0ECD/IEA, 9 rue de la
Federation, 75739 Paris Cedex 15, France
5.1 The Role of Institutional on Supply Chain Orga-
nization
The success of the energy management Programme is clearly correlated with the provi-
sion of appropriate resources and supporting mechanisms, including assistance, capacity
building and training, and provision of tools and guidance during the implementation
stage. Initially, drivers including incentives play an important role in stimulating indus-
try to engage in energy management. In particular, small- and medium-sized enterprises
may require additional support and resources. As the Programme matures, Programme
managers can explore options to phase out support or transfer the responsibility for the
Programme to the private sector. Depending on the design of the Programme, the im-
plementation phase may also require training of auditors and ensuring an effective veri-
fication and certification of energy management systems, source; 0ECD/IEA, 9 rue de la
Federation, 75739 Paris Cedex 15, France
173

174 CHAPTER 5. THE IMPACT OF INSTITUTIONAL ORGANIZATION
5.1.1 Institutional Organization at Local and Global Level
A range of approaches have been developed to support Programme implementation. Men-
toring and technical expertise are provided through Agreements Support Managers. The
Support Managers conduct site visits, provide energy management advice, respond to
queries, and can also assist with data collection and administration of funding. Special
Investigations, which are a cornerstone of the EAP, take a step beyond routine assess-
ments. SEAI continually develops processes, methodologies, or sector-specific approaches
and projects to ensure continued effectiveness in uncovering new energy efficiency oppor-
tunities. Successful actions and approaches are then analyzed, standardized and dissemi-
nated to the wider network, namely the LIEN. The Special Investigations thus not only
identify opportunities in specific businesses but also contribute to wider knowledge cre-
ation and promote the replication of proven practices and successes (O’Sullivan, 2011a;
SEAI, 2010). In some cases, funding support for special investigations is provided (SEAI,
2009).
5.1.2 Conclusion
Voluntary agreements between governments and companies can provide the extra incentive
that makes enterprises start to realise energy efficiency potentials. Experiences show that
the three programmed have been effective at addressing numerous barriers to improved
industrial energy efficiency.
5.2 Conclusion
The programmes have different formats and support systems but have attained similar
results. The programmes have all succeeded because the local energy agencies have set up
supporting policy measures, i.e. a combination of measures such as tax relief, assistance to
join the programmes, grants, effective reporting systems and networking activities. One
of the key identified success factors is the creation of a culture with real interest from top
management, sufficient time allocated to work with the EnMSs, help from external con-
sultants, networking and the promotion of concrete results on a national level. The three
cases clearly show that the structured approach embedded in EnMSs enables enterprises
to successively work toward deeper energy service and process changes.

Part II
General Conclusion
175


177
It is really important to notify that risk management and various issues in corporate
social responsibility is big deal for the future of enterprise development. The thesis ex-
plained well about the impact of risk management, CSR and energy efficiency in supply
chain. This idea is based on the concept of energy efficiency that give pressured in global
energy supply chain. The writer advised that energy efficiency can be addressed by orga-
nization management, at the same time risk level and CSR. To show the evidence energy
efficiency can be derived by three dimension (Production, transportation, warehousing)
which answered for risk management, and CSR that covered supply chain. The aims of
the research work are to support energy supply chain more efficient in many ways. In the
first chapter shows: a) general risk management, more specific supply chain management,
b) the concept of CSR in organizations, C) The concept of energy efficiency that related
to strategic management. How to see the dimension of production, transportation, and
warehousing that can be seen from the scheme of energy efficiency. The mechanism of
energy efficiency is to promote: how to reduce pollution impact, and for extent is how
to follow the law. Discussing about energy efficiency that linked to responsibility level of
certain companies. Thus, risk level has to manage in the context of hyper competitive
era. Institutional organization can be formulating to handle problems may arise in hyper
competition. Also, the hyper competition as the one of trigger to attract related issues
mainly in the global supply chain. Then, how to make connection between hyper com-
petition and its impact on environmental issues. The firms, enterprises, and companies
have been trying to develop; constructing and developing between industrial development
with respect to the role of government. So that the CSR concept and its application
will be very powerful things to create energy efficiency. From the theoretical framework
is very important to note here up to managerial level that 1). Practically, the firms,
enterprises, and or companies tend to pay the tax rather than creating energy efficiency
which reflected to environmental impact. 2). In the spectrum of energy efficiency, the risk
management an CSR particularly in energy efficiency, must take an attention on the scope
of institutional development. Because, if there is no understanding about institutional
development will be very difficult for creating energy efficiency development in the global
context. The main points from this thesis is a lot of evidence from case to case. Based
on all parameters, analysis will be very interesting if denoted to improve the development
strategy. In chapter 4 shows the abundant of research activities which are real evident
in academic research activities. Despite this fact, all findings seem to emerge: 1) first,
the problem of pollution levels in transport that can be managed at the right level 2)
Second, it is difficult to have a global approach to energy efficiency in production. sector
because of the diversity of enterprise and each sector of activity seems to follow a strategy
in accordance with energy efficiency. The research work shows how to make assumptions
and calculate the energy efficiency in diverse sectors such as logistics; ex. in the oil in-
dustry, airlines, shipping, manufacturing production industries, sectoral and competitive
industries. Studying the maritime transport sector shows that the thesis highlights some
limitations for dissemination an analysis in terms of energy efficiency. The study of the

178
footwear industry raises tensions, such as company locations along value chain, between
access to energy and access to low labor costs. Also for example the study of the coffee
industry reveals how difficult it is to assess energy efficiency in this sector because it
is highly fragmented in different subsystems (coffee, green, organic coffee, etc. . . ) with
very different production modes, storage and transportation. Thesis shows that there is
a potentially to reduce the energy impact along the logistics chain. It should be pos-
sible to propose a generic modeling to understand the construction, and evaluation of
energy efficiency. Also by establishing political and institutional development, the pos-
sibility is to reduce the impact of energy consumption within the global logistics chain.
Finally, the general conclusion offers the managerial implications. In particular, sugges-
tions are made regarding the energy efficiency in global logistics chain. This concept is
approached in multidimensional ways, the economic, environmental, social and political,
and geopolitical dimensions. The goal is to propose and develop the models to optimize
energy consumption with efficient supply chain management, specifically, under the con-
straints of minimizing the environmental impact. The proxy chosen is to measure the
CO2 emission level. However, the level of CO2 compliance with CSR positioning and risk
management that influenced the quality of environment. The doctoral thesis highlights
the theoretical and managerial contributions that can be found in case studies. The initial
question of the thesis work involves the promotion of energy efficiency management from
the perspective of global logistics chain.
Regression analysis is a statistical technique for modeling and analysing multiple vari-
ables by exploring the relationship between one dependent and one or more independent
variables. This approach can be used to quantify the factors that influence energy use
and can be particularly useful in conjunction with other methods to establish causality.
Audits are is an inspections, surveys and analysis of energy flows. They can be in-
strumental in identifying energy efficiency opportunities but may fully capture systems
improvement potentials. Energy audits can range from cursory to in-depth and com-
prehensive. A walk-through energy audit is typically a quick and relatively inexpensive
approach that provides a qualitative examination of facilities to identify basic oppor-
tunities for savings as well as areas that need further examination. A detailed energy
audit, which requires more time and expertise, may cover equipment or processes for
which energy-savings opportunities were identified during a walk-through audit or where
a benchmarking process has identified savings potentials. Detailed audits can be carried
out at various levels, e.g. at the equipment, system, or process level. Energy performance
benchmarking is the comparative analysis of energy use per unit of physical production.
This analysis involves the calculation of energy intensity by different fuel types or activ-
ities, and comparison with intensities achieved in the sector via reference to appropriate
benchmarking guides. Similarly, energy best practices benchmarking involves comparing
processes, operations and systems to sectoral best-in-class operations.
The conclusion shows that all findings have significant results. Precisely, the manage-
ment strategy should be the key concept for long period to promote three dimension in

179
transportation, production, and warehouse. It has to refer on the concept of management
in energy efficiency.
Utilizing straight forward point analyzed for all cases studies shown that the point
of global supply chain must be established by strong chain for each business activities.
Furthermore, energy efficiency also push us for greening management strategy. Back to all
dimensions in this works: I delivered some conclusion that with current issues of greening
effort which matched to Mathers (2015):
• by setting up the performance goals for improving the quality of environment via
management approach.
• by tracking logistics emission should as a reference for a standard practice. Also,
improving the the tracking performance by various indicators and methodology.
• by seeking and building the external factor so called a leadership practice.
Discussing in energy issues, particularly on energy efficiency which creating efficiency
output level must be coherence and high linkages from backward and forward linkages.
Especially for global market and global product should be traced. Focusing on energy
used for each business activities is useful one. Therefore, all products assured by using
energy intensity and global supply chain properly.
By optimizing energy source in proper way, it would be give minor impact on environ-
mental. This is the main idea for increasing industrial intensity with small environmental
impact. So that, using CSR’s matrix will contribute the knowledge capacity to the global
business and global community.
However, from the management side shows that the management strategy is a role
play for promoting energy efficiency in scale and geographical areas. By establishing and
constructing a strong logistics and well-connected global supply chain will enhance global
supply chain performance.
Mathematical approach and statistical approaches shown technicals on energy effi-
ciency calculation. The innovation of this research is the discussion through corporate
social responsibility and energy efficiency. It seemed that enterprises or small, medium
even large size of company for future competition, as D’aveni (1995). It should be able to
handle energy efficiency. Moreover, energy efficiency as one of tool to know company is
efficient or not. Finally, the energy efficiency in global supply chain shows that efficiency
energy in global level could be perform by any type of product, mainly on energy matter.
By focusing on how to transport them, the way of production system, and how to build
warehouse system to keep source of energy become more efficient to serve inter-links of
chain and end users.
In general, the three dimension of this research shows that transportation field, pro-
duction field, ware- house field need all stake to holder to evaluate for each step of energy
use and any part of business activities to measure energy intensity. Mapping inter coun-
tries relationship to promote global energy link, (acceleration of energy global supply

180
chain) analyzing the impact of “energy trilemma” which included energy security, energy
equity: environmental sustainability on the new era of global supply chain. See, also;
Bocca and Hanna (2014). The energy sustainability index ranks countries which likely
be able to provide sustainable energy policies through the three dimensions of the energy
trilemma:
• energy security: the effective management of primary energy supply from domes-
tic and external sources, the reliability of energy infrastructure, and the ability of
participating energy companies to meet current and future demand.
• energy equity: the accessibility and affordability of energy supply across the popu-
lation.
• environmental sustainability: the achievement of supply and demand-side energy
deficiencies and the development of energy supply from renewable and other low-
carbon sources.
It shows that the point of global supply chain must be established as a strong chain
for each industrial phase or business activities phase. To create efficiency output must be
coherence and high linkages from backward and forward linkages. Especially, for global
market and global product should be traced,easily by focusing on energy used or energy
resources that use for each business activities. By optimizing energy source in proper way,
it would be give minor impact on environmental aspect. Koppl (2010), rational expecta-
tions models create model closure by stipulating that the representative agent acts as if it
had access to the theorist’s model. Such rationality does not seem to view the difference
between the model and the world as potentially problematic. Computational complexity
refers to the difficulty or impossibility of making a calculation or deciding a well-posed
mathematical question. Axtell (2005), reports that Walrasian auctioneer faces a compu-
tational problem that is hard in a precise mathematical sense: there are no polynomial
time algorithms for the general case with nonlinear utility functions (p. 196)., Moreover,
Axtell (2005), explains, polynomial time algorithms. Finally, by applying complex system
methodology and one of them so called CSR’s matrix simulation shows; Each of stake-
holder will contribute their knowledge capacity to the global business competitiveness.
The lesson learned from this dissertation: To fulfill a critical gap in the current state of
art in research work. Statistical analysis to calculate the eCO2 mix by using data base
on real time. Formulating and creating the new global supply chain by source of energy
alternative.

5.3. INSTITUTIONAL ORGANIZATION ON SUPPLY CHAIN MANAGEMENT 181
5.3 Institutional Organization on Supply Chain Man-
agement
Difficulties
Based on Flyvbjerg (2006), there are five misunderstandings or oversimplifications for the
nature of such research:
• general theoretical (context-independent) knowledge is more valuable than concrete,
practical (context-dependent) knowledge.
• the case study is most useful for generating hypotheses; that is, in the first stage
of a total research process, while other methods are more suitable for hypotheses
testing and theory building.
• the case study contains a bias toward verification, that is, a tendency to confirm
the researchers preconceived notions.
base on similarity findings on this research work as follows;
• transportation cases in global supply chain is applicable task to build up simula-
tion, based on many options; technological level, type of product, and management
trading system.
• production cases in global supply chain is applicable task to build up simulation,
based on many options; technological level, type of product, and management poli-
cies.
• warehouse cases in global supply chain is not easy task to build up global simu-
lation, However, we can create a new global supply chain based on many options;
technological level, type of product, and innovation of management.
5.4 Contribution for Management Science
5.4.1 Value Added
The research work can be distinguished as follows (Contribution for Management Science):
• input output matrix model as a model to create A New Global Supply Chain Per-
spective.
• all methods applied is useful to develop energy efficiency in global supply chain.
• Monte Carlo simulation is a bridge for the new era of global supply chain method-
ology, particularly in real time simulation for all business products (ex; electricity
transmission).

182
• optimizing the production system by robust estimation.
• building the new approach for industrial development: ex; the nuclear power plant
to open up the real global supply chain management. Ex; by local power of resource
management and all availabilities in global product supply chain availabilities.
• the next research work possibilities: the new mechanism how to put energy efficiency
labeling for each manufactured product. Its means; Each product should have
energy efficiency labeling product (the product has been manufactured by energy
efficiency management system within enterprise)
Leach et al. (2000); be able to reach some agreement on the range of issues to build up
their understanding of the nature of science. The methodological issue of how we exploring
the nature of science. The science might reasonably be regarded as an essential component
of an understanding of science. By an assumption that the human has knowledge and
understanding to the nature of science.
5.4.2 All Highlight of Research Findings
To response all problems by using management science approach;
1. to pursuit the high performance; a global downstream program aimed at imple-
menting targeted, sustainable improvements in supply chain optimization processes,
technology, information and organizational abilities.
2. achieving higher value from enterprise wide data by managing data quality and
creating robust analytical capabilities.
3. how to implement the global supply chain optimization program via solid perfor-
mance through prior collaborations.
4. the capability of company in supply chain efficiency, supply chain visibility and
integrated data warehousing as well as collaborative reports, to deliver value and
innovation across business areas.
5. emphasizing on innovation, extensive industry experience and insight, data man-
agement, business intelligence knowledge, robust implementation methodology and
organizational capabilities.
All research worked done can be distinguished as follows:
1. input output approach in global supply chain,
2. AHP,
3. Monte Carlo simulation,
4. all methods for example using software packaged installed (LEAP),
5. method of calculation CO2 ,
6. global supply chain in real time calculation and real simulation,

5.5. RESEARCH WORK ACHIEVEMENT 183
7. the new era of supply chain in real time simulation,
8. optimizing the production system by robust estimation,
9. industrial development: nuclear plant to open up the real of global supply chain. By
local power of resource management and all availabilities of global product availabilities.
5.4.3 The Global Theoretical Contribution
All Mapping to Scientific Contribution from Research Works:
1. to fulfill a critical gap in the current state of the art in research and business,
2. the contribution of the dissertation on CO2 mix is how to calculate the CO2 mix
by using statistical analysis to analysis the data in real time,
3. ECO2 clouds of ecological concerns; energy efficiency or CO2 footprint,
4. formulating and creating the new global supply chain by source of energy alterna-
tive.
Connecting the Three Dimension of Global Supply Chain by Research Case
Studies
• nuclear power plant development,
• international trading on electric transmission,
• energy production by energy alternative (LEAP approach),
• energy labeling for all manufactured products,
• labeling for distance level from origin to end users.
5.5 Research Work Achievement
• input output matrix model as a model to create a new global supply chain perspec-
tive.
• analytical hierarchy process is useful to develop energy efficiency in global supply
chain via managerial decision.
• Monte Carlo simulation is a tool for the new era of global supply chain methodology,
particularly in real time simulation (ex;electricity transmission).
• optimizing the production system by robust estimation.
• building the new approach for industrial development: ex; the nuclear power plant
to open up the real global supply chain management. Ex; by local power of resource
management and all availabilities in global product supply chain availabilities.

184
• the next research work possibilities: the new mechanism how to put energy efficiency
labeling for each manufactured product. Its means; each product should have energy
efficiency labeling product (the product has been manufactured by energy efficiency
management system within enterprise).
5.5.1 Transportation Optimization
Based on hypothesis that improving industrial development will give impact on environ-
mental impact on pollution level (CO2). By developing supply chain strategy faced on
complexity problems and challenges for enhancing business development at global level.
What does “global” actually means?. There are many descriptions on this terminology.
However, the concept of globalization is a shift from the simply refer to the concept
of a product related to the whole supply chain coordination. To get better understanding
into these descriptions, should be back to the sociological roots of globalization theory. A
lot of the sociological aspects of global business can be traced back to Perlmutter (1969)
stated that the evolution of the multinational corporation.
The geocentric is a worldwide approach in both headquarters and subsidiaries. The
firms subsidiaries are neither satellites nor independent city states, but part of a whole
whose focus is on worldwide objectives as well as local objectives. The point here is each
part contributing to make a unique contribution also by unique competence.
Geo centrism is expressed by function, product, and geography. Dickens, (1998) distin-
guished between the internationalization, which is a (quantitative) geographic extension
of existing economic activities, and globalization, which is a functional integration (qual-
itative) of economic activities. Providing where the transport from their country origin
to the country which consuming on it, constitutes at international level.
They utilized six categories (management teams, strategy, operations and products,
technology and R&D, financing and marketing), each of which consists of multiple di-
mensions. Also, Bartlett and Ghoshal (1989) defined multiple dimensions to identify a
firms position on the multinational to complex global chain. Kanter and Dretlet (1998)
attempted to define what global really means. Their approach is to identify six aspects:
• global is synonymous with international.
• global strategy means doing the same thing everywhere.
• globalizing means “becoming stateless, with no ties” to home country.
• globalizing requires “abandoning images and values” of home country.
• globalizing involves acquisitions without integration.
• a firm must engage in sales or operations in a foreign country to be considered
global.

5.5. RESEARCH WORK ACHIEVEMENT 185
The cost of transportation will be recovered by the total value of sales. The viscosity
and non-viscosity products are important parts in this business. One is to distinguish
which transportation type is the best suitable. Mainly, for the high level of viscosity of a
product, the delivery is scheduled in the morning rather than in the afternoon. All reasons
is to avoid the traffic congestion and to meet the legislation of delivering procedure. Just
in time method was applied in these industries by maximum effort. All is based on client
demand, precisely. The main problem is to take into account when loading and unloading
products. If the loading and unloading last more than 30 minutes in each activities, then
the companies will be take in charge more for transportation cost based on the agreement
and the logistics contract. Of course there is free time for two hours for loading and
unloading products by using tank car tank.
5.5.2 Production Optimization
Briefly summarizing from the production optimization approach: I concluded based on all
research work achievement. I used production function and Simulation. However, there
are a lot of methodological approaches for this topic. On production optimization topics
is easier to distinguish the energy consumption on the site.
The interesting question is can we measure the existence of energy efficiency when the
product has been finalized or as a final product. The answers is not so simple one. We
must calculate fuel consumption when delivering the product to consumer. Therefore,
there will be much interesting one when the research output can be identified from the
first manufacturing process, middle process, up to final process the in hand of customer.
As stated in the part of introduction and conclusion this dissertation, the input output
analysis is the appropriate model to describe local/regional and global supply chain energy
efficiency. Moreover, the measurement of input output impact or aggregation will be
notified in exact number. Both based on the real data and aggregation method. More
reference see more Chapman (2006).
5.5.3 Warehouse Optimization
Briefly summarizing from the warehouse optimization approach: I concluded that input
output analysis and Monte Carlo theory have been explored as useful methods. Because,
various methodologies will be possible to enrich the scientific work. The point is we can
create the initial global supply chain energy efficiency on nuclear power plant construction.
5.5.4 Theoretical Contribution for Scientific Development
• the supporting system in energy efficiency choice.
• energy efficiency; effectiveness of energy used in various purposes. Moreover, con-
necting to global supply chain requires a lot of criteria. There is no doubt that
energy is the main role for supporting business activities.

186
• the scarcity of energy source as one of obstacles to develop global supply chain
business (emerging economies and market).
• high skill of management science knowledge; how to manage and to decide which
energy efficiency method and energy employed for appropriate business activities.
5.5.5 Strengthen to Theoretical Aspects
Theoretical approaches used in this dissertation:
1. input output model analysis.
2. Monte Carlo theory.
3. production function.
4. robust estimation.
5. scheduling theory.
Theoretical Challenges: in Energy Efficiency in Global Supply Chain
1. Bayesian approach.
2. Markov chain model.
3. combinations of Markov chain Monte Carlo and applied Bayesian statistics.
4. scheduling theory versus Bayesian probability approach.
Future Theoretical Possibilities: in Energy Efficiency in Global Supply Chain
1. modeling combination system.
2. applied labeled Markov processes (ALMP) on logistics sustainability.
3. efficiency computing algorithm system.
5.6 The Impact of Institutional Organization
Industrial energy use accounts for roughly one-third of global energy demand. While there
is significant potential to decrease energy consumption in this sector, opportunities to
improve energy efficiency are still under-exploited. Although energy efficiency measures
have frequently been demonstrated to contribute to the competitiveness of companies
and to raise their productivity, energy efficiency actions and improvements are still not
typically or widely viewed as a strategic investment in future profitability. A number of
barriers to industrial energy efficiency exist including limited access to technical know-
how and to capital, risk aversion and transaction costs. Source; 0ECD/IEA, 9 rue de la
Federation, 75739 Paris Cedex 15, France
5.6.1 The Role of Institutional on Supply Chain Organization
The success of the energy management Programme is clearly correlated with the provi-
sion of appropriate resources and supporting mechanisms, including assistance, capacity

5.7. MANAGERIAL CONTRIBUTION 187
building and training, and provision of tools and guidance during the implementation
stage. Initially, drivers including incentives play an important role in stimulating indus-
try to engage in energy management. In particular, small- and medium-sized enterprises
may require additional support and resources. As the Programme matures, Programme
managers can explore options to phase out support or transfer the responsibility for the
Programme to the private sector. Depending on the design of the Programme, the im-
plementation phase may also require training of auditors and ensuring an effective veri-
fication and certification of energy management systems, source; 0ECD/IEA, 9 rue de la
Federation, 75739 Paris Cedex 15, France
5.6.2 Institutional Organization at Local and Global Level
A range of approaches have been developed to support Programme implementation. Men-
toring and technical expertise are provided through Agreements Support Managers. The
Support Managers conduct site visits, provide energy management advice, respond to
queries, and can also assist with data collection and administration of funding. Special
Investigations, which are a cornerstone of the EAP, take a step beyond routine assess-
ments. SEAI continually develops processes, methodologies, or sector-specific approaches
and projects to ensure continued effectiveness in uncovering new energy efficiency oppor-
tunities. Successful actions and approaches are then analyzed, standardized and dissemi-
nated to the wider network, namely the LIEN. The Special Investigations thus not only
identify opportunities in specific businesses but also contribute to wider knowledge cre-
ation and promote the replication of proven practices and successes (O’Sullivan, 2011a;
SEAI, 2010). In some cases, funding support for special investigations is provided (SEAI,
2009).
5.6.3 Conclusion
Voluntary agreements between governments and companies can provide the extra incentive
that makes enterprises start to realise energy efficiency potentials. Experiences show that
the three programmed have been effective at addressing numerous barriers to improved
industrial energy efficiency.
5.7 Managerial Contribution
The nuclear power plant global supply chain, the plant is established by local supply chain
(low to medium technology) to global supply chain (high technology and high quality
product required). In fact, the construction of nuclear power plant is not only discussed
product supply chain but also how to supply high skilled person for the final phase of
nuclear plant construction. For the first decade will absorbed a lot of worker for road
construction and other infrastructure equipment to support nuclear plant construction.
Because, the nuclear power plant construction needs a decade to be ready for utilization

188
and final utilization for producing electricity output. Therefore, the global partnership
between MNCs and local companies must be constructed.
Technical approaches and managerial applied, the most powerful research work shown
here, by utilizing optimization (matrix approach), statistical approaches and the art of
management science how to manage relationship between all existing stake holders. All
dimensions in transportation, production and warehouse optimization need skilled full of
management approaches.
The relationship and or any form of competition need high attention of all stake
holders to get an optimal output. The real time demand driven supply chain management,
especially by information technology, see correlated, see Paris et al. (2015).
The information architecture spanned technology, software applications, data, pro-
cesses and metrics. It was designed to provide a window into the supply chain by meeting
two objectives: enabling the integration of data from various parts of the business and
providing supply chain visibility metrics. To ensure the true competition, a pan-European
market required that electricity can be exchanged across-borders. Fortunately, the current
market rules ensure that the electricity can be transported on the highest grid level at the
same price independent of the distance. This principle best supports the development of
a competitive electricity market.
Supply security Europe’s energy dependency is high and is likely increase time to time.
EU owned oil and gas reserves are steadily decreasing, and the continents overall energy
demand continues to grow. Currently, 50% of all European energy supply comes from
outside Europe. Politically, Europe is becoming vulnerable to foreign energy suppliers,
thus undermining its economic independence. Making matters worse, a significant amount
of Europe’s money will be transferred annually to countries outside Europe, reducing
Europe’s trade balance. By reducing energy consumption and electricity demand.
Europe can support its goals of reducing its energy dependency. Improving energy
efficiency will play a fundamental role in this process, while also helping the European
electricity market to become even more competitive.
5.8 Conclusion
The programmes have different formats and support systems but have attained similar
results. The programmes have all succeeded because the local energy agencies have set up
supporting policy measures, i.e. a combination of measures such as tax relief, assistance to
join the programmes, grants, effective reporting systems and networking activities. One
of the key identified success factors is the creation of a culture with real interest from top
management, sufficient time allocated to work with the EnMSs, help from external con-
sultants, networking and the promotion of concrete results on a national level. The three
cases clearly show that the structured approach embedded in EnMSs enables enterprises
to successively work toward deeper energy service and process changes.

Bibliography
[1] Abrahamsson, M., Aldin, N., and Stahre, F., (2003), Logistics Platforms
for Improved Strategic Flexibility, International Journal of Logistics: Research and
Applications,6(3), 85-106.
[2] Acemoglu, D., Carvalho, V.M., Ozdaglar A., and Salehi-Tahbaz, A.,
(2012), The Network Origins of Aggregate Fluctuations, Econometrica,(80), 1977-
2016.
[3] Adaramola, M., (2015), Solar Energy Application, Economics, and Public Percep-
tion, CRC Press, Taylor and Francis Group,(80).
[4] Adeli, H., and Karim, A., (2001), Solar Energy Application, Economics, and
Public Perception, CRC Press, Taylor and Francis Group,(80).
[5] Ademe, (2001), Energy Efficiency Trends in the Transport Sector in the EU, CRC
Press, Taylor and Francis Group,(80).
[6] Afgan, NM., and Carvalho, M.d.G., (2001), Sustainable Assessment Method
for Energy Systems: Indicators Making Procedure, Springer, Science+Business Media,
LLC.
[7] Agora, F., (2001), The Bitcoin Bible: The Safest and Easiest Ways to Buy, Sell,
Store, and Speculate, Laissez Faire Club, Leave the World Alone. It Manages Itself.
[8] Akhter, S., (2003), Strategic Planning, Hyper Competition, and Knowledge Man-
agement.
[9] Ala-Peijari, O., (2015), Bitcoin The Virtual Currency: Energy Efficient Mining of
Bitcoins, Aalto University School of Science, Degree Programme in Computer Science
and Engineering,(80).
[10] Albino, V., and Izzo, C., and Kuhtz S., (2015), Input-Output Models for
the Analysis of a Local / Global Supply Chain, International journal of Production
Economics, p.119-131.
[11] Aleman, P.P., and Sandilands, M., (2015), Building Value at the Top and
Bottom of the Global Supply Chain: MNC-NGO Partnerships and Sustainability, Cal-
ifornia Management Review, Vol.51, No.1,p.24-49.
189

190 BIBLIOGRAPHY
[12] Alexander, J. McNeil., Rudiger, Frey., and Paul Embrechts., (2015),
Quantitative Risk Management: Concepts, Techniques and Tools, Princeton University
Press, Vol.51, No.1,p.24-49.
[13] Altomonte, C, F., Di Mauro, G., Ottaviano, A., R., and Vicard,V.,
(2015), Global Value Chains during the Great Trade Collapse: A Bullwhip Effect?,
European Central Bank Working paper Series, Vol.1412.
[14] Altomonte, C., Aquilante, T., Bekes G,. and Ottaviano, G.I.P., (2015),
Internationalization and Innovation of Firms: Evidence and Policy, Economic Policy,
Vol.28, p.412-416.
[15] Aminata, J., (2015), Business Competition on Indonesian Coffee product: How to
enter European Market?, FMPM, Vol. Vol XXVI No 01, January-February, P.59-65
[16] Aminata, J., Grandval, S., and Sbihi, A., (2014), Energy Efficiency in Produc-
tion System: A Case of Coffee Industry through Global Supply Chain., Humanitarian
Technology: Science, Systems and Global Impact, in Boston, MA, USA. 13-15 May.
[17] Aminata, J., Grandval, S., and Sbihi, A., (2014), Energy Efficiency in Produc-
tion System: A Case of Coffee Industry through Global Supply Chain., Humanitarian
Technology: Science, Systems and Global Impact, in Boston, MA, USA. 13-15 May.
[18] Aminata, J., Grandval, S., and Sbihi, A., (2014), Airlines Industries within
Global Supply Chains and its Strategic on Energy Efficiency, Humanitarian Technol-
ogy: Science, Systems and Global Impact, in Boston, MA, USA. 13-15 May.
[19] Aminata, J., Grandval, S., and Sbihi, A., (2014), Energy Efficiency in Pro-
duction Process: A Case of Footwear Trade Development, Humanitarian Technology:
Science, Systems and Global Impact, in Boston, MA, USA. 13-15 May.
[20] Aminata, J., Grandval, S., and Sbihi, A., (2014), Warehouse Electric Trans-
mission: On Energy Efficiency Strategy in Global Supply Chain, A Case of Nuclear
Power Plants and Its extension, International Conference: INHA University, Korea
and University of Le Havre. G08, Le Havre, France.
[21] Aminata, J., Grandval, S., and Sbihi, A., (2014), Warehouse Electric Trans-
mission: On Energy Efficiency Strategy in Global Supply Chain, A Case of Nuclear
Power Plants and Its extension, International Conference: INHA University, Korea
and University of Le Havre. G08, Le Havre, France.
[22] Aminata, J., Grandval, S., and Sbihi, A., (2014), Energy Development: In
Long Range Energy Alternative Planning System, Humanitarian Technology: Science,
Systems and Global Impact, in Boston, MA, USA. 13-15 May.
[23] Aminata, J., Grandval, S., and Sbihi, A., (2014), Energy Efficiency on Pro-
duction System within Global Supply Chain, 10th, A2ID, France.

BIBLIOGRAPHY 191
[24] Aminata, J., Grandval, S., and Sbihi, A., (2014), Energy Efficiency on Pro-
duction System within Global Supply Chain, 10th, A2ID, France.
[25] Aminata, J., Grandval, S., and Sbihi, A., (2014), Oleo-Chemical Industries:
Transportation in Global Supply Chain, , ICPSCM-International Conference Rome,
Italy, 7-9 November.
[26] Aminata, J., Sugiyama, E., Kartikawati H., Saito, H., Miyajima, T.,
Roosiana, and Watanabe, T., (2002), Situation Analysis of Small and Medium
Enterprises in Laguna, Philippine, GSID, Nagoya University.
[27] Anas, T., and Aswicahyono, H., and Tobing, S., (2002), Port Efficiencies
in Indonesia: Lesson Learned from Selected Ports, the USAID-project.
[28] Anderson, V., (1993), Energy Efficiency Policies, Routledge 29 West 35th Street,
New York, NY 10001.
[29] Antras, P., and Chor D., and Fally, T., and Hillberry R., (1993), Mea-
suring the Upstreamness of Production and Trade Flows, American Economic Review,
New York,Vol.102, p.412-416.
[30] Archer, S.C, (2010), The Efficiency Theory, American Economic Review, New
York,Vol.102, p.412-416.
[31] Arvanitis, A., and Gregory, J., (2001), Credit: The Complete Guide to Pric-
ing, Hedging and Risk Management, Haymarket House 28-29, London SW1Y 4RX.
[32] Aswathanarayana, U., and Divi, R.S., (2009), Energy Portfolios, Taylor and
Francis Group, LLC.
[33] Axtell, R., (2005), The Complexity of Exchange, Economic Journal, Vol.115,
p.193–210.
[34] Baan, C., and Dipo, A., and Wignall, D., and Takola, D., and Fahmi-
asari, H., and Hinssen, V., and Sandee, H., and Meeuws, R., (2015), State
of Logistics Indonesia.
[35] Badot, O., (2011), Perspectives Culturelles de la consommation, Presses Univer-
sitaires de Caen, Vol.1, ISBN. 978-2-84133-399-8.
[36] Baldwin, R.E., and Kimura, F., (2012), Measuring the Upstreamness of Pro-
duction and Trade Flows, American Economic Review, Vol.102, p.412-416.
[37] Baldwin, R.E., and Lopez-Gonzales, J., (2013), Supply-Chain Trade: A
Portrait of Global Patterns and Several Testable Hypotheses, NBER Working paper,
Vol.18957.

192 BIBLIOGRAPHY
[38] Barnhart, C., and Laporte,G., et al., (2007), Handbook in OR and MS,
NBER Working paper, Vol. 14, doi:10.1016/S0927-0507(06)14001-3.
[39] Barreto, H., and Howland, F.M., (2006), Introductory Econometrics Using
Monte Carlo Simulation with Microsoft Excel, Cambridge University Press The Edin-
burgh Building, Cambridge cb2 2ru, UK.
[40] Beer, J., (2000), Potential for Industrial Energy Efficiency Improvement in the
Long Term, Cambridge University Press The Edinburgh Building, Cambridge cb2
2ru, UK.
[41] Bentley, J., (2000), Programming Pearls, Ed. 2nd, Addison-Wesley, Boston, MA,
USA.
[42] Bergh, J., (2002), Handbook of Environmental and Resources Economics, Ed. 2nd,
Edward Elgar.
[43] Berglund, J., and et al., (2011), Energy Efficiency Analysis for A Casting
Production System, Proceedings: Winter Simulation Conference.
[44] Bergmann, M., (2011), An Introduction to Many-Valued and Fuzzy Logic: Se-
mantics, Algebras, and Derivation Systems, Cambridge University Press.
[45] Bertoldi, P., Boza-Kiss, B., and Rezessy, S., (2011), Latest Development of
Energy Service Companies Across Europe - A European, ESCO, Scientific and Tech-
nical Report, ISBN 978-92-79-06965-9.
[46] Bertrand, J. W.M, and Fransoo, J.C., (2002), Modeling and Simulation:
Operations Management Research Methodologies Using Quantitative Modeling, Vol.
22 No. 2, p. 241-264.
[47] Beverly, Chin., (2001), How to Write a Great Research Paper, Vol.1.
[48] Bironneau, L., Le Roy, B., Hovelaque, V., and Durand, B., (2015), Com-
petences des Responsables Logistiques : Resultats d’une Etude Longitudinale, Ed. 1.
[49] Bocca, R., and Hanna, A., (2014), The Global Energy Architecture Performance
Index Report, World Economic Forum.
[50] Bodansky D., (2014), Nuclear Energy Principles, Practices, and Prospects,
Springer-Verlag New York.
[51] Bodansky D., (2014), The Indonesian Economy in the Nineteenth and Twentieth
Centuries: A History of Missed Opportunities, ANU.
[52] Bornstein, C-T., (2014), Warehouse Location in Developing Country: Prob-
lems in Formulating the Problem, European Journal of Operational Research, Vol.
49, p.222-229.

BIBLIOGRAPHY 193
[53] Bouallagui, S., (2010), Techniques d’Optimisation Deterministe et Stochastique
pour la Resolution de Problemes difficiles en Cryptologie, Mathematics. Insa de Rouen,
France.
[54] Braun, M.R., and Altan, H., and Beck, S.B.M., (2010), Using Regression
Analysis to predict the Future Energy Consumption of a Supermarket in the UK, Ap-
plied Energy, Vol. 130, p.305-313.
[55] BSR, (2010), Energy Management Handbook.
[56] Bubenzer, A., and Luther, J., (2010), Photovoltaics Guide for Decision-
Makers: Technological Status and Potential in Energy Economy, Springer, Sci-
ence+Business Media.
[57] Bueno Merino, P., and Grandval, S., (2012), Partnerships between SMEs and
MNEs on Foreign Industrial Markets: A Strategy to Reduce the Liability of Foreign-
ness, International Business Research, http://dx.doi.org/10.5539/ibr.v5n6p53, Vol. 5,
No.6.
[58] Bullard, C.W., and Penner, P.S., and Pilati, D.A., (1978), Net Energy
Analysis: Handbook for Combining Process and Input-Output Analysis, Resources and
Energy, Vol 1,p. 267-313.
[59] Burger, M., and Graeber, B., and Schindlmayr, G., (2014), Managing
Energy Risk: A Practical Guide for Risk Management in Power,Gas and Other Energy
Markets, John Wiley and Sons Inc.
[60] Capehart, B.L., and Kennedy, W.J., and Turner W.C., (2007), Guide to
Energy Management, The Fairmont Press, Inc.
[61] Caputo, R., (2009), Hitting the Wall A Vision of a Secure Energy Future.
[62] Carapetis, S.H., and Beenhakker., and Howe, J., (1984), The Supply and
Quality of Rural Transport Services in Developing Countries., World Bank Staff Work-
ing Paper 654.
[63] Carley, S., and Lawrence, S., (2014), Energy-Based Economic Development:
How Clean Energy Can Drive Development and Stimulate Economic Growth.
[64] Carnemark, C., (1979), Social and Technical Aspects of Rural Roads, Transporta-
tion Department, Work Bank, Dhaka 10-23 January.
[65] Carrera, J.A., (2010), On the Dynamic Role of Relative Prices along the Growth
Process.
[66] Carriero., et al., (2009), Forecasting Large Datasets with Bayesian Reduced
Rank Multivariate Models.

194 BIBLIOGRAPHY
[67] Chapman, S.N., (2009), The Fundamentals of Production Planning and Control,
Pearson Education Limited.
[68] Chen, J., (2005), The Physical Foundation of Economics: An Analytical Theory,
Pearson Education Limited, World Scientific Publishing Co. Pte. Ltd. 5 Toh Tuck
Link, Singapore, 596224.
[69] Chiang, A-C., (1984), Fundamental Methods of Mathematical Economics, Pearson
Education Limited, McGraw-Hill.
[70] Chipot, Ch., and Pohorille, A., (2007), Free Energy Calculations, Theory and
Applications in Chemistry and Biology, Springer-Verlag Berlin Heidelberg.
[71] Choi, S., and Haas, C.. and Sawochka, S., and Marks C., (2008), PWR
Secondary Chemistry Benchmarking, International Conference on Water Chemistry of
Nuclear Reactor systems, Berlin, Germany.
[72] Clay, D.E, and Shanahan, J.F., (2008), GIS Applications in Agriculture, Nu-
trient Management for Energy Efficiency, Vol.2, CRC Press Taylor and Francis Group
6000 Broken Sound Parkway NW, Suite 300 Boca Raton, FL 33487-2742.
[73] Codaret, I., (2004), Econometrie Appliquee, De boeck Universite.
[74] Law Code, (2004), Recommended Inter National Code of Practice for The Storage
and Transport of Edible fats And Oil Sin bulk, National Code.
[75] Cohen, S., Roussel, J., Bouvier, A., and Daron, B.A., (2005), Avantage
supply chain : les 5 leviers pour Faire de Votre Supply Chain un Atout Competitif,
ISBN: 2-7081-3346-2.
[76] Columbia, River Crossing Project, (2006), Feasibility of Diverting Truck
Freight to Rail in the Columbia River Corridor, Columbia River Crossing Project.
[77] European Commission, (2013), The Impact of EU Consumption on Deforesta-
tion: Comprehensive Analysis of the Impact of EU Consumption on Deforestation,
ISBN 978-92-79-28926-2.
[78] Conkling, R.L., (2011), Energy Pricing: Economics and Principles, Springer,
Verlag Berlin Heidelberg.
[79] Pablo, C.M., Vicente, I., (2011), Essays on Transport Economics, Springer,
Verlag Berlin Heidelberg.
[80] Cooper, D.F., Grey, S., Raymond, G., and Walker, P., (2005), Project Risk
Management Guide: Managing Risk in Large Projects and Complex Procurements
[81] Cooper, W.W., and Seiford, L.M., (2011), Handbook on Data Envelopment
Analysis, Springer Science+Business Media, LLC.

BIBLIOGRAPHY 195
[82] Corden, W.M, (1984), Booming Sector and Dutch Disease Economics; Survey
and Consolidation, Oxford Economics papers.
[83] Coriou, H., and Grall, L., and Le Gall, and Vettier., (1984), Corrosion
Fissurante sous Contrainte de la Inconel dans l’eau a Haute Temperature” (Stress
Corrosion Cracking of Inconel in high temperature water, Colloque de Metallurgie sur
la Corrosion, CEN Saclay (France) et North Holland Publishing Amsterdam.
[84] Cormen, T-H., Leiserson, C-E., Rivest, R-L., and Stein, C., (2001), In-
troduction to Algorithms, The MIT Press, Ed. 2nd.
[85] Creightley, C.D., (1993), Transport and Economic Performance: A Survey of
Economic Performance, p8. 28 Ibid, p10., World Bank, Washington.
[86] Crouhy, M., Galai, D., and Mark, R., (2005), Reading for the Financial Risk
Manager, John Wiley and Sons Inc.
[87] Crouhy, M., Galai, D., and Mark, R., (2009), Global Perspectives on Corpo-
rate Governance and CSR, Ashgate Publishing Company.
[88] Crowther, D., and Aras, G., (2008), Corporate Social Responsibility.
[89] Cruz, J., (2008), Ocean Wave Energy: Current Status and Future Prepectives,
Springer,Science+Business Media, LLC.
[90] D’aveni, R.A., (2008), Coping with Hyper Competition: Utilizing the new 7S’s
framework, Academy of Management Executive, 9, pp. 45-57.
[91] Dagpunar, J.S., (2007), Simulation and Monte Carlo with applications in Finance
and MCMC, John Wiley and Sons Ltd, The Atrium, Southern Gate, Chichester, West
Sussex PO19 8SQ, England.
[92] Dallas, M., (2006), Value and Risk Management: A guide to Best Practice.
[93] Dallas, M., (1994), A Dictionary of Econometrics, Edward Elgar Publishing Lim-
ited, UK.
[94] Dauxois, J., Hassenforder, C., (2004), Toutes les Probabilites et les Statistique
Cours et Exercices Corrigees, Ellipses Edition Marketing, S.A, ISBN 2-7298-2163-5.
[95] Davarpanah, K., and Kaufman, D., Pubellier, O., (2004), NeuCoin: the
First Secure, Cost-Efficient and Decentralized Cryptocurrency, arXiv:1503.07768v1
[cs.CR].
[96] Dentico, J., (1999), Games Leaders Play: Using Process Simulations To Develop
Collaborative, Leadership Practices for A Knowledge-based Society, Career Develop-
ment International Bradford: 1999. 4(3), 175. Retrieved October 4, 2004, from ABI:
Inform Database.

196 BIBLIOGRAPHY
[97] Depoues, V., Leseur, A., Bordier, C., and Foucherot, C., (2015), Les
Territoires en Route Pour la COP 21, COP 21 CMP 11.
[98] Dey, A., LaGuardia, P., and Srinivasan, M., (2011), Building Sustainabil-
ity in Logistics Operations: A Research Agenda, Management Research Review, Vol.
34(11), p. 1237-1259.
[99] Dietzenbacher, E., Lenzen M., Los, B., Guanc, D., Lahrd, M.L., San-
choe, F., Suh S., and Yang, C., (2013), Input-Output Analysis: The next 25
years, Economics, Vol. 25, No.4, p. 369-389.
[100] Dietzenbacher, E., Los, B., Stehrer, R., Timmer, MP., and Vries, G,
(2013), The Construction of World Input-Output Tables in the WIOD Project, Eco-
nomics Systems Research, Vol. 25, No.1, p.71-98.
[101] Dietzenbacher, E., and Tukker, A., (2013), Global Multi Regional Input-
Output Framework: An Introduction and Outlook, Economics Systems Research, Vol.
25, No.1, p.1-19.
[102] Distribution-Casino., (2011), Hypermarches – Supermarches - Superettes Resti-
tution pour la publication du bilan d’emissions de GES, Distribution Casino France 1
esplanade de France 42000 St Etienne.
[103] Dobrovolska, I., Arkhypenko, A., and Nordmann F., (2011), Morpholine
Secondary Water Chemistry in Ukrainian and French Units, International Confer-
ence on Nuclear water Chemistry in Reactor Systems, Distribution Casino France 1
esplanade de France 42000 St Etienne.
[104] Dul, J., and Hak, T., (2011), Case Study Methodology in Business Research,
Elsevier Ltd.
[105] Dwyer, G.P., (2014), The Economics of Bitcoin and Similar Private Digital
Currencies, http://dx.doi.org/10.1016/j.jfs.2014.11.006, Journal of Financial Stability.
[106] Eason, C., (1999), The Art of The Pendulum, Red Wheel/Weiser, LLC York
Beach, ME.
[107] Edwards, D.W., (2010), Energy Trading and Investing: Trading, Risk Manage-
ment, and Structuring Deals in The Energy Markets, McGraw-Hill.
[108] Eerkens, .W., (2010), The Nuclear Imperative: A Critical Look at the Approach-
ing Energy Crisis (More Physics for Presidents, Springer, Science+Business Media,
LLC.
[109] Eggink, J., (2007), Managing Energy Costs : A Behavioral and Non-Technical
Approach, The Fairmont Press, Inc.

BIBLIOGRAPHY 197
[110] Ehrgott, (2010, Multiple Criteria Decision Making for Sustainable Energy and
Transportation Systems, OECD/IEA.
[111] El Amraoui, A., and Manier, M.-A., and El Moudni, A., and Benrejeb,
M., (2010), Genetic Algorithm for a Cyclic Hoist Scheduling Problem with Time-
Window Constraints and Heterogeneous Part Jobs, 18th Mediterranean Conference
on Control and Automation Congress Marrakech, Morocco, June 23-25.
[112] El Amraoui, A., and Manier. M.A., and , El Moudni, A., and Benrejeb,
M., (2010), 9th International Conference on Sciences and Techniques of Automatic
control and computer engineering, A Comprehensive Linear Program to Solve Cyclic
Hoist Scheduling Problem.
[113] El Amraoui, A., and Mesghouni, K., (2014), Train Scheduling Networks
under Time Duration Uncertainty, The 19th World Congress, The International Fed-
eration of Automatic Control Cape Town, South Africa. August 24-29, 2014.
[114] Eliasson, B., and Lee, Y.Y., (2003), Integrated Assessment of Sustainable
Energy Systems in China, The China Energy Technology Programs: A Framework
for Decision Support in the Electric Sector Shandong Province, Springer - Science ,
Business Media, B.V.
[115] Enggink, J., (2007), Managing Energy Costs: A Behavioral and Non-Technical
Approach, The Fairmont Press, Inc.
[116] Enrico, Z., (2013), The Monte Carlo Simulation Method for System Reliability
and Risk Analysis,Springer-Verlag London
[117] Ernest, G., and Gudmundsson, M., (2008), Commodities, Energy, and Fi-
nance, Springer-Verlag London, SUERF.
[118] Ethridge, D., (2008), Research Methodology in Applied Economics, Blackwell
Publishing.
[119] European Commission., (2011), Services on Monitoring Retailers’ REAP Com-
mitments, Consortium ESWI Expert Team to Support Waste Implementation.
[120] Eydelande, A., and Wolyniec, K., (2003), Energy and Power Risk Manage-
ment, John Wiley and Sons, Inc.
[121] Farahani, Z.R., and Asgari, N. and Davarzani, H., (2009), Supply Chain
and Logistics in National, International and Governmental Environment Concepts and
Models, John Wiley and Sons, Inc.
[122] Farell, R., (2015), An Analysis of the Cryptocurrency Industry, Wharton Re-
search Scholars Journal.

198 BIBLIOGRAPHY
[123] Feenstra , R., (2010), Off-shoring in the Global Economy: Microeconomic Struc-
ture and Macroeconomic Implications, MIT Press.
[124] Feenstra, R.C. and Hanson, G., (2010), Global Production Sharing and and
Rising Inequality: A Survey of Trade and Wages, in Kwan Choi and James Harrigan
(eds), Handbook of International Trade, Basil, Blackwell.
[125] Fenton-OCreevy, M., and Nicholson, N., and Soane, E., and Willman,
P., (2005), Traders:Risks, Decisions, and Management in Financial Markets, Oxford
University Press.
[126] Ficko, M., and Klancnik, S., and Brezovnik, S., and Balic, J., and
Brezocnik, M., and Lerher, T., (2012), Intelligent Optimization Methods for
Industrial Storage Systems, Springer-Verlag London.
[127] Fishman, G.S., (1996), Monte Carlo - Concepts, Algoritms, and Applications,
Springer-Verlag London.
[128] Fleisher, P., (2002), Matter and Energy: Principles of Matter and Thermody-
namics, Springer-Verlag London.
[129] Fliszar., (2009), Atomic Charges, Bond Properties, and Molecular Energies, John
Wiley and Sons Inc
[130] Flyvbjerg, B., (2006), Five Misunderstandings About Case-study research, Qual-
itative Inquiry,vol. 12, no. 2, p. 219-245.
[131] Franke, B.D., Carrier, M., Kaiser, M., Schreurs, M., Weber, C., and
Ziesemer, T., (2015), Improving energy Decision, Towards Better Scientific Policy
Advice for A safe and Secure Energy System.
[132] Garriga, E., and Mele, D., (2004), Corporate Social Responsibility Theories:
Mapping the Territory, Journal of Business Ethics 53: 51–71, 2004.
[133] Gamow, G., and Critchfield, C.L., (1949), Theory of Atomic Nucleaus and
Nuclear Energy- Sources.
[134] Gardett, P., (2012), Four Things That Are Different About Electricity Infras-
tructure, url=https://breakingenergy.com/2012/05/10/four-things-that-are-different-
about-electricity-infrastructure,
[135] Garp, P.J., (2009), Financial Risk Manager Handbook, John Wiley and Sons Inc.
[136] Geman, H., (2008), Risk Management in Commodity Markets: From Shipping to
Agricultural and Energy, John Wiley and Sons Inc.
[137] Gentle, J.E., (2003), Random Number Generation and Monte Carlo Methods,
Springer Science Business Media, Inc.

BIBLIOGRAPHY 199
[138] Gereffi, G., and Lee, J., (2012), Why The World Suddenly Cares about Global
Supply Chains, Journal of Supply Chain Management.
[139] Gilks, W.R., Richardson, S., and Spiegelhalter, D.J., (1996), Markov
Chain Monte Calo in Practice, JChapman and Hall, CRC.
[140] Gokce, H.U., and Gokce, K., U., (2013), Holistic System Architecture for
Energy Efficient Building Operation, Sustainable Cities and Society, Vol.6, p.77-84.
[141] Gold, S., and Hahn, R., and Seuring, S., (2012), Sustainable Supply Chain
Management in ”Base of the Pyramid” Food Projects, A Path to Triple Bottom Line
Approaches for Multinationals?, International Business Review.
[142] Grandval, S. et all., (2012), Le Renouveau du Business Model par l’ecosysteme
d’affaires:le Cas d’un Reseau Mondial de Distribution en Milieu B to B, Economies et
Societes, Vol. 45, n. 4, p. 679.
[143] Grandval, S,, (2011), Economies et Societal: Serie, l’economie de l’entreprise,
ismea LES PRESSES, Series 4.
[144] Grandval, S. et all., (2011), Management and Avenir, Maintien et Renouvelle-
ment de l’Avantage Concurrentiel: Approches Analytiques et Nouvelles Configurations
Organisationnelles, ismea LES No. 8/2009, n.28, p. 14-17.
[145] Grandval, S., and Soparnot, R., (2008), Integrer le developpement Durable
dans le Business Model de l’entreprise, dans chapitre le Developpement Durable: The-
ories et Applications au Management, p. 123-137.
[146] Grandval, S., and Soparnot, R., (2005), Le Developpement Durable Comme
Strategie de Rupture: Une Approche par la Chaine de Valeur Inter Sectorielle, Revue
Management et Avenir, Vol. 3 No. 5 p. 7-26.
[147] Graziani, M., and Fornasiero, P., (2007), Renewable Resources And Renew-
able Energy: A Global Challenge, CRC Press Taylor and Francis Group.
[148] Gregory, N. Stock., and Noel, P. Greis., and John D. Kasarda.,
(2008), Enterprise Logistics and Supply Chain Structure: The Role of Fit, Journal of
Operations Management.
[149] Griffin, J., (1996), Models for energy policy: Methodological advances in energy
modelling:1970–90, Routledge11 New Fetter Lane, London EC4P 4EE.
[150] Gu, C., and Leveneur, S., and Estel, L., and Yassine, A., (2013), Model-
ing and Optimization of Material/Energy Flow Exchanges in an Eco-Industrial Park,
Energy Procedia.
[151] Guizot, A., (2007), Chinese Energy Markets, Trading and Risk Management of
Commodities and Renewables, Palgrave Macmillan.

200 BIBLIOGRAPHY
[152] Gujarati, D., (2007), Essentials of Econometrics, Irwin McGraw-Hill.
[153] Hal, H., (1997), Indonesia’s Industrial Transformation, ISEAS.
[154] Hal, H., (1996), Foreign Investment and Industrialization in Indonesia, The In-
donesian Economy Since 1966, ANU.
[155] Halldorsson, A., and Kovacs., (2010), The Sustainable Agenda and Energy
Efficiency: Logistics Solutions and Supply Chains in Times of Climate Change, Inter-
national Journal of Physical Distribution and Logistics Management, Vol. 40(1/2), p.
5-13.
[156] Halldorsson, A., and Svanberg, M., (2013), Energy Resources: Trajectories
for Supply Chain Management, Supply Chain Management: An International Journal,
Vol. 18(1),p. 66-73.
[157] Handfield, R., (2013), Trends and Strategies in Logistics and Supply Chain Man-
agement: An Interview with Robert Handfield,
[158] Hanjalic, K.,Van de Krol, R., and Lekic, A., (2008), Sustainable Energy
Technologies: Options and Prospects, Springer.
[159] Hauswirth, D.B., Hoffman, D.M., Kane, J.F., Ozobu, I.L. ,Carol L.T.,
and Wong , P.W., (2004), Collaborative Leadership in Mega Project Manage-
ment Collaborative Leadership: Success Stories in Transportation Mega Projects, A
”Lessons Learned” Approach to Collaborative Leadership in Mega Project Manage-
ment, Springer.
[160] Habisch2005 Habisch, A.? Jonker, J., Wegner, M., and Schmidpeter, R.,
, (2005), Corporate Social Responsibility Across Europe
[161] Heij, C., Boer, P., Franses, P.H., Kloek, T., and Dijk, H.K., (2004),
Econometric Methods with Applications in Business and Economics, Oxford University
Press.
[162] Heij, C., Boer, P., Franses, P.H., Kloek, T., and Dijk, H.K., (1993),
Energy Efficiency, Challenges opportunity for Electric Utilities.
[163] Herring, H., (1996), Is Energy Efficiency Good for the Environment? Some
Conflicts and Confusions, In: MacKerron G, Pearson P, editors. The UK Energy
Experience:A Model or A Warning. , Imperial College Press, p. 327-338.
[164] Hillier, M.S., and Hillier, F.S., Editor:Sarker, R., And Mohamma-
dian, M., And Yao, X., (1996), Conventional Optimization Techniques in Evo-
lutionary Optimization, Kluwer Academic Publishers New York, Boston, Dordrecht,
London, Moscow.

BIBLIOGRAPHY 201
[165] Hobbs, B.F, and Meier, P., (2000), Energy Decision and The Environment :
A Guide to the use of Multicretria Methods, Springer, Science+Business Media, LLC.
[166] Holland, F., (2013), Intervention a l’occasion de la signature de l’accord in-
dustriel entre Airbus et Lion Air, url=http://www.elysee.fr/videos/interviention-a-l-
rsquo-occasion-de-la-signature-de-l-039-accord-industriel-entre-airbus-et-lion-air,
[167] Horace, H., (2006), A Critical View, Energy, Energy, Vol.31, p.10-20.
[168] Hordeski, M.F., (2004), Dictionary of Energy Efficiency Technologies, The Fair-
mont Press.
[169] Hovelaque, V., and Bironneau, L., (2004), The Carbon-Constrained EOQ
Model With Carbon Emission Dependent Demand, International Journal of Production
Economics, Elsevier, Vol. 20.
[170] Hovelaque, V., and Thiel, D., and Vo, T.L.H., (2010), Impact of Inventory
Inaccuracy on Service-level Quality of A Multiproduct Production Line With Product
Priorities,8th International Conference of Modeling and Simulation - MOSIM’10 -
May 10-12, 2010 - Hammamet - Tunisia ”Evaluation and optimization of innovative
production systems of goods and services”.
[171] Howard, B., (2004), Writing a Dissertation is a Public Issue as well as a Private
Trouble, url=http://act.hypotheses.org/3675,
[172] Hu, A.H., and Hsu, C.W., (2010), Empirical Study in the Critical Factors of
Green Supply Chain Management (GSCM) Practice in the Taiwanese Electrical and
Electronics Industries, Management Research Review, Vol. 33 No. 6, p. 586-608.
[173] Hulsmann, M., and Grapp, J., and Li, y., (2010), Strategic Adaptivity in
Global Supply Chains: Competitive Advantage By Autonomous Cooperation.
[174] Insukindro, (1990), The Short and the Long Term of Determinants of Money
and Bank in Indonesia, University of Essex, UK.
[175] Jonker, J., and Pennink, B., 2010), The Essence of Research Methodology: A
Concise Guide for Master and PhD Students in Management Science, Springer-Verlag
Berlin Heidelberg.
[176] Jonker, J., and Pennink, B., 2010), Energy Efficient Thermal Management of
Data Centers, Springer-Verlag Berlin Heidelberg.
[177] Kaiser, V., and Hurstel, X., Editor: SIRCHIS, J., (1988), Energy Effi-
ciency Industry-The Optimized Process Control of an Ethylene Plant, ECSC, EEC,
EAEC, Brussels and Luxembourg.

202 BIBLIOGRAPHY
[178] Kaku, M.,, (1988), The Future of the Mind : The Scientific Quest to Understand,
Enhance, and Empower the Mind, A division of Random House, LLC, New York, and
in Canada by Random House of Canada Limited, Toronto, Penguin Random House
companies.
[179] Kalenoja, H., and Kallionpaa E., and Rantalaa J., (2010), Indicators of
Energy Efficiency of Supply Chains, International Journal of Logistics : Research and
Applications, Vol. 14. No. 2, p.77-95
[180] Kalenojaa, H., and Kallionpaa E., and Rantalaa J., (2011), Indicators
of Energy Efficiency of Supply Chains, International Journal of Logistics Research
and Applications: A Leading Journal of Supply Chain Management, Vol. 14, Issue
2,p. 77-95.
[181] Kalogirou, S., (2009), Solar Energy Engineering: Process and Systems, Elsevier
B.V.
[182] Kalos, M.H., and Whitlock, P.A., (1996), Monte Carlo Methods, John Wiley
and Sons Inc.
[183] Kaltschmitt., and Streiche, W., and Wiese, A., (2007), Renewable En-
ergy:Technology , Economics and Environment, Springer-Verlag Berlin Heidelberg.
[184] Karlheinz, H., (2000), Fats and oils as Oleo-chemical Raw Materials, Pure Appl.
Chem, IUPAC, Vol. 72, No. 7, P.1255–1264.
[185] Kehr,, K.W., and Prasad, M.A., (2000), Monte Carlo: Basics, Pure Appl.
Chem, IUPAC, Vol. 72, No. 7, P.1255–1264.
[186] Keith, S., Editor; Fagerberg, J., and Mowery, D.D, and Nelson, R.R.,
(2004), The Oxford Handbook of Innovation, Oxford.
[187] Kennedy, C., (2009), Methodology for Inventory in Greenhouse Gas Emissions
from Global Cities, Oxford.
[188] Kevin, C., and John, W. Polak., (2009), A Bayesian Approach to Modelling
Uncertainty in Transport Infrastructure Project Forecasts, AET 2009.
[189] Keys, T., Malnight, T.W., and Graaf, K.D., (2009), Making the Most of
Corporate Social Responsibility, McKinsey and Company.
[190] Kihlen, T., (2009), Logistics-Based Competition - A Business Model Approach,
Logistics Management, Department of Management and Engineering (IEI), Linkoping
University, SE-581 83 Linkoping, Dissertations from the International Graduate School
of Management and Industrial Engineering, IMIE, No. 111, Doctoral Dissertation.

BIBLIOGRAPHY 203
[191] Killeen, J. C., and Nordmann, F., and Schunk, J.. and Vonkova, K.,
(2010), Optimisation of Water Chemistry to Ensure Reliable Water Reactor Fuel
Performance at High Burnup and in Ageing Plant: An International Atomic Energy
Agency Coordinated Research Project., McKinsey and Company, Nuclear Plant Chem-
istry Conference, NPC.
[192] Koppl, R., (2010), Some Epistemological Implications of Economic Complexity,
Journal of Economic Behavior and Organization, Vol. 76, p. 859–872.
[193] Kotzab, H., and Suring, S., and Muler, M., and Reiner, G., (2005), Re-
search Methodologies in Supply Chain Management, Physica-Verlag A Springer Com-
pany.
[194] Kovacevic, R.M, and Pflug, G.ch., and Vespuci, M.T., (2013), Handbook
of Risk Management in Energy Production and Trading, Springer ,-Science+Business
Media, LLC.
[195] Kreith, F., and Goswami, YD., (2013), Handbook of Energy Efficiency and
Renewable Energy,Taylor and Francis Group, LLC.
[196] Kunreuther, H., and Linnenrooth, J., (1983), Risk Analysis and Decision
Process : The Siting of Liquefied Energy Gas Facilities in Four Countries, Springer
[197] Kursunoglu, B.N, and Mintz, S.L., and Perlmutter, A., (1983), Eco-
nomics and Politics of Energy.
[198] Laird, F.N., (2004), Solar Energy, Technology Policy, and Institutional Values.
[199] Lan , C.Y., and Unhelkar, B., (2006), Global Integrated supply chain System,
University of Western Sydney, Australia
[200] Larsen, M.M., and Manning, S., and Pedersen, T., (2006), Uncovering The
Hidden Costs of Off-shoring: The Interplay of Complexity, Organizational Design, and
Experience, Strategic Management Journal, Vol.34, p.34533–552.
[201] Leach, J., and Millar, R., and Ryder, J., and Sere, M-G, (2006), Epis-
temological Understanding in Science Learning: The Consistency of Representations
Across Contexts, Learning and Instruction, Elsevier Science Ltd, Vol. 10, p.497–527.
[202] Leontief, W., (2006), Input Output Economics, Oxford University Press, Inc.,
200 Madison Avenue, New York, New York.
[203] Lewis, A., (2006), A Gentle Introduction To Digital Tokens, Brave New Coin.
[204] Lin, X, and Polenske, K.R., (1998), Input-Output Modeling of Production
Processes for Business Management, Structural Change and Economic Dynamics, Vol.
9, p.203-226.

204 BIBLIOGRAPHY
[205] Liu, F., and Meyer, A.S., and Hogan, J.F., (2010), Mainstreaming Building
Energy Efficiency Codes in Developing Countries,Global Experiences and Lessons from
Early Adopters, The International Bank for Reconstruction and Development, The
World Bank, 1818 H Street NW, Washington DC 20433.
[206] Liu X., (2010), China’s Experience of Financing in Energy Efficiency, Energy and
Environmental Development Research Center (EED).
[207] Loehr, J., and Schwartz, T., (2003), The Power of Full Engagement: Man-
aging Energy, Not Time, Is the key to High Performance and Personal Renewal, The
Free Press.
[208] London, K., (2008), Construction Supply Chain Economics.
[209] Mack , I., (2008), Energy Trading and Risk Management: A Practical Approach
to Hedging, Trading, and Portfolio Diversification, John Wiley and Sons Inc.
[210] Magidson, J., (1981), Social Sciences Research, John Wiley and Sons Inc.
[211] Magnus, J.R., and Neudecker, H., (1981), Matrix Differential Calculus with
Applications in Statistics and Econometrics, John Wiley and Sons Inc, Baffins Lane,
Chichester, West Sussex PO19 1UD, England.
[212] Malinvaud, E., (1981), Statistical Methods of Econometrics.
[213] Mallon, K., (2006), Renewable Energy Policy and Politics A Handbook for
Decision-Making, Earthscan, 8–12 Camden High Street London, NW1 0JH, UK .
[214] Mannino, M., and Hong, S.N., and Choi, I.J., (2008), Efficiency Evaluation
of Data Warehouse Operations, Decision Support Systems, Vol. 44, p.883-898.
[215] Mannino, M., and Hong, S.N., and Choi, I.J., (2011), Warehousing in the
Global Supply Chain Advanced Models, Tools and Applications for Storage Systems.
[216] Marchi, V.D., and Maria, E.D., and Ponte, S., (2013), The Greening of
Global Value Chains: Insights from the Furniture Industry, Competition and Change,
Vol. 17 No. 4, p. 299–318.
[217] Mark M., and Aquilano, D., and Nicholas J., and Richard B-C., (2013),
Fundamentals of Operations Management, Operations and decision sciences, Boston,
Irwin, Mc Graw Hill, 3rd ed, ISBN 0-256-22557-5.
[218] Martin, C., (2011), Logistics and Supply Chain Management: Creating Value-
Adding Networks, Fourth Edition, Pearson Education Limited.
[219] Mathers, J., (2011), Walmart, General Mills and Anheuser-Busch Make Green-
ing Freight a Priority, Environmental Defense Fund,

BIBLIOGRAPHY 205
[220] Mathers, J., (2015), Walmart, General Mills and Anheuser-Busch Make Green-
ing Freight a Priority, Environmental Defense Fund,
[221] Mathew , S., (2006), Wind Energy Fundamentals, Resource Analysis and Eco-
nomics, Environmental Defense Fund,
[222] McClellan, M., (2000), Collaborative Manufacturing: Using Real-Time Infor-
mation to Support the Supply Chain.
[223] McKinnon, A.C., and Ge, Y., (2000), Use of A Synchronized Vehicle Audit
to determine Opportunities for Improving Transport Efficiency in A Supply Chain,
International Journal of Logistics Research and Applications: A Leading Journal of
Supply Chain Management, 7, Issue 3, p. 219-238.
[224] McClellan, M., (2010), Intelligent Information Systems and Knowledge Man-
agement for Energy: Applications for Decision Support, Usage, and Environmental
Protection, IGI Global.
[225] Meyers, R.A., Walters, A.D., and Laskowski, J.S., (2001), Encyclopedia
of Physical Science and Technology: Coal Preparation.
[226] Midttun, A., (1997), European Electricity Systems in Transition, A Comparative
Analysis of Policy and Regulation in Western Europe, Elsevier, UK.
[227] Miller, R.E., and Blair, P.D., (2009), Input Output Analysis: Foundation
and Extensions, Cambridge University Press, New York.
[228] Molak, V., (1997), Fundamentals of Risk Analysis and Risk Management, CRC
Press, Inc. Lewis Publishers is an imprint of CRC Press.
[229] Molak, V., (2011), Collaborative Modeling and Decision-making For Complex
Energy Systems, World Scientific Publishing Co. Pte. Ltd. 5 Toh Tuck Link, Singapore
596224.
[230] Mouton, J, and Marais, HC., (1996), Basic Concepts in The Methodology
of The Social Sciences, HSRC Publishers 134 Pretorius Street 0001 Pretoria South
Africa.
[231] Muller, I., (2007), A History of Thermodynamics The Doctrine of Energy and
Entropy,Springer-Verlag Berlin Heidelberg.
[232] Mun, J., (2011), Managing Enterprise Risk:Real Options and Monte Carlo Simu-
lation versus Traditional DCF Valuation in Layman’s Terms, Elsevier Global Energy
Policies and Economics Series, p.81.
[233] Neal, R.M., (1993), Probabilistic Inference Using Markov Chain Monte Carlo
Methods, Department of Computer Science, University of Toronto.

206 BIBLIOGRAPHY
[234] Nemoto, T., and Visser, J., and Yoshimoto, R., (2001), Impacts of Infor-
mation and Communication Technology on Urban Logistics System, OECD/ECMT
Joint Seminar.
[235] Nemoto, T., and Visser, J., and Yoshimoto, R., (2010), The Transparent
Supply Chain.
[236] Nieboer, N., and Gruis, and V., and van Ha, and A, and Tsenkov,
A., (2011), Energy Efficiency in Housing Management–Conclusions from an Inter-
national Study, Enhr Conference 2011 – 5-8 July, Toulouse.
[237] Nordmann, F., and Odar, S, and Venz, H., and Kysela, J., and Ruehle,
W., and Riess R., (2010), ANT International Chemistry Update and best Practices,
Nuclear Plant Chemistry Conference, NPC.
[238] O’Dwyer, Karl J., and Malone, D., (2010), Bitcoin Mining and its Energy
Footprint, ISSC 2014/CIICT.
[239] O’Hara, J., (2003), Energy of Knots and Conformal Geometry, World Scientific
Publishing Co. Pte. Ltd. 5 Toh Tuck Link, Singapore, 596224.
[240] U.S. Government Printing Office, (1993), U.S. Congress, Office of Tech-
nology Assessment, Industrial Energy Efficiency, Washington, DC: U.S. Government
Printing Office.
[241] Papantonopoulos, L., (2007), The Invisible Universe: Dark Matter and Dark
Energy,Springer, Berlin Heidelberg.
[242] Paris, A., Arbaoui, S., Cislo, N., El-Amraoui, A., and Ramdani,
N., (2015), Using Hidden Semi-Markov Model for Learning Behavior in Smart
phones,IEEE International Conference on Automation Science and Engineering
(CASE), Gothenburg, Sweden.
[243] Pascual, C, and Elkind, J., (2010), Energy Security Economics, Politics,
Strategies, And Implications, brookings institution press Washington, D.C.
[244] Perlmutter, H.V., (1969), The Tortuous Evolution of Multinational Enter-
prises. Columbia Journal of World Business,Journal of World Business, Vol. 1, p.9-18.
[245] Pilavachi, A., (1993), Energy Efficiency In Process Technology,Elsevier Science
Publishers Ltd.
[246] Pilipovic, D., (1993), Energy Risk:Valuing and Managing Energy Derivatives.
[247] Pirsch, J., and Gupta, S., and Landreth G.S., (2006), A Framework for
Understanding Corporate Social Responsibility Programs as a Continuum: An Ex-
ploratory Study Julie Pirsch, Shruti Gupta, Stacy Landreth Grau, Journal of Business
Ethics.

BIBLIOGRAPHY 207
[248] Polimeni, M.J., and Mayumi, K. and Giampietro, M., and Alcott, B.,
(2008), The Jevons Paradox and the Myth of Resource Efficiency Improvements,
Earthscan, 8–12 Camden High Street London, NW1 0JH, UK.
[249] Pope, L., (2010), Efficacite Energetique des Magasins: Enjeux, Realisations et
Perpective, Marche de L’electricite, Loi Pope De 2005, loi de Programme Fixant les
Orientations de la Politique Energetique, Loi Nome De 2010, Nouvelle Organisation
Du Marche de L’electricite, Lois Grenelle 1 Et 2 Du 3 Aout 2009 et Du 12 Juillet 2010.
[250] Popper, S.W., Berrebi, C., Griffin,J.,Light T., Endy, Y.M., and Crane,
MK., (2008), Natural Gas and Israel’s Energy Future Near-Term Decisions from a
Strategic Perspective, RAND Corporation.
[251] Poulsen, R.T., and Johnson, H., (2016), The Logic of Business VS The Logic
of Energy Management Practice: Understanding The Choices and Effects of Energy
Consumption Monitoring Systems in Shipping Companies, Journal of Cleaner Produc-
tion, Vol. 112, p. 3785-3797.
[252] Raynolds, L.T., (2004), Forging New Consumer/ Producer Links in Fair Trade
Coffee Networks, Journal of Cleaner Production, Vol. 112, p. 3785-3797.
[253] Ridley, D., (2012), The Literature Review A Step-by-Step Guide for Students.
[254] Rizet, C., (2008), Bilan Energies Et Co2 Des Chaınes Logistiques : L’exemple
des Produits Frais et L’habillement, Notes de Synthese du SESP N.168.
[255] Rizet, C., and Browne, M., and Leonardi, J., and Allen, J., (2008),
Supply Chains, Energy Efficiency and Greenhouse Gas Emissions: A Comparison of
Apple Supply Chains In France, UK and Belgium, LDF.
[256] Rizet, C., and Keita, B., (2005), Chaınes Logistiques et Consommation
D’energie : Cas du Yaourt et du Jean, Institute National de Recherche sur les Trans-
ports et Leur Securite (INRETS).
[257] Ron, D., and Shamir, A., (2014), Quantitative Analysis of the Full Bitcoin
Transaction Graph,Working paper, Department of Computer Science and Applied
Mathematics, The Weizmann Institute of Science, Israel.
[258] Rosenau, J.N., (2014), Complexity, Global Politics, and National Security, Na-
tional Defense University Washington, D.C., p.38.
[259] Roy, M., (2014), An architecture for the Internet of Money and Beyond Bitcoin,
Vol. 27.
[260] RTE, (2013), RTE R and D Roadmap Implementation Plan 2013-2016, RTE,
France.

208 BIBLIOGRAPHY
[261] Rushton, A., and Walker, S., (2007), International Logistics and Supply
Chain Outsourcing From Local to Global, Kogan Page Limited.
[262] Saaty, T.L., (2007), Decision Making for Leaders; The Analytical Hierarchy Pro-
cess for Decisions, in a Complex World, Pittsburgh: RWS Publications, translated to
French, Indonesian, Spanish, Korean, Arabic, Persian, and Thai.
[263] Salvatore, D., (1989), Schaum’s Outline of Theory and Problems of Managerial
Economics, McGraw-Hill.
[264] Salvatore, D., Ed; Dietzenbacher, E., and Lahr, M.L., (2004), Wassily
Leontief and Input-Output Economics, Cambridge University Press.
[265] Sandberg, E., and Abrahamsson, M., (2011), Logistics Capabilities for Sus-
tainable Competitive Advantage, International Journal of Logistics, (14), 1, 61-75.
[266] SAS,. Inc., (2011), Monte Carlo Studies: A Guide for Quantitative Researchers,
SAS Institute Inc., Cary, NC, USA.
[267] Save Project, T.E., (2012), Energy Efficiency in the Supply Chain through
Collaboration, Advanced Decision Support and Automatic Sensing, SAS Institute Inc.,
Cary, NC, USA.
[268] Sbihi, A., and Eglese, R.W., (2010), Combinatorial Optimization and Green
Logistics, SAnnals of Operations Research, Vol.175, No. 1, p. 159–175.
[269] Sbihi, A. and W.Eglese, Richard., (2007), The Relationship Between Vehicle
Routing and Scheduling and Green Logistics - A Literature Survey, Working Paper, p.
27., Lancaster University.
[270] Schaefer, H., Ed; Sirchis, J., (2007), Energy Efficiency in Industry, Elsevier
Science Publishing Co., Inc. 52 Vanderbilt Avenue, New York, NY 10017, USA, Ch.
1, p. 13-14.
[271] Selgin, G., (2014), Synthetic Commodity Money, Journal of Financial Stability,
url=http://dx.doi.org/10.1016/j.jfs.2014.07.002.
[272] Serletis, A., (2007), Quantitative and Empirical Analysis of Energy Markets,
World Scientific Publishing Co. Pte. Ltd., USA.
[273] Shah, M.A., and Bhat, M.A., and Paulo Davim, J., (2015), Nanotechnology
Applications for Improvements in Energy Efficiency and Environmental Management.
[274] Shay, J.P., and Rothaermel, F.T., (1999), Dynamic Competitive Strategy:
Towards a Multi-perspective Conceptual Framework, Longe Range Planning.
[275] Sieniutycz, S., and Jezowski, J., (1999), Energy Optimization in Process
Systems, Elsevier Ltd, p. 398.

BIBLIOGRAPHY 209
[276] Sims, R.E.H., and Schock, R.N., and Adegbululgbe, A., and Fen-
hann, J., and Konstantinaviciute, I., and Moomaw, W., and Nimir, H.B.,
and Schlamadinger B., and Torres-Martınez, J., and Turner, C., and
Uchiyama, Y., , and Vuori, S.J.V., and Wamukonya, N., , and Zhang, X,
(2007), Energy Supply In Climate Change: Mitigation, Cambridge University Press,
Cambridge, United Kingdom and New York, NY, USA.
[277] Sioshansi, F.P, (2008), Competitive Electricity Markets: Design, Implementa-
tion, Performance,Menlo Energy Economics 1925 Nero CT Walnut Creek, CA.
[278] Sioshansi, F.P, (2006), Complexite de l’innovation Technologique, Revista Fac-
ultad De Ciencias Economicas, Vol. X IV - No. 1, p.12 - 22.
[279] Smida, A., and Ben Romdhane, E., (2004), Les Determinants Culturels des
Pratiques de Veille Strategique,
[280] Solmes, L.A., (2009), Energy Efficiency: Real Time Energy Infrastructure In-
vestment and Risk Management, Springer Science+Business Media B.V.
[281] Sorensen, B., (2007), Renewable Energy Conversion, Transmission and Storage,
Springer Science+Business Media B.V.
[282] Stadtler, Hartmurt and Kilger, Christoph, (2007), Supply Chain Man-
agement and Advanced Planning Concepts, Models, Software and Case Studies, Ed.
3rd, ISBN. 3-540-22065-8, Springer.
[283] Steven, P., (2004), The Economics of Energy.
[284] Suzuki, et al., (2010), Eco2 Cities, Ecological Cities as Economic Cities.
[285] Swanson, T., (2015), Consensus as A Service: A Brief Report on The Emergence
of Permissioned, Distributed Ledger Systems, the Sim Kee Boon Institute in Singapore,
R3 CEV.
[286] Tamborra, M., (2015), Socio-economic Projects In Energy, Transport and Envi-
ronment, European Commission.
[287] Taudes , A., (2005), Socio-economic Projects In Energy, Transport and Environ-
ment, Adaptive Information Systems and Modeling in Economics and Management
Science,Springer Wien, New York.
[288] Taylor, F.W, (1911), The Principles of Scientific Management, reprinted as part
of a collection, Scientific Management, Harper and Row, 1947.
[289] Terra, C.C., (2014), Analysis of Large-Scale Bitcoin Mining Operations, The
Coin Terra Company.

210 BIBLIOGRAPHY
[290] Thollander, P., and Palm, J., and Rohdin, P., Editor Palm, J., (2010),
Energy Efficiency: on Chap 3, p. 49.: Categorizing Barriers to Energy Efficiency: An
Interdisciplinary Perspective, Sciyo Janeza Trdine 9, 51000 Rijeka, Croatia.
[291] Thollander, P, and Palm, J., (2013), Improving Energy Efficiency in Indus-
trial Energy Systems, p. 137, Springer-Verlag, London.
[292] Thumann, A., (2002), Plant Engineers and Managers Guide to Energy Conser-
vation, The Fairmont Press and ARCEL DEKKER, INC. New York.
[293] Thumann, A., and Dunning, S., (2008), Plant Engineers and Managers Guide
to Energy Conservation, The Fairmont Press, Inc.
[294] Thumann, A., and Wooddroof, E.A., (2005), Handbook of Financing Energy
Projects, Fairmont Press, Inc. 700 Indian Trail Lilburn, GA 30047.
[295] Timmer, MP., and Dietzenbacher, E., and Los, B., and Stehrer, R.,
and Vries, G.J., (2015), An Ilustrated User Guide to the World Input-Output Data:
The Case of Global Automotive Production, Review of International Economics, Vol.
23(3), p. 575-605.
[296] Timmer, MP., and Erumban, A.A., and Gouma, R., and Los, B., and
Temurshoev U., and Vries, G.J., (2012), AThe World Input - Output Database
(WIOD): Contents, Sources, and Methods, The European Commission.
[297] Tirole, J., (1998), The Theory of Industrial Organization, The MIT Press, Cam-
bridge, Massachusetts, London, England.
[298] Troccoli, A., (2008), Management of Weather and Climate Risk in The Energy
Industry: Weather and Climate Predictions for The Energy Sector.
[299] Turner, W.C., (2001), Energy Management Handbook, The Fairmont Press.
[300] Twiss, B.C., and Weinshall, T.D., (1980), Managing Industrial Organiza-
tions, Pitman Publising Limited.
[301] Varian, Hal R., (1992), Microeconomic Analysis, Norton.
[302] Varma, A., and Clayton, A., (2010), Moving Goods Sustainably in Surface
Transportation, ITE Journal, Vol.80(3), p. 20.
[303] Verbeek, M., (2000), A Guide to Modern Econometrics, John Willey Sons Ltd.
[304] Vine, E., and Hamrin, J., and Eyre, N., and Crossley, D., and Mal-
oney, M., and Watt, Greg., (2000), Public Policy Analysis of Energy Efficiency
and Load Management in Changing Electricity Businesses, Energy Policy, Vol.31, p.
405-430.

BIBLIOGRAPHY 211
[305] Visser, W., and Matten, D., and Pohl, M., and Tolhurst, N., (2010),
The A-Z of Corporate Social Responsibility, John Willey Sons Ltd.
[306] Vose, D., (1997), Fundamentals of Risk Analysis and Risk Management: Monte
Carlo Risk, Analysis Modeling, Ch.14.
[307] Wagner, N., (2008), Credit Risk: Models, Derivatives, and Management, CRC
Press Taylor and Francis Group.
[308] Wang, L., (2009), Energy Efficiency and Management in Food Processing Facili-
ties, CRC Press Taylor and Francis Group.
[309] Waters, C., and Donald, J., (1999), Global Logistics and Distribution Plan-
ning: Strategies for Management, London , Kogan Page Florida (USA) , (CRC) Press.
[310] Wei, Y., and Liu, L., and Wu, G., and Zou, L., (2011), Energy Economics:
CO2 Emissions in China, Science Press Beijing and Springer-Verlag Berlin Heidelberg.
[311] White, H., (2013), National Strategy for Global Supply Chain Security Implemen-
tation Update, Science Press Beijing and Springer-Verlag Berlin Heidelberg.
[312] White, H., (2009), Developing Research Questions A Guide for Social Scientists,
Palgrave Macmillan.
[313] Wickeren, A.C., (1973), Interindustry, Relations; Some Attraction Models.
[314] William, A.R., (2010), Energy Policies, Politics and Prices, Federal Energy Man-
agement and Government Efficiency Goals, Nova Science Publishers, Inc.
[315] Wilson, R.M.S., and Giligan, C., (2005), Strategic Marketing Management:
Planning,Implementation, and Control, Elsevier Butterworth-Heinemann, Linacre
House, Jordan Hill, Oxford OX2 8DP 200 Wheeler Road, Burlington, MA 01803.
[316] Wittmann, T., (2008), Agent-Based Models of Energy Investment Decisions,
Physica-Verlag Heidelberg.
[317] Wolfgang, R., and Salmiah A., (1989), The Changing World of Oleochemi-
cals, Malaysian Palm Oil Board P. O. Box 10620.
[318] Wolfgang, R., and Salmiah A., (2013), Deep Research Report on Global and
China Power Energy Storage Battery Industry, Malaysian Palm Oil Board P. O. Box
10620.
[319] Wu, J., and Dunn, S., and Forman, H., (2012), A Study on Green Supply
Chain Management Practices among Large Global Corporations, Journal of Supply
Chain and Operations Management, Vol. 10, N.1, p. 182-194.

212 BIBLIOGRAPHY
[320] Yassine, A., and Euchi, J., and Chabchoub, H., (2010), Metaheuristics Op-
timization Via Memory to Solve the Profitable Arc Tour Problem, 8th International
Conference of Modeling and Simulation - MOSIM’10 - Hammamet - Tunisia “Evalu-
ation and optimization of innovative production systems of goods and services.
[321] Yi-chen, Lan. and Bhuvan, Unhelkar., (2006), Global Integreated Supply
Chain, Idea Group Inc.
[322] Younger, B., (1995, Energy Consumption in Supermarkets, The Ecology of Your
Market Workbook.
[323] Zhua, Q., (2007, Confirmation of A Measurement Model for Green Supply Chain
Management Practices Implementation.
[324] Zhua, Q., Ed.; SIRCHIS, J., (1988, Energy Efficiency Industry, Elsevier Pub-
lishing Co., Inc.52 Vanderbilt Avenue, New York, NY 10017, USA, Ch. 5, p. 177.
[325] IEA., (2010, Transport Energy Efficiency, OECD/IEA.
[326] Zhua, Q., Ed.; SIRCHIS, J., (2011, Joint Public-Private Approaches for Energy
Efficiency Finance, The IEA Policy Pathway series.
[327] Manzini, R., (2012, Warehousing in the Global Supply Chain, Advanced Models,
Tools and Applications for Storage Systems, Springer-Verlag London.
[328] Manzini, R., (2010, Energy Efficiency Governance, OECD/IEA.
[329] Manzini, R., (2010, Radioactive Waste Management: Dealing with Interests,
Values and Knowledge in Managing Risk. Workshop Proceedings Brussels, Belgium,
OECD/IEA.

Part III
Appendix
213


215
Table 5.1: Energy Savings and Emission Reductions
Source: Aminata J., Grandval S., Sbihi A., (2014),“Energy Efficiency in Production Process:
A Case of Footwear Trade Development”, The Business & Management Review, vol.4, n.4,
p.104-113
Table 5.2: Cost Effectiveness Analysis
Source: Aminata J., Grandval S., Sbihi A., (2014),“Energy Efficiency in Production Process:
A Case of Footwear Trade Development”, The Business & Management Review, vol.4, n.4,
p.104-113
Energy Savings and Cost Effective Analysis
Sample Program in SAS Software
SAS-DATA-NEW
1. if sic-3d= 31100 or sic-3d= 31200 or sic-3d= 31300 or sic-3d= 31400 or sic-3d= 32100
2. or sic-3d= 32200 or sic-3d= 32300 or sic-3d= 32400 or sic-3d= 33100 or sic-3d=
33200
3. or sic-3d= 34100 or sic-3d= 34200 or sic-3d= 35100 or sic-3d= 35200 or sic-3d=
35300

216
4. or sic-3d= 35400 or sic-3d= 35500 or sic-3d= 35600 or sic-3d= 36100 or sic-3d=
36200
5. or sic-3d= 36300 or sic-3d= 36400 or sic-3d= 36900 or sic-3d= 37100 or sic-3d=
37200
6. or sic-3d= 38100 or sic-3d= 38200 or sic-3d= 38300 or sic-3d= 38400 or sic-3d=
38500
7. or sic-3d= 39000 ;
keep sic-3d year ltlnou ltl zpdvcu zndvcu yt1vcu iadvcu vtlvcu ; run;
procedure-sort ; by sic-3d
proc summary data=is7595.dbf
class sic-3d ; var ltlnou ltl zpdvcu zndvcu yt1vcu iadvcu vtlvcu ; output out=id7595
sum=t-ltln t-ltl t-zpd t-znd t-yt1 t-iad t-vtl
proc-print
drive1;
a = 0.5; do iter=1 to 10000; do time = 0 to 500;
y = 1 - exp(-a*time) + 0.1 *rannor(123); output; end; end; run; data drive2;
a = 0.5; yp = 1.0 + 0.01 *rannor(123); do iter=1 to 100; do time = 0 to 500;
y = 1 - exp(-a)*(1 - yp); yp = y + 0.01 *rannor(123);
output; end; end; run; title1 ’Monte Carlo Simulation of ODE’;
procedure model data=drive1 noprint;
parm a 0.5; dert.y = a - a * y; fit y / outest=est; by iter; run; proc univariate data=est
noprint;
var a; output out=monte mean=mean p5=p5 p95=p95; run; proc print data=monte; run;
Source: the program created by authors based on statistics database (central bureau of
statistics, Jakarta).
Related Source and Information
Hyper Competition
Rosenau (1997), the limitation of complexity theory is to build up the alternative solution.
Why it does matter?, Because, the theory can make an answer to give a solution for

217
a complex system in world complex system. How can theory exactly adapt and give
problem-solving? How to determine initial condition that will lead outcomes? All these
things can be solved through computer simulations, with minimizing the deviation level,
for example to measure the business model as below:
Hyper Competition via Transparency
Based on BSR and Maersk Line’s report, 2010; the notion of hyper transparency takes
the idea of transparency and extends it exponentially. It reflects the way of consumers,
customers, local communities, investors, regulators, and other key stakeholders increas-
ingly expect full visibility into how business operates, how it performs, and the impact of
business on people, profit, and the planet as a whole. Developments in information com-
munication technologies are pushing and enabling this trend as they provide us with the
means required to receive and to process information (ex. smartphone that can be used
as airplane boarding passes). Moreover, see Rosenau (1997); about complexity, global
politics, and national security, also see more New (2010), “ At each stage of the chain, a
new rule will apply: The only acceptable products are those with a clear, comprehensive
provenance”.
Examples of hyper-transparency:
1. corporate reporting on financial and non-financial performance.
2. consumer expectations for transparency which allows consumers to access informa-
tion about the sustainability performance of a particular product.
3. allows consumers and citizens on debate corporate green-washing.
4. both carbon-labeling schemes (voluntary and regulatory), and sustainability con-
sortia, which drive product transparency. ex:Liu et al. (2010), p.108: according to
energy efficiency performance and utilization of renewable energies.
5. the point that can be figured out from collaboration is transparency to show how
the work itself has been executed in efficiency method.
Energy Efficiency: Theory and Extension
Basically, energy efficiency can be calculated as well as output variable divided by input
variable. This formula is the fundamental before creating complex calculation. The aim
of this research work is what we can learned from managerial aspect which refer to energy
efficiency problem. There are many variations how to find and to create energy efficiency.
The point is not only technology level, but also handling the organizational aspect. par-
ticularly within three dimensions of transportation, production and warehousing. For
some extension there are weighted score for each variable:

218
Energy Efficiency =(Output )
(Input )(5.1)
Energy Efficiency =(Weighted Sum Output )
(Weighted Sum Input )(5.2)
Figure 5.1: The Production Function, Isoquant
Source: Samuelson, Microeconomics, 1998
An isoquant is the set of points at which the same quantity of output is produced
while changing the quantities of two or more inputs. An isoquant shows all those combi-
nations of factors which produce same level of output. An isoquant is also known as equal
product curve or iso-product curve. The isoquant shows ability to substitute between the
two different inputs at will in order to produce the same level of output. An isoquant map
can also indicate decreasing or increasing returns to scale based on increasing or decreas-
ing distances between the isoquant pairs of fixed output increment, as output increases,
Salvatore (1989), Chiang (1984), Varian (1992).
Mostashari (2011), collaborative modeling and decision-making for complex energy
systems, p.25; “evaluative complexity is due to the existence of stakeholders in a complex
system, and is an indication of the different normative beliefs that influence views on the
system. Thus, even in the absence of the two former types of complexity, and even if be
able to model the outputs and to perform the system, it would still be difficult to reach an
agreement on what good system performance signifies. This type of complexity is one of
the primary motivators for engaging stakeholders in systems modeling and policy design.
The AHP Process
1. to identify an unstructured situation into its component parts,

219
2. to arrange the parts or variables into a hierarchic order,
3. assign numerical values to subjective judgments for each variable,
4. to determine which variables have the highest priority.
The Mathematics of AHP: Normalization behind the scene, 1
(5.3)
(5.4)
(5.5)
(5.6)
(5.7)
(5.8)
(5.9)

220
(5.10)
Table 5.3: The Matrix Simulation-1
Note; its taken and reformulated from the basic concept of matrix supply chain on
business-economic, and social performance, CTQ Score= critical to control quality score),
Analytical Hierarchy Process Matrix to Analyze Intervention Case Index (ICI), Per Case,
Monthly Based on Policy Simulation
Energy Efficiency
Popper et al. (2009), in energy future near-term decisions from theme is based on the
energy efficiency of the global supply chain in terms of production, transportation and
storage of products, and Joshi and Kumar (2012) stated energy efficient thermal manage-
ment of data centers. The objective is optimizing energy throughout the supply chain for

221
Table 5.4: The Matrix Simulation-2
Table 5.5: The Matrix Simulation-3
a minus impact on the environment.
Aswathanarayana and Divi (2009) on energy portfolios, Serletis (2007), Molak (1997),
about fundamentals of risk analysis and risk management, Vose (1997); referring the fun-
damentals of risk analysis and risk management using monte carlo risk analysis modeling
cleared that “the analysis should not be thought of as the only technique for evaluat-
ing risk and uncertainty”. The point is the decision maker should use “monte carlo risk
analysis as one of several complementary inputs to the decision process analysis.
The Jevons paradox is to observe that an increase in the efficiency with which a
resource (i.e. fuel) is used causes a decrease in the price of that resource when measured
in terms of what it can achieve (i.e. work). A decrease in the price of a good or service
will increase the quantity demanded (see supply and demand, demand curve). Thus with
a lower price for work, more work will be “purchased” (indirectly, by buying more fuel).
The resulting increase in the demand for fuel is known as the rebound effect. The Jevons
paradox occurs when the rebound effect is greater than 100%, exceeding the original
efficiency gains.
The Jevons paradox was first described by the English economist William Stanley
Jevons in his book, 1865; The coal question. Jevons observed that “England’s consump-
tion of coal soared after James Watt introduced his coal-fired steam engine”, which greatly
improved the efficiency of Thomas in the earlier design. Watt’s innovations made coal
a more cost-effective which leading to the increased use of the steam engine in a wide

222
Figure 5.2: Elastic Demand for Work Full
Demand for Work: A doubling of fuel efficiency more than doubles work demanded, increasing
the amount of fuel used. Jevons paradox occurs, see Polimeni et al. (2008).
range of industries. Jevons argued that improve- ments in fuel efficiency tend to increase,
rather than decrease. For fuel use that there is a confusion of ideas to suppose that the
economical use of fuel is equivalent to diminished consumption. Jevons argued that this
view was incorrect, as further increases in efficiency would tend to increase the use of coal.
Hence, improving technology would tend to increase, rather than reduce it at the rate at
which England’s coal deposits were being depleted.
Figure 5.3: Inelastic Demand for Work Full
demand for work: A doubling of fuel efficiency does not double work demanded, the amount of
fuel used decreases. Jevons paradox does not occur. see Polimeni et al. (2008).
In the 1980s, economists Daniel Khazzoom and Leonard Brookes revisited the Jevons
paradox in the case of a society’s energy use. Brookes, argued that attempts to reduce
energy consumption by increasing energy efficiency would simply raise demand for energy
in the economy as a whole. Khazzoom focused on the narrower point that the potential
for rebound was ignored in mandatory performance standards for domestic appliances
being set by the California Energy Commission.
In 1992, the economist Harry Saunders dubbed the hypothesis that improvements
in energy efficiency work to increase, rather than decrease. Saunders showed that the
Khazzoom-Brookes postulate was consistent with neo-classical growth theory (“the main-

223
stream economic theory of capital accumulation, technological progress and long-run eco-
nomic growth”) based on many assumptions.
Further Information on Literature Review
Energy efficiency can be defined as the ratio of useful outputs to energy inputs for a
system. The system in question may be an individual energy conversion device (i.e. a
boiler), a building, an industrial process, a firm, a sector or an entire economy. In all
cases, the measure of energy efficiency will depend upon how useful is defined and how
inputs and outputs are measured (Patterson, 1996). The options include:
• thermodynamic measures: where the outputs are defined in terms of either heat content
or the capacity to perform useful work;
• physical measures: where the outputs are defined in physical terms, such as vehicle
kilometers or tonnes of steel; or
• measures: where the outputs (and sometimes also the inputs) are defined in economic
terms, such as value-added or GDP.
When outputs are measured in thermodynamic or physical terms, the term energy
efficiency tends to be used, but when outputs are measured in economic terms it is more
common to use the term energy productivity. The inverse of both measures is termed
energy intensity. The choice of measures for inputs and outputs, the appropriate system
boundaries and the time frame under consideration can vary widely from one study to an-
other. However, physical and economic measures of energy efficiency tend to be influenced
by a greater range of variables than thermodynamic measures, as do measures appropriate
to wider system boundaries. Hence, the indicator that is furthest from a thermodynamic
measure of energy efficiency is the ratio of GDP to total primary energy consumption
within a national economy. According to economists are primarily interested in energy
efficiency improvements that are consistent with the best use of all economic resources.
These are conventionally divided into two categories: those that are associated with im-
provements in overall, or “total factor productivity” (in economics so called; technical
change), and those that are not (in case of the existent of “substitution”). Further- more,
its assumed by changes of energy price to other inputs. However, empirically between
these two categories can be challenging, not least because changes in relative prices also
induce technical change, see Samuelson (2004).
Attempting to operate all of the energy efficiency indicators. These include the role
of value judgments in the construction of energy efficiency indicators, the energy qual-
ity problem, the boundary problem, the joint production problem and the question of
isolating the underlying technical energy efficiency trend from the aggregate indicator.
Capehart et al. (2007) & Meyers and Laskowski (2001), Guide to Energy Manage-
ment, p.10; in- troduction to energy management; the phrase energy management means
different things to different people. Also, it can be determine that energy management is;
“the efficient and effective use of energy to maximize profits (minimize costs) and enhance

224
competitive positions”. This rather broad definition covers many operations from services
to product and equipment design through product shipment. Waste minimization and
disposal also presents many energy management opportunities. A whole systems view-
point to energy management is required to ensure that many important activities will be
examined and optimized. Presently, industries are adopting total quality management
(TQM) strategy for improving their operations. Total quality management approach
should include an energy management component to reduce energy costs. The primary
objective of energy manage- ment is to maximize profits or minimize costs. To distinguish
sub objectives of energy management programs:
1. improving energy efficiency and reducing energy use (cost minimization),
2. decreasing greenhouse gas emissions and improve air quality,
3. improving better communications on energy matters,
4. sustainable energy management,
5. effective monitoring, reporting, and management strategies,
6. energy investments through research and development,
7. energy management program from all employees,
8. eliminate any interruption in energy supplies.
Mining and projects supply chain team combines the experience, expertise and long-
standing relationships of our mining, energy, infrastructure, oil and gas, and industrial
clients. This vertical offers a complete end-to-end solution using innovative methods.
Combining services such as chartering, project freight forwarding, and specialized cargo
shipping together with world-class project management to remove complexity from en-
ergy, mining and projects supply chains. The project freight at anywhere in the world for
example; by land, sea and air, using trucks, rail, cranes, ships, barges, and planes. Provid-
ing high-quality, configured logistics solutions for projects of any size. For examples areas:
• oil and gas,
• refineries, pipelines LNG plants on and off-shore drilling upstream developments,
• power stations;gas, steam, thermal, hydro, coal sub-stations, power distribution,
transmission lines engines and turbines,
• “green field” mining developments,
• airports, bridges harbors, rail road networks, and pipelines industrial,
• industrial factories for the toughest supply chain challenges,

225
• the energy, mining, and projects group to eliminate supply chain complexities and
maximize competitive advantage.
Troccoli (2008), Management of Weather and Climate Risk in the Energy Industry,
p.53-54; to esti- mate consumption must be provide at least two things: 1. temperature
and modeling; temperature is parameter offering the highest correlation during winter
or summer. The appearance shows in air conditioning system in houses and buildings.
Modeling of the consumption that based on cloud cover. 2. production optimization;
depending on the production techniques used, energy specialists have different needs in
terms of meteorological data and may be required to forecast their production. Hydro-
electricity: the history and data relating to rainfall are useful when decisions have to be
taken about whether or not to use hydro power dams to produce electricity.
Type of specific requirements:
• wind electricity: at the early stage of a project to set up a wind farm, energy
specialists to determine the geographic areas offering the best wind potential to
produce electricity.
• photo voltaic electricity: as with wind energy, specialists may need to use weather
forecasting services to target the most advantageous locations for installation.
• temperature: the efficiency (and even use) of many production means (e.g. nuclear
power plants and co-generation plants) varies according to temperature.
Other requirements:
Transmission optimization; transmission facilities are located outdoor they are subject
to weather conditions. These conditions have to be taken into account in order to ensure
better management and prevent loss:
• depending on the temperature, the transmission capacity of high voltage lines may
be lowered.
• extreme events (such as strong winds, icing, etc.) must be forecast as early as
possible so that maintenance teams are ready to act. It should be noted that
transmission specialists who are aware there is a risk of icing (based on temperature,
humidity, etc.) can adopt transmission methods to reduce this risk.
Infrastructure plan; energy specialists generally need to plan ahead for the infrastructures
needed in the coming decades, if not the next century. This is why their planning has to
take into account future lifestyles, industrial resources and climate conditions. With the
current change in climate, forecasting climatic conditions is of prime importance, at least
in terms of the parameters with the highest energy correlation.
• n-article : the code of product which produced by ES France as result of successful
marketing department to all customers for European Union. Head office (virtual
office) of marketing section is located in Paris, France.

226
Table 5.6: Oleo Transport-1

227
Table 5.7: Oleo Transport-2

228
Table 5.8: Oleo Transport-3

229
Table 5.9: Oleo Transport-4

230
Table 5.10: Oleo Transport-5

231
Table 5.11: Oleo Transport-6

232
Table 5.12: Oleo Transport-7

233
Table 5.13: Oleo Transport-8

234
Table 5.14: Oleo Transport-9

235
Table 5.15: Oleo Transport-10

236
Table 5.16: Oleo Transport-11

237
Table 5.17: Oleo Transport-12

238
Table 5.18: Oleo Transport-13

239
Table 5.19: Oleo Transport-14

240
Table 5.20: Oleo Transport-15

241
Table 5.21: Oleo Transport-16

242
Table 5.22: Oleo Transport-17

243
Table 5.23: Oleo Transport-18

244
Table 5.24: Annex-1: The Part of Sample Data Base: The Oleo Chemical Transportationin France/E-U.
Source : ES France data base, it was compiled, formulated, and organized from the original of
International business transaction, 2011.

245
• tonnes : total volume for each vehicle based on customer order.
• kg : total volume in kilograms
• unit price : unit price per ton.
• tot-sales : total value of sales volume in Euro currency.
• Route/Road ”A” : the precise calculation of distance; from the origin of plant to
warehouse of customer via vehicle through remote sensing application by google
earth tech., authors named it ”road a” in kilometer, one way direction.
• Route/Road ”B”: the precise calculation of distance; from the origin of plant to
warehouse of customer via vehicle through remote sensing application by google
earth tech., authors named it ”road b” in kilometer, one way direction.
• Route/Road ”C”: the precise calculation of distance; from the origin of plant to
warehouse of customer via vehicle through remote sensing application by google
earth tech., authors named it ”road c” in kilometer, one way direction.
Note:
• all variables based on company data base and except for all road types are estimated
values (remote sensing application by google earth tech).
• all software based on Linux and for extension of calculation by Gnumeric system.
• the general conclusion from annex 1: the value added here is the simulation of
road a, b, and c therefore the decision for transport planning is key parameter for
successful business.
• product: the type of product which produced by ES France as result of successful
marketing department to all customers for European Union. The head office (virtual
office) of marketing section is located in Paris, France.
• tot-sales: total sales in Euro currency. Km Road A: Total volume for each vehicle
based on customer order.
• liter-A: total distance reached by all vehicles which took the road A, all simulations
based on real planning of business vehicle route. liter/km: total fuel consumption
per km by vehicle when delivering the product order.
• tot-CO2: the total of CO2 as result of vehicle which deliver product to client.
• speed: the average speed of truck on the road A.
• time-truck: the average of time truck from the warehouse’s origin plant to reach
client’s ware- house (in total hours per trip, one way).

246
Table 5.25: Annex-2: The Part of Sample Data Base: The Oleo Chemical Transportationin France/E-U.
Source : ES France data base, it was compiled, formulated, and organized from the original of
International business transaction, 2011.

247
Note: this research work covered and based on 221 within international business trans-
actions (daily basis and at least four months in field investigation). All variables are
estimated values, except for total sales. IFRAPON LOS 2N70: the high viscosity prod-
uct. All software based on Linux platform and for extension of calculation by Gnumeric
system. However, currently the Gnumeric can be installed on windows platform. The
general conclusion from annex 2:
• The value added here is road A has been chosen, based on the real road and all possi-
bilities for energy (fuel) consumption, therefore the decision from transport planning
(transport agent manager) is key parameter for successful business as counterpart
business in oleo chemical industries.
• The speed of vehicle based on eco-driving style which gives a big impact for fuel
consumption. The ability of marketing section to bit the price competition in mar-
ket price became an important part of business sustainability particularly on oleo
chemicals market. France’s transport should take a reposition as business counter-
part for warehouse’s oleo chemicals plants. Further- more, it should be stronger on
procurement price competition which offered by oleo chemicals companies.
This research work has been established by collaboration E&S Chimie, Ecogreen
Group, France and DHW, Ecogreen Group, Germany via monitoring by international
central office at Singapore.
Energy Efficiency Measures for International Shipping
Indonesia-Pelindo I
The ordinary least square method was applied. Normally, if there is an existing an auto
correlation, Cochran orcutt method will apply for it, see Gujarati (1999). Figures in
parentheses shows t-value.
1. Food and Beverages Products: SITC Code: 313 LOG(Y) = 6.611+ 0.016*LOG (K)
+1.396*LOG (TW) + 0.002*LOG (M) (0.34) (9.82) (0.25) R-squared: 0.97
2. Garment and Textiles Products: SITC Code: 321 LOG(Y) = -12.340+0.074*LOG(K)
+ 2.252*LOG(TW) + 0.165*LOG(M) (0.72) (6.51) (3.89) R-squared: 0.98
3. Paper and Paper Products: SITC Code: 341 LOG(Y) = 6.808 - 0.048*LOG (K) +
1.117*LOG (TW) - 0.15*LOG (M) (-0.84) (2.66) (-0.41) R-squared: 0.98
4. Other Chemical Products: SITC Code: 352 LOG(Y) = -4.286 + 0.100*LOG (K) +
1.762*LOG (TW) - 0.011*LOG (M) (1.62) (12.79) (-0.95) R-squared: 0.98
5. Non-Metallic Mineral Products: SITC Code: 369 LOG(Y) = 1.7639 + 0.195*LOG
(K) + 1.093*LOG (TW) + 0.201*LOG (M) (0.71) (1.76) (1.48) R-squared: 0.94

248
6. Basic Metallic Products and Other: SITC Code: 381 LOG(Y) = 5.909 + 0.150*LOG(K)
+ 0.861*LOG(TW) - 0.027*LOG(M) (4.06) (5.67) (-0.43) R-squared: 0.98
7. Machinery except Electrical Products: SITC Code: 382 LOG(Y) = -4.782 - 0.015*LOG
(K) + 2.060*LOG (TW) - 0.016*LOG(M) (-0.17) (10.23) (-1.34) R-squared: 0.98
8. Electrical Machinery Apparatus: SITC Code: 383 LOG(Y) = 2.938 + 0.184*LOG
(K) + 1.102*LOG (TW) - 0.010*LOG(M) (2.90) (7.21) (-0.16) R-squared: 0.98
9. Transport Equipment Products: SITC Code: 384 LOG(Y) = -2.698 + 0.047*LOG
(K) + 1.744*LOG (TW) +0.063*LOG(M) (0.56) (7.54) (0.81) R-squared: 0.97
10. Other Industrial Products: SITC Code: 390 LOG(Y) = 2.798 + 0.056*LOG (K)
+1.041*LOG (TW) + 0.077*LOG(M) (0.99) (8.92) (6.25) R-squared: 0.98
Why we applied robust procedure? Because, in order to know well the value added
level or output level as a function of total paid and unpaid workers, average supervisory
and professional workers, total payment to production workers, total payment to non-
production workers, total profit, and ad- vertising and promotion. Moreover, to get best
description of manufacturing value added during 20 years. The most common general
method of robust regression is M-estimation, see SAS (2002). The M in M-estimation
stands for “maximum likelihood type”. Least squares alternatives, in 1973, Huber in-
troduced M-estimation for regression (see, robust statistics for additional details of M-
estimation). The M in M-estimation stands for “maximum likelihood type”. The method
is robust to outliers in the response variable, but turned out not to be resistant to outliers
in the explanatory variables (leverage points). In fact, when there are outliers in the
explanatory variables, the method has no advantage over least squares.
In the 1980s, several alternatives to M-estimation were proposed as attempts to over-
come the lack of resistance. See the book by Rousseeuw and Leroy for a very practical
review. The most common general method of robust regression is M-estimation, intro-
duced by Huber, 1964.
In The SAS procedure, here we used robust regression (procedure in robust regres-
sion model in SAS software) and the model construction on it; all variables called; value
added, total paid and unpaid workers, average supervisory and professional workers, total
payment to production workers, total payment to non-production workers, total profit,
and advertising and promotion.
All List of data used and definition:
- VTLVCU: Value added,
- LTLNOU: Total paid and unpaid workers,
- LTL: Average supervisory and professional workers,
- ZPDVCU: Total payment to production workers,
- ZNDVCU: Total payment to non-production workers,
- YT1VCU: Total profit,

249
- IADVCU: Advertising and promotion
Estimation result for value added:
Variable of VTLVCU =
17392.5 -321.8LTLNOU+0.7 LTL+1.5 ZPDVCU+2.7ZNDVCU+0.9YT1VCU+4.2IADVCU
(-324.07) (-2.59) (1.40) (2.66) (0.92) (4.1769)

250
Tab
le5.26:VesselArrivals,Belaw
anPort

251
Table 5.27: vessel arrivals, Pekanbaru Port

252
Tab
le5.28:VesselArrivals,Dumai
Port,Sumatra
Sou
rce:
MarineTraffic,
Indon
esia,20
16.

253
Table 5.29: Vessel Arrivals, Tanjung Pinang Port

254
Table 5.30: Vessel Arrivals, Lhokseumawe Port

255
Tab
le5.31:VesselArrivals,Tan
jungPriok
Port

256
Tab
le5.32:VesselArrivals,Pan
jangPort

257
Tab
le5.33:VesselArrivals,Palem
ban
gPort

258
Tab
le5.34:VesselArrivals,TelukBayurPort

259
Tab
le5.35:VesselArrivals,Pon
tian
akPort

260
Tab
le5.36:VesselArrivals,Cireb
onPortt

261
Tab
le5.37:VesselArrivals,Jam
biPort

262
Tab
le5.38:VesselArrivals,Bengk
ulu
Port

263
Tab
le5.39:VesselArrivals,Ban
tenPort

264
Tab
le5.40:VesselArrivals,Pan
gkal
Balam
Port

265
Tab
le5.41:VesselArrivals,Tan
jungPan
dan
Port

266
Tab
le5.42:VesselArrivals,Tan
jungPerak
Port

267
Tab
le5.43:VesselArrivals,Tan
jungEmas
Port

268
Tab
le5.44:VesselArrivals,Ban
jarm
asin
Port

269
Tab
le5.45:VesselArrivals,Benoa
Port

270
Tab
le5.46:VesselArrivals,Tenau
Kupan
gPort

271
Tab
le5.47:VesselArrivals,MakassarPort

272
Tab
le5.48:VesselArrivals,Balikpap
anPort

273
Tab
le5.49:VesselArrivals,Sam
arindaPort

274
Tab
le5.50:VesselArrivals,BitungPort

275
Tab
le5.51:VesselArrivals,Ambon
Port

276
Tab
le5.52:VesselArrivals,Soron
gPort

277
Tab
le5.53:VesselArrivals,BiakPort

278
Tab
le5.54:VesselArrivals,Jayap
ura
Port