THE IMPACT OF RELIGIOUS EXPERIENCE ON FINANCIAL MARKETS ... Impact Of Religious... · The Impact of...
34
The Impact of Religious Experience on Financial Markets 1 THE IMPACT OF RELIGIOUS EXPERIENCE ON FINANCIAL MARKETS Mohamad Al-Ississ Harvard University June 2010 Abstract Religion plays an important role in peoples’ lives, yet its impact on financial markets is seldom researched. This study examines the effect of religious experience during the Muslim holy days of Ramadan and Ashoura on the daily returns and trading volumes of seventeen financial markets. Muslim holy days are especially conducive to isolating the elusive faith effect and decoupling it from potential contaminants. The study documents statistically significant changes in the daily trading volume and stock returns associated with these religious experiences. This paper utilizes the heterogeneity of worship intensity within the month of Ramadan to validate its hypothesis. JEL Classifications: D01,D03, D83, G10, Z12, Z13 Harvard Kennedy School of Government, 79 John F. Kennedy Street, Cambridge, MA 02138. [email protected]. All errors and opinions expressed herein are my own. This paper is copyrighted by the author. For permission to reproduce or to request a copy, contact the author. This paper has benefited from discussions with Drs. Asim Khwaja and Rachel M. McCleary, and the participants in Duke University’s 2010 Islam and Economic Development Conference.
Transcript of THE IMPACT OF RELIGIOUS EXPERIENCE ON FINANCIAL MARKETS ... Impact Of Religious... · The Impact of...

The Impact of Religious Experience on Financial Markets
1
THE IMPACT OF RELIGIOUS EXPERIENCE ON FINANCIAL MARKETS
Mohamad Al-Ississ
Harvard University
June 2010
Abstract
Religion plays an important role in peoples’ lives, yet its impact on
financial markets is seldom researched. This study examines the effect of
religious experience during the Muslim holy days of Ramadan and
Ashoura on the daily returns and trading volumes of seventeen financial
markets. Muslim holy days are especially conducive to isolating the
elusive faith effect and decoupling it from potential contaminants. The
study documents statistically significant changes in the daily trading
volume and stock returns associated with these religious experiences. This
paper utilizes the heterogeneity of worship intensity within the month of
Ramadan to validate its hypothesis.
JEL Classifications: D01,D03, D83, G10, Z12, Z13
Harvard Kennedy School of Government, 79 John F. Kennedy Street, Cambridge, MA 02138.
[email protected]. All errors and opinions expressed herein are my own. This paper is copyrighted
by the author. For permission to reproduce or to request a copy, contact the author. This paper has benefited
from discussions with Drs. Asim Khwaja and Rachel M. McCleary, and the participants in Duke
University’s 2010 Islam and Economic Development Conference.
The Impact of Religious Experience on Financial Markets
2
“Discovery commences with the awareness of anomaly, i.e., with the recognition that nature has somehow
violated the paradigm-induced expectations that govern normal science.”
Thomas Kuhn
1. Introduction
Religious faith plays an important role in peoples’ lives, behavior, and decision
making. Weber (1930) argued that religious beliefs and practice have a significant effect
on economic development. Yet until recently economists have all but ignored this
relationship. This trend has reversed with an emerging interest in the study of religion
both as a dependent and independent variable. Still, this research is yet to address the
relationship between religious faith and financial markets. This study sets out to explore
this relationship. Specifically, it investigates how religious faith impacts stock market
returns and trading volume around religious holy days in Muslim countries.
The study focuses on two Muslim holy days, Ramadan and Ashoura. Both
occasions are broadly observed by a majority of Muslim populations. The study benefits
from three naturally occurring factors in the Islamic calendar to isolate the elusive faith
effect on financial markets from other contaminants. These are: the annual shift of the
Muslim Hijri calendar vis-à-vis the Gregorian one; the different methods Muslim
countries use to determine the beginning of lunar Hijri months; and the built-in
alternating worship intensity within the month of Ramadan.
This research explores the effect of faith on the financial markets of seventeen
Muslim countries over the period 1988-2008. It finds that religious experience during
Ramadan has a statistically significant positive effect on the returns of Muslim financial
markets. This effect on returns ranges from 0.16% during the holiest five days of
Ramadan to 0.37% on the holiest day. Interestingly, the effect of holy days on market

The Impact of Religious Experience on Financial Markets
3
returns is not monotonically positive as these markets experience a negative and
significant drop of 0.26 percentage points during the holy day of Ashoura. Religious
experience also affects the trading volume which drops on holy days. The volume effect
is uniformly negative across all the holy days we investigated. Furthermore, the drop is
larger on the holiest of days reaching over 50% of the daily change in volume on Ashoura
and on Ramadan’s holiest day.
The remainder of the paper is organized as follows: Section 2 presents an
overview of relevant literature, section 3 demonstrates the attributes of the Muslim Hijri
calendar that are especially conducive for this research, section 4 describes the
methodology and data, section 5 presents the results, section 6 discusses the results and
their potential drivers, and section 6 concludes.
2. Relevant Literature
The literature examining the impact of religious experience on financial markets
is quite minimal. One of the few studies on this topic is Frieder and Subrahmanyam
(2004) which examines the impact of the Jewish holy days of Rosh Hashanah and Yom
Kippur and the Catholic Irish one of St. Patrick’s on the S&P500 index. They report
significant positive returns on Rosh Hashanah and the days that precede it and on the
days that precede St. Patrick’s Day. They also report a significant impact on trading
volumes. Husain (1998) and (Seyyed, Abraham, and Al-Hajji, 2005) investigate the
effect of Ramadan on the Karachi Stock Exchange and the Saudi one, respectively. While
both studies find lower volatility during the month of Ramadan, neither was able to detect
an effect on mean returns.

The Impact of Religious Experience on Financial Markets
4
Although the literature specific to religion and financial markets is sparse, three
other strands of literature are of interest to this study. The first explores the relationship
between religion and economics, which has recently grown and evolved. This research
can be divided into two classifications; the first treats religion as a dependent variable
while the second treats it as an independent variable. With religion as a dependent
variable, demand and supply side economic factors are used to explain religious
participation and beliefs. The religion as an independent variable research evaluates how
religion impacts economic performance and social beliefs through its effect on
networking and social capital and on personal attributes such as work ethics. A relevant
example from this strand is the recent study by Clingingsmith, Khwaja, and Kremer
(2008). They find that that the religious experience that pilgrims go through during the
Hajj pilgrimage to Mecca leaves an impact on their attitudes, beliefs, and practices on
matters such as equality, harmony, women’s education and employment, and antipathy
towards non-Muslims. For thorough surveys of both classifications please refer to (Barro
and McCleary, 2006) and Iannaccone (1998). Empirical analyses of the two
classifications of the relationship between religion and economics rely on survey data that
is aggregated at country level. This study breaks this reliance on survey data as it directly
measures the revealed effect of faith on financial markets during sacred times in the
Muslim calendar.
The second relevant strand of literature explores and explains the existence of
stock markets anomalies. Past research has documented a number of regularities in stock
market returns on the turn of the year, month, week, and day, and around holidays (for a
thorough review see Thaler (1987) and (Jacobs and Levy, 1988). The leading explanation

The Impact of Religious Experience on Financial Markets
5
for the holiday anomaly focuses on limiting risk exposure while the market is closed
(Amihud and Mendelson, 1987). However, little has been done to explore whether
psychological reasons associated with the nature of these holidays per se, not the closure
of the market, are causing these anomalies. (Jacobs and Levy, 1988) point out that “while
no fully satisfactory explanation of the holiday effect has yet surfaced, psychological
reasons appear to be the most promising”. This explanation is especially plausible in light
of the increasing literature linking the mood of investors to changes in stock returns. Yet
the task of separating the effect of widely observed religious and cultural holidays from
market closure is a challenging one given that the two often coincide. This study achieves
exactly that; it studies widely observed religious holy days during which stock markets
remain open. Consequently its results contribute to explaining the holiday anomaly.
The third strand of literature relevant to our study investigates the role of mood on
stock returns. Emotions and moods have been documented to effect the decision making
of individuals (Bagozzi, Gopinath, and Nyer, 1999). Moods influence judgment regarding
uncertain future events, with positive mood leading to a more positive evaluation in a
number of situations (Wright and Bower, 1992). Of special relevance to financial markets
is the finding that moods influence peoples’ judgment of risk (Johnson and Tversky,
1983). For a review of the impact of mood on decision making see (Loewenstein et al.,
2001) and (Hirshleifer and Shumway, 2003).
A number of studies have linked mood effects to returns of financial markets.
Saunders (1993) reports negative NYSE index returns when it is cloudy in New York.
Kamstra, Kramer, and Levi (2000) report negative returns following daylight savings
time changes. Hirshleifer and Shumway (2003) find a strong statistical relationship

The Impact of Religious Experience on Financial Markets
6
between morning sunshine and stock exchange returns. Kamstra, Kramer, and Levi
(2003) document the effect of seasonal affective disorder (SAD) and stock market
returns. This study contributes to this body of literature.
3. Isolating the Elusive Faith Using the Hijri Calendar
We use Muslim holy days to investigate the impact of religious experience on the
returns of Muslim financial markets. Specifically, the study focuses on two important
Muslim holy days: Ramadan and Ashoura. Ramadan is the ninth month of the Muslim
Hijri calendar during which the Quran was revealed to the prophet Mohamad, observed
by both Sunni and Shi’a Muslims. Fasting during Ramadan is mandatory for Muslims
and one of Islam’s five pillars. During the fast, Muslims do not eat or drink anything
from dawn until sunset. It is a month of heightened religiosity and faith. In addition to
fasting, Muslims put more emphasis on praying, reciting the Quran and giving charity in
anticipation of capturing the month’s promised wealth of blessings.
Ashoura occurs on the tenth day of the first Hijri month of Muharram. It is
commemorated by both Sunni and Shi’a Muslims, although for different reasons. Sunni
Muslims mark that day to commemorate the liberation of Moses and the Israelites from
the Pharaoh and his army. Sunnis fast the day, following the example of the prophet
Mohamad. On the other hand, Shi’a mourn the martyrdom of Hussein ibn Ali, the
grandson of the prophet Mohamad at the Battle of Karbala on Ashoura.
While Ramadan and Ashoura are both holy occasions that are widely observed by
Muslims, they differ in “valence” from each other. The month of Ramadan is dominated
by positive valence as Muslims exercise their faith in anticipation of reaping the blessings
of the month and forgiveness of their past sins. Conversely, Ashoura is associated with

The Impact of Religious Experience on Financial Markets
7
negative valence resulting from the anger and sadness of mourning, especially for Shi’a
Muslims. This makes studying the impact of religious experience on financial markets
during these occasions especially interesting. If mood effects from the exercise of faith is
impacting financial markets, then one would expect each occasion to generate a different
mood and hence a potentially different impact.
The use of Muslim holy days is particularly well suited for investigating the
relationship between faith and financial market returns for a number of reasons. First,
these holy days are widely observed on a religious and cultural level by an overwhelming
proportion of the population in the countries under investigation. This is further amplified
by the significance of communal rituals within Islam (McCleary, 2007). The salience of
these holy days within Muslim societies allows for a more measured impact.
Additionally, most financial markets remain open during these holy days.
Second, unlike secular and Christian holidays, Islamic holy days follow a purely
lunar Islamic (Hijri) calendar, not the solar Gregorian calendar. The Muslim Hijri year is
about 11 days shorter than the Gregorian year. This means that while Muslim holy days
fall on the same day of the Hijri calendar, they actually shift days and months each year
on the Gregorian calendar. For example, the first day of Ramadan as declared by Saudi
Arabia shifted backwards by about nine months over twenty-two years, beginning on
April 28th
in 1987 and commencing on September 1st in 2008. Given that the majority of
businesses in these countries follow a Gregorian, not Hijri, fiscal calendar, this enables us
to isolate the faith effect from the fiscal calendar which is used to explain the turn of the
year, month, and week anomalies. It further allows us to remove other noises that are
The Impact of Religious Experience on Financial Markets
8
cyclical in nature in the Gregorian calendar such as the seasonal and weather effects
mentioned in the aforementioned mood literature.
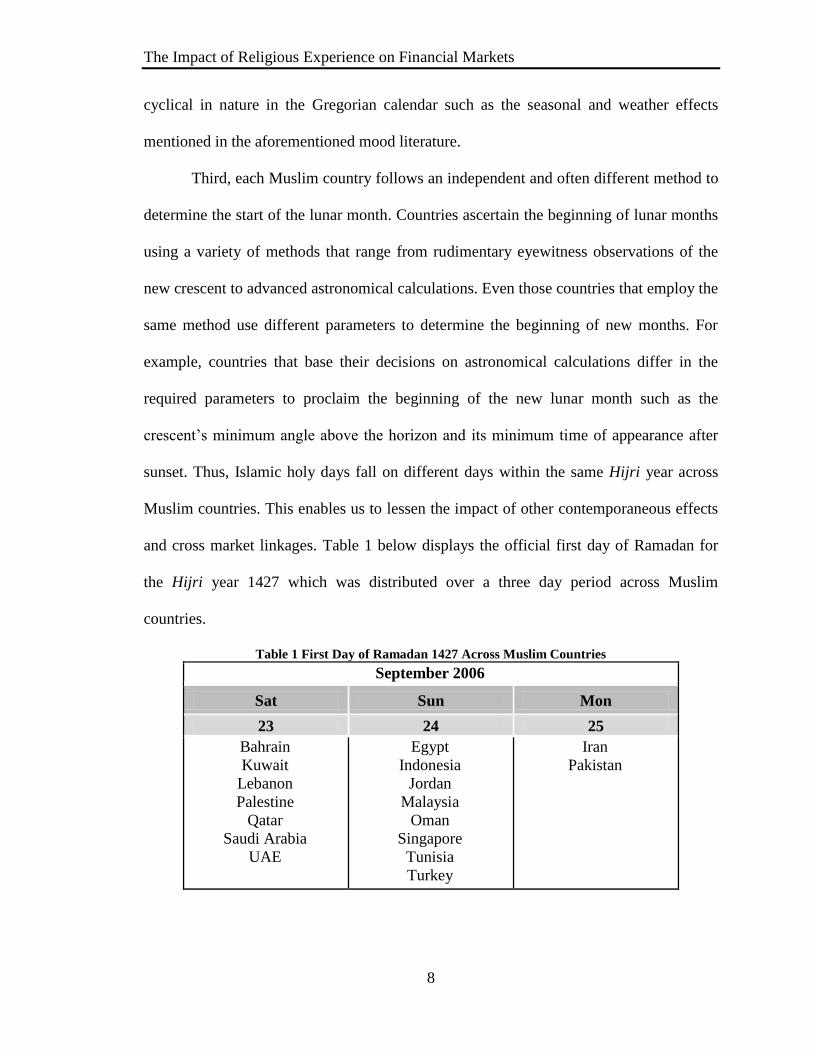
Third, each Muslim country follows an independent and often different method to
determine the start of the lunar month. Countries ascertain the beginning of lunar months
using a variety of methods that range from rudimentary eyewitness observations of the
new crescent to advanced astronomical calculations. Even those countries that employ the
same method use different parameters to determine the beginning of new months. For
example, countries that base their decisions on astronomical calculations differ in the
required parameters to proclaim the beginning of the new lunar month such as the
crescent’s minimum angle above the horizon and its minimum time of appearance after
sunset. Thus, Islamic holy days fall on different days within the same Hijri year across
Muslim countries. This enables us to lessen the impact of other contemporaneous effects
and cross market linkages. Table 1 below displays the official first day of Ramadan for
the Hijri year 1427 which was distributed over a three day period across Muslim
countries.
Table 1 First Day of Ramadan 1427 Across Muslim Countries
September 2006
Sat Sun Mon
23 24 25
Bahrain
Kuwait
Lebanon
Palestine
Qatar
Saudi Arabia
UAE
Egypt
Indonesia
Jordan
Malaysia
Oman
Singapore
Tunisia
Turkey
Iran
Pakistan
The Impact of Religious Experience on Financial Markets
9
Fourth, the study utilizes the fact that the intensity of worship is not constant
throughout the month of Ramadan. Rather, worship intensity goes up and down
depending on the religious significance of the individual days of Ramadan. We use this
inherent heterogeneity in the intensity of religious experience within Ramadan to isolate
faith from other non-faith aspects of this holy month. While some of the studies
mentioned above were unsuccessful in their attempt to document a Ramadan effect on
financial markets, our study is the first to utilize this unique attribute of heterogeneity.
The month of Ramadan is perceived as consisting of three parts, equal in length but
different in promised rewards, characteristics, and intensity of worship. The following
Hadith (saying of the prophet Mohamad) documents that:
“The first part [of Ramadan] brings God’s Mercy, the middle of which
brings God’s forgiveness and the last part of which brings emancipation
from hellfire.” (Ibn Khuzaymah, 3: 191)
From a physical point of view, the first days of Ramadan are the hardest on those
fasting as their bodies have to adjust to a new dietary schedule and to nutritional
deprivation during the day. Therefore, it is expected that the early days of Ramadan are
dominated by the physical impact of fasting rather than the spiritual. Dividing our study
of Ramadan over its three parts enables us to isolate the impact of spiritual and religious
experience from the physical effects of fasting.
Additionally, the last third of Ramadan is perceived as the most blessed part
during which Muslims increase their worship and experience of faith. The last ten days of
Ramadan contain the holiest night in the Islamic calendar, Laylat Al-Qadr, the Night of
Destiny, when the Quran was first revealed to the prophet Mohamad. The following
Quran verses document the sanctity of this night:
The Impact of Religious Experience on Financial Markets
10
“97:1 We revealed it [the Quran] on the Night of Destiny.
97:2 And what will explain to thee what the Night of Destiny is?
97:3 The Night of Destiny is better than a thousand months.
97:4 The angels and the Spirit descend therein, by the permission of their Lord,
with all decrees.
97:5 (The night is) Peace until the rising of the dawn.”
(The Holy Quran, 97:1-5)
Muslims believe that it has not been revealed on which of the last ten days of
Ramadan the Night of Destiny falls. Many Muslim scholars and certainly an
overwhelming majority of Muslims believe that the Night of Destiny occurs on one of
last five odd numbered nights of Ramadan, i.e. the 21st, 23
rd, 25
th, 27
th or 29
th of
Ramadan. The following Hadith supports this argument: "Search for the Night of Destiny
in the odd nights of the last ten days of Ramadan” (Bukhari, 3(32): 234). Muslims
experience heightened religious fervor on the eve of these five odd days which they
spend in dedicated worship.
Of these five days, the Night of Destiny is believed by most Muslims to occur on
the eve of Ramadan 27th
. This night witnesses the culmination of faith practice in the
Islamic calendar as Muslims spend it in prayer and Quran recitation in mosques until the
break of dawn. It is also on this night that the gradual daily recital of the whole Quran
over the month of Ramadan concludes. Most television and radio stations in Muslim
countries suspend their usual programming to air live broadcasts of the conclusion of this
recitation from the Grand Mosque in Mecca. Religious experience, and therefore its
impact on financial markets, will be amplified on the more sacred odd days at the end of
Ramadan and culminate on its 27th
day.
Additionally, the differences in the intensity of worship between the last five odd
and even days of Ramadan serve as a natural experiment to isolate the faith effect from

The Impact of Religious Experience on Financial Markets
11
non-faith aspects of Ramadan. The end of Ramadan marks the festival of Eid Al-Fitr
which is one of the two main festivals that Muslims celebrate annually. It is associated
with increased consumer spending, similar to the shopping frenzy during Christmas in
Western countries. If religious experience is indeed affecting financial markets, this
effect should be different in magnitude between the last odd and even five days of
Ramadan, and should culminate on Ramadan 27th
. If, however, the documented effect is
resulting from the increased commercial and economic activity in anticipation of the
festival of Eid Al-Fitr, then it should be equal across the last odd and even five days.
4. Methodology and Data
We estimate the impact of faith on financial markets through running a pooled
fixed effects panel regression across all the examined financial markets. As per Saunders
(1993), we include lagged return variables to account for nonsynchronous trading effects
(see Akgiray, 1989), and day of the week and month of the year dummies to control for
calendar and seasonal regularities. The following regression is estimated to capture the
effect on daily returns:
Reti,t = β0 + β1 Holy_Day i,t + β2 Reti,t-1 + β3 Reti,t-2 + β4 Dt6𝐽=2 + β5 Mt
12𝐽=2 + ε
where:
Reti,t = the arithmetic return of stock exchange i on day t from the trading day
before
Holy_Dayi,t = a dummy variable that takes the value 1 if day t was a holy day in
country i
Reti,t-1 = one day lagged return of stock exchange index i
Reti,t-2 = two day lagged return of stock exchange index i
Dt = day of the week dummy variable with Tuesday omitted
Mt = month of the year dummy variable with June omitted
The Impact of Religious Experience on Financial Markets
12
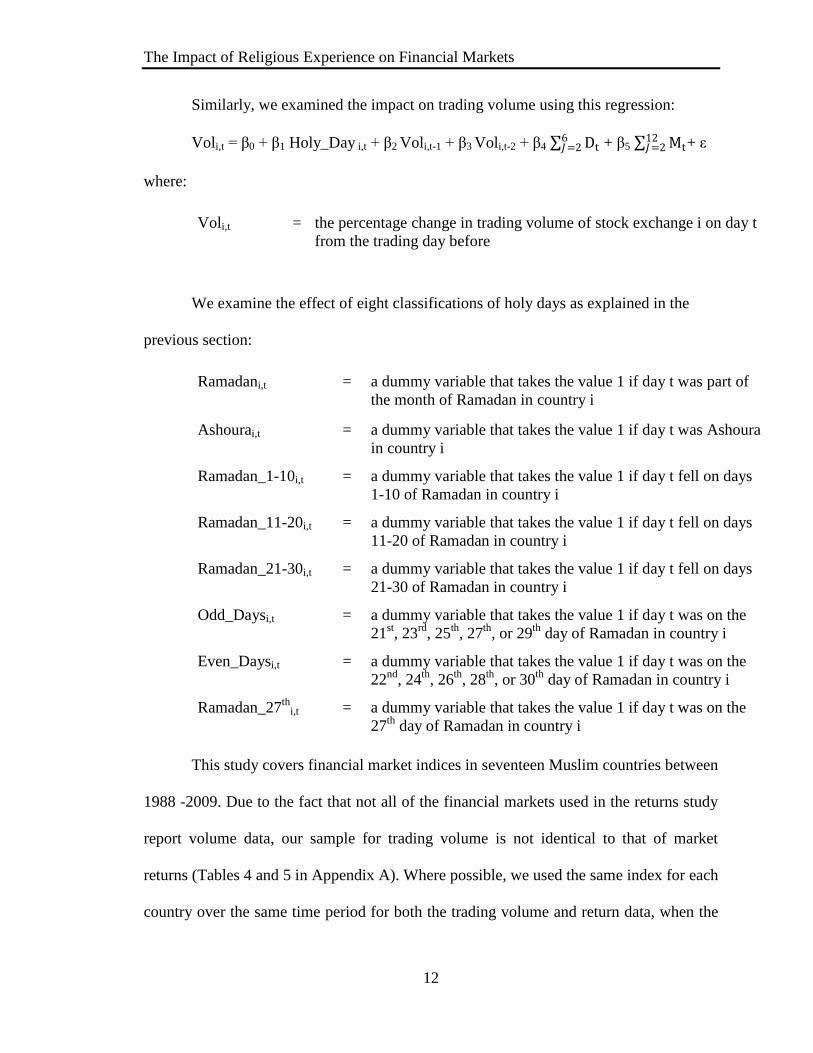
Similarly, we examined the impact on trading volume using this regression:
Voli,t = β0 + β1 Holy_Day i,t + β2 Voli,t-1 + β3 Voli,t-2 + β4 Dt6𝐽=2 + β5 Mt
12𝐽=2 + ε
where:
Voli,t = the percentage change in trading volume of stock exchange i on day t
from the trading day before
We examine the effect of eight classifications of holy days as explained in the
previous section:
Ramadani,t = a dummy variable that takes the value 1 if day t was part of
the month of Ramadan in country i
Ashourai,t = a dummy variable that takes the value 1 if day t was Ashoura
in country i
Ramadan_1-10i,t = a dummy variable that takes the value 1 if day t fell on days
1-10 of Ramadan in country i
Ramadan_11-20i,t = a dummy variable that takes the value 1 if day t fell on days
11-20 of Ramadan in country i
Ramadan_21-30i,t = a dummy variable that takes the value 1 if day t fell on days
21-30 of Ramadan in country i
Odd_Daysi,t = a dummy variable that takes the value 1 if day t was on the
21st, 23
rd, 25
th, 27
th, or 29
th day of Ramadan in country i
Even_Daysi,t = a dummy variable that takes the value 1 if day t was on the
22nd
, 24th
, 26th
, 28th
, or 30th
day of Ramadan in country i
Ramadan_27th
i,t = a dummy variable that takes the value 1 if day t was on the
27th
day of Ramadan in country i
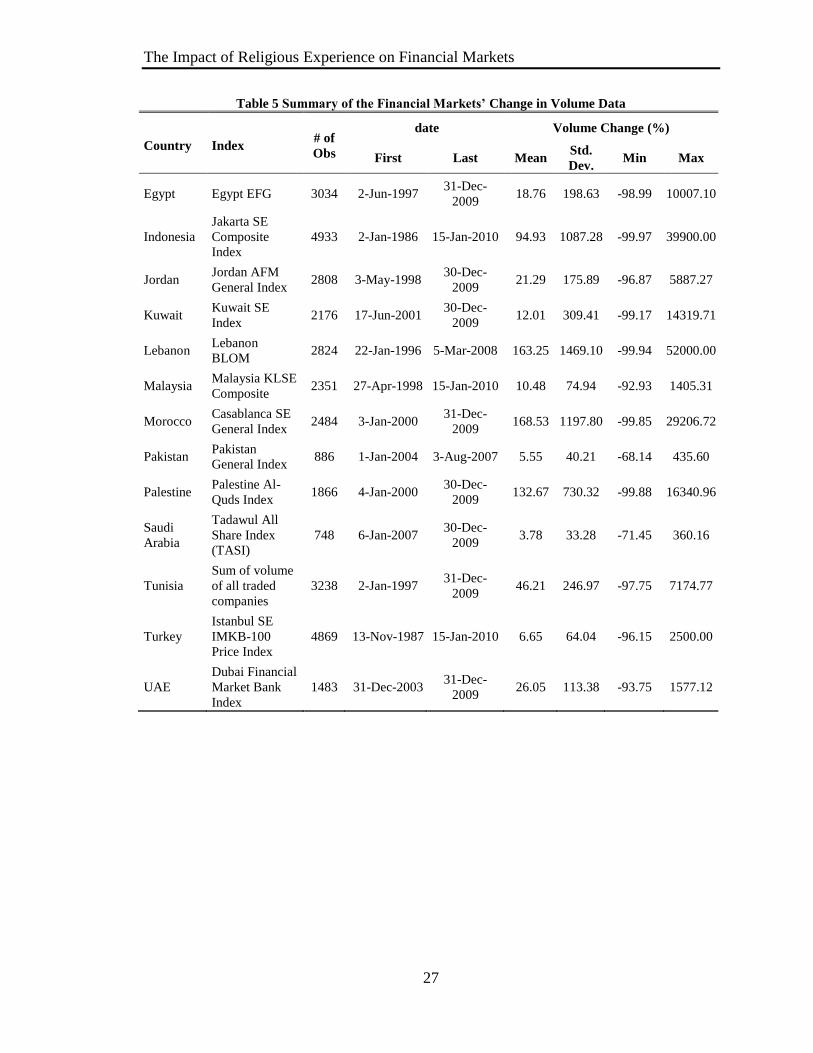
This study covers financial market indices in seventeen Muslim countries between
1988 -2009. Due to the fact that not all of the financial markets used in the returns study
report volume data, our sample for trading volume is not identical to that of market
returns (Tables 4 and 5 in Appendix A). Where possible, we used the same index for each
country over the same time period for both the trading volume and return data, when the

The Impact of Religious Experience on Financial Markets
13
volume data was not available; we used alternative indices that report volume data for
that country. Financial figures are obtained from the databases of Global Financial Data
and Datastream.
The key challenge to conducting this study is converting the Hijri dates for each
country to Gregorian equivalents in order to determine the exact Gregorian date for the
holy days within each country for the time period under investigation. As mentioned in
the previous section, each Muslim country declares the beginning of lunar months and
hence the dates of holy days independently. Moreover, countries generally do not keep
official records of their past lunar month proclamations. Thus, finding each country’s
Hijri/Gregorian date equivalent is labor intensive and challenging. We used microfilms of
official newspapers archives, and formal legislations and decrees from these countries
which often report both Hijri and Gregorian dates to establish the exact Hijri calendar for
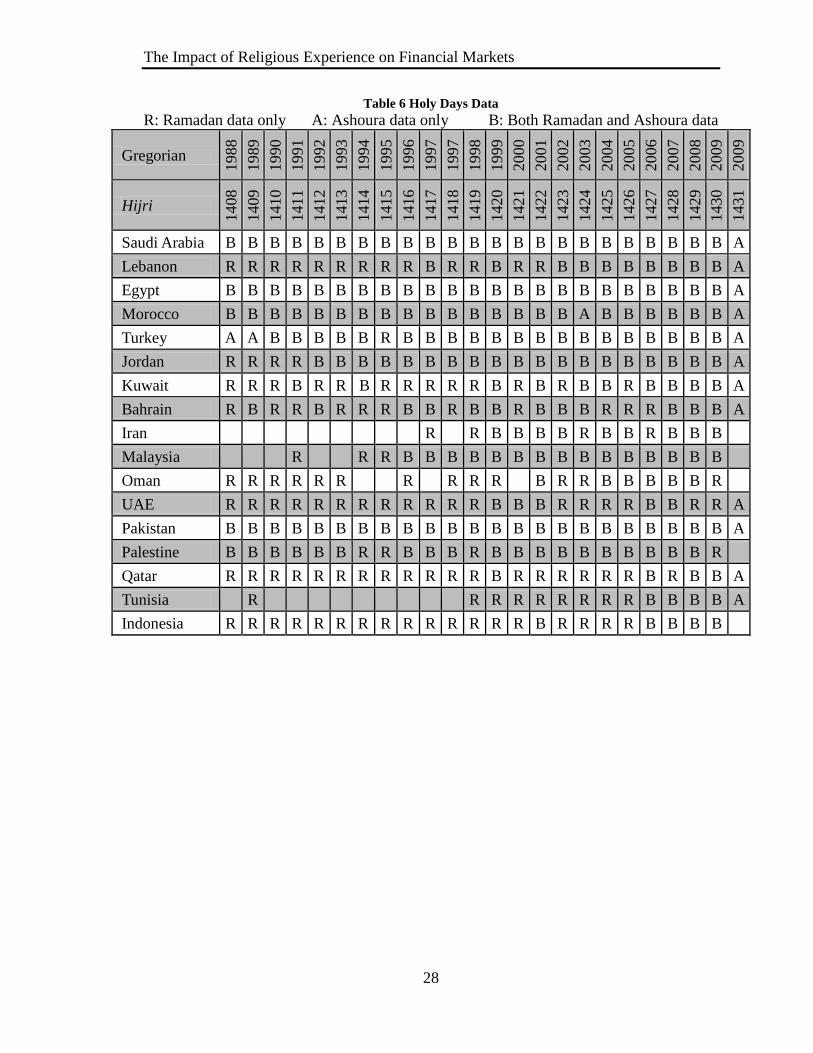
each included country. The only holy day data that was included in this analysis was that
for which we were able to verify the exact Gregorian equivalent. In total, the study
established data spanning 374 individual country holy day data of which: 229 cover both
Ramadan and Ashoura, 130 cover Ramadan only, and 15 cover Ashoura only. Table 6 in
Appendix A lists the specific holy day data obtained for each country.
5. Results
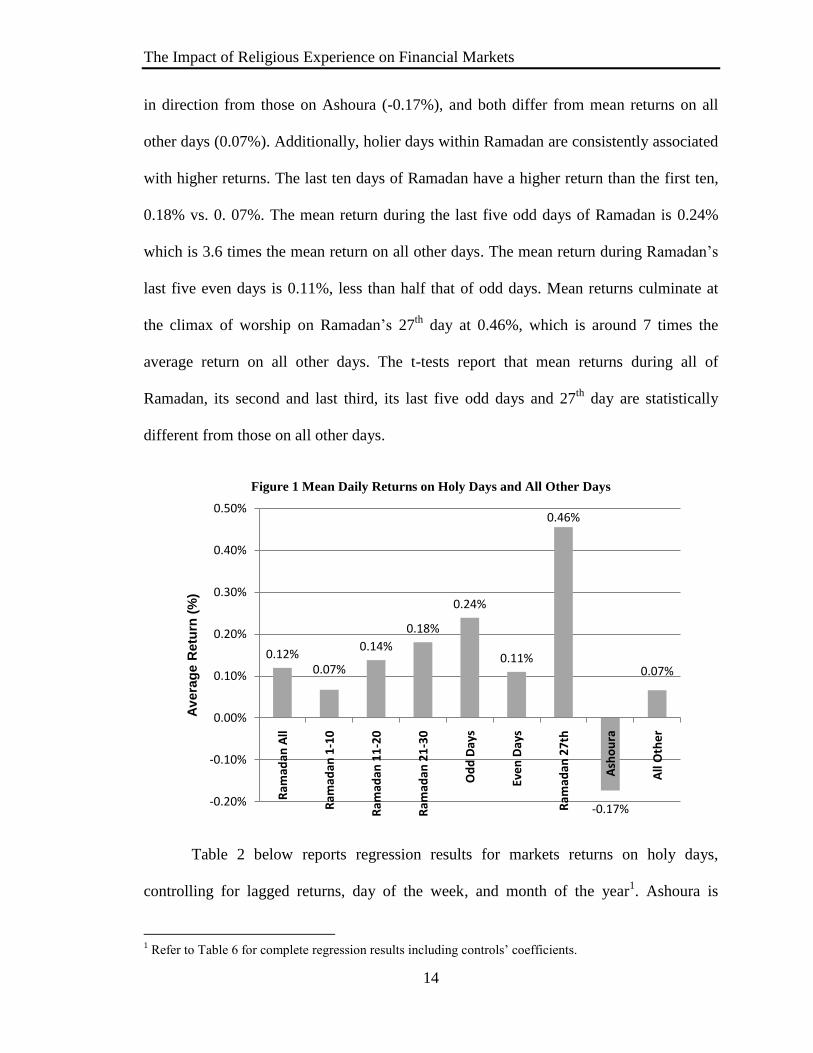
Figure 1 below depicts the mean of daily returns on holy days and all other days
across the pooled financial markets. Table 7 in Appendix A reports these means along
with their descriptive statistics. Consistent with our predictions, returns on holy days
differ from those on all other days. Furthermore, returns during Ramadan (0.12%) differ
The Impact of Religious Experience on Financial Markets
14
in direction from those on Ashoura (-0.17%), and both differ from mean returns on all
other days (0.07%). Additionally, holier days within Ramadan are consistently associated
with higher returns. The last ten days of Ramadan have a higher return than the first ten,
0.18% vs. 0. 07%. The mean return during the last five odd days of Ramadan is 0.24%
which is 3.6 times the mean return on all other days. The mean return during Ramadan’s
last five even days is 0.11%, less than half that of odd days. Mean returns culminate at
the climax of worship on Ramadan’s 27th
day at 0.46%, which is around 7 times the
average return on all other days. The t-tests report that mean returns during all of
Ramadan, its second and last third, its last five odd days and 27th
day are statistically
different from those on all other days.
Figure 1 Mean Daily Returns on Holy Days and All Other Days
Table 2 below reports regression results for markets returns on holy days,
controlling for lagged returns, day of the week, and month of the year1. Ashoura is
1 Refer to Table 6 for complete regression results including controls’ coefficients.
0.12%0.07%
0.14%
0.18%
0.24%
0.11%
0.46%
-0.17%
0.07%
-0.20%
-0.10%
0.00%
0.10%
0.20%
0.30%
0.40%
0.50%
Ram
adan
All
Ram
adan
1-1
0
Ram
adan
11
-20
Ram
adan
21
-30
Od
d D
ays
Eve
n D
ays
Ram
adan
27
th
Ash
ou
ra
All
Oth
er
Av
era
ge R
etu
rn (
%)
The Impact of Religious Experience on Financial Markets
15
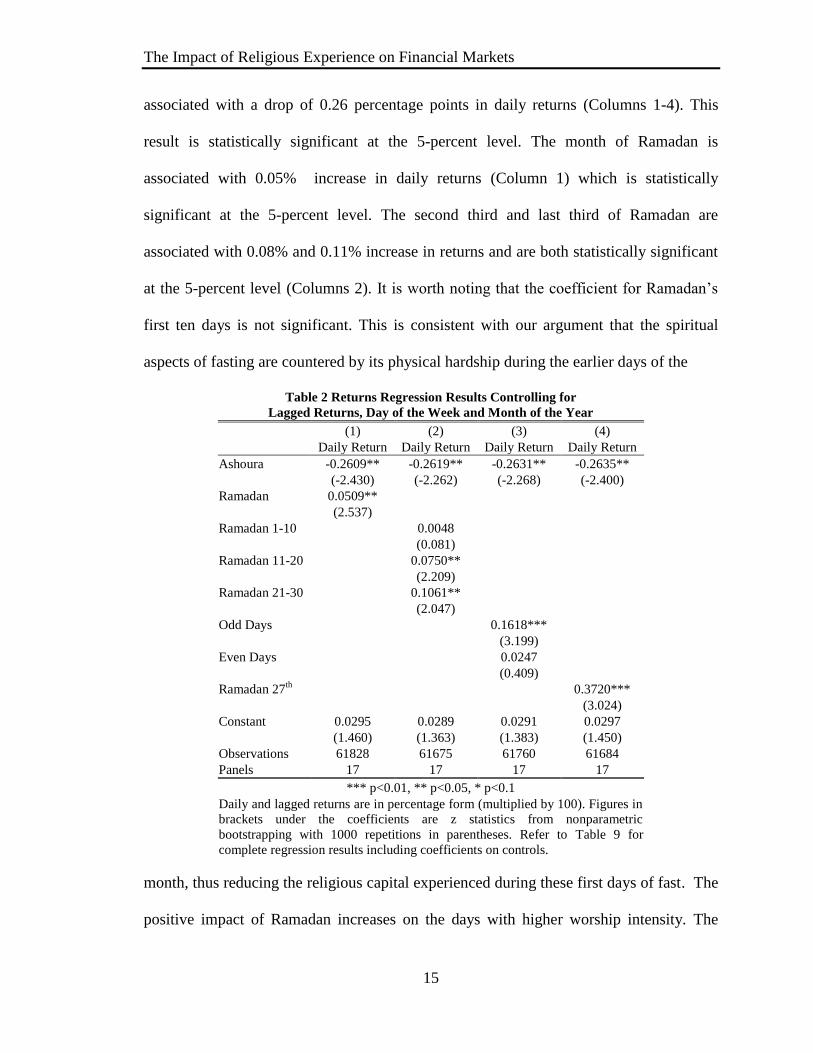
associated with a drop of 0.26 percentage points in daily returns (Columns 1-4). This
result is statistically significant at the 5-percent level. The month of Ramadan is
associated with 0.05% increase in daily returns (Column 1) which is statistically
significant at the 5-percent level. The second third and last third of Ramadan are
associated with 0.08% and 0.11% increase in returns and are both statistically significant
at the 5-percent level (Columns 2). It is worth noting that the coefficient for Ramadan’s
first ten days is not significant. This is consistent with our argument that the spiritual
aspects of fasting are countered by its physical hardship during the earlier days of the
Table 2 Returns Regression Results Controlling for
Lagged Returns, Day of the Week and Month of the Year
(1) (2) (3) (4)
Daily Return Daily Return Daily Return Daily Return
Ashoura -0.2609** -0.2619** -0.2631** -0.2635**
(-2.430) (-2.262) (-2.268) (-2.400)
Ramadan 0.0509**
(2.537)
Ramadan 1-10
0.0048
(0.081)
Ramadan 11-20
0.0750**
(2.209)
Ramadan 21-30
0.1061**
(2.047)
Odd Days
0.1618***
(3.199)
Even Days
0.0247
(0.409)
Ramadan 27th
0.3720***
(3.024)
Constant 0.0295 0.0289 0.0291 0.0297
(1.460) (1.363) (1.383) (1.450)
Observations 61828 61675 61760 61684
Panels 17 17 17 17
*** p<0.01, ** p<0.05, * p<0.1
Daily and lagged returns are in percentage form (multiplied by 100). Figures in
brackets under the coefficients are z statistics from nonparametric
bootstrapping with 1000 repetitions in parentheses. Refer to Table 9 for
complete regression results including coefficients on controls.
month, thus reducing the religious capital experienced during these first days of fast. The
positive impact of Ramadan increases on the days with higher worship intensity. The

The Impact of Religious Experience on Financial Markets
16
daily returns during the last five odd days of Ramadan are 0.16% higher than other days
(Columns 3). This result is highly statistically significant at the 1-percent level.
Interestingly, returns on the last five even days of Ramadan are not statistically
significant (Columns 3). This confirms that the Odd-Days effect is a result of religious
experience, not non-faith aspects of the end of Ramadan, such as increased consumer
spending. The latter would have triggered an equal effect across odd and even days.
Finally, and consistent with our prediction, the holy day effect with the highest
magnitude is the 27th
day of Ramadan which witnesses an increase of 0.37 percentage
points (Columns 4). This result is statistically significant at the 5-percent level.
Figure 2 below shows the mean of change in trading volume on holy days and all
other days across the pooled financial markets. Table 8 in Appendix A reports these
means along with their descriptive statistics. The graph shows that mean changes in
trading volume are less on holy days than all other days, with the exception of Ramadan
27th
. However, the t-test reflects that none of these means is statistically different from
the mean change in trading volume on all other days.
Figure 2 Mean Change in Volume on Holy Days and All Other Days
39% 33% 39%47% 45% 49%
110%
-3%
61%
-20%
0%
20%
40%
60%
80%
100%
120%
Ram
adan
All
Ram
adan
1-1
0
Ram
adan
11-
20
Ram
adan
21-
30
Od
d D
ays
Eve
n D
ays
Ram
adan
27
th
Ash
ou
ra
All
Oth
er
Av
era
ge C
han
ge i
n V
olu
me (
%)
The Impact of Religious Experience on Financial Markets
17
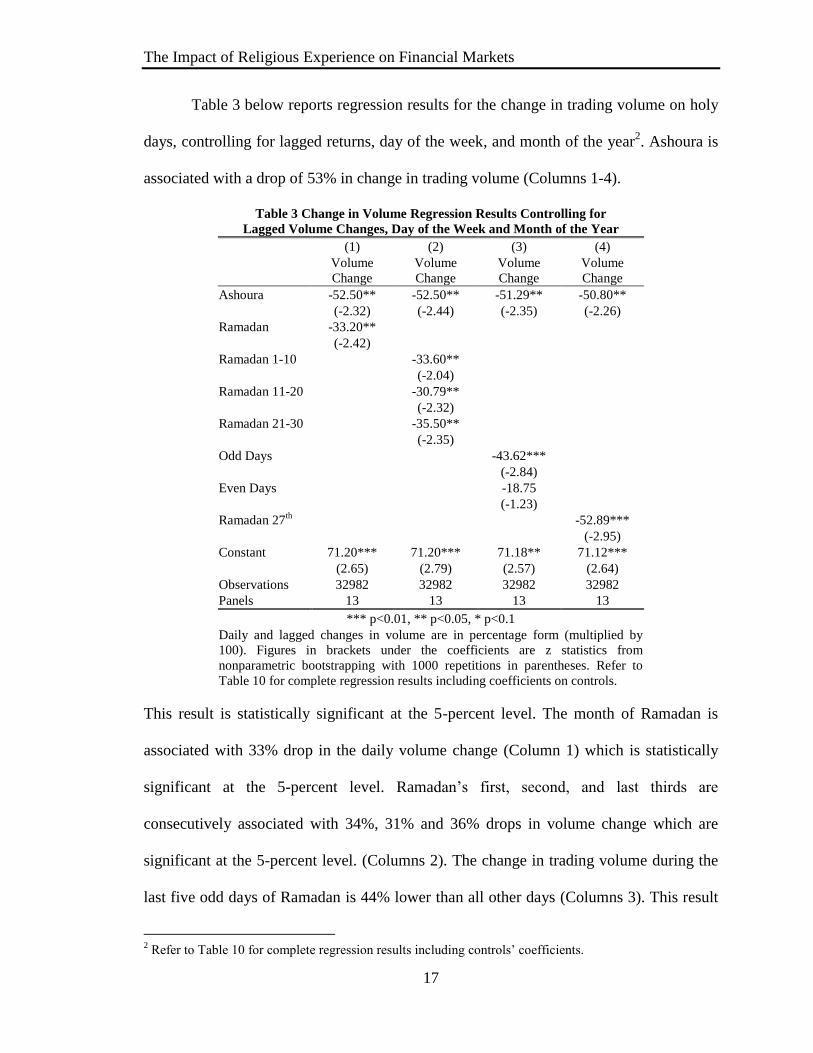
Table 3 below reports regression results for the change in trading volume on holy
days, controlling for lagged returns, day of the week, and month of the year2. Ashoura is
associated with a drop of 53% in change in trading volume (Columns 1-4).
Table 3 Change in Volume Regression Results Controlling for
Lagged Volume Changes, Day of the Week and Month of the Year
(1) (2) (3) (4)
Volume
Change
Volume
Change
Volume
Change
Volume
Change
Ashoura -52.50** -52.50** -51.29** -50.80**
(-2.32) (-2.44) (-2.35) (-2.26)
Ramadan -33.20**
(-2.42)
Ramadan 1-10
-33.60**
(-2.04)
Ramadan 11-20
-30.79**
(-2.32)
Ramadan 21-30
-35.50**
(-2.35)
Odd Days
-43.62***
(-2.84)
Even Days
-18.75
(-1.23)
Ramadan 27th
-52.89***
(-2.95)
Constant 71.20*** 71.20*** 71.18** 71.12***
(2.65) (2.79) (2.57) (2.64)
Observations 32982 32982 32982 32982
Panels 13 13 13 13
*** p<0.01, ** p<0.05, * p<0.1
Daily and lagged changes in volume are in percentage form (multiplied by
100). Figures in brackets under the coefficients are z statistics from
nonparametric bootstrapping with 1000 repetitions in parentheses. Refer to
Table 10 for complete regression results including coefficients on controls.
This result is statistically significant at the 5-percent level. The month of Ramadan is
associated with 33% drop in the daily volume change (Column 1) which is statistically
significant at the 5-percent level. Ramadan’s first, second, and last thirds are
consecutively associated with 34%, 31% and 36% drops in volume change which are
significant at the 5-percent level. (Columns 2). The change in trading volume during the
last five odd days of Ramadan is 44% lower than all other days (Columns 3). This result
2 Refer to Table 10 for complete regression results including controls’ coefficients.

The Impact of Religious Experience on Financial Markets
18
is highly statistically significant at the 1-percent level. Interestingly, change in trading
volume on the last five even days of Ramadan are not statistically significant (Columns
3). This is consistent with our finding in the returns’ regression, thus confirming that the
underlying driver of these results on holy days is religious experience. Finally, the change
in trading volume decreases 53% on Ramadan’s holiest day, Ramadan 27th
(Columns 4).
This result is statistically significant at the 1-percent level.
6. Discussion of the Results and their Underlying Processes:
This study has focused on the outcome of faith experience on financial markets
not the processes through which this outcome is achieved. Yet, a discussion of potential
processes using the insights drawn from the above results is in order. Aside from a divine
intervention, which is clearly well beyond the earthly confines of this paper, two channels
can lead to the statistically significant impact of holy days on market returns. The first
channel is that holy days alter the composition of stock market participants due to
potentially reduced trading activity by religiously observant investors on holy days. The
second channel is that the heightened faith experience on holy days affects the mood of
investors, thus affecting their decision making process and risk assessment. This mood
explanation is consistent with a number of studies that have linked mood to changes in
stock market returns. These studies are presented in the literature review section of this
paper.
The first channel predicts that, on average, trading volume would decrease as a
result of the absence of religiously observant investors on holy days. Furthermore, it
would predict that the absence of these investors would either cause a unidirectional
The Impact of Religious Experience on Financial Markets
19
impact on returns across the different holy days if religious investors share a common
risk assessment, or that their absence would not affect market returns if they do not share
a common risk perception that is different from other investors. Consistent with the first
prediction, our results show a decrease in trading volume on holy days, which lends
support to the first cause.
However, while there is a statistically significant impact on returns on holy days,
the impact is not unidirectional across different holy days. The returns increase on
Ramadan holy days, and decrease on Ashoura. This finding lends support to the second
channel in which faith experience affects market returns through its impact on the mood
of investors and therefore their risk assessment. Previous research on emotions
documented the influence of emotional states on cognitive processes such as information
processing (Tiedens & Linton, 2001) and risk perceptions (Lerner and Keltner, 2001;
Isen, Nygren & Ashby, 1988). Furthermore, research has gone beyond the valence of the
emotions to study the impact of the appraisal content of those emotions. The Appraisal-
tendency-Framework, (ATF) posits that “specific emotions give rise to specific cognitive
and motivational processes, which account for the effects of each emotion upon judgment
and decision making” (Han, Lerner, & Keltner, 2007). Given that Ramadan and Ashoura
differ from each other in the emotions they evoke in religious observers, our results can
be driven by the underlying process highlighted by the ATF.
Ashoura is dominated by negative emotion such as sadness. It is well established
that negative mood distorts peoples’ perceptions and judgments towards greater
negativity (e.g., Carson & Adams, 1980; Cunningham, 1988; Gorn, Goldberg, & Basu,
1993; Johnson & Tversky, 1983; Mayer, Gaschke, Braverman, & Evans, 1992; Wright &

The Impact of Religious Experience on Financial Markets
20
Bower, 1992).3 Studies have documented that subjects that were induced with negative
emotions made more accurate judgments without consideration to whether the outcomes
were desired or not (e.g., Alloy and Abramson, 1979, Alloy, Abramson, and Viscusi,
1981; Alloy and Abramson, 1982), and were less likely to underestimate the probability
of negative events, or to overestimate the possibility of positive ones (Alloy and Ahrens,
1987). Such subjects were also less likely to perceive the world as under their control
when it is, instead, subject to exogenous forces (Golin, Terrell, and Johnson, 1977), and
were less likely to overestimate their own abilities in ambiguous task situations
(Tabachnik, Crocker, and Alloy, 1983)4.
Conversely, Ramadan is associated with positive emotions such as purity and
happiness for observing the fast and intensified worship requirements especially during
its holiest days. Johnson and Tversky (1983) found that inducing subjects with positive
affect led them to believe that positive events will occur more frequently, and that
negative events will occur less frequently than a control group. Happiness is associated
with appraisals of elevated certainty and individual control (Smith & Ellsworth, 1985).
Happy subjects are more optimistic in their risk assessment (Lerner and Keltner, 2001),
and felt more certain in subsequent situations (Tiedens and Linton, 2001).
Therefore, there is evidence supporting both the changing market composition
channel and the moods one. The decreased volume on Ashoura and Ramdan supports the
changed market composition hypothesis, while the finding that returns move in different
3 Raghunathan, R., & Pham, M. T. (1999). All negative moods are not equal: Motivational influences of
anxiety and sadness on decision making. Organizational Behavior and Human Decision Processes, 79, 57. 4 Staw, B., Barsade, S., (1993). Affect and Managerial Performance: A Test of the Sadder-but-Wiser vs.
Happier-and-Smarter Hypotheses. Administrative Science Quarterly, 38, pp. 304-331.
The Impact of Religious Experience on Financial Markets
21
directions on these two holy days backs the moods channel. It is our hope that by
illuminating this faith experience effect, future research will be conducted to disentangle
the channels through which it operates.
7. Conclusion
This study examines the impact of religious experience on financial markets. It
investigates the effect of the Muslim holy days of Ramadan and Ashoura on the daily
returns of seventeen Muslim financial markets over a period of twenty one years. While
both are important religious occasions, they differ from each other in the valence of
emotions that worshippers experience. Additionally, these holy days are designated using
the Muslim Hijri lunar calendar which enables us to avoid potential seasonal effects. The
fact that Muslim countries differ from each other in the methods used to establish the
beginnings of lunar months enables us to lessen the impact of contemporaneous events
and cross market linkages. The study utilizes the heterogeneity of worship intensity
within the month of Ramadan, such as the special religious significance of its last five
odd days, to validate that the measured effects are a result of the religious experiences not
material commercial effects. The latter would trigger an equal effect during Ramadan’s
last five even days.
The study finds that religious experiences are associated with a statistically
significant change in mean daily returns. The effect of religious experience is not
unidirectional as Ramadan’s most sacred days yield a positive impact on returns, while
Ashoura is associated with a negative one. Ramadan’s more sacred days are associated
with a higher magnitude effect culminating on the most sacred day in the Islamic
calendar, Ramadan 27th
. Our results show that while Ramadan’s last five odd days have a
The Impact of Religious Experience on Financial Markets
22
positive significant impact, their even counterparts do not attain significance. This
reinforces our argument that the documented effect is a result of religious experience, not
other non-religious aspects of the holy day. The latter would have resulted in non-
differentiated results across Ramadan’s last ten days which are only different from each
other in their religious significance.

The Impact of Religious Experience on Financial Markets
23
References
Abadir, K., Spierdijk, L., (2005). The Festivity Effect And Liquidity Constraints: A Test
On Countries With Different Calendars. Memorandum 1772, Department of
Applied Mathematics, University of Twente, Enschede. ISSN 0169-2690.
Akgiray V., (1989). Conditional Heteroscedasticity In Time Series Of Stock Returns:
Evidence And Forecasts. The Journal of Business, 62(1), pp.55-80.
Alloy, L., Abramson, L.,(1979). Judgment Of Contingency In Depressed And
Nondepressed Students: Sadder But Wiser? Journal of Experimental Psychology:
General, 108, pp. 441-485.
Alloy, L., Abramson, L., (1982). Learned Helplessness, Depression And The Illusion Of
Control. Journal of Personality and Social Psychology, 42, pp. 1114-1126.
Alloy, L., Ahrens, A., (1987). Depression And Pessimism For The Future: Biased Use Of
Statistically Relevant Information In Predictions For Self Versus Others. Journal
of Personality and Social Psychology, 52, pp. 366-378.
Alloy, L., Abramson, L., Viscusi, D., (1981). Induced Mood And The Illusion Of
Control. Journal of Personality and Social Psychology, 41, pp. 1129-1140.
Amihud Y. and Mendelson H., (1987). Trading Mechanisms And Stock Returns: An
Empirical Investigation. Journal of Finance, 42, pp. 533-553.
Bagozzi, R., Mahesh G., and Prashanth N., (1999). The Role Of Emotions In Marketing.
Journal of the Academy of Marketing Science, 27, pp. 184-206.
Bukhari Vol.3, Book 32. Translated by Khan, M.
URL: http://www.scribd.com/doc/2463581/Sahih-Bukhari-Vol-3, accessed on
April 17, 2009
Carson, T. , Adams, H., (1980). Activity Valence As A Function Of Mood Change.
Journal of Abnormal Psychology, 89, pp. 368-377.
Clingingsmith, D., Khwaja, A., and Kremer, M., (2008). The Impact of the Hajj: Religion
and Tolerance in Islam's Global Gathering. Quarterly Journal of Economics, 124
(3), pp. 1133-1170.
Cunningham, M. (1988). What Do You Do When You Are Unhappy Or Blue? Mood,
Expectancies, And Behavior. Motivation and Emotion, 12, pp. 309-331.
Frieder, L. and Subrahmanyam, A., (2004). Nonsecular Regularities in Returns and
Volume. Financial Analysts Journal, 60(4), pp. 29-34.
The Impact of Religious Experience on Financial Markets
24
Global Financial Data, URL: (https://www.globalfinancialdata.com).
Golin, S., Terrell, F., Johnson, B., (1977). Depression And The Illusion Of Control.
Journal of Abnormal Psychology, 86, pp. 440-442.
Gorn, G., Goldberg, M., Basu, K., (1993). Mood, awareness, and product evaluation.
Journal of Consumer Psychology, 2, pp. 237-256.
Han, S., Lerner, J., Keltner D., (2007). Feelings And Consumer Decision Making: The
Appraisal-Tendency Framework. Journal of Consumer Psychology, 17 (3),
pp.158-68.
Hirshleifer, D. and Shumway T., (2003). Good Day Sunshine: Stock Returns And The
Weather. The Journal of Finance, 58(3), pp. 1009-1032.
Husain, F. (1998). A Seasonality In The Pakistani Equity Market: The Ramadhan Effect.
The Pakistan Development Review, 1(37), pp. 77-81.
Iannaccone, L., (1998). Introduction To The Economics Of Religion. Journal of
Economic Literature, 36, pp. 1465-1495.
Ibn Khuzaymah, Al-Sahih, vol. 3.
Jacobs, B. and Levy, K., (1988). Calendar Anomalies: Abnormal Returns At Calendar
Turning Points. Financial Analysts Journal, 44(6), pp. 28-39.
Johnson, E. J., and Tversky A., (1983). Affect, Generalization, And The Perception Of
Risk. Journal of Personality and Social Psychology, 45, pp. 20-31.
Kamstra, M. , Kramer L., and Levi M., (2000), Losing Sleep At The Market: The Day-
Light-Savings Anomaly. American Economic Review, 90, pp. 1005-1011.
Kamstra, M. , Kramer L., and Levi M., (2003). Winter Blues: A SAD Stock Market
Cycle. The American Economic Review, 93(1), pp. 324-343.
Lakonishok, J. & Schmidt, S., (1988). Are Seasonal Anomalies Real? A Ninety Year
Perspective, The Review of Financial Studies, 1, pp. 403-425.
Lerner, J., Keltner, D., (2001). Fear, Anger, and Risk. Journal of Personality and Social
Psychology, 81(1), pp. 146-15.
Loewenstein, G., Elke U., Hsee C., and Welch N., (2001). Risk as feelings. Psychological
Bulletin, 127, pp. 267-286.
Mayer, J., Gaschke, Y., Braverman, D., Evans, T., (1992). Mood-Congruent Judgment Is
A General Effect. Journal of Personality and Social Psychology, 63, pp. 119-132.

The Impact of Religious Experience on Financial Markets
25
McCleary, R., (2007). Salvation, Damnation, and Economic Incentives. Journal of
Contemporary Religion, 22(1), pp. 49-74.
Raghunathan, R., & Pham, M. T. (1999). All negative moods are not equal: Motivational
influences of anxiety and sadness on decision making. Organizational Behavior
and Human Decision Processes, 79, pp. 56-77.
Saunders, E., Jr., (1993) Stock Prices And Wall Street Weather. American Economic
Review, 83, pp. 1337-1345.
Seyyed, F., Abraham, A., Al-Hajji, M., (2005). Seasonality In Stock Returns And
Volatility: The Ramadan Effect. Research in International Business and Finance,
19(3), pp. 374-383.
Smith, C., Ellsworth, P., (1985). Patterns Of Cognitive Appraisal In Emotion. Journal of
Personality and Social Psychology, 48, pp. 813-838.
Staw, B., Barsade, S., (1993). Affect and Managerial Performance: A Test of the Sadder-
but-Wiser vs. Happier-and-Smarter Hypotheses. Administrative Science
Quarterly, 38, pp. 304-331.
Tabachnik, N., Crocker, J., Alloy, L.,(1983). Depression, Social Comparison, And The
False-Consensus Effect. Journal of Personality and Social Psychology, 45, pp.
688-699.
Thaler R., (1987). Anomalies. Seasonal Movements In Security Prices II: Weekend,
Holiday, Turn Of The Month, And Intraday Effects. The Journal of Economic
Perspectives, 1( 2), pp. 169-177.
Tiedens, L., Linton, S., (2001). Judgment Under Emotional Certainty And Uncertainty:
The Effects Of Specific Emotions On Information Processing. Journal of
Personality & Social Psychology, 81, pp. 973-988.
Weber, M., (1930). The Protestant Ethic And The Spirit Of Capitalism (New York:
Scribner's).
Wright, W., Bower, G., (1992). Mood Effects On Subjective Probability Assessment.
Organizational Behavior and Human Decision Processes, 52, pp. 276-291.

The Impact of Religious Experience on Financial Markets
26
Appendix A
Table 4 Summary of the Financial Markets’ Returns Data
Country Index # of
Obs
date Return (%)
First Last Mean Std. Dev. Min Max
Bahrain Bahrain 3443 2-Jan-1991 30-Dec-
2004 0.0326 0.5521 -5.2058 6.4997
Egypt Cairo SE EFG
General Index 4268 31-Dec-1992
31-Dec-
2009 0.0673 2.1549 -98.9782 14.5471
Indonesia
Jakarta SE
Composite
Index
5889 2-Jan-1986 30-Dec-
2009 0.0772 1.7866 -20.1695 49.6449
Iran
Tehran SE
Price Index
(TEPIX)
3591 1-Jan-1995 6-Jan-2010 0.0787 0.7294 -9.5271 14.9518
Jordan Jordan AFM
General Index 4402 31-Dec-1991
30-Dec-
2009 0.0439 1.0084 -4.7358 5.2220
Kuwait Kuwait SE
Index 2872 10-Mar-1998
31-Dec-
2009 0.0404 0.9072 -4.6649 5.1764
Lebanon Beirut Stock
Exchange Index 3243 22-Jan-1996
30-Dec-
2009 0.0291 1.6039 -10.1366 23.4456
Malaysia Malaysia KLSE
Composite 5912 2-Jan-1986
31-Dec-
2009 0.0409 1.5271 -21.4578 23.1427
Morocco Casablanca SE
General Index 1669 1-Feb-1995
31-Dec-
2001 0.0362 0.5477 -3.1984 4.5598
Oman
Muscat Stock
Market General
Index
3946 1-Jan-1994 31-Dec-
2009 0.0500 1.1209 -12.6810 16.4422
Pakistan
Pakistan
Karachi SE-100
Index
4874 2-Jan-1989 31-Dec-
2009 0.0711 1.6148 -12.3775 13.6124
Palestine Palestine Al-
Quds Index 2208 12-Apr-1999
25-Nov-
2009 0.1002 2.9637 -49.7949 89.9490
Qatar Qatar SE Index 2422 12-Sep-1999 31-Dec-
2009 0.0792 1.5274 -8.9346 9.8801
Saudi
Arabia
Saudi Arabia
Tadawul SE
Index
4481 29-Jan-1994 30-Dec-
2009 0.0330 1.3357 -9.8130 9.8459
Tunisia Tunisia Indice
BVM 2694 12-Jan-1998 6-Jan-2009 0.0587 0.8107 -4.6235 5.2725
Turkey
Istanbul SE
IMKB-100
Price Index
5526 2-Nov-1987 31-Dec-
2009 0.2028 2.9336 -18.1093 35.6044
UAE
United Arab
Emirates SE
Index
1198 28-Apr-2003 2-Sep-2008 0.1584 2.9584 -36.9123 59.1919
The Impact of Religious Experience on Financial Markets
27
Table 5 Summary of the Financial Markets’ Change in Volume Data
Country Index # of
Obs
date Volume Change (%)
First Last Mean Std.
Dev. Min Max
Egypt Egypt EFG 3034 2-Jun-1997 31-Dec-
2009 18.76 198.63 -98.99 10007.10
Indonesia
Jakarta SE
Composite
Index
4933 2-Jan-1986 15-Jan-2010 94.93 1087.28 -99.97 39900.00
Jordan Jordan AFM
General Index 2808 3-May-1998
30-Dec-
2009 21.29 175.89 -96.87 5887.27
Kuwait Kuwait SE
Index 2176 17-Jun-2001
30-Dec-
2009 12.01 309.41 -99.17 14319.71
Lebanon Lebanon
BLOM 2824 22-Jan-1996 5-Mar-2008 163.25 1469.10 -99.94 52000.00
Malaysia Malaysia KLSE
Composite 2351 27-Apr-1998 15-Jan-2010 10.48 74.94 -92.93 1405.31
Morocco Casablanca SE
General Index 2484 3-Jan-2000
31-Dec-
2009 168.53 1197.80 -99.85 29206.72
Pakistan Pakistan
General Index 886 1-Jan-2004 3-Aug-2007 5.55 40.21 -68.14 435.60
Palestine Palestine Al-
Quds Index 1866 4-Jan-2000
30-Dec-
2009 132.67 730.32 -99.88 16340.96
Saudi
Arabia
Tadawul All
Share Index
(TASI)
748 6-Jan-2007 30-Dec-
2009 3.78 33.28 -71.45 360.16
Tunisia
Sum of volume
of all traded
companies
3238 2-Jan-1997 31-Dec-
2009 46.21 246.97 -97.75 7174.77
Turkey
Istanbul SE
IMKB-100
Price Index
4869 13-Nov-1987 15-Jan-2010 6.65 64.04 -96.15 2500.00
UAE
Dubai Financial
Market Bank
Index
1483 31-Dec-2003 31-Dec-
2009 26.05 113.38 -93.75 1577.12
The Impact of Religious Experience on Financial Markets
28
Table 6 Holy Days Data
R: Ramadan data only A: Ashoura data only B: Both Ramadan and Ashoura data
Gregorian
1988
1989
1990
1991
1992
1993
1994
1995
1996
1997
1997
1998
1999
2000
2001
2002
2003
2004
2005
2006
2007
2008
2009
2009
Hijri
1408
1409
1410
1411
1412
1413
1414
1415
1416
1417
1418
1419
1420
1421
1422
1423
1424
1425
1426
1427
1428
1429
1430
1431
Saudi Arabia B B B B B B B B B B B B B B B B B B B B B B B A
Lebanon R R R R R R R R R B R R B R R B B B B B B B B A
Egypt B B B B B B B B B B B B B B B B B B B B B B B A
Morocco B B B B B B B B B B B B B B B B A B B B B B B A
Turkey A A B B B B B R B B B B B B B B B B B B B B B A
Jordan R R R R B B B B B B B B B B B B B B B B B B B A
Kuwait R R R B R R B R R R R R B R B R B B R B B B B A
Bahrain R B R R B R R R B B R B B R B B B R R R B B B A
Iran
R
R B B B B R B B R B B B
Malaysia
R
R R B B B B B B B B B B B B B B B
Oman R R R R R R
R
R R R
B R R B B B B B R
UAE R R R R R R R R R R R R B B B R R R R B B R R A
Pakistan B B B B B B B B B B B B B B B B B B B B B B B A
Palestine B B B B B B R R B B B R B B B B B B B B B B R
Qatar R R R R R R R R R R R R B R R R R R R B R B B A
Tunisia
R
R R R R R R R R B B B B A
Indonesia R R R R R R R R R R R R R R B R R R R B B B B

The Impact of Religious Experience on Financial Markets
29
Table 7 Mean of Daily Returns on Holy Days and All Other Days
Obs Mean
(%)
Std. Dev.
(%)
Min (%) Max
(%)
t-test
Ramadan All 4978 0.120 1.803 -32.305 49.702 2.1173**
(0.0342)
Ramadan 1-10 1743 0.059 1.693 -12.326 19.451 0.0238
(0.9810)
Ramadan 11-20 1748 0.133 2.183 -32.305 49.702 1.7136*
(0.0866 )
Ramadan 21-30 1490 0.178 1.386 -8.727 16.190 2.5633**
(0.0104)
Odd_Days 788 0.239 1.474 -8.256 16.190 2.7869***
(.0053)
Even_Days 702 0.110 1.279 -8.727 8.017 0.7957
(0.4262)
Ramadan_27th 162 0.456 1.509 -2.830 15.145 2.9497***
(0.0032)
Ashoura 99 -0.173 1.684 -6.583 4.792 1.4025
(0.1608)
All Other Days 56821 0.066 1.697 -98.978 89.949
Notes: “Obs” denote the number of observations used to compute the mean and other statistics.
“Ramadan All” refers to the mean daily return during the whole month of Ramadan, “Ramadan
1-10” refers to the mean daily return during the first ten days of Ramadan, “Ramadan 11-20”
refers to the mean daily return during the middle ten days of Ramadan, “Ramadan 21-30”
refers to the mean daily return during the last ten days of Ramadan, “Odd Days” refers to the
mean daily return during the odd last ten days of Ramadan, “Even Days” refers to the mean
daily return during the even last ten days of Ramadan, “Ramadan 27th
” refers to the mean daily
return on the 27th
day of Ramadan, “Ashoura” refers to the mean daily return on the day of
Ashoura, “All Other” refers to the mean daily return on all day other than Ramadan and
Ashoura. “t-test” refers to the t-test that the mean of returns on the specific holy day are not
different from the mean of returns on all other days other than Ashoura and Ramadan. Figures
in brackets under the “t-test” denote the two sided p-value for the t-test.

The Impact of Religious Experience on Financial Markets
30
Table 8 Mean of Change in Volume on Holy Days and All Other Days
Obs
Mean
(%)
Std. Dev.
(%) Min (%) Max (%) t-test
Ramadan All 2730 39.35 267.82 -99.60 8774.40 1.5027
(0.1329)
Ramadan 1-10 945 33.50 188.15 -98.54 3102.41 1.1292
(0.2588)
Ramadan 11-20 959 38.64 244.32 -99.60 6175.00 0.9239
(0.3555)
Ramadan 21-30 827 46.82 356.64 -99.24 8774.40 0.5427
(0.5874)
Odd_Days 435 45.14 445.74 -99.24 8774.40 0.4406
(0.6595)
Even_Days 392 48.68 219.46 -98.08 2138.07 0.3252
(0.7450)
Ramadan_27th 95 109.60 902.00 -98.20 8774.40
0.6392
(0.5227)
Ashoura 60 -2.54 48.36 -93.27 240.13 0.6586
(0.5101)
All Other Days 30564 60.95 746.73 -99.97 52000.00
Notes: “Obs” denote the number of observations used to compute the mean and other statistics.
“Ramadan All” refers to the mean daily change in volume during the whole month of Ramadan,
“Ramadan 1-10” refers to the mean daily change in volume during the first ten days of Ramadan,
“Ramadan 11-20” refers to the mean daily change in volume during the middle ten days of
Ramadan, “Ramadan 21-30” refers to the mean daily change in volume during the last ten days
of Ramadan, “Odd Days” refers to the mean daily change in volume during the odd last ten days
of Ramadan, “Even Days” refers to the mean daily change in volume during the even last ten
days of Ramadan, “Ramadan 27th
” refers to the mean daily change in volume on the 27th
day of
Ramadan, “Ashoura” refers to the mean daily change in volume on the day of Ashoura, “All
Other” refers to the mean daily change in volume on all day other than Ramadan and Ashoura.
“t-test” refers to the t-test that the mean of change in volume on the specific holy day are not
different from the mean of change in volume on all other days. Figures in brackets under the “t-
test” denote the two sided p-value for the t-test.
The Impact of Religious Experience on Financial Markets
31
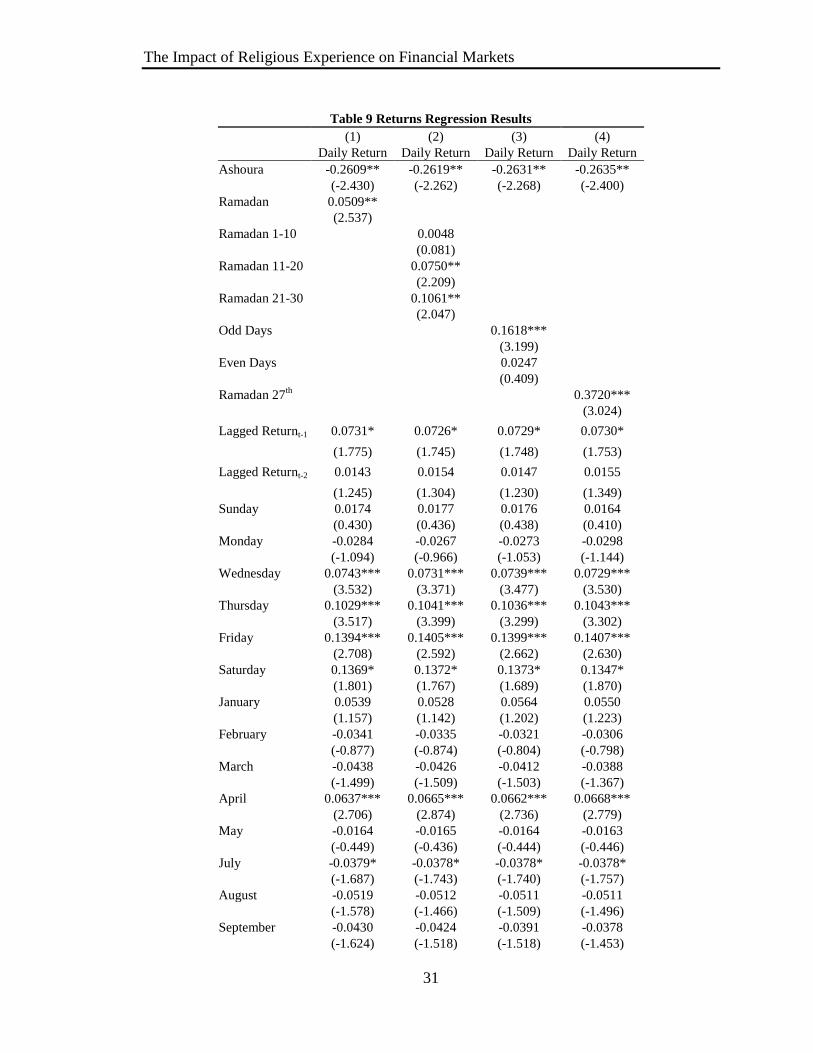
Table 9 Returns Regression Results
(1) (2) (3) (4)
Daily Return Daily Return Daily Return Daily Return
Ashoura -0.2609** -0.2619** -0.2631** -0.2635**
(-2.430) (-2.262) (-2.268) (-2.400)
Ramadan 0.0509**
(2.537)
Ramadan 1-10
0.0048
(0.081)
Ramadan 11-20
0.0750**
(2.209)
Ramadan 21-30
0.1061**
(2.047)
Odd Days
0.1618***
(3.199)
Even Days
0.0247
(0.409)
Ramadan 27th
0.3720***
(3.024)
Lagged Returnt-1 0.0731* 0.0726* 0.0729* 0.0730*
(1.775) (1.745) (1.748) (1.753)
Lagged Returnt-2 0.0143 0.0154 0.0147 0.0155
(1.245) (1.304) (1.230) (1.349)
Sunday 0.0174 0.0177 0.0176 0.0164
(0.430) (0.436) (0.438) (0.410)
Monday -0.0284 -0.0267 -0.0273 -0.0298
(-1.094) (-0.966) (-1.053) (-1.144)
Wednesday 0.0743*** 0.0731*** 0.0739*** 0.0729***
(3.532) (3.371) (3.477) (3.530)
Thursday 0.1029*** 0.1041*** 0.1036*** 0.1043***
(3.517) (3.399) (3.299) (3.302)
Friday 0.1394*** 0.1405*** 0.1399*** 0.1407***
(2.708) (2.592) (2.662) (2.630)
Saturday 0.1369* 0.1372* 0.1373* 0.1347*
(1.801) (1.767) (1.689) (1.870)
January 0.0539 0.0528 0.0564 0.0550
(1.157) (1.142) (1.202) (1.223)
February -0.0341 -0.0335 -0.0321 -0.0306
(-0.877) (-0.874) (-0.804) (-0.798)
March -0.0438 -0.0426 -0.0412 -0.0388
(-1.499) (-1.509) (-1.503) (-1.367)
April 0.0637*** 0.0665*** 0.0662*** 0.0668***
(2.706) (2.874) (2.736) (2.779)
May -0.0164 -0.0165 -0.0164 -0.0163
(-0.449) (-0.436) (-0.444) (-0.446)
July -0.0379* -0.0378* -0.0378* -0.0378*
(-1.687) (-1.743) (-1.740) (-1.757)
August -0.0519 -0.0512 -0.0511 -0.0511
(-1.578) (-1.466) (-1.509) (-1.496)
September -0.0430 -0.0424 -0.0391 -0.0378
(-1.624) (-1.518) (-1.518) (-1.453)

The Impact of Religious Experience on Financial Markets
32
October -0.0635*** -0.0651*** -0.0597*** -0.0583***
(-2.875) (-2.882) (-2.672) (-2.816)
November -0.0507* -0.0525* -0.0470 -0.0431
(-1.712) (-1.754) (-1.559) (-1.563)
December 0.0464 0.0443 0.0497 0.0525
(1.228) (1.195) (1.277) (1.418)
Constant 0.0295 0.0289 0.0291 0.0297
(1.460) (1.363) (1.383) (1.450)
Observations 61828 61675 61760 61684
Panels 17 17 17 17
*** p<0.01, ** p<0.05, * p<0.1
Daily returns and lagged ones are in percentage form (multiplied by 100).
Figures in brackets under the coefficients are z statistics from nonparametric
bootstrapping with 1000 repetitions in parentheses.
The Impact of Religious Experience on Financial Markets
33
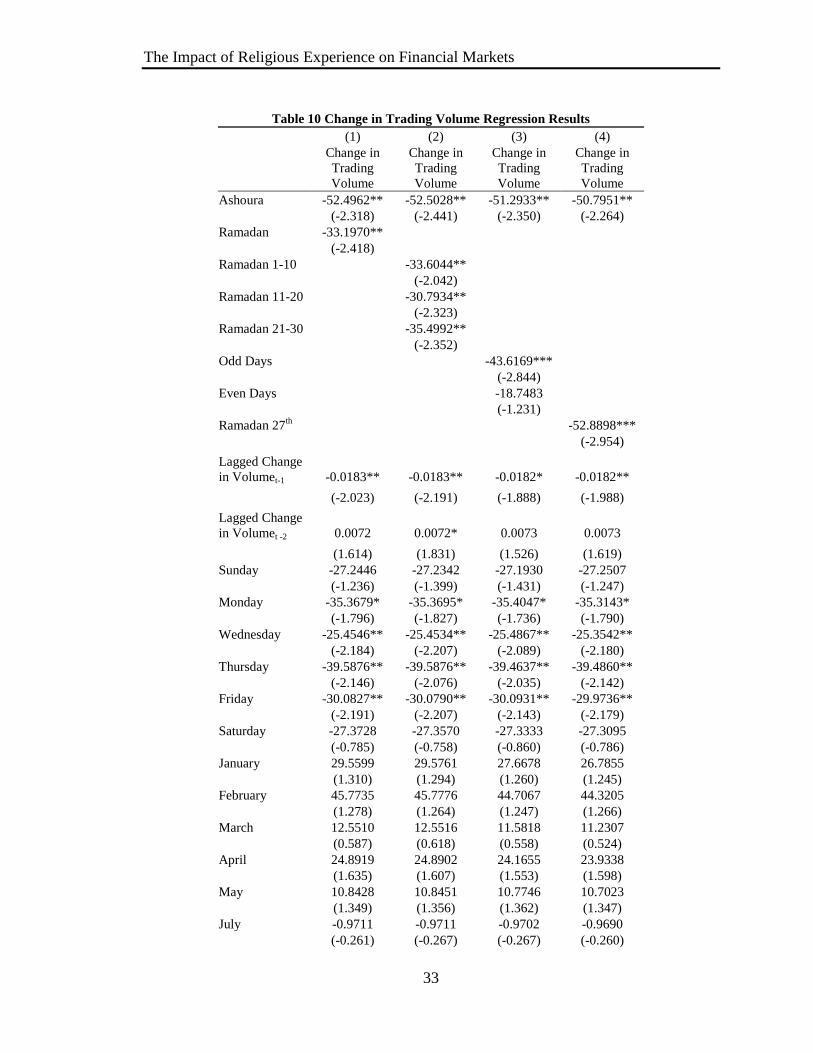
Table 10 Change in Trading Volume Regression Results
(1) (2) (3) (4)
Change in
Trading
Volume
Change in
Trading
Volume
Change in
Trading
Volume
Change in
Trading
Volume
Ashoura -52.4962** -52.5028** -51.2933** -50.7951**
(-2.318) (-2.441) (-2.350) (-2.264)
Ramadan -33.1970**
(-2.418)
Ramadan 1-10
-33.6044**
(-2.042)
Ramadan 11-20
-30.7934**
(-2.323)
Ramadan 21-30
-35.4992**
(-2.352)
Odd Days
-43.6169***
(-2.844)
Even Days
-18.7483
(-1.231)
Ramadan 27th
-52.8898***
(-2.954)
Lagged Change
in Volumet-1 -0.0183** -0.0183** -0.0182* -0.0182**
(-2.023) (-2.191) (-1.888) (-1.988)
Lagged Change
in Volumet -2 0.0072 0.0072* 0.0073 0.0073
(1.614) (1.831) (1.526) (1.619)
Sunday -27.2446 -27.2342 -27.1930 -27.2507
(-1.236) (-1.399) (-1.431) (-1.247)
Monday -35.3679* -35.3695* -35.4047* -35.3143*
(-1.796) (-1.827) (-1.736) (-1.790)
Wednesday -25.4546** -25.4534** -25.4867** -25.3542**
(-2.184) (-2.207) (-2.089) (-2.180)
Thursday -39.5876** -39.5876** -39.4637** -39.4860**
(-2.146) (-2.076) (-2.035) (-2.142)
Friday -30.0827** -30.0790** -30.0931** -29.9736**
(-2.191) (-2.207) (-2.143) (-2.179)
Saturday -27.3728 -27.3570 -27.3333 -27.3095
(-0.785) (-0.758) (-0.860) (-0.786)
January 29.5599 29.5761 27.6678 26.7855
(1.310) (1.294) (1.260) (1.245)
February 45.7735 45.7776 44.7067 44.3205
(1.278) (1.264) (1.247) (1.266)
March 12.5510 12.5516 11.5818 11.2307
(0.587) (0.618) (0.558) (0.524)
April 24.8919 24.8902 24.1655 23.9338
(1.635) (1.607) (1.553) (1.598)
May 10.8428 10.8451 10.7746 10.7023
(1.349) (1.356) (1.362) (1.347)
July -0.9711 -0.9711 -0.9702 -0.9690
(-0.261) (-0.267) (-0.267) (-0.260)

The Impact of Religious Experience on Financial Markets
34
August -5.2267 -5.2194 -5.8290 -5.8259
(-0.419) (-0.453) (-0.473) (-0.463)
September 21.8155 21.7794 17.3591 16.2274
(1.192) (1.221) (0.972) (0.924)
October 30.2941 30.2781 25.1176 23.6539
(1.223) (1.236) (1.064) (1.037)
November 19.6442 19.6461 14.9928 13.2138
(0.839) (0.891) (0.682) (0.604)
December 23.2416* 23.2606* 19.8170* 18.4203*
(1.935) (1.946) (1.814) (1.733)
Constant 71.1993*** 71.1982*** 71.1811** 71.1215***
(2.653) (2.792) (2.573) (2.642)
Observations 32982 32982 32982 32982
Panels 13 13 13 13
*** p<0.01, ** p<0.05, * p<0.1
Daily changes in trading volume and lagged ones are in percentage form
(multiplied by 100). Figures in brackets under the coefficients are z statistics
from nonparametric bootstrapping with 1000 repetitions in parentheses.