The Impact of Printing Substrate on Dot Deformation in ...
7
Tehnički vjesnik 25, Suppl. 2(2018), 509-515 509 ISSN 1330-3651 (Print), ISSN 1848-6339 (Online) https://doi.org/10.17559/TV-20170710152140 Preliminary communication The Impact of Printing Substrate on Dot Deformation in Flexography Petar MILJKOVIĆ, Dean VALDEC, Mile MATIJEVIĆ Abstract: This study characterizes and compares the dot properties in flexography on coated and uncoated paper and on OPP film, with the use of conventional AM screening technology and photopolymer plate with flat top dots. A monochrome test form was created and printed with cyan ink on three different printing substrates. For the study of the dot deformation, microscopic images were taken from the prints and analyzed using ImageJ software. The primary area of the study are highlight tones since the reproduction of small dots is synonymous with high quality reproduction. All significant parameters of the dot deformation were evaluated, including the dot geometry, dot sharpness and uniformity of density. The image analysis showed that dot deformation is the result of spreading and penetration of the ink. The microscopic snapshots of the test areas on the prints show that ink penetrates significantly into the pores and holes of the uncoated paper, resulting in a non-homogeneous dot, thus losing its original shape. On coated paper and OPP film, the ink spreads more on the surface of the printing substrate and in such way gives a more homogeneous dot shape. Keywords: dot deformation; flexography; ink spreading; printing substrate 1 INTRODUCTION Flexography is a high-speed printing technology for various printing substrates mainly used in packaging industry [1]. Getting a quality print in flexography is conditioned by the optimal ratio of all variable parameters. For this reason, it is very important to characterize the entire process by applying scientific and professional methods to ensure that the print is consistent, repeatable and conforms to the standard. The whole process consists of a large number of variables that affect the ink transfer and dot deformation. This refers to the photopolymer platemaking, the characteristics of the printing substrate and the ink as well as the printing process conditions. The characterization of the dot deformation on the print on various printing substrates is important to improve the quality of the reproduction, and it is strongly dependent on the properties of the printing substrate. In this way, with the appropriately set system, the dot deformation can be minimized, which is the most important parameter for enabling high quality printing, repeatability of the process and the overall quality of the graphic product. Dot deformation is a term that refers to the quality of halftone dots, such as dot sharpness, edge smoothness, and uniformity of the density across dots, as influenced by different characteristic of printing process [2]. During the printing process, the flexographic plate is subjected to mechanical deformation, which depends primarily on the characteristics of the printing plate, printing pressure and the surface structure of the substrate. In the previous papers the dot deformation was analyzed with regard to the top dot shape: round and flat top dot. A simple approach using raster image analysis showed that printing pressure in the interaction with the different top dot shape affects the dot deformation [3]. Previous research also found that the pressure between printing plate and impression cylinder has the most significant influence on mechanical dot deformation and thereby on print quality [4]. The pressure in the printing nip and the porosity of the substrate are conditions and properties that will regulate the amount of ink that penetrates into a porous coating structure [5]. The lightest pressure or "kiss impression" is ideal for printing. Kiss impression is a clean print image created while applying the lowest value of pressure possible with the plate against the paper [6]. However, if the pressure is too low, some details in the highlight area might not be transferred onto the substrate. A higher impression might produce smudged ink around the edges of the printed areas. On the other hand, if the pressure is too high, dots will be squeezed more and can be deformed [7]. This research was focused on dot deformation in the highlight area affected by different types of printing substrate. The first objective was to study how the various substrate surfaces affect dot deformation including dot sharpness and dot circularity. The second objective was to research the influence of printing substrate on the uniformity of density across the dot. Accordingly, this paper is a continuation of a series of research aimed at defining the optimal qualitative parameters in the flexographic process with the aim of increasing the quality of reproduction in high light tones. Figure 1 Research framework 2 EXPERIMENTAL METHODOLOGY The next chapter describes the methodology of research and the influence of the printing surface (flat top dots shape of the photopolymer plate) on the dot deformation in three types of printing substrates with the aim of comparing the qualitative parameters of the Compare print quality and optimization of production process Dot deformation parameters Uniformity of density Dot sharpness Dot circularity Measurement process Capture images Image analysis Flexographic printing - Printing substrate Uncoated paper Coated paper OPP Film Digital platemaking - Photopolimer plate Flat Top Dots 150 lpi Circular Dot Shape
Transcript of The Impact of Printing Substrate on Dot Deformation in ...
Tehnički vjesnik 25, Suppl. 2(2018), 509-515 509
ISSN 1330-3651 (Print), ISSN 1848-6339 (Online) https://doi.org/10.17559/TV-20170710152140 Preliminary communication
The Impact of Printing Substrate on Dot Deformation in Flexography
Petar MILJKOVIĆ, Dean VALDEC, Mile MATIJEVIĆ
Abstract: This study characterizes and compares the dot properties in flexography on coated and uncoated paper and on OPP film, with the use of conventional AM screening technology and photopolymer plate with flat top dots. A monochrome test form was created and printed with cyan ink on three different printing substrates. For the study of the dot deformation, microscopic images were taken from the prints and analyzed using ImageJ software. The primary area of the study are highlight tones since the reproduction of small dots is synonymous with high quality reproduction. All significant parameters of the dot deformation were evaluated, including the dot geometry, dot sharpness and uniformity of density. The image analysis showed that dot deformation is the result of spreading and penetration of the ink. The microscopic snapshots of the test areas on the prints show that ink penetrates significantly into the pores and holes of the uncoated paper, resulting in a non-homogeneous dot, thus losing its original shape. On coated paper and OPP film, the ink spreads more on the surface of the printing substrate and in such way gives a more homogeneous dot shape. Keywords: dot deformation; flexography; ink spreading; printing substrate 1 INTRODUCTION
Flexography is a high-speed printing technology for various printing substrates mainly used in packaging industry [1].
Getting a quality print in flexography is conditioned by the optimal ratio of all variable parameters. For this reason, it is very important to characterize the entire process by applying scientific and professional methods to ensure that the print is consistent, repeatable and conforms to the standard.
The whole process consists of a large number of variables that affect the ink transfer and dot deformation. This refers to the photopolymer platemaking, the characteristics of the printing substrate and the ink as well as the printing process conditions.
The characterization of the dot deformation on the print on various printing substrates is important to improve the quality of the reproduction, and it is strongly dependent on the properties of the printing substrate. In this way, with the appropriately set system, the dot deformation can be minimized, which is the most important parameter for enabling high quality printing, repeatability of the process and the overall quality of the graphic product.
Dot deformation is a term that refers to the quality of halftone dots, such as dot sharpness, edge smoothness, and uniformity of the density across dots, as influenced by different characteristic of printing process [2].
During the printing process, the flexographic plate is subjected to mechanical deformation, which depends primarily on the characteristics of the printing plate, printing pressure and the surface structure of the substrate.
In the previous papers the dot deformation was analyzed with regard to the top dot shape: round and flat top dot. A simple approach using raster image analysis showed that printing pressure in the interaction with the different top dot shape affects the dot deformation [3].
Previous research also found that the pressure between printing plate and impression cylinder has the most significant influence on mechanical dot deformation and thereby on print quality [4]. The pressure in the printing nip and the porosity of the substrate are conditions and properties that will regulate the amount of ink that penetrates into a porous coating structure [5].
The lightest pressure or "kiss impression" is ideal for printing. Kiss impression is a clean print image created while applying the lowest value of pressure possible with the plate against the paper [6]. However, if the pressure is too low, some details in the highlight area might not be transferred onto the substrate. A higher impression might produce smudged ink around the edges of the printed areas. On the other hand, if the pressure is too high, dots will be squeezed more and can be deformed [7].
This research was focused on dot deformation in the highlight area affected by different types of printing substrate. The first objective was to study how the various substrate surfaces affect dot deformation including dot sharpness and dot circularity. The second objective was to research the influence of printing substrate on the uniformity of density across the dot.
Accordingly, this paper is a continuation of a series of research aimed at defining the optimal qualitative parameters in the flexographic process with the aim of increasing the quality of reproduction in high light tones.
Figure 1 Research framework
2 EXPERIMENTAL METHODOLOGY
The next chapter describes the methodology of
research and the influence of the printing surface (flat top dots shape of the photopolymer plate) on the dot deformation in three types of printing substrates with the aim of comparing the qualitative parameters of the
Compare print quality and optimization of production process
Dot deformation parametersUniformity of density Dot sharpness Dot circularity
Measurement processCapture images Image analysis
Flexographic printing - Printing substrateUncoated paper Coated paper OPP Film
Digital platemaking - Photopolimer plateFlat Top Dots 150 lpi Circular Dot Shape
Petar MILJKOVIĆ et al.: The Impact of Printing Substrate on Dot Deformation in Flexography
510 Technical Gazette 25, Suppl. 2(2018), 509-515
reproduction and optimization of the production process. The research framework that describes the purpose and the research process is shown in Fig. 1. 2.1 Preparation of the Test Image
The experimental part of this paper begins with the
design of a test form created to enable the evaluation of the quality of the reproduction by applying the acceptable and validated scientific methods and research techniques.
The test form is monochromatic and consists of three identical test images envisaged for different line rulings (133 lpi, 150 lpi and 175 lpi), as shown in Fig. 2. These line rulings are selected because they are most commonly used in flexography and are typical for printing on the selected types of substrate. In addition to line rulings, other screen settings have been defined: conventional AM screening method with circular dot shape, screen angle 37,5° and resolution 2400 dpi. The result of rasterization is a 1-bit tiff document used in the digital flexo polymer platemaking phase.
Figure 2 Single colour test image
The test image consists of the following elements:
Measuring patches from 0÷100% in 10% increments including the characteristic values in highlight areas
elements for evaluation of the text size (from 2 to 12pt) and line thickness (from 0,01 to 1,28 mm) in positive and negative
three linear gradients from 0÷10% with a different minimum dot size and continuous tone image with characteristic vignettes for the visual evaluation.
2.2 Digital Flexoplate Making
The flexographic photopolymer printing plate used for
this research was Kodak Flexcel NX Digital Plate (hardness acc. to DIN 53505, Shore A is 73, plate thickness 1,14 mm).
The photopolymer plate was made using the advanced Kodak Flexcel NX technology [8], and it is characteristic for its flat top dot on the printing plate (Fig. 3). For photopolymer platemaking, this technology does not need to apply a compensation (bump) curve because it is the result of the entire process of producing a printing plate with linear tonal values.
Due to the pressure on flat top dot the pressure force is uniformly distributed over the entire printing surface, allowing a more uniform ink film.
The previous research has shown that such a top dot shape requires light printing pressure, enabling high-quality ink transfer from the printing plate to the printing substrate [3]. The light pressure is the lowest possible pressure whereby the ink from all the printing surfaces is transferred to the printing substrate. The result is a print on
which there are no visible blank spaces (unprinted areas) that are characteristic of printing pressure that is too low.
Figure 3 Flat top dot profile
2.3 Press
The polymer plate is mounted on the plate cylinder of
the commercial six-color flexo printing machine Nilpeter FB4200, and the printing is performed according to the "roll-to-roll" principle at a press speed of 60 m/min. According to line ruling and minimum dot size, the anilox roller line screen is determined [9].
During the printing process a substrate passes between plate and impression cylinder. The space between them must be optimal to give the proper printing pressure [10].
Printing specification: Flexo printing machine: Nilpeter FB4200 Flexo ink: PULSE SLM 318 UV cyan Printing width: 330 mm Printing length: 490,00 mm Anilox line count: 405 lpi Anilox cell volume: 3,1 BCM Substrate: uncoated paper, coated paper, film.
The printing experiment is envisaged so that the
printing plate with three different line screens is printed with cyan UV ink on three different printing substrates, while the other parameters are kept constant, including the press speed and the printing pressure, as well as the characteristics of self-adhesive tape and anilox rollers. Cyan UV ink was used during the experiment, as it traditionally provides good adhesion on films and has low odour content. However, in the measurement and visual evaluation, only the test prints at 150 lpi were used for the purpose of directing research towards the influence of the printing substrates on the quality of reproduction, which is the topic of this research.
Specification of three selected printing substrates: Uncoated, white, machine-finished label paper
HERMAwhite (601), grammage 72 g/m2, opacity 83%.
White label paper, semi-gloss coated on one side HERMA extra coat (242) grammage 80 g/m2, opacity 86%, surface gloss 30%.
White, high gloss, opaque OPP label film Treofan DECOR – LWD, thickness 38 μm, unit weight 23,5 g/m2, opacity 82%, gloss 65%.
In order to compare the research results, it is essential
that the printing experiment is performed under controlled conditions. Each of the selected types of printing substrates
Petar MILJKOVIĆ et al.: The Impact of Printing Substrate on Dot Deformation in Flexography
Tehnički vjesnik 25, Suppl. 2(2018), 509-515 511
belongs to a separate qualitative group with respect to their properties. The measured CIELCH values for cyan on the prints for three groups of printing substrate are the basis for matching with the target values, i.e. the defined tolerance limits according to ISO 12647-6. Matching with this standard is based on hue difference ∆hab. 2.4 Evaluation of Test Prints
Evaluation of the reproduction quality for advanced
flat top dots technology is conducted in line with ISO standard. All the gained indicators will give an answer as to the applicability and harmonization of the existing standard with new technologies. The new gained knowledge will complement the research up to date.
Uncoated paper Coated paper OPP Film
2%
5%
10%
20%
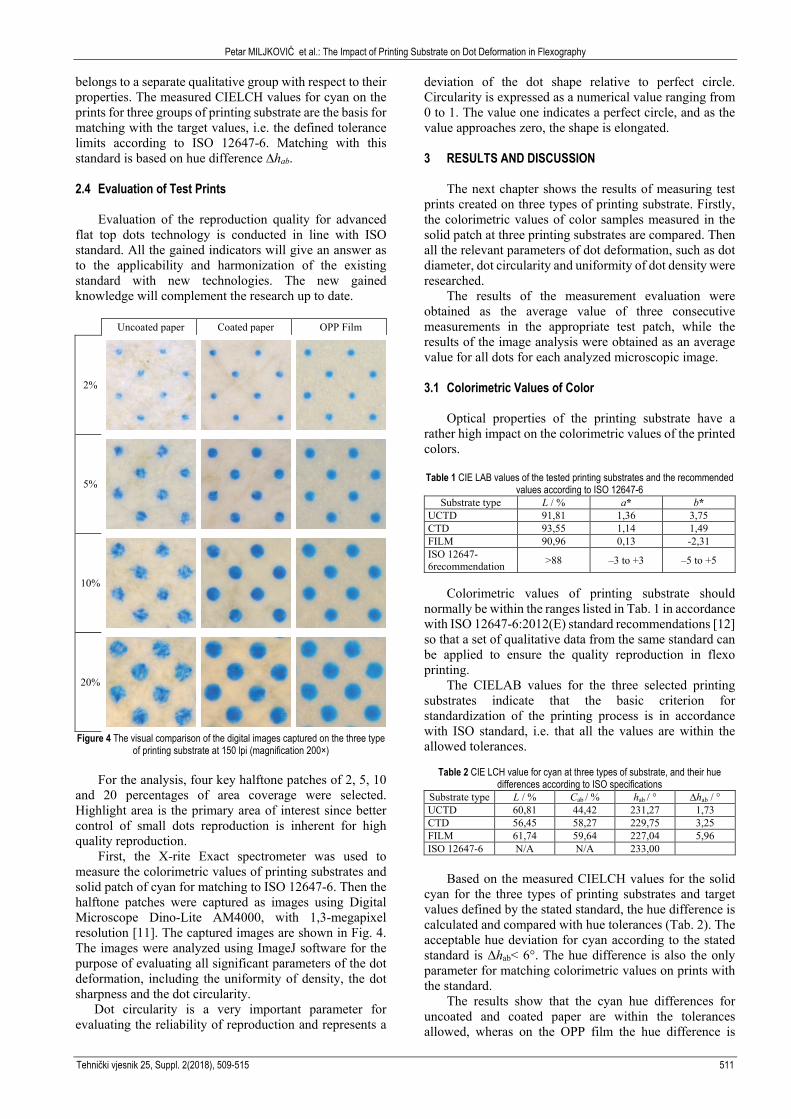
Figure 4 The visual comparison of the digital images captured on the three type
of printing substrate at 150 lpi (magnification 200×) For the analysis, four key halftone patches of 2, 5, 10
and 20 percentages of area coverage were selected. Highlight area is the primary area of interest since better control of small dots reproduction is inherent for high quality reproduction.
First, the X-rite Exact spectrometer was used to measure the colorimetric values of printing substrates and solid patch of cyan for matching to ISO 12647-6. Then the halftone patches were captured as images using Digital Microscope Dino-Lite AM4000, with 1,3-megapixel resolution [11]. The captured images are shown in Fig. 4. The images were analyzed using ImageJ software for the purpose of evaluating all significant parameters of the dot deformation, including the uniformity of density, the dot sharpness and the dot circularity.
Dot circularity is a very important parameter for evaluating the reliability of reproduction and represents a
deviation of the dot shape relative to perfect circle. Circularity is expressed as a numerical value ranging from 0 to 1. The value one indicates a perfect circle, and as the value approaches zero, the shape is elongated. 3 RESULTS AND DISCUSSION
The next chapter shows the results of measuring test
prints created on three types of printing substrate. Firstly, the colorimetric values of color samples measured in the solid patch at three printing substrates are compared. Then all the relevant parameters of dot deformation, such as dot diameter, dot circularity and uniformity of dot density were researched.
The results of the measurement evaluation were obtained as the average value of three consecutive measurements in the appropriate test patch, while the results of the image analysis were obtained as an average value for all dots for each analyzed microscopic image.
3.1 Colorimetric Values of Color
Optical properties of the printing substrate have a
rather high impact on the colorimetric values of the printed colors.
Table 1 CIE LAB values of the tested printing substrates and the recommended
values according to ISO 12647-6 Substrate type L / % a* b*
UCTD 91,81 1,36 3,75 CTD 93,55 1,14 1,49 FILM 90,96 0,13 -2,31 ISO 12647-6recommendation >88 –3 to +3 –5 to +5
Colorimetric values of printing substrate should
normally be within the ranges listed in Tab. 1 in accordance with ISO 12647-6:2012(E) standard recommendations [12] so that a set of qualitative data from the same standard can be applied to ensure the quality reproduction in flexo printing.
The CIELAB values for the three selected printing substrates indicate that the basic criterion for standardization of the printing process is in accordance with ISO standard, i.e. that all the values are within the allowed tolerances.
Table 2 CIE LCH value for cyan at three types of substrate, and their hue
differences according to ISO specifications Substrate type L / % Cab / % hab / ° ∆hab / ° UCTD 60,81 44,42 231,27 1,73 CTD 56,45 58,27 229,75 3,25 FILM 61,74 59,64 227,04 5,96 ISO 12647-6 N/A N/A 233,00
Based on the measured CIELCH values for the solid
cyan for the three types of printing substrates and target values defined by the stated standard, the hue difference is calculated and compared with hue tolerances (Tab. 2). The acceptable hue deviation for cyan according to the stated standard is Δhab< 6°. The hue difference is also the only parameter for matching colorimetric values on prints with the standard.
The results show that the cyan hue differences for uncoated and coated paper are within the tolerances allowed, wheras on the OPP film the hue difference is
Petar MILJKOVIĆ et al.: The Impact of Printing Substrate on Dot Deformation in Flexography
512 Technical Gazette 25, Suppl. 2(2018), 509-515
above the upper limit and amounts to Δhab = 5.96°. Such values show exactly the opposite from the assumptions that the largest deviations will be on uncoated paper due to its relatively poor surface properties compared to other printing substrates. Therefore, it can be concluded that the hue difference (Δhab) is not the appropriate criterion for the quality of the reproduction, but only a parameter that shows whether the reproduction quality is acceptable or not. The quality of the reproduction in print related to hue (H*) according to ISO 12647-6 is relatively easy to achieve, and since there are no defined printing substrate groups, nor other colorimetric values of process colors, there is no significant application in standardization of the production processes.
3.2 Dot Geometry
The change of the dot size under the influence of
different printing substrates is shown by means of dot diameter and corresponding area coverage. Depending on increase in tonal value, the dot diameter increases. It is important to note that the values obtained by method of image analysis completely eliminate the optical deformation, i.e. they show only the geometric dot deformation.
Previous studies show that total Tone Value Increase (TVI) is higher on uncoated paper compared to the remaining two printing substrates [13]. Results of research [14] also show that ink distribution is strongly affected by surface roughness, differences in pore size and pore size distribution. However, according to the results of this study, the geometric deformation, i.e. the physical dot gain, is considerably higher on the OPP film and on the coated paper than on the uncoated paper (Tab. 3). The physical dot gain is calculated as the difference between the measured area coverage on the print and the nominal value of the coresponding test patch.
Table 3 The average values of measurements for the three different substrate
type at 150 lpi Nominal
size Substrate
type Coverages
/ % Dot diameter
/ µm PhysDG
/ %
2% UCTD 4,6 36 2,6 CTD 5,1 40 3,1 FILM 5,3 41 3,3
5% UCTD 8,2 56 3,2 CTD 9,1 61 4,1 FILM 9,4 62 4,4
10% UCTD 12,3 67 2,3 CTD 14,4 73 4,4 FILM 14,9 77 4,9
20% UCTD 22,1 93 2,1 CTD 25,6 101 5,6 FILM 26,1 105 6,1
The difference in geometric dot deformation on
uncoated paper compared to the other two printing substrates increases with increasing area coverage and ranges from 0,5% to 4%. Consequently, the dot diameter is changed. This change compared to uncoated paper is approximately from 4 μm at 2% area coverage up to 12 μm at 20% area coverage.
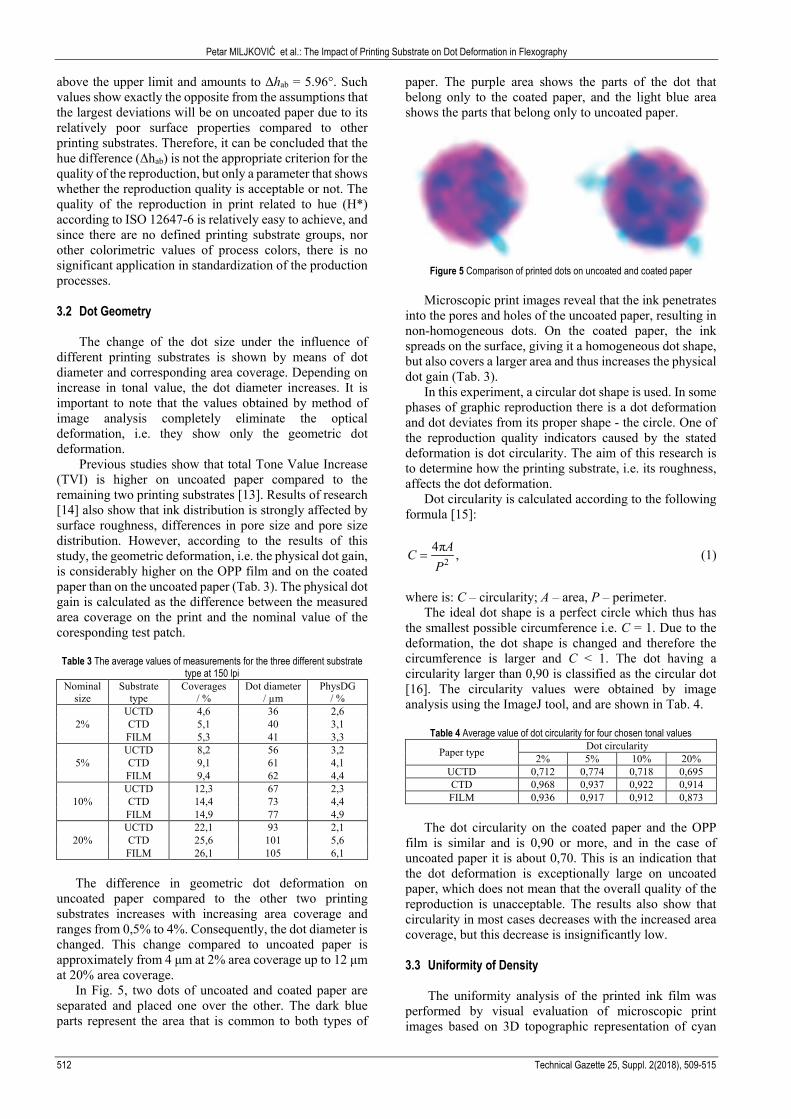
In Fig. 5, two dots of uncoated and coated paper are separated and placed one over the other. The dark blue parts represent the area that is common to both types of
paper. The purple area shows the parts of the dot that belong only to the coated paper, and the light blue area shows the parts that belong only to uncoated paper.
Figure 5 Comparison of printed dots on uncoated and coated paper
Microscopic print images reveal that the ink penetrates
into the pores and holes of the uncoated paper, resulting in non-homogeneous dots. On the coated paper, the ink spreads on the surface, giving it a homogeneous dot shape, but also covers a larger area and thus increases the physical dot gain (Tab. 3).
In this experiment, a circular dot shape is used. In some phases of graphic reproduction there is a dot deformation and dot deviates from its proper shape - the circle. One of the reproduction quality indicators caused by the stated deformation is dot circularity. The aim of this research is to determine how the printing substrate, i.e. its roughness, affects the dot deformation.
Dot circularity is calculated according to the following formula [15]:
24π ,ACP
= (1)
where is: C – circularity; A – area, P – perimeter.
The ideal dot shape is a perfect circle which thus has the smallest possible circumference i.e. C = 1. Due to the deformation, the dot shape is changed and therefore the circumference is larger and C < 1. The dot having a circularity larger than 0,90 is classified as the circular dot [16]. The circularity values were obtained by image analysis using the ImageJ tool, and are shown in Tab. 4.
Table 4 Average value of dot circularity for four chosen tonal values Paper type Dot circularity
2% 5% 10% 20% UCTD 0,712 0,774 0,718 0,695 CTD 0,968 0,937 0,922 0,914 FILM 0,936 0,917 0,912 0,873
The dot circularity on the coated paper and the OPP
film is similar and is 0,90 or more, and in the case of uncoated paper it is about 0,70. This is an indication that the dot deformation is exceptionally large on uncoated paper, which does not mean that the overall quality of the reproduction is unacceptable. The results also show that circularity in most cases decreases with the increased area coverage, but this decrease is insignificantly low.
3.3 Uniformity of Density
The uniformity analysis of the printed ink film was
performed by visual evaluation of microscopic print images based on 3D topographic representation of cyan
Petar MILJKOVIĆ et al.: The Impact of Printing Substrate on Dot Deformation in Flexography
Tehnički vjesnik 25, Suppl. 2(2018), 509-515 513
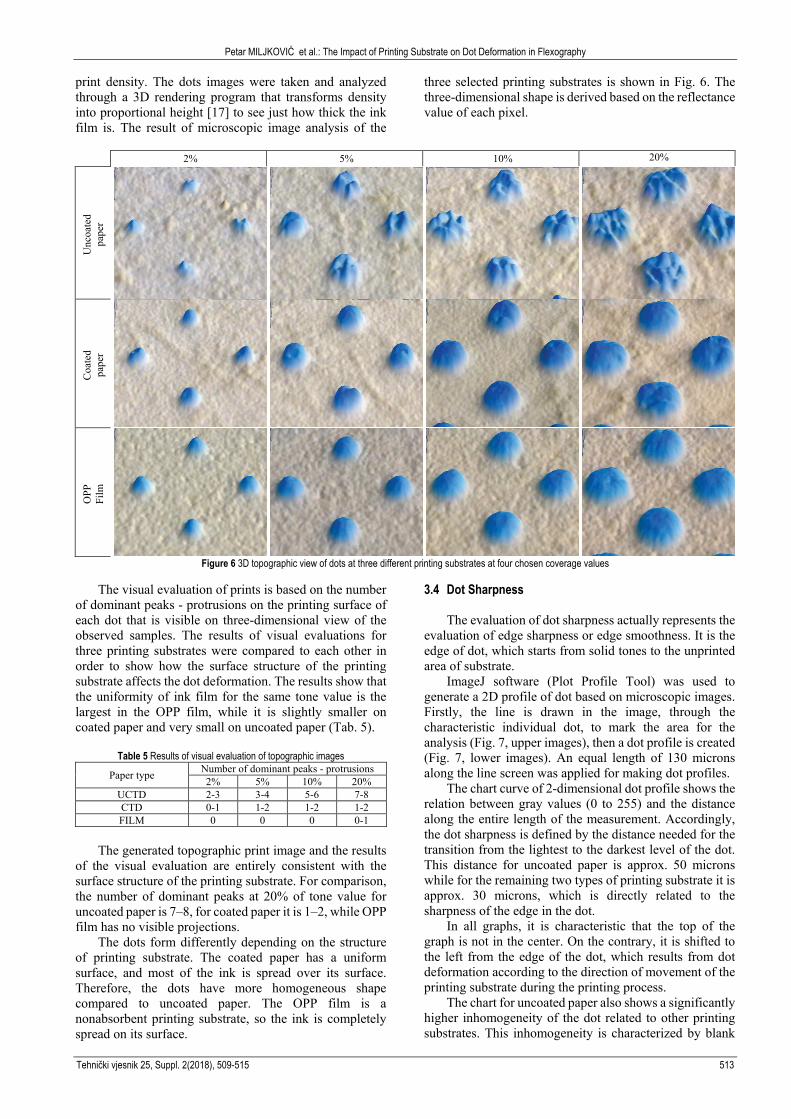
print density. The dots images were taken and analyzed through a 3D rendering program that transforms density into proportional height [17] to see just how thick the ink film is. The result of microscopic image analysis of the
three selected printing substrates is shown in Fig. 6. The three-dimensional shape is derived based on the reflectance value of each pixel.
2% 5% 10% 20%
Unc
oate
d pa
per
Coa
ted
pape
r
OPP
Fi
lm
Figure 6 3D topographic view of dots at three different printing substrates at four chosen coverage values
The visual evaluation of prints is based on the number
of dominant peaks - protrusions on the printing surface of each dot that is visible on three-dimensional view of the observed samples. The results of visual evaluations for three printing substrates were compared to each other in order to show how the surface structure of the printing substrate affects the dot deformation. The results show that the uniformity of ink film for the same tone value is the largest in the OPP film, while it is slightly smaller on coated paper and very small on uncoated paper (Tab. 5).
Table 5 Results of visual evaluation of topographic images
Paper type Number of dominant peaks - protrusions 2% 5% 10% 20%
UCTD 2-3 3-4 5-6 7-8 CTD 0-1 1-2 1-2 1-2 FILM 0 0 0 0-1
The generated topographic print image and the results
of the visual evaluation are entirely consistent with the surface structure of the printing substrate. For comparison, the number of dominant peaks at 20% of tone value for uncoated paper is 7–8, for coated paper it is 1–2, while OPP film has no visible projections.
The dots form differently depending on the structure of printing substrate. The coated paper has a uniform surface, and most of the ink is spread over its surface. Therefore, the dots have more homogeneous shape compared to uncoated paper. The OPP film is a nonabsorbent printing substrate, so the ink is completely spread on its surface.
3.4 Dot Sharpness The evaluation of dot sharpness actually represents the
evaluation of edge sharpness or edge smoothness. It is the edge of dot, which starts from solid tones to the unprinted area of substrate.
ImageJ software (Plot Profile Tool) was used to generate a 2D profile of dot based on microscopic images. Firstly, the line is drawn in the image, through the characteristic individual dot, to mark the area for the analysis (Fig. 7, upper images), then a dot profile is created (Fig. 7, lower images). An equal length of 130 microns along the line screen was applied for making dot profiles.
The chart curve of 2-dimensional dot profile shows the relation between gray values (0 to 255) and the distance along the entire length of the measurement. Accordingly, the dot sharpness is defined by the distance needed for the transition from the lightest to the darkest level of the dot. This distance for uncoated paper is approx. 50 microns while for the remaining two types of printing substrate it is approx. 30 microns, which is directly related to the sharpness of the edge in the dot.
In all graphs, it is characteristic that the top of the graph is not in the center. On the contrary, it is shifted to the left from the edge of the dot, which results from dot deformation according to the direction of movement of the printing substrate during the printing process.
The chart for uncoated paper also shows a significantly higher inhomogeneity of the dot related to other printing substrates. This inhomogeneity is characterized by blank

Petar MILJKOVIĆ et al.: The Impact of Printing Substrate on Dot Deformation in Flexography
514 Technical Gazette 25, Suppl. 2(2018), 509-515
spaces occurring on the dot due to incomplete coverage of the printing substrate surface.
The edge sharpness is very important in printing of line elements, particularly bar codes, which has effect on speed of its readings.
a) b) c)
Figure 7 Two-dimensional dot profile at 10% tonal value on three printing substrates 4 CONCLUSION
This study researched ink behavior during printing on
uncoated and coated paper as well as on OPP film as one of the major causes of dot deformation.
The structure of the printing substrate surface is crucial for successful transmission of the ink and as such it is very important in the printing process.
The results of the image analysis showed that the increase in roughness of the printing substrate increases the inconsistency of the printed ink film, thus directly reducing the quality of the reproduction. This is in accordance with research [18], which shows that as the surface roughness of papers increases, the print density decreases dramatically.
A very important factor which affects the dot deformation on the print is ink penetration. It depends on the physical interaction between ink and printing substrates. The printing substrate properties, such as smoothness and porosity, affect the efficiency of printing ink in the printing process. These properties affect the penetration and ink spreading, which cause a larger geometrical dot deformation, i.e. increasing of the print density. In this paper, it has been shown that when printing the ink enters the paper structure and expands laterally, increasing the dot diameter. Due to the inhomogeneous structure of pores of uncoated paper, the distribution of ink on the rough surface is very complex and the dots are not uniform and are not well formed.
The mechanical interaction between the impression cylinder and the polymer plate also significantly impacts the ink spreading when printing. The same printing pressure causes a larger dot deformation on a softer printing surface. On uncoated paper, the ink spreads more through the paper pores and forms an uneven dot shape, which is visible from the microscopic images.
On uncoated paper, more ink penetrates into paper pores and spreads less horizontally, so the surface of the dot is not uniform. The three-dimensional representation of the printed dot on uncoated paper looks like the tops of the
mountain. On coated paper the appearance of such peaks is significantly reduced, while in OPP films they do not appear at all. Thus, the print density depends on the surface properties of the printing substrate such as smoothness, porosity, shine, etc. A higher value of roughness and porosity requires more ink. For the same amount of ink, the printing substrate with higher roughness and porosity has a lower print density. Namely, the same quantity of ink will cover smaller surfaces on uncoated paper compared to coated paper and film.
All the above conclusions have been made based on the conducted visual evaluation and image analysis. All the examined parameters of dot geometry, dot diameter and uniformity of dot density, show that the dot deformation on uncoated, rough, and absorbent printing substrates is considerably larger than on the remaining two printing substrates. Although coated paper and OPP film are from different qualitative groups of printing substrates, they have very similar characteristics in view of the quality of raster reproduction i.e. dot deformation.
All the studies have been carried out within the specification according to ISO 12647-6:2012(E) which, for matching with the specified specifications, defines only the hue difference (Δhab). Therefore, the non-applicability of the existing ISO 12647-6 standard, which is not fully defined (at least not as well defined as for offset printing), is a very important defect in the overall process. Improper applicability of the standard is caused by speed and trend of development in flexographic process with a multitude of variable parameters which should be defined. However, this research can serve as guideline for production processes using flat top dot systems.
Abbreviations CTD – Coatedlabel paper UCTD – Uncoatedlabel paper FILM – OPP label film Phys DG – Physical Dot Gain

Petar MILJKOVIĆ et al.: The Impact of Printing Substrate on Dot Deformation in Flexography
Tehnički vjesnik 25, Suppl. 2(2018), 509-515 515
ISO – International Organization for Standardization 5 REFERENCES [1] Flexographic Technical Association, (FTA). (1999).
Flexography: Principles & Practices. New York: Foundation of Flexographic Technical Association, Inc.
[2] Bould, D. C., Claypole, T. C., Bohan, M. F. J., & Gethin, D. T. (2004). Deformation of Flexographic Printing Plates. 56th TAGA Technical Conference, 146-162.
[3] Valdec, D., Zjakić, I., & Milković, M. (2013). The influence of variable parameters of flexographic printing on dot geometry of pre-printed printing substrate. Tehnički vjesnik, 20(4), 659-667.
[4] Bohan, M. F. J., Townsend, P., Hamblyn, S. M., Claypole, T. C., Gethin D. T. (2003). Evaluation of Pressures in Flexographic Printing. Proceedings of the TAGA 55th International Annual Technical Conference, 311-320.
[5] Bohlin, E., Lestelius, M., & Johansson, C. (2013). Flexographic Ink-Coating Interactions: Effects of Porous Structure Variations of Coated Paperboard. Nordic Pulp & Paper Research Journal, 28. https://doi.org/10.3183/NPPRJ-2013-28-04-p573-581
[6] Bould, D. C., Claypole, T. C., & Bohan, M. F. J. (2004). An experi-mental investigation into flexographic printing plates. Journal of Graphic Technology, 1(3), 1-8.
[7] Du, Bin. (2009). Dot Gain in the Digital Flexographic Process by Varying Screening Techniques and Pressures. Institute of Printing and Packaging Engineering, Xi’an University of Technology, Xi’an, China.
[8] d’Andrea S. (2008). Kodak Flexcel NX Digital Flexographic System. Eastman Kodak Company, Rochester.
[9] Harper, C. (2005). Aniloks line screen – stabilizer of the ink film. Flexo and Gravure Asia, 4(3), 14-15.
[10] Flexographic Technical Association (FTA). (2003). Flexographic Image Reproduction Specifications and Tolerances (FIRST) Book (3rd ed.). Ronkonkoma, NY: FTA.
[11] Dino-Lite Europe/ IDCP B.V. (2017). The Netherlands, http://www.dino-lite.eu/index.php/en/component/k2/item/ 33-am4113t (April 2017)
[12] ISO 2012. International standard ISO 12647-6, Graphic technology — Process control for the production of half-tone colour separations, proofs and production prints — Part 6: Flexographic printing. ISO, Geneva, 2012.
[13] Fetsko J. M. & Walker W. C. (1955). Measurements of Ink Transfer in Printing Coated Paper. Am. Ink Maker, XI(33), 38-44.
[14] Bohlin, E. (2013). Surface and porous structure of pigment coatings: Interactions with flexographic ink and effects on print quality. Dissertation. Karlstad: Karlstad University.
[15] Fleming, P. D., Cawthorne, J. E., Mehta, F., Halwawala, S., & Joyce, M. K. (2003). Interpretation of Dot Fidelity of Ink Jet Dots Based on Image Analysis. The Journal of Imaging Science and Technology, 47(5), 394-399.
[16] Jacobson, J., Keif, M., Rong, X., Singh, J., & Vorst, K. (2009). Flexography Printing Performance of PLA Film, Journal of Applied Packaging Research, 3(2), 91-104.
[17] Ferreira T. & Rasband W. (2011). ImageJ User Guide, National Institutes of Health, Washington.
[18] Theohari, S., Fraggedakis, E., Tsimis, D., & Mandis, D. (2014). Effect of paper properties on print quality by flexographic method. 46th Annual International Conference on Graphic Arts and Media Technology, At Athens –Korinthia.
Contact information: Petar MILJKOVIĆ, Assis. Prof., PhD University North Trg dr. Žarka Dolinara 1 48000 Koprivnica, Croatia E-mail: [email protected] Dean VALDEC, Assis. Prof., PhD University North Trg dr. Žarka Dolinara 1 48000 Koprivnica, Croatia E-mail: [email protected] Mile MATIJEVIĆ, Assis. Prof., PhD Faculty of graphic art, University of Zagreb Getaldićeva 2, 10000 Zagreb, Croatia E-mail: [email protected]