The Impact of Participation in the Food Dudes Healthy ...
107
Utah State University Utah State University DigitalCommons@USU DigitalCommons@USU All Graduate Theses and Dissertations Graduate Studies 5-2014 The Impact of Participation in the Food Dudes Healthy Eating The Impact of Participation in the Food Dudes Healthy Eating Program on Dietary Habits in Fourth and Fifth Grade Students in Program on Dietary Habits in Fourth and Fifth Grade Students in Cache County Utah After One Year Cache County Utah After One Year Amanda B. Jones Utah State University Follow this and additional works at: https://digitalcommons.usu.edu/etd Part of the Nutrition Commons Recommended Citation Recommended Citation Jones, Amanda B., "The Impact of Participation in the Food Dudes Healthy Eating Program on Dietary Habits in Fourth and Fifth Grade Students in Cache County Utah After One Year" (2014). All Graduate Theses and Dissertations. 3863. https://digitalcommons.usu.edu/etd/3863 This Thesis is brought to you for free and open access by the Graduate Studies at DigitalCommons@USU. It has been accepted for inclusion in All Graduate Theses and Dissertations by an authorized administrator of DigitalCommons@USU. For more information, please contact [email protected].
Transcript of The Impact of Participation in the Food Dudes Healthy ...
Utah State University Utah State University
DigitalCommons@USU DigitalCommons@USU
All Graduate Theses and Dissertations Graduate Studies
5-2014
The Impact of Participation in the Food Dudes Healthy Eating The Impact of Participation in the Food Dudes Healthy Eating
Program on Dietary Habits in Fourth and Fifth Grade Students in Program on Dietary Habits in Fourth and Fifth Grade Students in
Cache County Utah After One Year Cache County Utah After One Year
Amanda B. Jones Utah State University
Follow this and additional works at: https://digitalcommons.usu.edu/etd
Part of the Nutrition Commons
Recommended Citation Recommended Citation Jones, Amanda B., "The Impact of Participation in the Food Dudes Healthy Eating Program on Dietary Habits in Fourth and Fifth Grade Students in Cache County Utah After One Year" (2014). All Graduate Theses and Dissertations. 3863. https://digitalcommons.usu.edu/etd/3863
This Thesis is brought to you for free and open access by the Graduate Studies at DigitalCommons@USU. It has been accepted for inclusion in All Graduate Theses and Dissertations by an authorized administrator of DigitalCommons@USU. For more information, please contact [email protected].
THE IMPACT OF PARTICIPATION IN THE FOOD DUDES HEALTHY EATING
PROGRAM ON DIETARY HABITS IN FOURTH AND FIFTH GRADE STUDENTS
IN CACHE COUNTY UTAH AFTER ONE YEAR
by
Amanda B. Jones
A thesis submitted in partial fulfillment
of the requirements for degree
of
MASTER OF SCIENCE
in
Nutrition and Food Sciences
Approved:
______________________________
Heidi Wengreen, PhD
Major Professor
______________________________ Marlene Israelsen, MS, RD
Committee Member
______________________________ Gregory Madden, PhD
Committee Member
______________________________
Mark R McLellan, PhD
Vice President of Research and
Dean of the School of Graduate Studies
UTAH STATE UNIVERSITY
Logan, Utah
2014
ii
Copyright © Amanda B. Jones 2014
All Rights Reserved
iii
ABSTRACT
The Impact of Participation in the Food Dudes Healthy Eating Program on Dietary Habits
in 4th and 5th Grade Students in Cache County Utah after One Year
by
Amanda B. Jones, Master of Science
Utah State University, 2014
Major Professor: Dr. Heidi J. Wengreen
Department: Nutrition, Dietetics, and Food Sciences
Adolescents are not consuming the recommended amounts of fruits and
vegetables (FV). An overall decrease in diet quality is seen as adolescents get older, with
decreases in fruit and vegetable intake and increases in energy dense food intake. The
aim of this study was to test whether or not the Food Dudes (FD) healthy eating program
helps to prevent decreases in fruit and vegetable intake and increases in energy dense
foods during the transition from elementary school into middle school.
Past FD studies supported the use of repeated tasting, rewards, and role modeling
to encourage children to eat more fruits and vegetables at school with data from studies
of young children. A review of available literature on effectiveness of these techniques in
adolescents found evidence that the program may also be effective for adolescents.
Participants were 4th and 5th graders (n=874) from 6 elementary schools, recruited
during the 2011-2012 school year. Treatment group was assigned by school and included
a prize condition, a praise condition, and a control. Students were followed into the 2012-
iv
2013 school year when the 5th grade cohort entered middle school. During 2012-2013 an
additional control group was recruited from three middle schools (n = 154).
Results showed short term success at increasing FV intake and that the program
had some long term success preventing large drops in FV intake. A small to medium
positive correlation was seen between energy dense snack foods and total FV intake (r
ranging from .125 to .355, p<0.01). This suggests that increases in total FV intake was
not associated with decreases in intake of less healthy foods and that increases in one
food are associated with increases in other foods.
The results of this study suggest that the FD program may play a role in helping to
maintain lunch time FV intake during the transition into middle school. The results for
the impact on total FV intake and total diet were less conclusive due to problems in the
self-reported data. Future studies on this topic should look for a better method for
tracking changes in total FV intake and total diet.
(106)

v
PUBLIC ABSTRACT
The Impact of Participation in the Food Dudes Healthy Eating Program on Dietary Habits
in 4th and 5th Grade Students in Cache County Utah after One Year
Amanda Jones
Adolescents are not meeting the recommended daily intake of fruits and
vegetables (FV). The Food Dudes Healthy Eating Program (FD), developed by
researchers in the UK, has previously been shown to increase lunch time and overall FV
intake in elementary school aged children. The aim of this study was to test if
participation in the FD program during late elementary school could prevent decreases in
FV intake and increases in junk food intake during the transition from elementary school
into middle school.
A decrease in average lunchtime FV intake was seen at the beginning of the
transition into middle school. Students who had participated in the FD program during
elementary school, however, had a less drastic decrease in lunchtime FV intake than
those who had not participated. By the end of the school year average lunchtime FV
intake was even higher than it had been when it was first assessed, prior to the transition
into middle school. Stabilizing FV intake did not, however, appear to have an impact on
the intake of junk food.
Accurately measuring total FV intake and junk food intake was problematic
during this study. The changes in lunchtime FV intake may not accurately reflect what
was happening to total FV intake and junk food intake, so it is critical that future studies
find more accurate methods of obtaining total dietary intake from adolescents.
vi
ACKNOWLEDGMENTS
I first would like to thank Dr. Heidi Wengreen for giving me the opportunity to
work as her graduate student. I appreciate all of the patience, help, and encouragement
that I received while I was working on my thesis, especially during the times I thought I
couldn’t possibly ever get it finished. I also want to thank my committee members,
Marlene Israelsen and Gregory Madden, for their time and insights. I want to give special
thanks to Sheryl Aguilar for all of the help and encouragement that she gave me while I
was working on my project and for playing a big part in encouraging me to pursue my
master’s degree in the first place.
I want to thank the United States Department of Agriculture and the Utah
Agriculture Experiment Station for the grants that made this project possible. I give
special thanks to my sweet mother-in-law for reading through my final draft and
checking for errors and to my parents and siblings for all of their love and support
throughout this long process. Lastly, I thank my wonderful husband for his patience in
putting up with the long hours I have spent with this project, for sitting with me during
late nights of typing, and for always believing in me.
Amanda B. Jones
vii
CONTENTS
Page
ABSTRACT ....................................................................................................................... iii
PUBLIC ABSTRACT .........................................................................................................v
ACKNOWLEDGMENTS ................................................................................................. vi
LIST OF TABLES ...............................................................................................................x
LIST OF FIGURES ........................................................................................................... xi
CHAPTER
1. INTRODUCTION AND BACKGROUND ......................................................1
ABSTRACT .................................................................................................1
INTRODUCTION .......................................................................................2
BACKGROUND AND LITERATURE REVIEW .....................................5
Importance of Fruit and Vegetable Consumption ..................................5
Protection Against Obesity ........................................................5
Influence on Total Diet ..............................................................6
Chronic Disease Prevention .......................................................7
Key Elements of the Food Dudes Program............................................7
Repeated Tasting ........................................................................7
Peer Modeling ............................................................................9
Rewards....................................................................................11
Previous Studies ...................................................................................12
Decreased Fruit and Vegetable Intake in Adolescents ........................14
OBJECTIVE ..............................................................................................15
SPECIFIC AIMS .......................................................................................15
REFERENCES ..........................................................................................15
2. EVIDENCE FOR THE EFFECTIVENESS OF THE FOOD DUDES
PROGRAM IN ADOLESCENTS ...................................................................21
ABSTRACT ...............................................................................................21
INTRODUCTION .....................................................................................22
FACTORS DETERMINING ADOLESCENT INTAKE OF FRUITS
AND VEGETABLES .............................................................................23
Adolescent Autonomy .........................................................................23
Data on FV and Competitive Food Intake in Adolescents ..................24
viii
Availability of Competitive Foods.......................................................26
RESEARCH ON THE EFFECTIVENESS OF FOOD DUDES
INTERVENTION COMPONENTS FOR OLDER CHILDREN ..........27
Repeated Tasting ..................................................................................29
Rewards................................................................................................31
Role Modeling .....................................................................................33
SOCIAL NORMS THEORY .....................................................................36
CONCLUSION ..........................................................................................38
REFERENCES ..........................................................................................38
3. THE IMPACT OF PARTICIPATION IN THE FOOD DUDES HEALTHY
EATING PROGRAM ON THE DIETARY HABITS OF 4th AND 5th GRADE
STUDENTS IN CACHE COUNTY UTAH AFTER ONE YEAR .................46
ABSTRACT ...............................................................................................46
INTRODUCTION .....................................................................................47
METHODS ................................................................................................50
Subjects ................................................................................................50
Overview of the Food Dudes Study .....................................................51
Basic Overview of Food Dudes 2011-2012:
Intervention .......................................................................................51
Baseline 1 (4 Days) ..................................................................51
Baseline 2 (4 Days) ..................................................................51
Phase 1 (16 Days) ....................................................................52
Phase 2 (remainder of academic year) .....................................53
Basic Overview of Food Dudes 2012-2013:
Follow-Up .........................................................................................53
Phase 3 (3 Days) ......................................................................53
Phase 4 (3 Days) ......................................................................53
Fruit, Vegetable, and Snack Questionnaire ..........................................53
Photo Analysis .....................................................................................56
Skin Carotenoid Scans .........................................................................57
Statistical Analysis ...............................................................................57
RESULTS ..................................................................................................59
Demographics ......................................................................................59
Mixed-design ANOVA for PWPA ......................................................60
Baseline 1 to Phase 1 ...............................................................60
Baseline 1 to Phase 2 ...............................................................60
ix
Baseline 1 to Phase 3 ...............................................................61
Baseline 1 to Phase 4 ...............................................................61
Repeated Measures for Scanner Scores ...............................................66
Baseline 1 to Phase 1 ...............................................................66
Baseline 1 to Phase 2 ...............................................................66
Baseline 1 to Phase 3 ...............................................................66
Baseline 1 to Phase 4 ...............................................................67
FVSQ P3 and P4 ANOVA ...................................................................67
Correlation Between Self-Reported and PWPA
Lunchtime FV Intake .......................................................................72
Correlation Between Scanner Score and
Self-Reported Total FV Intake..........................................................72
Correlation Between Scanner Score and
Lunchtime FV Intake ........................................................................72
FVSQ Correlations...............................................................................75
DISCUSSION ............................................................................................76
IMPLICATIONS FOR FUTURE RESEARCH ........................................79
REFERENCES ..........................................................................................79
4. SUMMARY AND CONCLUSION ................................................................85
SUMMARY ...............................................................................................85
CONCLUSION ..........................................................................................87
REFERENCES ..........................................................................................88
APPENDIX - FVSQ ..........................................................................................................91

x
LIST OF TABLES
Table Page
3.1 Demographics at Baseline 1 (2011-2012 School Year) .........................................59
3.2 Demographics at P3 for Middle School Control Group
(2012-2013 School Year) .......................................................................................59
3.3 Pairwise Comparison of Observed Mean Lunchtime FV Intake
for Baseline 1 to Phase 1 ........................................................................................62
3.4 Pairwise Comparison of Observed Mean Lunchtime FV Intake
for Baseline 1 to Phase 2 ........................................................................................63
3.5 Pairwise Comparison of Observed Mean Lunchtime FV Intake
for Baseline 1 to Phase 3 ........................................................................................64
3.6 Pairwise Comparison of Observed Mean Lunchtime FV Intake
for Baseline 1 to Phase 4 ........................................................................................65
3.7 Pairwise Comparison of Observed Mean Scanner Scores
for Baseline 1 to Phase 1 ........................................................................................68
3.8 Pairwise Comparison of Observed Mean Scanner Scores
for Baseline 1 to Phase 2 ........................................................................................69
3.9 Pairwise Comparison of Observed Mean Scanner Scores
for Baseline 1 to Phase 3 ........................................................................................70
3.10 Pairwise Comparison of Observed Mean Scanner Scores
for Baseline 1 to Phase 4 ........................................................................................71
3.11 Observed Means From One Way ANOVA of FVSQ Data P3 and P4
(comparison of 2012-2013 6th graders only).........................................................73
3.12 Correlations Between FVSQ and PWPA Lunchtime FV Intake ...........................74
3.13 Correlation Between Scanner Score and Total Self-Reported FV Intake..............74
3.14 Correlation Between Scanner Score and Total Lunchtime
FV Intake (PWPA) ................................................................................................74
xi
LIST OF FIGURES
Figure Page
3.1 Time by Condition Interaction Plot B1 to P1 ........................................................62
3.2 Time by Condition Interaction Plot B1 to P2 ........................................................63
3.3 Time by Grade Interaction Plot B1 to P3...............................................................64
3.4 Time by Condition Interaction Plot B1 to P4 ........................................................65
3.5 Time by Grade Interaction Plot B1 to P4...............................................................65
3.6 Time by Condition Interaction Plot B1 to P1 ........................................................68
3.7 Time by Condition Interaction Plot B1 to P2 ........................................................69
3.8 Time by Condition Interaction Plot B1 to P3 ........................................................70
3.9 Time by Grade Interaction Plot B1 to P3...............................................................70
3.10 Time by Condition Interaction plot B1 to P4.........................................................71
CHAPTER 1
INTRODUCTION AND BACKGROUND
ABSTRACT
Obesity and chronic disease are serious problems in the US affecting even young
children. Eating patterns established early in life contribute to risk of obesity and related
diseases. The health benefits of diets rich in plant based foods include decreased risk of
chronic disease and obesity, but American children are consuming far less than the
recommended intake of fruits and vegetables (FV). Increasing childhood FV intake is an
important strategy for preventing chronic disease and obesity. School-based nutrition
interventions have been targeted as a cost effective way to reach large numbers of
children. Although many of these interventions have had statistically significant results,
few have shown clinically significant results. The Food Dudes Healthy Eating Program is
one program that has shown both statistically and clinically significant results. The FD
program uses repeated tasting, peer modeling, and rewards to encourage children to eat
more FV at school. Utah State University (USU) researchers have successfully adapted
the FD program for use in US schools. This study looks at the impact of the Food Dudes
program on total FV intake, energy dense food intake, and success at preventing a drop in
diet quality during the transition to middle school and adolescence. The study seeks to
answer the question: Does participation in the FD program help to offset the decrease in
total FV intake and the increase in energy dense food commonly seen during the
transition from 5th grade (elementary school) into 6th grade (middle school)? Specific
aims to help answer this question included examining differences in lunch-time intake of
FV and total (school + home) intake of FV and energy dense foods by grade (4th vs. 5th
2
graders in Fall 2011) and condition (control, FD praise, FD prize) over time, and examine
cross-sectional associations between FV intake and energy dense food intake among 4th,
5th, and 6th graders.
INTRODUCTION
Obesity and chronic disease has become a modern plague of the US and many
other developed countries, striking even the youngest members of the population.
Although levels of childhood overweight and obesity have plateaued over the past
decade, childhood obesity is still one of the greatest health concerns facing the nation
today. Approximately 1 in 3 US children qualify as overweight and 16.9% are considered
obese (1). It has been estimated that upwards of 70% of obese children go on to become
obese adults, and childhood obesity is also associated with increased risk for chronic
disease during childhood and into adulthood (2).
Eating patterns are established early in life and contribute to risk of obesity and
related diseases. For example, diets rich in plant-based foods may help decrease the risk
of childhood obesity (3, 4) as well as the risk of chronic diseases including cardiovascular
disease and some types of cancer (5). However, in spite of health initiatives and national
advertising campaigns promoting increased FV intake, American children consume far
less than the recommended intake of fruits and vegetables (6). Increasing national FV
consumption is one strategy for obesity and chronic disease prevention. Millions of
research dollars have been invested into developing interventions to help increase
children’s FV intake, some more successful than others.
Given that 32 million children participate in the National School Lunch Program
each year (7), school-based nutrition interventions have been targeted as a cost effective
3
way to target large numbers of children. Many of these school-based intervention studies
have reported modest levels of statistical success; however, few have produced clinically
significant increases in FV consumption. In a review of 21 school-based intervention
studies aimed at increasing FV intake, the average increase in total daily FV intake was
only .25 portions (1/8 cup) (8). However, the Food Dudes Healthy Eating Program is one
intervention that has reported clinically significant and relatively consistent results in
increasing children’s FV consumption (9, 10).
The Food Dudes (FD) program has been implemented with great success in many
primary schools throughout the UK and Ireland and in 2006 the program received a
World Health Organization Best Practice Award (11). The program uses a combination
of repeat tasting, role modeling, and rewards to increase FV intake in elementary school
age children. Children participating in the intervention had a clinically significant
increase in FV intake during the intervention and maintained higher levels of fruit and
vegetable intake upon follow up than those in the control group. In a 2004 study, which
included 3 primary schools in England and Wales, the estimated increase in total daily
FV intake was 153 g or 2.54 portions for 4-7 year olds and 131 g or 2.18 portions for 7-
11 year olds immediately following the intervention (9).
Other studies of the FD program have shown increases in FV consumption to be
maintained upon long term follow-up (10-12). In a study of the program adapted for Irish
schools, at 12 months post-intervention there was a slight decrease from the immediate
post-intervention levels, but intake was still significantly higher than at baseline (10). A
2012 evaluation of the FD program by Upton et al. found a statistically significant
increase in lunch time fruit and vegetable intake at 3 months post intervention, but
4
increases were not found to be maintained at 12 months post intervention (13). In
reviewing the literature, the FD program has proven most successful in increasing the FV
consumption of those who had the lowest levels of consumption to begin with, (9, 11,
14).
A research team at Utah State University that includes both registered dietitians
and psychologists has been working to implement the FD program in U.S. schools since
2010. The team has successfully implemented and previously reported on a single school
pilot study of the program (14). They have also done an experimental intervention that
involved six schools and followed children over 1 y post intervention.
The purpose of this current project is to follow 4th and 5th grade students who
participated in the six school study in 2011-2012 into the 2012-2013 school year. Fourth
grade students were followed into the fifth grade at their respective elementary schools,
and fifth grade students were followed into sixth grade at three Cache County Middle
schools where additional students who had not previously participated in the study were
recruited from physical education (PE) classes as a control group.
Plate waste photo analysis (PWPA) will be used to give an objective measure of
lunch time FV intake. A food frequency style questionnaire (FVSQ) about fruit,
vegetable, beverage, and snack intake will be used to assess total FV intake and overall
total diet. This is significant because the original FD studies only gave estimated impacts
of the program on total FV intake (9). Another study by Taylor et al. used food diaries to
look at the impact of the FD program, but there were only 34 participants in the study
(15). This will be the first large scale study to look at the impact of participation in the
FD program on total FV intake. The data from the FVSQ will also be used to assess the
5
impact participation in the FD program on intake of less healthy, energy dense foods. To
our knowledge this has not been evaluated in any other study.
Of particular concern to the population of this study is the impact of the transition
into adolescence. Data from both cohort and cross-sectional studies show that FV intake
decreases and energy dense food intake increases during the transition into middle school
and adolescence (16-19). This study seeks to answer the question: Does participation in
the FD program help to offset the decrease in total FV intake and the increase in energy
dense food commonly seen during the transition from elementary school (5th grade) into
middle school (6th grade)?
BACKGROUND AND LITERATURE REVIEW
Importance of Fruit and Vegetable Consumption
Protection against obesity
Diets rich in plant-based foods, particularly FV, are believed to protect against
obesity. In support of this theory, many studies have shown that on average persons who
consume a vegetarian diet are leaner than their non-vegetarian peers (20, 21). The low
energy density and high fiber content of most FV are believed to decrease hunger,
increase satiety, and decrease overall caloric intake and are cited as potential mechanisms
for their protective effect against overweight and obesity (22). Data on the specific
influence of FV consumption on body weight in a non-vegetarian population, however, is
currently limited, especially for children.
Reviews of studies on the impact of FV on weight management have shown
contradictory results finding overall insufficient evidence of a protective effect of FV
consumption on childhood obesity risk (4, 23). The studies were limited since most did
6
not account for potential confounders and often depended on self-reported height, weight,
and FV consumption. A 2011 study by Matthews et al. found an inverse association
between vegetable intake and BMI, but no association between fruit intake and BMI (3).
The results of this study are of interest because height and weight were measured and
recorded by researchers rather than self-reported, and some attempt was made to control
for potential confounders including gender, type of school, and soda intake.
Influence on Total Diet
FV consumption may play an important role in dietary patterns by displacing less
healthy foods in the diet. Data on this effect in children is limited. A weight loss study
was conducted by Epstein et al. in which 41 children ages 8-12 with BMI percentile
scores above the 85% were randomly assigned to one of two 24-mo family-based
behavioral treatments. All children were placed on the same diet plan, however one
treatment targeted increasing intake of fruits, vegetables, and low fat dairy products while
the other treatment targeted reducing intake of high energy dense foods. The group
targeted to increase healthy food intake had a significantly greater reduction in zBMI and
percent overweight than the group that was targeted to reduce intake of high energy dense
foods only (24).
Results of another experimental study published by Looney and Raynor in 2012
found that increasing fruit, vegetable, and low-fat dairy alone does not significantly
influence intake of high energy dense, less healthy foods or decrease overall caloric
intake. In this study, 80 overweight children between the ages of 4 and 9 were recruited
and randomly assigned into one of three family-based intervention groups for 6 mos. One
group received increased feedback and growth monitoring of changes in height, weight
7
and BMI, another group received growth monitoring and were encouraged to cut back on
snack foods and sugary drinks, and the other group received growth monitoring and were
encouraged to increase consumption of FV and low-fat dairy. No relationship was found
between increasing FV intake and consumption of snack foods and sugary drinks (25).
Chronic disease prevention
Results of a review of intervention studies on the relationship of FV consumption
and weight management in adults were also inconclusive, but suggested that some FV
may increase satiety, leading to an overall lower calorie intake (22). As evidenced above,
the data on the influence of fruit and vegetable intake on risk of overweight is
complicated and often contradictory. Adding to the complexity, studies often depend
entirely on self-reported data which can be difficult to accurately collect from children.
Although the exact relationship between FV consumption and overweight and obesity is
difficult to quantify, there is convincing evidence that higher FV consumption protects
against obesity-related chronic diseases including stroke, hypertension, and heart disease
(5).
Key Elements of the Food Dudes Program
Repeat Tasting
One of the primary elements of the FD program is to increase children’s exposure
to FV by encouraging repeat tasting. The idea that exposure can increase liking for a food
is derived from the ‘mere exposure’ effect, a phenomenon first quantitatively studied by
psychologist Robert B. Zajonc. Zajonc found that repeated exposure to a stimulus tends
to increase an individual’s liking of that stimulus (26). Experimental lab studies have

8
demonstrated that exposure can increase liking of foods for both children and adults (27-
29). According to a review by Cooke, the younger the participant the fewer exposures are
necessary to increase liking with some studies showing as few as one exposure necessary
for infants and up to 20 exposures necessary for 10-12 year olds (29).
The previous studies were mostly performed in laboratory settings, however,
other studies have tested the effect of exposure in a more naturalistic setting. Wardle et
al. published results of two studies in 2003, one in preschoolers (30) and the other in 5- to
7-y-old children (31). In the preschool study, parents were either asked to give their child
a small taste of a target vegetable daily, given basic information on healthy eating, or
received no intervention. Children in the exposure group experienced significantly
increased liking and intake of target vegetables while children in the other groups did not
(30). The study of 5- to 7-y-olds took place in a school setting. Children were randomly
assigned either to an exposure group, a cartoon sticker reward group, or a control group.
The exposure group was found to have a greater increase in both liking and consumption
than the reward or control groups (31).
A potential confounder in testing the effect of ‘mere exposure’ is that even when
children do not receive a tangible reward for tasting a target food they often receive
social praise. A 2010 study by Cooke et al. of 5- to 6-y-old children attempted to control
for the influence of exposure alone (32). Children were placed in one of four groups:
exposure with tangible reward, exposure with praise, exposure alone, and a control group
that received no intervention. The study found that exposure alone increased intake and
liking of a previously disliked vegetable. Liking remained higher at follow-up than at
baseline, but the increase in intake was not maintained over time. FD implements both
9
peer models and rewards to help encourage repeat tasting in a hope of increasing and
maintaining both the liking and intake of FV in children (9).
Peer Modeling
The idea that individuals can learn through modeling the behavior of others is not
new, however most formal understanding of the influence of role modeling on learned
social behavior comes from the work of Albert Bandura who formally introduced the
Social Cognitive Theory in the 1980’s. According to the social cognitive theory, people
can learn not just from being taught directly but by watching the behaviors of others (33).
Bandura emphasizes that modeling is more than imitation (34). An early study by
Bandura in the 1960’s focused on learned aggression. Bandura had young children watch
adults play with an inflatable doll. Those children who watched the adults play violently
and aggressively with the toy were more likely to show aggressive behavior when they
were later placed in a room to play with the inflatable doll than those who had seen adult
models who did not demonstrate aggressive play behavior (35). Bandura’s work
demonstrated that behavior could be elicited by modeling a desired response rather than
by reinforcement.
Bandura’s theories on observational learning have been extended and applied in
many fields to help shape behavior. The FD program utilizes modeling in two ways.
First, videos of and letters from preteen super heroes, the Food Dudes, are presented to
the children. The FD are shown using super powers they gained from consuming FV to
fight off the evil Junk Punks. Support for the use of cartoon models comes from
Bandura’s work on aggression, which found that cartoon models could elicit aggression
almost as effectively as adult models (36) as well as a study from 1972 which found

10
showing the popular cartoon character Popeye eating spinach before spinach was served
to children was as effective as the use of a peer model (37). The FD were selected to be
slightly older than the children in the intervention because of prior studies that found peer
models to be most effective for children when they were slightly older than the observer
(9).
The second form of modeling comes from watching the behavior of other
participants. As some of the children comply with eating the required amount of FV to
earn a hand stamp and reward, they become models of the desired behavior for their peers
(9). When the behavior of a model is reinforced, it increases the likelihood that the
observer will adopt similar behavior (34). Most nutrition studies on peer modeling have
been conducted in preschool aged children. In these studies a child was selected from the
group and trained to eat a novel food in order to serve as a model for the rest of the
participants in their group during meal or snack time. Children in the studies were found
to be more likely to imitate the behavior of peers they respect, who were generally well
liked, who were slightly older, and who were less aggressive (38, 39). One study also
found that they were more likely to imitate female peer models (38).
A 2008 study by Salvy et al. evaluated the effect of social context on the food
choices of both overweight and normal weight children between the ages of 10 and 12
(40). For one portion of the study children were partnered with an unfamiliar peer during
snack time. For both overweight and normal weight children the selection of healthy
snacks was strongly related to their partner’s selection of healthy snacks. Researchers
concluded that including peers in interventions to increase healthy food consumption may
be useful. The study was limited because the children were paired with a single

11
unfamiliar peer. The presence of a familiar peer or multiple peers may change the
influence on snack selection.
In a review of school-based interventions Salvy et al. also recognized that peer
modeling may be one potential mechanism for increased FV intake in the FD and other
similar studies, but suggested that for overweight children and adolescents especially it is
possible that individuals were attempting to conform to social norms and avoid the
stigma associated with overweight individuals who eat unhealthy foods rather than
responding to peer models (41).
Rewards
The use of rewards to encourage healthy eating is a controversial topic. While the
use of rewards to reinforce behavior has been well established, concerns have been raised
about potentially negative effects from offering rewards. Two main theories regarding the
potential negative effects of rewards have been presented (42). The first theory is the self-
determination theory. These theorists suggest that when external rewards are given for a
behavior it may be detrimental to an individual’s sense of autonomy and competence and
as a result may decrease intrinsic motivation to perform the rewarded behavior.
The second theory perhaps more relevant to prior nutrition studies on rewards is
the over justification theory. According to proponents of the over justification theory,
individuals come to more strongly associate the external reward with their behavior than
their own intrinsic motivations for exhibiting the behavior (42). In this case, when
rewards are removed the desired behavior may decrease or disappear altogether. Early lab
based nutrition studies found this effect. However, many of these studies were conducted
using foods that, though novel, were already palatable to participants; for example, sweet
12
juice. Studies done using less palatable foods show that the risk of over justification is
minimal when target food is initially disliked. This may be one reason the FD program
appears to be most successful in increasing FV intake for those children who consumed
the least to begin with (9, 14).
Another important aspect of rewards is the use of praise as a reward. Results of a
meta-analysis on the general effect of rewards found that the use of verbal rewards did
not undermine intrinsic motivation (43). The 2010 study by Cooke et al. previously
mentioned in the repeated tasting section of this literature review compared the
effectiveness of tangible rewards versus praise. Both the tangible reward group and the
praise group significantly increased their intake of the target vegetable; however intake
for the tangible reward group was significantly greater than the praise group. The tangible
reward and the praise group were also found to maintain their increased intake of the
target vegetable at both 1- and 3-mo follow-ups. Additionally, the study found that both
tangible rewards and praise increased liking of the target vegetable with no significant
difference between the two groups and that increased liking was maintained upon follow-
up (32). This study suggests that both tangible rewards and praise may be effectively
used to increase consumption of previously disliked FV without undermining intrinsic
motivation.
Previous Studies
The UK research team behind the FD program initially tested elements of the
program in a home setting. A group of children who were considered selective eaters
received elements of the FD program including repeated tasting, peer modeling, and
rewards for eating FV (44). The program was later broadened for usage in entire primary

13
schools. The whole school interventions found consistent and clinically significant
increases in FV intake. Short term follow-up looking at three to four months post
intervention has shown significant increases in FV consumption from baseline (12, 13).
Longer term follow-up done up to 12 mo post intervention has had mixed results with
one study showing a slight drop in consumption, but levels still above baseline, and
another study showing that increases in consumption were not maintained (10, 13). The
original FD program targeted increasing children’s consumption of school provided FV, a
variation of the program however was introduced in Ireland where students’ lunches are
provided by parents. The Irish program was successful in increasing parental provision of
FV as well as increasing child consumption of FV and the program has been
implemented in all primary school across Ireland (10).
A research team from USU conducted a single school pilot study of the FD
program adapted to the schedule of US schools. The key difference from the UK program
was that repeated tasting of researcher provided FV took place during lunchtime rather
than during snack time since a morning snack is not part of the typical US elementary
school schedule. The US pilot study found results similar to the original UK study,
showing that the greatest increase in FV consumption occurred in those students who
showed the lowest baseline consumption (14). The current study builds on the work of
both the UK studies and the USU pilot study. Aside from some small scale home
interventions with four or five children, the FD research team has not attempted to test to
what degree the individual components of the program contribute to its efficacy (9, 10,
45). One important element of the current study that has not (to our knowledge) been
looked at in previous FD’s research is a comparison between the use of tangible rewards
14
and praise. This study is also the first to look at the impact participation in the FD
program has on dietary habits during the transition from elementary to middle school.
Decreased Fruit and Vegetable Intake in Adolescents
Autonomy in making dietary decisions increases as children transition from
childhood into adolescence, particularly with the transition from elementary school into
secondary school. Cross sectional studies have also shown that diet quality decreases as
children move from late childhood into adolescence. A multinational study of child and
adolescent eating patterns by the World Health Organization (WHO) found that FV
consumption decreases with age while soda consumption increases with age (16). Lorson
et al. published a study in 2009 using the 1999-2002 NHANES data for children and
adolescents age 2-18 (19). Adolescents ages 12-18 y were found to be the least likely to
meet the recommendations of FV compared to all other age groups. In the 12- to18-y-old
group 80.5% were not meeting the daily recommended intake of fruit and 89.5% were not
meeting the daily recommended intake of vegetables, compared to 74.1% and 83.8% for
the 6- to 11-y-old group and 50.2% and 78.3% for the 2- to 5- y-old group.
A cohort study by Lytle et al. followed 291 students from Minnesota from 3rd
grade to 8th grade. Individual 24-h recalls were collected from students during 3rd grade,
5th grade, and 8th grade. The percentage of students consuming FV was found to drop
significantly between 5th grade and 8th grade, from 55.9% to 37.1% for fruit
consumption (p<0.05) and 49.5% to 41.6% for vegetables (p<0.05). Soda consumption
also significantly increased between 3rd grade and 5th grade and again between 5th grade
and 8th grade (18). A Texas study also found that children in higher grades showed
greater consumption of less healthful foods and decreased consumption of healthier foods
15
(17). One of the aims of this current study is to see if participation in the FD program
during elementary schools helps to mediate the level of decrease in FV consumption
during the transition from elementary school into middle school.
OBJECTIVE
Does participation in the FD program help to offset the decrease in FV intake and
the increase in energy dense food commonly seen during the transition from 5th grade
(elementary school) into 6th grade (middle school)?
SPECIFIC AIMS
SA1. Examine differences in lunch-time intake of FV and total (school + home) intake of
FV and energy dense foods by grade (4th vs. 5th graders in Fall 2011) and condition
(control, FD praise, FD prize) over time.
• The time effects we are interested in include baseline to the end of the phase 1
intervention; baseline to the end of the phase 2; baseline to the end of the follow-up 1;
baseline to the end of the follow-up 2.
• Lunch time FV intake will be assessed by digital photo observations. Total FV
intake will be assessed by a questionnaire and concentrations of skin carotenoids. Total
intake of energy dense foods will be assessed by a questionnaire.
SA 2: Examine cross-sectional associations between FV intake and energy dense food
intake among 4th, 5th, and 6th graders.
REFERENCES
1. Ogden CL, Carroll MD, Curtin LR, Lamb MM, Flegal KM. Prevalence of high
body mass index in US children and adolescents, 2007-2008. J Am Diet Assoc
2010;303:242-9.

16
2. Reilly JJ, Methven E, McDowell ZC, Hacking B, Alexander D, Stewart L, Kelnar
CJ. Health consequences of obesity. Arch Dis Child 2003;88:748-52.
3. Matthews VL, Wien M, Sabate J. The risk of child and adolescent overweight is
related to types of food consumed. Nutr J 2011;10.
4. Tohill BC, Seymour J, Serdula M, Kettel-Khan L, Rolls BJ. What epidemiologic
studies tell us about the relationship between fruit and vegetable consumption and
body weight. Nutr Rev 2004;62:365-74.
5. Boeing H, Bechthold A, Bub A, Ellinger S, Haller D, Kroke A, Leschik-Bonnet
E, Muller MJ, Oberritter H, et al. Critical review: vegetables and fruit in the
prevention of chronic diseases. Eur J Nutr 2012;51:637-63.
6. Guenther PM, Dodd KW, Reedy J, Krebs-Smith SM. Most Americans eat much
less than recommended amounts of fruits and vegetables. J Am Diet Assoc
2006;106:1371-9.
7. National school lunch program: Participation and lunches served.
http://www.fns.usda.gov/pd/slsummar.htm (accessed 2013).
8. Evans CE, Christian MS, Cleghorn CL, Greenwood DC, Cade JE. Systematic
review and meta-analysis of school-based interventions to improve daily fruit and
vegetable intake in children aged 5 to 12 y. Am J Clin Nutr 2012;96:889-901.
9. Lowe CF, Horne PJ, Tapper K, Bowdery M, Egerton C. Effects of a peer
modelling and rewards-based intervention to increase fruit and vegetable
consumption in children. Eur J Clin Nutr 2004;58:510-22.
10. Horne PJ, Hardman CA, Lowe CF, Tapper K, Le Noury J, Madden P, Patel P,
Doody M. Increasing parental provision and children's consumption of lunchbox

17
fruit and vegetables in Ireland: the Food Dudes intervention. Eur J Clin Nutr
2009;63:613-8.
11. Lowe CFaH, P. J. 'Food Dudes': Increasing children's fruit and vegetable
consumption. Cases in Public Health Communication & Marketing 2009;3:161-
85.
12. Horne PJ, Tapper K, Lowe CF, Hardman CA, Jackson MC, Woolner J. Increasing
children's fruit and vegetable consumption: a peer-modelling and rewards-based
intervention. Eur J Clin Nutr 2004;58:1649-60.
13. Upton D, Upton P, Taylor C. Increasing children's lunchtime consumption of fruit
and vegetables: an evaluation of the Food Dudes programme. Public Health Nutr
2013;16:1066-72.
14. Wengreen HJ, Madden GJ, Aguilar SS, Smits RR, Jones BA. Incentivizing
children's fruit and vegetable consumption: results of a United States pilot study
of the Food Dudes Program. J Nutr Educ Behav 2013;45:54-9.
15. Taylor C, Darby H, Upton P, Upton D. Can a school-based intervention increase
children's fruit and vegetable consumption in the home setting? Perspect Public
Health 2013;133:330-6.
16. Currie C, Robert, C., Morgan, A., Smith, R., Setterbulte, W., Samdal, O.,
Rasmussen, V. B. Young people's health in context. Health behaviour in school-
aged children. Copenhagen: WHO, 2004.
17. Perez A, Hoelscher DM, Brown HS, 3rd, Kelder SH. Differences in food
consumption and meal patterns in Texas school children by grade. Prev Chronic
Dis 2007;4:A23.
18
18. Lytle LA, Seifert S, Greenstein J, McGovern P. How do children's eating patterns
and food choices change over time? Results from a cohort study. Am J Health
Promot 2000;14:222-8.
19. Lorson BA, Melgar-Quinonez HR, Taylor CA. Correlates of fruit and vegetable
intakes in US children. J Am Diet Assoc 2009;109:474-8.
20. Sabate J, Wien M. Vegetarian diets and childhood obesity prevention. Am J Clin
Nutr 2010;91:1525S-9S.
21. Berkow SE, Barnard N. Vegetarian diets and weight status. Nutr Rev
2006;64:175-88.
22. Rolls BJ, Ello-Martin JA, Tohill BC. What can intervention studies tell us about
the relationship between fruit and vegetable consumption and weight
management? Nutr Rev 2004;62:1-17.
23. Newby PK. Plant foods and plant-based diets: protective against childhood
obesity? Am J Clin Nutr 2009;89:1572S-87S.
24. Epstein LH, Paluch RA, Beecher MD, Roemmich JN. Increasing healthy eating
vs. reducing high energy-dense foods to treat pediatric obesity. Obesity (Silver
Spring) 2008;16:318-26.
25. Looney SM, Raynor HA. Are changes in consumption of "healthy" foods related
to changes in consumption of "unhealthy" foods during pediatric obesity
treatment? Int J Environ Res Public Health 2012;9:1368-78.
26. Mere exposure effect. Elsevier's Dictionary of Psychological Theories, 2006.
27. Liem DG, de Graaf C. Sweet and sour preferences in young children and adults:
role of repeated exposure. Physiol Behav 2004;83:421-9.
19
28. Pliner P. The effects of mere exposure on liking for edible substances. Appetite
1982;3:283-90.
29. Cooke L. The importance of exposure for healthy eating in childhood: a review. J
Hum Nutr Diet 2007;20:294-301.
30. Wardle J, Cooke LJ, Gibson EL, Sapochnik M, Sheiham A, Lawson M.
Increasing children's acceptance of vegetables; a randomized trial of parent-led
exposure. Appetite 2003;40:155-62.
31. Wardle J, Herrera ML, Cooke L, Gibson EL. Modifying children's food
preferences: the effects of exposure and reward on acceptance of an unfamiliar
vegetable. Eur J Clin Nutr 2003;57:341-8.
32. Cooke LJ, Chambers LC, Anez EV, Croker HA, Boniface D, Yeomans MR,
Wardle J. Eating for pleasure or profit: the effect of incentives on children's
enjoyment of vegetables. Psychol Sci 2011;22:190-6.
33. Social learning theory. Corsini Encyclopedia of Psychology and Behavioral
Science, 2010.
34. Bandura A. Observational learning. Englewood Cliffs, NJ: Prentice-Hall Inc,
1986.
35. Bandura A, Ross D, Ross SA. Transmission of aggression through imitation of
aggressive models. J Abnorm Soc Psychol 1961;63:575-82.
36. Bandura A, Ross D, Ross SA. Imitation of film-mediated agressive models. J
Abnorm Soc Psychol 1963;66:3-11.
37. Harris MB, Baudin H. Models and vegetable eating: the power of Popeye.
Psychol Rep 1972;31:570.
20
38. Hendy HM. Effectiveness of trained peer models to encourage food acceptance in
preschool children. Appetite 2002;39:217-25.
39. Greenhalgh J, Dowey AJ, Horne PJ, Lowe CF, Griffiths JH, Whitaker CJ.
Positive- and negative peer modelling effects on young children's consumption of
novel blue foods. Appetite 2009;52:646-53.
40. Salvy SJ, Kieffer E, Epstein LH. Effects of social context on overweight and
normal-weight children's food selection. Eat Behav 2008;9:190-6.
41. Salvy SJ, de la Haye K, Bowker JC, Hermans RC. Influence of peers and friends
on children's and adolescents' eating and activity behaviors. Physiol Behav
2012;106:369-78.
42. Cooke LJ, Chambers LC, Anez EV, Wardle J. Facilitating or undermining? The
effect of reward on food acceptance. A narrative review. Appetite 2011;57:493-7.
43. Deci EL, Koestner R, Ryan RM. A meta-analytic review of experiments
examining the effects of extrinsic rewards on intrinsic motivation. Psychol Bull
1999;125:627-68; discussion 92-700.
44. Tapper K, Horne PJ, Lowe CF. The Food Dudes to the rescue! Psychologist
2003;16:18-21.
45. Lowe CF, Dowey, A., Horne, P. Changing what children eat. In: The Nation's
Diet. London: Longman, 1998:57-80.

21
CHAPTER 2
EVIDENCE FOR THE EFFECTIVENESS OF THE FOOD DUDES PROGRAM
IN ADOLESCENTS: A REVIEW
ABSTRACT
Americans are not eating the recommended amount of FV. Adolescents
particularly struggle with poor diet quality. Studies show that FV intake decreases and
consumption of less healthy foods increases during adolescence. FV intake is associated
with chronic disease and obesity prevention, so increasing adolescent FV intake is an
important aim.
The transition into adolescence is associated with increased levels of autonomy.
Some studies suggest that increased autonomy is a risk factor for poor dietary choices,
however other studies have found increased autonomy to be associated with greater self-
control and an increase in health promoting behavior. Changes in the school food
environment also impact young people during the transition into secondary school and
adolescence.
The FD healthy eating program has been found to be an effective program for
increasing FV consumption at school. The FD program uses a combination of repeated
tasting, rewards, and role modeling. Studies used to support the effectiveness of the
program were generally done in pre-school or early elementary age children.
Repeated tasting has been shown to increase liking for FV in adolescents, but
further studies need to be done to test if this is linked to an increase in FV consumption.
Using rewards to encourage increased FV intake is controversial. Although rewards can

22
be an effective tool, caution needs to be used to prevent rewards from backfiring and
decreasing intrinsic motivation to eat FV.
Peer influences are especially important during adolescence. Peer modeling may
be effective in adolescents, but it is important to also remember the importance of
perceived social norms. What adolescents think their peers are doing may be more
important that their actual behavior. Other literature reviewed in this study suggests that
the Food Dudes program may have a positive impact on increasing adolescent FV intake.
INTRODUCTION
Americans are not eating the recommended amount of FV. Guenther et al. found
that only 40% of American’s were consuming an average of 5 or more servings of FV per
day (1). The statistics for US adolescents are especially alarming as significant decreases
in FV intake are seen during the transition from childhood (2). Increased consumption of
less healthy beverages and snack foods are also seen during this transition. Data shows
that this decline in FV intake during adolescence is becoming an international problem as
well (3).
The health benefits of diets high in FV in preventing chronic diseases such as
cardiovascular disease, hypertension, diabetes, and some types of cancer are well
established (4, 5). There is also evidence that FV consumption may protect against
obesity (6-8). In the US, 1 in 3 children between the ages of 2 to 18 are overweight and
16.9% are considered obese (9) and approximately 70% of those obese children will go
on to become obese adults (4). A population sample of 5- to 17-y-olds found that 70% of
obese children already have at least 1 risk factor for cardiovascular disease (10).
Increasing FV intake is an important target for improving adolescent health.

23
Adolescence is a critical stage in the development of healthy eating behaviors
because habits developed during this time will likely continue into adulthood (11, 12).
During adolescence youth begin to develop more autonomy over their food choices and,
as is the case with other behaviors during this period, the influence of parents decreases
while the influence of peers simultaneously increases. One way to help combat unhealthy
eating habits during adolescence may be to target children’s eating habits before they
enter secondary school. Upon entering middle school, children are faced with an
increasing number of competitive food options as well as more independence in deciding
what they will consume.
The FD healthy eating program is a school based program that has had clinically
significant results in increasing children’s FV intake (13). This literature review will
investigate the literature on the problems related to unhealthy diets during adolescence. It
will also investigate the literature behind the individual components of the FD program,
repeated tasting, rewards, and role modeling, and whether or not the evidence supports
the idea that participation in the FD program during elementary school could help prevent
a future decline in FV intake during the transition into middle school.
FACTORS DETERMINING ADOLESCENT INTAKE OF FRUITS AND
VEGETABLES
Adolescent Autonomy
The transition into middle school coincides with the transition from childhood
into adolescence. Adolescence, a stage of development beginning with the onset of
puberty (generally around age 12) and ending with the onset of adulthood (14), is a time
of increasing independence from parental influences (15). The development of autonomy

24
during adolescence involves finding a healthy balance between independence and
dependence (14). The influence of this increasing autonomy on health related behaviors,
including eating habits, is not entirely clear. Higher levels of autonomy have been found
to be associated with higher levels of health promoting behavior in some adolescents
(14). Other studies, however, suggest that higher levels of autonomy may be associated
with a decrease in diet quality (16).
In a desire to demonstrate increasing independence many youth will rebel against
parents. Some youth will deliberately develop unhealthy eating habits as a form of
rebellion in an attempt to escape from parental control (17). Other youth, however,
develop more self-control as they gain more independence in their decision making
which may lead to healthier choices (14, 18). Stok et al. has suggested that the role
autonomy plays in eating behaviors depends on the motives of autonomy (18). If the
adolescent is seeking autonomy to gain social acceptance from his or her peers, it seems
that may have a negative impact on eating behaviors. If the desire for autonomy comes
from a desire to self-regulate, autonomy may actually play a positive role in the
development of healthy eating behaviors (18).
Data on FV and Competitive Food Intake in Adolescents
Regardless of the exact role autonomy plays in the development of healthy eating
behaviors, it is clear that for the majority of the youth the transition into adolescence is a
time of increased risk of developing less than ideal eating patterns. A variety of studies
done both in the US and internationally show that FV intake, as well as intake of low fat
dairy products, decreases with age as youth transition from childhood into adolescence
(3, 9, 19, 20). Along with this decrease in nutrient dense foods, there is an increase in the

25
intake of calorie dense and nutrient empty foods and beverages, especially sugar
sweetened beverages.
In a cross sectional study using data for children and adolescents age 2-18 taken
from the 1999-2002 HHANES data, Lorson et al. found that adolescents ages 12-18 were
the least likely to meet the recommendations for FV intake (2). In the 12- to 18-y-old
group 80.5% were not meeting the daily recommended intake of fruit and 89.5% were not
meeting the daily recommended intake of vegetables, compared to 74.1% and 83.8% for
the 6- to 11-y-old group and 50.2% and 78.3% for the 2- to 5-y-old group (9). A
multinational study conducted by the World Health Organization (WHO) shows that this
phenomenon is not unique to the US (3). The WHO study also shows that adolescents
have an increased intake of less healthy foods and beverages.
A cohort study by Lytle et al. followed 291 students from Minnesota schools
through 3rd grade, 5th grade, and 8th grade and tracked changes in their dietary habits
over time using data from self-reported 24 hour recalls (10). The percentage of students
consuming FV was found to drop significantly between 5th grade and 8th grade. During
5th grade 55.9% of students self-reported eating fruit, only 37.1% reported doing so in 8th
grade. During 5th grade 49.5% of students self-reported eating vegetables, this dropped to
41.6% in 8th graders. It was also found that soda consumption increased significantly
between 3rd grade and 5th grade and again between 5th grade and 8th grade (10).
A cross sectional study of Texas 4th, 8th, and 11th grade students also found that
children in higher grades showed greater consumption of less healthful foods and
decreased consumption of healthier foods compared to their younger peers (20). The
study found that over 70% of 8th and 11th graders had drunk soda or soft drinks,

26
compared to only 61% of 4th graders. Snack consumption was found to increase linearly
by grade (P < .001) and, compared with 4th graders, 8th and 11th graders were less likely
to consume healthier food options such as yogurt, fruit, and milk and more likely to
consume French fries and sweet pastries (20). The trends seen in these studies are clear;
overall diet quality decreases with age during the transition from childhood into
adolescence.
Availability of Competitive Food
One reason for these changes in eating habits upon entering adolescence could be
the change in the school food environment. At the same time young adolescents are
adjusting to new found autonomy and a transition to a new school environment, the
school food environment also changes significantly. The transition from elementary
school into middle school presents students with access to many more competitive food
options. Although competitive foods are available in a significant number of elementary
schools (73% of elementary schools compared to 97% of middle schools), secondary
schools have been found to offer items higher in fat and calories (21, 22). Also, while
only 27% of elementary schools have vending machines, they can be found in 87% of
middle schools with more than 50% of middle schools having vending machines in or
near the cafeteria (22).
A study of Texas middle school students found that 36 % of students purchased
their lunches exclusively from snack bars and another 26% had a combination of home or
school lunch and snack bar foods (23). Fifth graders who purchased their meals just from
a la carte lines consumed on average .4 servings of FV compared to .82 servings for 5th
graders participating in the National School Lunch Program (NSLP) (23). A cross-
27
sectional study of Minnesota 7th graders found that students with a la carte options at their
school consumed nearly a serving less of FV per day than students with no a la carte
option available (3.39 vs 4.23, P=.02) (24).
The problem does not seem to be so much a lack of access to healthy choices so
much as an abundance of availability of less healthy choices. A study of the influence of
vending machines on the lunch time eating behaviors of Florida middle school students
by Park et al. found that although healthier choices were usually available, the most
common items purchased from vending machines were chips, pretzels/crackers, candy
bars, soda, and sport drinks (25). This further suggests the importance of helping children
develop healthy eating patterns before entering secondary school.
RESEARCH ON THE EFFECTIVENESS OF FOOD DUDES INTERVENTION
COMPONENTS FOR OLDER CHILDREN
FV consumption during childhood has been found to influence adolescent fruit
and vegetable consumption (12). Programs to increase intake of FV during elementary
school, before the transition into middle school and adolescence, therefore may be one
way to help improve trends in adolescent nutrition. School based interventions to increase
FV intake have reported modest levels of statistical success; however, few have produced
clinically significant results. In a review of 21 school-based intervention studies aimed at
increasing FV intake, the average increase in total daily FV intake was only .25 portions
(1/8 cup) (26).The Food Dudes Healthy Eating Program (FD) is one intervention that has
had consistent and clinically significant results in increasing FV intake in elementary
school age children both in the U.S. and abroad (13, 27, 28).
28
The UK research team behind the FD program initially tested elements of the FD
program in a home setting (29). A group of children who were considered selective eaters
received elements of the FD program including repeated tasting, rewards for tasting FV,
and peer modeling (30). The program was later broadened for usage in entire primary
schools. The whole school interventions found consistent and clinically significant
increases in FV intake post-intervention (13, 27). A 2004 study, which included three
primary schools in England and Wales, found that immediately following the intervention
the estimated increase in total daily FV intake was 2.54 portions for 4- to 7-y-olds and
2.18 portions for 7- to 11-y-olds (27). The original FD program targeted increasing
children’s consumption of school provided FV. A variation of the program, however, was
introduced in Ireland where students’ lunches are provided by parents. The Irish program
was successful in increasing parental provision of FV as well as increasing child
consumption of FV and the program has been implemented in all primary school across
Ireland (28).
A research team from USU conducted a single school pilot study of the FD
program adapted to the schedule of US schools. The key difference from the UK program
was that repeated tasting of researcher-provided FV took place during lunchtime rather
than during snack time since a morning snack is not part of the typical US elementary
school schedule. The US pilot study found results similar to the original UK study,
showing that the greatest increase in FV consumption occurred in those students who
showed the lowest baseline consumption (31).
The FD program uses 3 main elements to encourage behavior change towards
eating more FV. These include repeated tasting, rewards, and role modeling. Much of the
29
evidence that has been cited for the effectiveness of these methods comes from studies
done in preschool or early elementary aged children. The purpose of the following
sections are to review whether or not there is evidence for the effectiveness of these
methods in increasing FV intake in older children and adolescents.
Repeated Tasting
It has been found that for both children and adolescents, taste is the single most
important factor on consumption. Children and adolescents will eat what they like, so
increasing liking for FV may be one of the most effective ways to increase consumption
of these foods. Experimental lab studies have demonstrated that exposure, through
repeated tasting, can increase liking of foods in both children and adults (32-34). The
concept of repeat tasting to increase liking of new or previously disliked foods is derived
from the “mere exposure” effect, a phenomenon first quantitatively studied by
psychologist Robert B. Zajonc (35). Zajonc found that repeated exposure to any stimulus
tends to increase an individual’s liking of that stimulus (35).
The majority of studies on repeated tasting have been done with toddlers, pre-
school or early elementary school age children (34). These studies have found that
repeated tasting can increase both liking for and consumption of previously disliked
foods. A study of preschoolers by Cooke et al. found that repeated tasting increased
liking and consumption of red peppers immediately post intervention (36). However,
although the increase in liking was maintained upon follow-up, the increase in
consumption was not. It seems possible and reasonable that this may also be applicable to
older children but research testing this hypothesis is lacking.
30
Two recent studies by Lakkakula et al. have reported on the effectiveness of a
repeated tasting intervention in older elementary school age children (37, 38). The first
study included 340 4th and 5th grade students from low income elementary schools in
Louisiana. Students were offered a taste of carrots, peas, tomatoes, and bell peppers once
a week for 10 weeks. During tasting sessions, children were asked to complete a survey
asking whether or not they had actually tried each of the FV and rate their liking of the
foods. Liking for the FV was found to increase after eight to nine exposures for children
who had previously disliked the foods, however no follow-up was reported assessing
whether or not increases in liking were maintained over time (37). It is important to note
that consumption was not measured for this study.
The second study included 379 children attending 1st, 3rd, or 5th grade at 2 low
income Louisiana public elementary schools. The intervention was an 8-week program
with fruits offered twice a week for 4 weeks and vegetables offered twice a week for 4
weeks on an alternating schedule. A 2-week follow-up was done at 4 mo and 10 mo post-
intervention (5th graders were not included in the 10 mo follow-up). As in the other
study, children were asked to self-report whether or not they had tasted the foods and to
rate how much they liked each food. The children who had initially disliked a particular
fruit or vegetable were found to have increased their liking by the end of the program and
this increase in liking was maintained at both of the follow-ups (38). As in the first study,
consumption was not measured.
These studies demonstrate that repeated tasting can be effectively used to increase
liking of FV in older elementary school age children who previously disliked those foods,
however, because the fifth graders were not followed into middle school it is unclear

31
whether or not this increase in liking would be maintained during the transition into
middle school. Also, since consumption was not measured for either of these studies, it
remains unclear whether or not repeated tasting is actually effective at increasing
consumption of FV in older children, or if it only has an effect on perceived liking of FV
without actually changing consumption. Further studies are needed to understand whether
or not repeated tasting is an effective tool for increasing consumption of FV in older
children and whether or not that increase in consumption can be maintained during the
transition into middle school and early adolescence.
Rewards
The use of rewards to encourage healthy eating is controversial. Although the use
of rewards to reinforce behavior has been well established, concerns have been raised
about potentially negative effects from offering rewards. Two main theories regarding the
potential negative effects of rewards have been presented (36). The first theory is the self-
determination theory. These theorists suggest that when external rewards are given for a
behavior it may be detrimental to an individual’s sense of autonomy and as a result may
decrease intrinsic motivation to perform the rewarded behavior (36, 39). This may be
significant for adolescents who are striving to develop autonomy. According to Deci et
al. rewards may be perceived either as controlling behavior or as indicators of
competence (39). This suggests that used correctly rewards could be an effective tool for
shaping adolescent behavior since adolescents have a natural desire to demonstrate
autonomy and competence (14), but caution must be used to make sure youth do not feel
that their behavior is being overly controlled or the result could backfire.
32
The second theory on rewards is the over justification theory. According to
proponents of the over justification theory, individuals come to more strongly associate
the external reward with their behavior than their own intrinsic motivations for exhibiting
the behavior (36). In this case, when rewards are removed, the desired behavior may
decrease or disappear altogether. Early lab-based nutrition studies found this effect;
however many of these studies were conducted using foods that, though novel, were
already palatable to participants, for example sweet milk beverages (36, 40). Studies done
using less palatable foods show that the risk of over justification is minimal when target
food is initially disliked (41, 42). This may be one reason the FD program appears to be
most successful in increasing FV intake for those children who consumed the least to
begin with (27, 31).
Another important aspect of rewards is the use of praise as a reward. An early
study by Birch et al. found that verbal praise negatively influenced intrinsic motivation to
consume a previously unfamiliar, but generally well liked sweetened milk beverage (40).
The 2010 study by Cooke et al. previously mentioned in the repeated tasting section of
this literature review compared the effectiveness of tangible rewards versus praise. Both
the tangible reward group and the praise group significantly increased their intake of the
target vegetable; however, intake for the tangible reward group was significantly greater
than the praise group. Both groups were found to maintain their increased intake of the
target vegetable at both one and three month follow-ups. Additionally, the study found
that both tangible rewards and praise increased liking of the target vegetable, with no
significant difference between the two groups, and that increased liking was maintained
upon follow-up (41). This study suggests that both tangible rewards and praise may be

33
effectively used to increase consumption of previously disliked FV without undermining
intrinsic motivation.
The studies that have been conducted testing the influence of verbal praise as a
reward have largely been done in preschool or early elementary age children so it is
difficult to make assumptions about the effectiveness of praise for older children and
adolescents. A review by Henderlong and Lepper does give some insight on using praise
as a reward for older children and adolescents (43). The review suggests that sincere
praise may increase feelings of competence, however it is important that the praise be
sincere. Offering praise for easy tasks may decrease feelings of competence. It is also
important that praise be offered in such a way that it does not decrease perceived
autonomy (43). This suggests that praise has the potential to be as effective in older
children and adolescents as it has been found to be in children, but used incorrectly it
risks giving the perception of taking away the young person’s autonomy.
Role Modeling
The influence of peers becomes more important during late childhood and early
adolescence. It is possible that the role of peer models may be even more important during
this stage of development. Most current understanding on the role of modeling in learning
and shaping behavior comes from the work of Albert Bandura who formally introduced
the Social Cognitive Theory in the 1980’s. According to the social cognitive theory people
can learn not just from being taught directly, but by watching the behaviors of others (44).
Bandura emphasizes that modeling is more than imitation (45). An early study by Bandura
in the 1960’s focused on learned aggression. Bandura had young children watch adults play
with an inflatable doll. Those children who watched the adults play violently and
34
aggressively with the toy were more likely to show aggressive behavior when they were
later placed in a room to play with the inflatable doll than those who had seen adult models
who did not demonstrate aggressive play behavior (46). Bandura’s work demonstrated that
behavior could be elicited by modeling a desired response rather than by reinforcement.
Bandura’s theories on observational learning have been extended and applied in
many fields to help shape behavior. The FD program utilizes modeling in 2 ways. First,
videos of and letters from preteen super heroes, the FD, are presented to the children. The
FD are shown using super powers they gained after consuming FV. The FD use these
powers to fight off the evil Junk Punks. Support for the use of cartoon models comes
from Bandura’s work on aggression, which found that cartoon models could elicit
aggression almost as effectively as adult models (47). In the study children were either
exposed to a live actor modeling aggression, a filmed actor modeling aggression, or a
cartoon modeling aggression. The levels of imitative as well as overall aggression were
all found to be similar and were statistically greater than the control group that was not
exposed to any kind of aggressive model (47). A nutrition-based study from 1972 also
found that cartoons can be effective models of behavior (48). Showing children the
popular cartoon character Popeye eating spinach before spinach was served was found to
be just as effective as using a peer model to encourage spinach tasting (48).
The second form of modeling comes from watching the behavior of other
participants. As some of the children comply with eating the required amount of FV to
earn a hand stamp and reward, they become models of the desired behavior for their peers
(27). When the behavior of a model is reinforced, it increases the likelihood that the
observer will adopt similar behavior (45). Most nutrition studies on peer modeling have
35
been conducted in preschool aged children. In these studies a child was selected from the
group and trained to eat a novel food in order to serve as a model for the rest of the
participants in their group during meal or snack time. Children in the studies were found
to be more likely to imitate the behavior of peers they respect, who were generally well
liked, who were slightly older, and who were less aggressive (49, 50). One study also
found that they were more likely to imitate female peer models than males (49).
A 2008 study by Salvy et al. evaluated the effect of social context on the food
choices of both overweight and normal weight children between the ages of 10 and 12
(51). For one portion of the study, children were partnered with an unfamiliar peer during
snack time. For both overweight and normal weight children, the selection of healthy
snacks was strongly related to their partner’s selection of healthy snacks. Researchers
concluded that including peers in interventions to increase healthy food consumption may
be useful (51). The study was limited because the children were paired with a single
unfamiliar peer; presence of a familiar peer or multiple peers may change the influence
on snack selection. In a later review of school-based interventions Salvy et al. also
recognized that peer modeling may be one potential mechanism for increased FV intake
in the FD and other similar studies. However, they suggested that especially for
overweight children and adolescents, it is possible that individuals were attempting to
conform to social norms and avoid the stigma associated with overweight individuals
who eat unhealthy foods rather than responding to peer models (52).

36
SOCIAL NORMS THEORY
Though not part of the original FD program, social norms theory is another
approach for looking at the importance of peer influence. While research on the FD
program has not looked at the influence of social norms, they likely play an important
role. According to the social norms theory, individual behavior is strongly influenced by
the individual’s perception of what is the norm for their peer group. The social norms
approach has been used in the past to predict and prevent behaviors such as alcohol and
tobacco use among young people (53-55). Studies of both secondary school and college
students have found that young people’s perception of their peer’s behavior and attitudes
towards substance abuse is a strong predictor of their personal use of these substances
(56).
More recently the social norms approach has been applied to research on
nutrition-related health behaviors. Most of these studies are careful to distinguish
between descriptive norms and injunctive norms. Descriptive norms are an individual’s
beliefs about what others do (for example, beliefs about how many FV their peers eat
during the week) whereas injunctive norms are an individual’s beliefs about others’
attitudes toward a behavior (for example, beliefs about how their peers feel about eating
FV) (57, 58). Descriptive norms have been found to be a better predictor of behavior than
injunctive norms (59), particularly during the adolescent stage of development (57).
A cross-sectional study by Lally et al. of 16-19 year old students in the UK found
descriptive norms to be a strong predictor of actual behavior (57). Participants answered
questions about their own intake of unhealthy snacks, sugar sweetened beverages, and
FV, what they believed their peers intake of these items to be (descriptive norms), and
37
what they believed their peers attitudes about these food groups were (injunctive norms).
Average perceived peer intake of snacks and sugar sweetened beverages was found to be
significantly higher than the average reported actual intake, while perceived intake of FV
was found to be lower than actual intake levels. Perceived intake of snacks was found to
account for 21% of the variance in actual intake, perceived intake of sugar sweetened
beverages was found to account for 17% of the variance in actual intake, and perceived
intake of FV was found to account for 22% of the variance in actual intake. Injunctive
norms were not found to have a significant influence on actual intake (57).
Similarly, a cross-sectional study by Perkins et al. on perceived intake of sugar-
sweetened beverages in 6th-12th graders found that 76% of students overestimated the
daily consumption of their peer group (58). In this study, students were asked about their
personal consumption of sugar-sweetened beverages and their perceived intake of their
peers. Personal consumption levels were averaged to give an estimate of average actual
intake and perceived intake levels were averaged to give an estimate of overall perceived
intake. Perceived intake was found to account for 34% of the variability in individual
consumption, even after the actual average peer intake and variance in student
characteristics were taken into account (58).
Changing perceived norms may be an important way to improve adolescent
consumption of FV. Few studies have been done on the impact of targeting messages
about descriptive norms to adolescents in order to manipulate eating behavior, however
this tactic has been successfully used to influence tobacco and alcohol use (54, 55). A
field study by Mollen et al. conducted in the cafeteria of a private east coast university in
the US found that presenting descriptive norms messages promoting healthy eating
38
increased the consumption of healthy food (59). Robinson et al. have also suggested that
future nutrition interventions should utilize positive descriptive norm messages to
encourage healthy eating behaviors (60). Positive messages about adolescent FV intake
are an important step for future interventions to increase adolescent consumption of FV.
CONCLUSION
The transition from childhood and elementary school into adolescence and middle
school is associated with decreases in FV intake. The transition into is associated with not
only an increased desire for autonomy, but a food environment that promotes a variety of
choices, many of which are not conducive to a healthy, balanced diet. Eating patterns
from childhood have been found to carry into adolescence, so targeting children before
they transition into adolescence and enter secondary school may help to prepare these
children to make better food choices. There is evidence the elements of the FD program
including repeated tasting, reward, and role modeling may be useful in encouraging
behavior change in elementary school age children. Future research should be done to
take into account the importance of social norms and help to reshape the idea that
adolescents all eat unhealthy, to a more realistic image of adolescents eating a varied diet.
REFERENCES
1. Guenther PM, Dodd KW, Reedy J, Krebs-Smith SM. Most Americans eat much
less than recommended amounts of fruits and vegetables. J Am Diet Assoc
2006;106:1371-9.
2. Lorson BA, Melgar-Quinonez HR, Taylor CA. Correlates of fruit and vegetable
intakes in US children. J Am Diet Assoc 2009;109:474-8.
39
3. Currie C, Robert, C., Morgan, A., Smith, R., Setterbulte, W., Samdal, O.,
Rasmussen, V. B. Young people's health in context. Health behaviour in school-
aged children. Copenhagen: WHO, 2004.
4. Reilly JJ, Methven E, McDowell ZC, Hacking B, Alexander D, Stewart L, Kelnar
CJ. Health consequences of obesity. Arch Dis Child 2003;88:748-52.
5. Boeing H, Bechthold A, Bub A, Ellinger S, Haller D, Kroke A, Leschik-Bonnet
E, Muller MJ, Oberritter H, et al. Critical review: vegetables and fruit in the
prevention of chronic diseases. Eur J Nutr 2012;51:637-63.
6. Matthews VL, Wien M, Sabate J. The risk of child and adolescent overweight is
related to types of food consumed. Nutr J 2011;24:10.
7. Tohill BC, Seymour J, Serdula M, Kettel-Khan L, Rolls BJ. What epidemiologic
studies tell us about the relationship between fruit and vegetable consumption and
body weight. Nutr Rev 2004;62:365-74.
8. Evidence Analysis: Fruit and Vegetable Intake and Childhood Overweight. 2014
http://andevidencelibrary.com/evidence.cfm?evidence_summary_id=25 (accessed
21 March 2014).
9. Ogden CL, Carroll MD, Curtin LR, Lamb MM, Flegal KM. Prevalence of high
body mass index in US children and adolescents, 2007-2008. JAMA
2010;303:242-9.
10. Freedman DS, Mei Z, Srinivasan SR, Berenson GS, Dietz WH. Cardiovascular
risk factors and excess adiposity among overweight children and adolescents: the
Bogalusa Heart Study. J Pediatr 2007;150:12-7 e2.

40
11. Videon TM, Manning CK. Influences on adolescent eating patterns: The
importance of family meals. J Adolesc Health 2003;32:365-73.
12. Rasmussen M, Krolner R, Klepp K-I, Lytle L, Brug J, Bere E, Due P.
Determinants of fruit and vegetable consumption among children and adolescents:
a review of the literature. Part I: Quantitative studies. Int J Behav Nutr Phys Act
2006;3:22.
13. Horne PJ, Tapper K, Lowe CF, Hardman CA, Jackson MC, Woolner J. Increasing
children's fruit and vegetable consumption: a peer-modelling and rewards-based
intervention. Eur J Clin Nutr 2004;58:1649-60.
14. Spear HJ, Kulbok P. Autonomy and adolescence: A concept analysis. Public
Health Nurs 2004;21:144-52.
15. Hill AJ. Developmental issues in attitudes to food and diet. Proc Nutr Soc
2002;61:259-66.
16. Bassett R, Chapman GE, Beagan BL. Autonomy and control: The co-construction
of adolescent food choice. Appetite 2008;50:325-32.
17. Stevenson C, Doherty G, Barnett J, Muldoon OT, Trew K. Adolescents' views of
food and eating: Identifying barriers to healthy eating. J Adolesc 2007;30:417-34.
18. Stok FM, De Ridder DTD, Adriaanse MA, De Wit JBF. Looking cool or attaining
self-rule. Different motives for autonomy and their effects on unhealthy snack
purchase. Appetite 2010;54:607-10.
19. Lytle LA, Seifert S, Greenstein J, McGovern P. How do children's eating patterns
and food choices change over time? Results from a cohort study. Am J Health
Promot 2000;14:222-8.
41
20. Perez A, Hoelscher DM, Brown HS, 3rd, Kelder SH. Differences in food
consumption and meal patterns in Texas school children by grade. Prev Chronic
Dis 2007;4:A23.
21. Gordon AR, Crepinsek MK, Briefel RR, Clark MA, Fox MK. The Third School
Nutrition Dietary Assessment Study: Summary and Implications. J Am Diet
Assoc 2009;109:S129-S35.
22. Story M. The Third School Nutrition Dietary Assessment Study: Findings and
Policy Implications for Improving the Health of US Children. J Am Diet Assoc
2009;109:S7-S13.
23. Cullen KW, Eagan J, Baranowski T, Owens E, de Moor C. Effect of a la carte and
snack bar foods at school on children's lunchtime intake of fruits and vegetables. J
Am Diet Assoc 2000;100:1482-6.
24. Kubik MY, Lytle LA, Hannan PJ, Perry CL, Story M. The association of the
school food environment with dietary behaviors of young adolescents. Am J
Public Health 2003 Jul;93:1168-73.
25. Park S, Sappenfield WM, Huang YJ, Sherry B, Bensyl DM. The Impact of the
Availability of School Vending Machines on Eating Behavior during Lunch: the
Youth Physical Activity and Nutrition Survey. J Am Diet Assoc 2010;110:1532-
6.
26. Evans CE, Christian MS, Cleghorn CL, Greenwood DC, Cade JE. Systematic
review and meta-analysis of school-based interventions to improve daily fruit and
vegetable intake in children aged 5 to 12 y. Am J Clin Nutr 2012;96:889-901.
42
27. Lowe CF, Horne PJ, Tapper K, Bowdery M, Egerton C. Effects of a peer
modelling and rewards-based intervention to increase fruit and vegetable
consumption in children. Eur J Clin Nutr 2004;58:510-22.
28. Horne PJ, Hardman CA, Lowe CF, Tapper K, Le Noury J, Madden P, Patel P,
Doody M. Increasing parental provision and children's consumption of lunchbox
fruit and vegetables in Ireland: the Food Dudes intervention. Eur J Clin Nutr
2009;63:613-8.
29. Lowe CF, Dowey, A., Horne, P. Changing what children eat. The Nation's Diet.
London: Longman, 1998:57-80.
30. Tapper K, Horne PJ, Lowe CF. The Food Dudes to the rescue! Psychologist
2003;16:18-21.
31. Wengreen HJ, Madden GJ, Aguilar SS, Smits RR, Jones BA. Incentivizing
children's fruit and vegetable consumption: results of a United States pilot study
of the Food Dudes Program. J Nutr Educ Behav 2013;45:54-9.
32. Liem DG, de Graaf C. Sweet and sour preferences in young children and adults:
role of repeated exposure. Physiol Behav 2004;83:421-9.
33. Pliner P. The effects of mere exposure on liking for edible substances. Appetite
1982;3:283-90.
34. Cooke L. The importance of exposure for healthy eating in childhood: a review. J
Hum Nutr Diet 2007;20:294-301.
35. Mere exposure effect. Elsevier's Dictionary of Psychological Theories, 2006.
36. Cooke LJ, Chambers LC, Anez EV, Wardle J. Facilitating or undermining? The
effect of reward on food acceptance. A narrative review. Appetite 2011;57:493-7.

43
37. Lakkakula A, Geaghan J, Zanovec M, Pierce S, Tuuri G. Repeated taste exposure
increases liking for vegetables by low-income elementary school children.
Appetite 2010;55:226-31.
38. Lakkakula A, Geaghan JP, Wong WP, Zanovec M, Pierce SH, Tuuri G. A
cafeteria-based tasting program increased liking of fruits and vegetables by lower,
middle and upper elementary school-age children. Appetite 2011;57:299-302.
39. Deci EL, Koestner R, Ryan RM. A meta-analytic review of experiments
examining the effects of extrinsic rewards on intrinsic motivation. Psychol Bull
1999;125:627-68; discussion 92-700.
40. Birch LL, Marlin DW, Rotter J. Eating as the means activity in a contingency -
effects on young childrens food preference. Child Dev 1984;55:431-9.
41. Cooke LJ, Chambers LC, Anez EV, Croker HA, Boniface D, Yeomans MR,
Wardle J. Eating for pleasure or profit: the effect of incentives on children's
enjoyment of vegetables. Psychol Sci 2011;22:190-6.
42. Wardle J, Herrera ML, Cooke L, Gibson EL. Modifying children's food
preferences: the effects of exposure and reward on acceptance of an unfamiliar
vegetable. Eur J Clin Nutr 2003;57:341-8.
43. Henderlong J, Lepper MR. The effects of praise on children's intrinsic motivation:
A review and synthesis. Psychol Bull 2002;128:774-95.
44. Social learning theory. Corsini Encyclopedia of Psychology and Behavioral
Science, 2010.
45. Bandura A. Observational learning. Englewood Cliffs, NJ: Prentice-Hall, 1986.

44
46. Bandura A, Ross D, Ross SA. Transmission of aggression through imitation of
aggressive models. J Abnor Soc Psychol 1961;63:575-82.
47. Bandura A, Ross D, Ross SA. Imitation of film-mediated agressive models. J
Abnorm Soc Psychol 1963 Jan;66:3-11.
48. Harris MB, Baudin H. Models and vegetable eating: the power of Popeye.
Psychol Rep 1972;31:570.
49. Hendy HM. Effectiveness of trained peer models to encourage food acceptance in
preschool children. Appetite 2002;39:217-25.
50. Greenhalgh J, Dowey AJ, Horne PJ, Lowe CF, Griffiths JH, Whitaker CJ.
Positive- and negative peer modelling effects on young children's consumption of
novel blue foods. Appetite 2009;52:646-53.
51. Salvy SJ, Kieffer E, Epstein LH. Effects of social context on overweight and
normal-weight children's food selection. Eat Behav 2008;9:190-6.
52. Salvy SJ, de la Haye K, Bowker JC, Hermans RC. Influence of peers and friends
on children's and adolescents' eating and activity behaviors. Physiol Behav
2012;106:369-78.
53. Perkins HW, Craig DW. The imaginary lives of peers: Patterns of substance use
and misperceptions of norms among secondary school students. The social norms
approach to preventing school and college age substance abuse: a handbook for
educators, counselors, and clinicians. San Francisco, CA: Jossey-Bass, 2003:209-
23.
54. Linkenbach JW, Perkins HW. Most of us are tobacco free: An eight-month social
norms campaign reducing youth initiation of smoking in Montana. In: The social
45
norms approach to preventing school and college age substance abuse: a
handbook for educators, counselors, and clinicians. San Francisco, CA: Jossey-
Bass, 2003:224-34.
55. Haines MP, Barker GP, Rice R. Using social norms to reduce alcohol and tobacco
use in two midwestern high schools. In: The social norms approach to preventing
school and college age substance abuse: a handbook for educators, counselors,
and clinicians. 2003:235-44.
56. Perkins HW. The social norms approach to preventing school and college age
substance abuse: a handbook for educators, counselors, and clinicians. 1st ed. San
Francisco: Jossey-Bass, 2003.
57. Lally P, Bartle N, Wardle J. Social norms and diet in adolescents. Appetite
2011;57:623-7.
58. Perkins JM, Perkins HW, Craig DW. Misperceptions of peer norms as a risk
factor for sugar-sweetened beverage consumption among secondary school
students. J Am Diet Assoc 2010;110:1916-21.
59. Mollen S, Rimal RN, Ruiter RAC, Kok G. Healthy and unhealthy social norms
and food selection. Findings from a field-experiment. Appetite 2013;65:83-9.
60. Robinson E, Blissett J, Higgs S. Social influences on eating: implications for
nutritional interventions. Nutr Res Rev 2013;26:166-76.

46
CHAPTER 3
THE IMPACT OF PARTICIPATION IN THE FOOD DUDES HEALTHY
EATING PROGRAM ON DIETARY HABITS IN 4th AND 5th GRADE STUDENTS
IN CACHE COUNTY UTAH AFTER ONE YEAR
ABSTRACT
American children are not consuming the recommended intake of FV. Diet
quality decreases during adolescence with decreases in FV intake and increases in intake
of less healthy food. Eating habits established during childhood carry over into
adolescence, so targeting children’s FV intake while in elementary school may prevent
decreases in intake seen during adolescence. The purpose of this study was to answer the
question: Does participation in the FD program help to offset the decrease in FV intake
and the increase in energy dense food commonly seen during the transition from
elementary school into middle school?
Participants were 4th and 5th graders from six elementary schools, recruited during
the 2011-2012 school year (n= 874). Treatment groups were assigned by school and
included a prize, praise, and control group. Students were followed into the 2012-2013
school year and the 5th grade cohort transitioned into middle school. During 2012-2013
an additional control group was recruited from the middle schools (n=154).
Lunch time FV intake was measured by plate waste photo analysis. Total FV
intake and total intake of less healthy food was self-reported through a fruit, vegetable,
and snack questionnaire. Skin carotenoid levels was measured as an estimate of long-
term FV intake.
47
Participants in both FD treatment groups showed increased lunch time FV intake
over the short term. Participation in the prize group appeared to mediate long term
decreases in lunch time FV intake. A small to medium positive association was found
between total FV intake and less healthy food intake (r ranging from .125 to .355,
p<0.01), suggesting that increases in intake of one food are associated with increases in
intake of the other foods.
This study showed that the FD program has promise in mediating drops in FV
intake seen during the transition into middle school. The total diet portion of the study
suggests that increasing FV intake does not directly impact intake of less healthy foods.
The use of self-reported data for the total diet portion of the study makes it difficult to
draw definitive conclusions. Future studies should use a more precise method to measure
total diet.
INTRODUCTION
In spite of numerous health initiatives and national advertising campaigns
promoting increased FV intake, American children are consuming far less than the
recommended intake of FV (1). The trend becomes even more alarming as children enter
adolescence. Cross-sectional and cohort studies have shown that diet quality decreases
with age as children transition from late childhood to adolescence (2-5). A study of 2- to
18-y-olds using the 1999-2002 NHANES data found that 12- to 18-y-olds were the least
likely age group to meet the recommended intake of FV (2).
The health benefits of diets high in FV in preventing chronic diseases such as
cardiovascular disease, hypertension, diabetes, and some types of cancer are well
established (6, 7). There is also evidence that fruit and vegetable consumption may
48
protect against obesity (8-10). In the US, 1 in 3 children between the ages of 2 to 18 are
overweight and 16.9% are considered obese (11) and approximately 70% of those obese
children will go on to become obese adults (6). A population sample of 5- to 17-y-olds
found that 70% of obese children already have at least 1 risk factor for cardiovascular
disease (12).
In addition to decreased intake of FV during adolescence, data from cross
sectional and cohort studies shows an increase in consumption of energy dense foods and
beverages during this same time period (2-5). The low energy density and high fiber
content of most FV are believed to decrease hunger, increase satiety, and decrease overall
caloric intake and are cited as potential mechanisms for their protective effect against
overweight and obesity (13) and may also help improve overall total diet quality. Studies
on the effect of increasing FV intake on overall diet quality have had mixed results (14,
15). Looney et al. found that increasing intake of healthy foods, including FV, did not
have a significant impact on the intake of less healthy foods (15). Regardless of the
overall impact on total diet, it is clear that increasing FV intake is an important target for
improving adolescent health.
FV intake during childhood has been found to carry over into adolescence (16), so
programs targeting childhood FV intake before the transition into adolescence and middle
school may be one way to improve adolescent nutrition. With more than 32 million
American children participating in the National School Lunch Program (NSLP) (17),
school based nutrition interventions have been targeted as a cost effective way to increase
child FV consumption. Many of these school-based intervention studies have reported
modest levels of statistical success; however, few have produced clinically significant
49
increases in FV consumption. In a review of 21 school-based intervention studies aimed
at increasing FV intake, the average increase in total daily FV intake was only .25
portions (1/8 cup) (18). The FD program, however, is one intervention that has had
consistent and clinically significant results in increasing FV intake in elementary school
age children both in the U.S. and abroad (19-21).
The FD program has been implemented with great success in many primary
schools throughout the UK and Ireland and in 2006 the program received a World Health
Organization Best Practice Award (22). The program uses a combination of repeat
tasting, role modeling, and rewards to increase FV intake in elementary school age
children. Children participating in the intervention had a clinically significant increase in
FV intake during the intervention and maintained higher levels of FV intake upon follow-
up than those in the control group. In a 2004 study, which included three primary schools
in England and Wales, the estimated increase in total daily FV intake was 2.54 portions
for 4- to 7-y-olds and 2.18 portions for 7- to 11-y-olds immediately following the
intervention (20).
A research team from USU conducted a single school pilot study of the FD
program adapted to the schedule of US schools (21). The key difference from the UK
program was that repeated tasting of researcher provided FV took place during lunchtime
rather than during snack time since a morning snack is not part of the typical US
elementary school schedule. The US pilot study found results similar to the original UK
study, showing that the greatest increase in FV consumption occurred in those students
who showed the lowest baseline consumption (19, 21).

50
Past FD studies have not done a long-term follow-up to see if the increase in FV
intake is maintained. The USU research team developed a 6-school group randomized
control study to test the long term impact of the FD program. The 6-school study also
tested the effectiveness of using praise compared to tangible prizes as a reward to
encourage FV consumption. The full details of the six school study are pending
publication. This paper focuses on participants who were in 4th and 5th grade at the
beginning of the 6-school study and seeks to answer the following questions. Does
participation in the FD program help to offset the decrease in FV intake and the increase
in energy dense food commonly seen during the transition from 5th grade (elementary
school) into 6th grade (middle school)? Is there a condition or grade specific difference in
total lunch time FV intake at 1 y follow-up after completion of the FD program for 4th
and 5th grade participants?
METHODS
Subjects
All 4th and 5th grade students attending 6 Cache County Utah elementary schools
that were part of the FD study during the 2011-2012 school year were invited to
participate in this study (n=874, 49.4% 4th graders). During the 2012-2013 school year
for the follow-up portion of the study, all 4th graders were followed into 5th grade and a
subgroup of the 5th graders was followed into the transition into 6th grade at 3 local
middle schools. During the 2012-2013 follow-up portion of the study an additional 6th
grade control group of students who had not previously participated in the FD study was
recruited from PE classes at the three middle schools (n=154). Consent for participation
in the photo analysis and food frequency portion of the study were obtained through

51
passive consent, with a letter sent home to parents explaining the details of the study. A
separate consent form was also sent home to obtain active consent for participation in the
skin carotenoid scan portion of the study.
Overview of the Food Dudes Study
The study was a cluster randomized control study. Students in 1st through 5th
grade were recruited from six Cache County School District elementary schools during
the 2011-2012 school year. Each school was randomly assigned to one of three groups:
● FD with tangible incentives for consuming FV (Providence and Canyon
Elementary)
● FD with social recognition as the only incentive (Sunrise and Park Elementary)
● Control (Birch Creek and Millville Elementary)
For the purposes of this papers, results will only be reported for 4th and 5th grade
participants.
Basic Overview of Food Dudes 2011-2012: Intervention
Baseline 1 (4 Days)
During Baseline 1, all participants were served FV from the regularly scheduled
school lunch menu. The research team insured that all participating schools served the
same foods during the four days of Baseline 1 and again during Phase 2. Plate waste
photo analysis (PWPA), skin carotenoid levels, and 4th and 5th grade fruit, vegetable, and
snack questionnaires (FVSQ) were obtained for this phase.
Baseline 2 (4 Days)
Baseline 2 was identical to baseline one, except that all participants (including
those who brought lunch from home) were served 60 mg portions of 1 of 4 fruits and 1 of
52
4 vegetables paid for and provided by the research team. The same FV were served
during Phase 1. Only PWPA data was obtained for this phase.
Phase 1 (16 Days)
FD w/ Incentives
Each day before lunch participants in this group were read a letter from and/or
shown a video of the FD. During lunch the same FV as were served during Baseline 2
were served to all participants (including those who brought lunch from home). Lunch
room monitors observed FV consumption and children received hand stamps for
consuming prescribed levels of both fruits and vegetables. After lunch, in the classroom
teachers distributed FD prizes to students who had received hand stamps indicating they
had consumed both fruits and vegetables.
FD w/ Praise
FD with praise was identical to FD with incentives, except that no tangible prizes
were given for eating FV. Instead children received praise in the classroom for receiving
hand stamps.
Control Schools
Students at control schools received the same researcher-provided FV, but did not
receive any videos, letters, hand stamps, verbal praise, or prizes to encourage FV
consumption.
PWPA, skin carotenoid levels, and 4th and 5th grade FVSQ were obtained for all
conditions during this phase.

53
Phase 2 (remainder of academic year)
During phase 2 the number of days that children were required to have consumed
full portions of FV before receiving a prize was increased. After three months conditions
were returned to those of Baseline 1. PWPA, skin carotenoid levels, and 4th and 5th grade
FVSQ were obtained during this phase.
Basic Overview of Food Dudes 2012-2013: Follow-Up
Phase 3 (3 Days)
Conditions were the same as during Baseline 1. This follow-up was completed
during fall 2012. All former participants (including middle school students) had photos
taken of lunch trays. New middle school recruits did not have photos taken. PWPA was
obtained for all students except the middle school control group. Skin carotenoid levels
and 4th and 5th grade FVSQ were obtained during this phase.
Phase 4 (3 Days)
This follow-up was completed during spring 2013 and the methods were identical
to Follow-Up 1. PWPA was obtained for all students except the middle school control
group. Skin carotenoid levels and 4th and 5th grade FVSQ were obtained during this
phase.
Fruit, Vegetable, and Snack Questionnaire
All 4th and 5th and 6th grade participants were asked to complete three fruit,
vegetable, and snack questionnaires (FVSQ) for each phase of the study they participated
in (except Baseline 2). Elementary students were sent home with a food record for each
of the days they would be filling out a questionnaire (generally 2 weekdays and a
54
weekend day) and were asked to keep a record of everything they ate during that day.
The next school day, after keeping the food record, the FVSQs were completed in class.
During Baseline 1 the FVSQ was administered by trained FD researchers. All other times
the FVSQ was administered by teachers who had been given instructions on how to
administer the questionnaire. Sixth graders completed the same FVSQs as the elementary
school children. They were completed during PE class or prep period under the
supervision of trained FD researchers. Previous research by another USU graduate
student found no significant difference between FVSQs filled out using a food record and
those filled out only from memory (23), so 6th graders did not use food records to track
what they ate. Providence Elementary refused to participate in the FVSQ portion of the
follow-up (P3 and P4). FVSQ data from Millville Elementary during P3 were lost and
teachers sent the FVSQ home with the students rather than having them complete it in
class for P4, so Millville was also excluded from the FVSQ analysis during P3 and P4.
The FVSQ used was developed by USU master’s student Anne Lambert who
adapted it from the Snack and Beverage Questionnaire (SNQ) of the Hutchinson Cancer
Institute (23). The FVSQ included a beverage section with seven questions; a snack
foods section with ten questions; a FV section with 3 questions for fruits and 8 questions
for vegetables; and 2 questions specifically about lunch time FV consumption. Portion
size was measured in handfuls for solid foods and in cups for beverages. A pilot version
of the FVSQ was used during P1 at Sunrise and Providence and during P2 only at
Sunrise. This version of the questionnaire asked about intake of each food at school and
not at school, but was changed to asking about overall consumption of each food item
55
and separate questions about school intake only for FV. Sunrise was excluded from
FVSQ analyses for P1 and P2 and Providence was excluded for P1.
The measurement scale used for the beverage section of the questionnaire was
modified slightly between the 2011-2012 portion of the study and the 2012-2013 follow-
up, with the beverage measurement scale changing being changed from none, a few sips,
1 cup, 2 cups, 3 cups, 4+ cups to none, a few sips, ½ cup, 1 cup, 2 cups, 3+ cups (see
supplemental pages for a copy of the questionnaire used during the 2012-2013 follow-
up). The measurements for solid foods were converted from handfuls into cups for
analysis, with one handful being considered equal to ½ cup as follows: none=0 cups, a
few bites=.6 cups, 1 handful=1/2cup, 2 handfuls=1 cup, 3 handfuls=1.5 cups, and 4 or
more handfuls=2 cups.
To measure energy dense food intake, responses for consumption of individual
food items were categorized into sugar sweetened beverages, salty snacks, and sweet
snacks. Sugar sweetened beverages included regular soda/energy drinks and fruit
flavored drinks. Salty snacks included chips, French fries, popcorn, and pretzels/salty
crackers. Sweet snacks included graham crackers, candy, chocolate, pastries, popsicles,
and ice cream. The servings of each food item were totaled to give overall consumption
levels for each category. If any food item from the category was skipped, that category
was coded as missing for that day. Total fruit and total vegetable consumption were
similarly calculated, with all individual questions about fruit added together to give total
fruit and all individual questions about vegetables added together to give total vegetable.
As with the snack categories, if any individual fruit or vegetable question was skipped,
total fruit or total vegetable was coded as missing for that day.
56
Sugar sweetened beverage, salty snack, sweet snack, fruit, and vegetable intakes
were averaged for each phase over the three days. Averages were only calculated if there
were at least two valid, non-missing estimates for a category from the individual,
otherwise the category was coded as missing for that phase. Average total fruit and
average total vegetable intake were totaled to give average total FV intake for the phase.
If either total fruit or total vegetable was missing for an individual, total FV was coded as
missing for that phase. Self-reported lunch time fruit intake was averaged if it was
reported for at least two days and was included only if the student also reported total fruit
intake. The same method was used for lunch time vegetable intake, which was included
only if the student also had reported total vegetable intake.
Photo Analysis
An objective measure of lunch time FV consumption was obtained by plate waste
photo analysis (PWPA). Trained researchers took digital photos of participants’ lunch
trays before and after eating lunch. After photos were uploaded and another group of
trained researchers then sorted the photos so before and after pairs were matched.
Estimates of fruit, vegetable, and milk consumption were recorded independently by 2
different trained researchers who were blinded to each other’s estimates. If the estimates
matched within one piece or .13 cups of each other, the two estimates were averaged (if
different). If the estimates of the two researchers did not match closely enough, a 3rd
estimate was obtained by another trained researcher. If the new estimate matched either
of the previous estimates within 1 piece or .13 cups, the 2 estimates were averaged. If the
third estimate still did not match either of the first 2 estimates, a 4th researcher (a
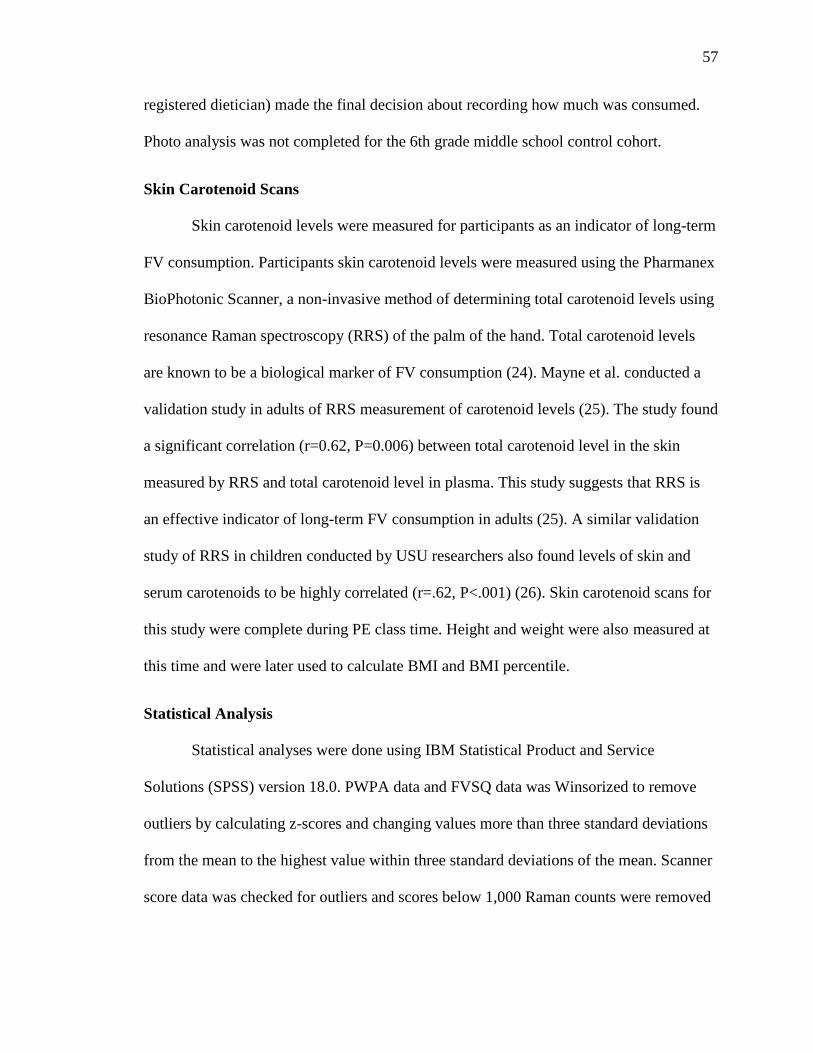
57
registered dietician) made the final decision about recording how much was consumed.
Photo analysis was not completed for the 6th grade middle school control cohort.
Skin Carotenoid Scans
Skin carotenoid levels were measured for participants as an indicator of long-term
FV consumption. Participants skin carotenoid levels were measured using the Pharmanex
BioPhotonic Scanner, a non-invasive method of determining total carotenoid levels using
resonance Raman spectroscopy (RRS) of the palm of the hand. Total carotenoid levels
are known to be a biological marker of FV consumption (24). Mayne et al. conducted a
validation study in adults of RRS measurement of carotenoid levels (25). The study found
a significant correlation (r=0.62, P=0.006) between total carotenoid level in the skin
measured by RRS and total carotenoid level in plasma. This study suggests that RRS is
an effective indicator of long-term FV consumption in adults (25). A similar validation
study of RRS in children conducted by USU researchers also found levels of skin and
serum carotenoids to be highly correlated (r=.62, P<.001) (26). Skin carotenoid scans for
this study were complete during PE class time. Height and weight were also measured at
this time and were later used to calculate BMI and BMI percentile.
Statistical Analysis
Statistical analyses were done using IBM Statistical Product and Service
Solutions (SPSS) version 18.0. PWPA data and FVSQ data was Winsorized to remove
outliers by calculating z-scores and changing values more than three standard deviations
from the mean to the highest value within three standard deviations of the mean. Scanner
score data was checked for outliers and scores below 1,000 Raman counts were removed
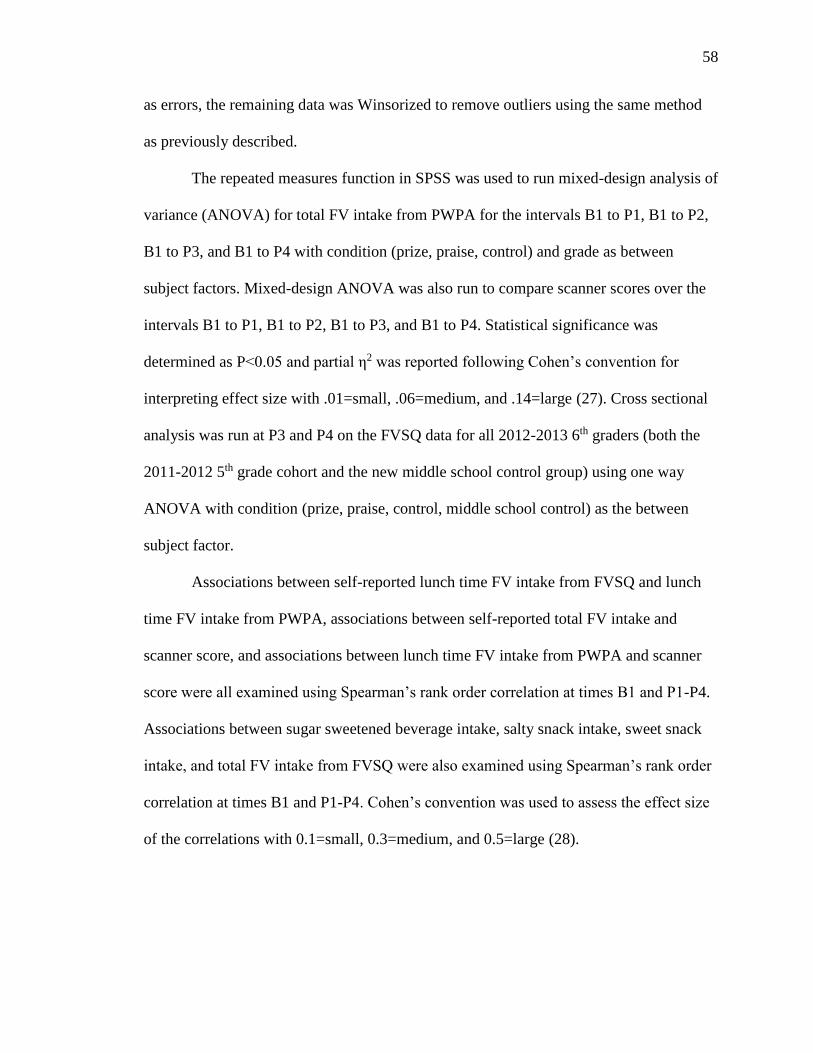
58
as errors, the remaining data was Winsorized to remove outliers using the same method
as previously described.
The repeated measures function in SPSS was used to run mixed-design analysis of
variance (ANOVA) for total FV intake from PWPA for the intervals B1 to P1, B1 to P2,
B1 to P3, and B1 to P4 with condition (prize, praise, control) and grade as between
subject factors. Mixed-design ANOVA was also run to compare scanner scores over the
intervals B1 to P1, B1 to P2, B1 to P3, and B1 to P4. Statistical significance was
determined as P<0.05 and partial η2 was reported following Cohen’s convention for
interpreting effect size with .01=small, .06=medium, and .14=large (27). Cross sectional
analysis was run at P3 and P4 on the FVSQ data for all 2012-2013 6th graders (both the
2011-2012 5th grade cohort and the new middle school control group) using one way
ANOVA with condition (prize, praise, control, middle school control) as the between
subject factor.
Associations between self-reported lunch time FV intake from FVSQ and lunch
time FV intake from PWPA, associations between self-reported total FV intake and
scanner score, and associations between lunch time FV intake from PWPA and scanner
score were all examined using Spearman’s rank order correlation at times B1 and P1-P4.
Associations between sugar sweetened beverage intake, salty snack intake, sweet snack
intake, and total FV intake from FVSQ were also examined using Spearman’s rank order
correlation at times B1 and P1-P4. Cohen’s convention was used to assess the effect size
of the correlations with 0.1=small, 0.3=medium, and 0.5=large (28).

59
RESULTS
Demographics
At baseline (data from B1) there were 874 participants with 49.4% 4th graders,
46.5% male (11.9% unknown), 10% overweight (46.1% unknown). Table 1 shows
baseline demographics reported by condition group. Table 2 shows baseline
demographics from the beginning of P3 for the 2012-2013 6th grade control cohort. BMI
data was not available for the 6th grade control cohort.
Table 1 Demographics at Baseline 1 (2011-2012 School Year) Control (n=297) Praise (n=241) Prize (n=336)
Variable N % N % N %
Grade
4 144 48.5% 114 47.3% 174 51.8%
5 153 51.5% 127 52.7% 162 48.2%
Sex
M 141 47.5% 124 51.5% 141 42%
F 118 39.7% 108 44.8% 138 41 %
Unknown 38 12.8% 9 3.7% 57 17%
BMI
Overweight 31 10.4% 35 14.5% 21 6.3%
Normal Weight 128 43.1% 144 59.8% 112 33.3%
Unknown 138 46.5% 62 25.7% 203 60.4%
Table 2 Demographics at Phase 3 for Middle School Control Group (2012-2013 School Year)
Middle School Control (n=154)
Sex N %
M 77 50%
F 75 48.7%
Unknown 2 1.3%

60
Mixed-design ANOVA for PWPA
The repeated measures function in SPSS was used to run mixed-design ANOVA
to compare differences in lunch time FV intake across time periods and condition
(control, praise, prize) comparing between B1 to P1, B1 to P2, B1 to P3, and B1 to P4.
Baseline 1 to Phase 1
For B1 to P1 there was a significant time effect with a large effect size (P<0.000,
partial η2=.197) and there was a significant time by condition interaction with a medium
effect size (P<0.000, partial η2 = .131, see Figure 1). This suggests that the change in
mean FV intake over time was associated with the intervention condition. One-way
ANOVA run at B1 showed no differences in mean FV intake by condition (P>.05). One-
way ANOVA run at P1 showed a significant difference between the mean FV intake by
condition (P<.05) and Bonferoni post hoc comparison showed that the means for the
control, praise, and prize groups were all significantly different from one another (P<.05).
Figure 1 shows that the prize group had the greatest increase from baseline, with
increases also seen for the praise group. Table 3 shows the observed mean FV intake by
grade and condition.
Baseline 1 to Phase 2
For B1 to P2 there was a significant time effect with a medium effect size
(P<0.000, partial η2= .065) and there was a significant time by condition interaction with
a small effect size (P=.002, partial η2= .016, see Figure 2). This again suggests that the
change in mean FV intake over time was associated with the intervention condition. One-
way ANOVA run at B1 showed no significant differences in mean FV intake by
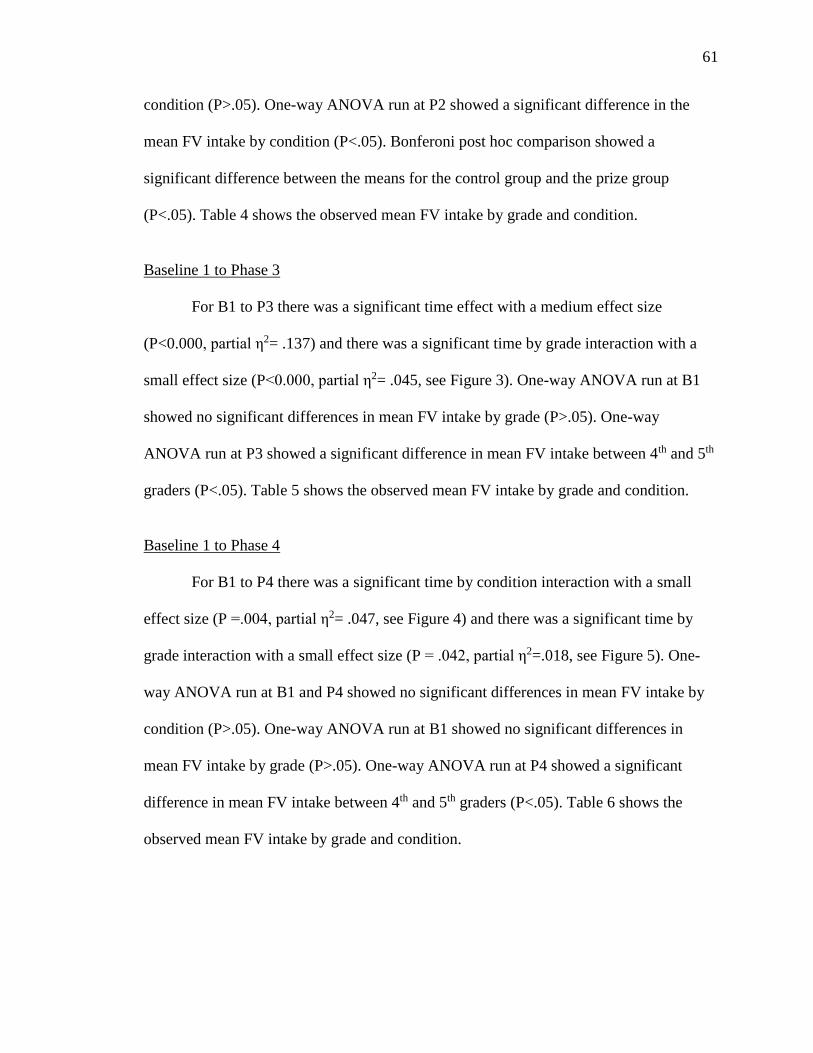
61
condition (P>.05). One-way ANOVA run at P2 showed a significant difference in the
mean FV intake by condition (P<.05). Bonferoni post hoc comparison showed a
significant difference between the means for the control group and the prize group
(P<.05). Table 4 shows the observed mean FV intake by grade and condition.
Baseline 1 to Phase 3
For B1 to P3 there was a significant time effect with a medium effect size
(P<0.000, partial η2= .137) and there was a significant time by grade interaction with a
small effect size (P<0.000, partial η2= .045, see Figure 3). One-way ANOVA run at B1
showed no significant differences in mean FV intake by grade (P>.05). One-way
ANOVA run at P3 showed a significant difference in mean FV intake between 4th and 5th
graders (P<.05). Table 5 shows the observed mean FV intake by grade and condition.
Baseline 1 to Phase 4
For B1 to P4 there was a significant time by condition interaction with a small
effect size (P =.004, partial η2= .047, see Figure 4) and there was a significant time by
grade interaction with a small effect size (P = .042, partial η2=.018, see Figure 5). One-
way ANOVA run at B1 and P4 showed no significant differences in mean FV intake by
condition (P>.05). One-way ANOVA run at B1 showed no significant differences in
mean FV intake by grade (P>.05). One-way ANOVA run at P4 showed a significant
difference in mean FV intake between 4th and 5th graders (P<.05). Table 6 shows the
observed mean FV intake by grade and condition.
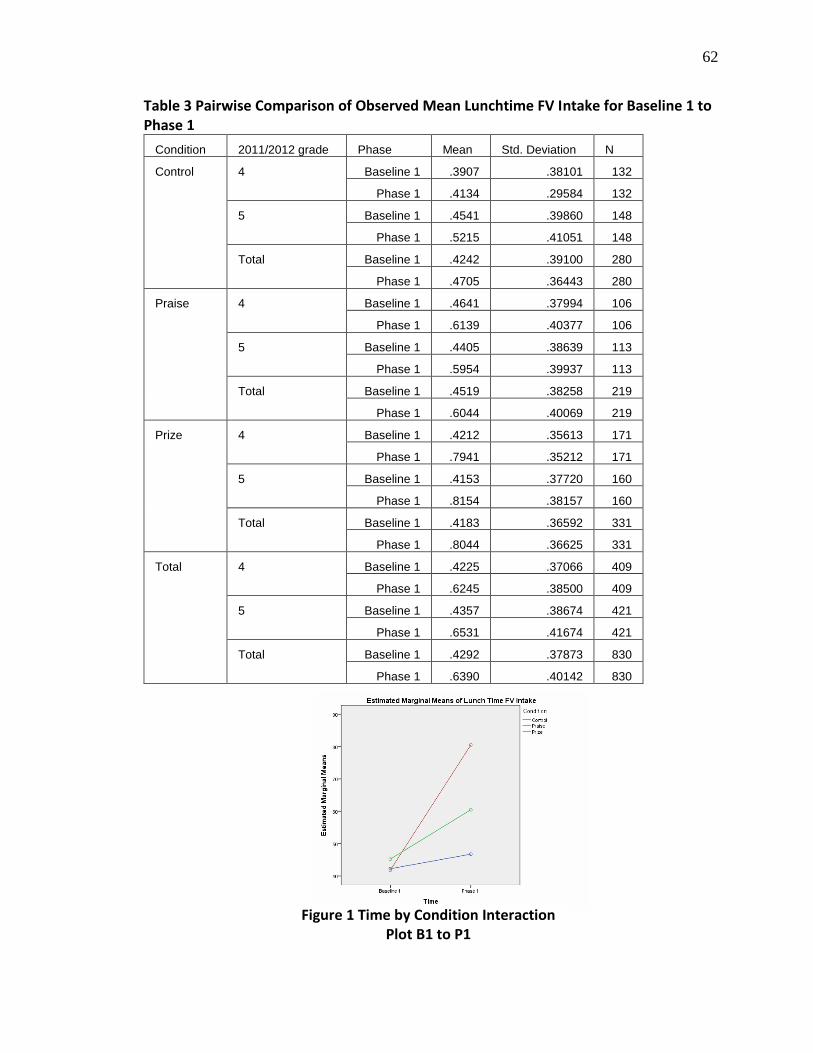
62
Table 3 Pairwise Comparison of Observed Mean Lunchtime FV Intake for Baseline 1 to Phase 1
Condition 2011/2012 grade Phase Mean Std. Deviation N
Control 4 Baseline 1 .3907 .38101 132
Phase 1 .4134 .29584 132
5 Baseline 1 .4541 .39860 148
Phase 1 .5215 .41051 148
Total Baseline 1 .4242 .39100 280
Phase 1 .4705 .36443 280
Praise 4 Baseline 1 .4641 .37994 106
Phase 1 .6139 .40377 106
5 Baseline 1 .4405 .38639 113
Phase 1 .5954 .39937 113
Total Baseline 1 .4519 .38258 219
Phase 1 .6044 .40069 219
Prize 4 Baseline 1 .4212 .35613 171
Phase 1 .7941 .35212 171
5 Baseline 1 .4153 .37720 160
Phase 1 .8154 .38157 160
Total Baseline 1 .4183 .36592 331
Phase 1 .8044 .36625 331
Total 4 Baseline 1 .4225 .37066 409
Phase 1 .6245 .38500 409
5 Baseline 1 .4357 .38674 421
Phase 1 .6531 .41674 421
Total Baseline 1 .4292 .37873 830
Phase 1 .6390 .40142 830
Figure 1 Time by Condition Interaction Plot B1 to P1
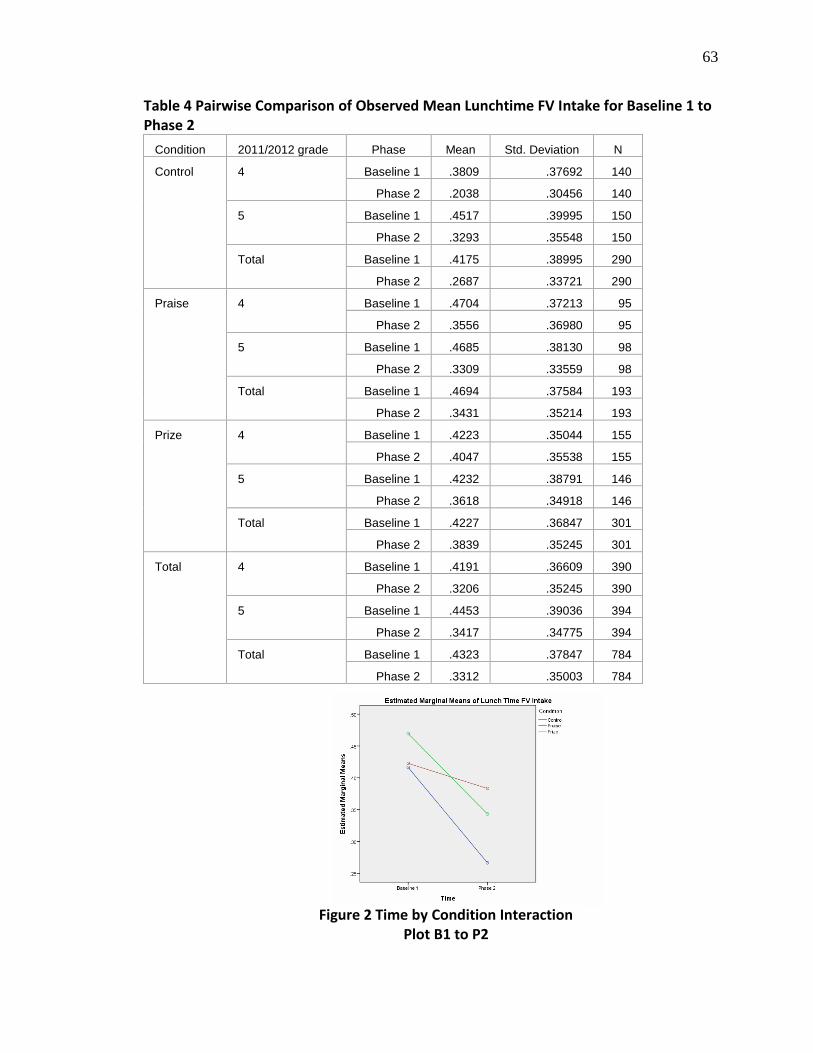
63
Table 4 Pairwise Comparison of Observed Mean Lunchtime FV Intake for Baseline 1 to Phase 2
Condition 2011/2012 grade Phase Mean Std. Deviation N
Control 4 Baseline 1 .3809 .37692 140
Phase 2 .2038 .30456 140
5 Baseline 1 .4517 .39995 150
Phase 2 .3293 .35548 150
Total Baseline 1 .4175 .38995 290
Phase 2 .2687 .33721 290
Praise 4 Baseline 1 .4704 .37213 95
Phase 2 .3556 .36980 95
5 Baseline 1 .4685 .38130 98
Phase 2 .3309 .33559 98
Total Baseline 1 .4694 .37584 193
Phase 2 .3431 .35214 193
Prize 4 Baseline 1 .4223 .35044 155
Phase 2 .4047 .35538 155
5 Baseline 1 .4232 .38791 146
Phase 2 .3618 .34918 146
Total Baseline 1 .4227 .36847 301
Phase 2 .3839 .35245 301
Total 4 Baseline 1 .4191 .36609 390
Phase 2 .3206 .35245 390
5 Baseline 1 .4453 .39036 394
Phase 2 .3417 .34775 394
Total Baseline 1 .4323 .37847 784
Phase 2 .3312 .35003 784
Figure 2 Time by Condition Interaction Plot B1 to P2
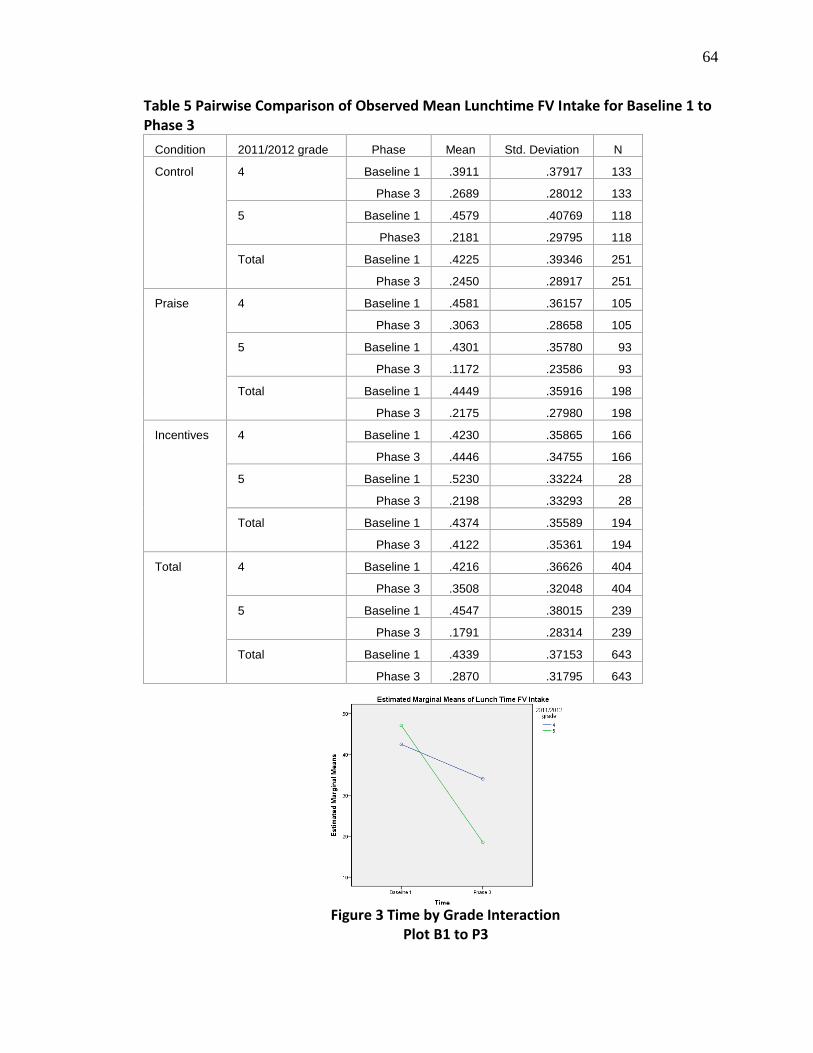
64
Table 5 Pairwise Comparison of Observed Mean Lunchtime FV Intake for Baseline 1 to Phase 3
Condition 2011/2012 grade Phase Mean Std. Deviation N
Control 4 Baseline 1 .3911 .37917 133
Phase 3 .2689 .28012 133
5 Baseline 1 .4579 .40769 118
Phase3 .2181 .29795 118
Total Baseline 1 .4225 .39346 251
Phase 3 .2450 .28917 251
Praise 4 Baseline 1 .4581 .36157 105
Phase 3 .3063 .28658 105
5 Baseline 1 .4301 .35780 93
Phase 3 .1172 .23586 93
Total Baseline 1 .4449 .35916 198
Phase 3 .2175 .27980 198
Incentives 4 Baseline 1 .4230 .35865 166
Phase 3 .4446 .34755 166
5 Baseline 1 .5230 .33224 28
Phase 3 .2198 .33293 28
Total Baseline 1 .4374 .35589 194
Phase 3 .4122 .35361 194
Total 4 Baseline 1 .4216 .36626 404
Phase 3 .3508 .32048 404
5 Baseline 1 .4547 .38015 239
Phase 3 .1791 .28314 239
Total Baseline 1 .4339 .37153 643
Phase 3 .2870 .31795 643
Figure 3 Time by Grade Interaction Plot B1 to P3

65
Table 6 Pairwise Comparison of Observed Mean Lunchtime FV Intake for Baseline 1 to Phase 4
Condition 2011/2012 grade Phase Mean Std. Deviation N
Control 4 Baseline 1 .3798 .36639 65
Phase 4 .3903 .32876 65
5 Baseline 1 .4886 .41430 41
Phase 4 .5000 .45580 41
Total Baseline 1 .4219 .38736 106
Phase 4 .4327 .38458 106
Praise 4 Baseline 1 .5012 .31618 30
Phase 4 .3055 .27984 30
5 Baseline 1 .6010 .47800 20
Phase 4 .4648 .41515 20
Total Baseline 1 .5411 .38756 50
Phase 4 .3692 .34553 50
Incentives 4 Baseline 1 .4380 .31909 75
Phase 4 .4079 .34339 75
5 Baseline 1 .4217 .39902 7
Phase 4 .7789 .35778 7
Total Baseline 1 .4366 .32378 82
Phase 4 .4395 .35790 82
Total 4 Baseline1 .4269 .33832 170
Phase 4 .3831 .32766 170
5 Baseline 1 .5148 .43020 68
Phase 4 .5184 .43878 68
Total Baseline 1 .4520 .36813 238
Phase 4 .4217 .36706 238
Figure 4 Time by Condition Interaction Plot B1 to P4
Figure 5 Time by Grade Interaction Plot B1 to P4
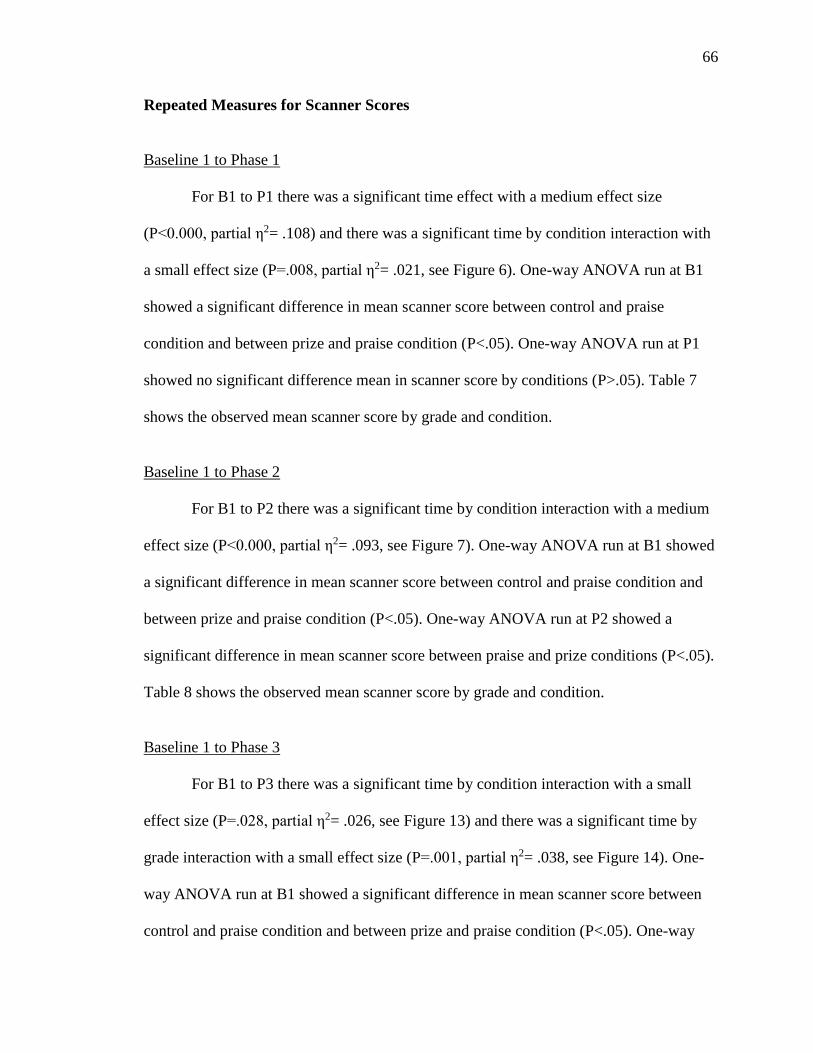
66
Repeated Measures for Scanner Scores
Baseline 1 to Phase 1
For B1 to P1 there was a significant time effect with a medium effect size
(P<0.000, partial η2= .108) and there was a significant time by condition interaction with
a small effect size (P=.008, partial η2= .021, see Figure 6). One-way ANOVA run at B1
showed a significant difference in mean scanner score between control and praise
condition and between prize and praise condition (P<.05). One-way ANOVA run at P1
showed no significant difference mean in scanner score by conditions (P>.05). Table 7
shows the observed mean scanner score by grade and condition.
Baseline 1 to Phase 2
For B1 to P2 there was a significant time by condition interaction with a medium
effect size (P<0.000, partial η2= .093, see Figure 7). One-way ANOVA run at B1 showed
a significant difference in mean scanner score between control and praise condition and
between prize and praise condition (P<.05). One-way ANOVA run at P2 showed a
significant difference in mean scanner score between praise and prize conditions (P<.05).
Table 8 shows the observed mean scanner score by grade and condition.
Baseline 1 to Phase 3
For B1 to P3 there was a significant time by condition interaction with a small
effect size (P=.028, partial η2= .026, see Figure 13) and there was a significant time by
grade interaction with a small effect size (P=.001, partial η2= .038, see Figure 14). One-
way ANOVA run at B1 showed a significant difference in mean scanner score between
control and praise condition and between prize and praise condition (P<.05). One-way

67
ANOVA run at P3 showed a significant difference in mean scanner score between praise
and prize conditions (P<.05). One-ANOVA run at B1 and P3 showed no significant
difference in mean scanner score by grade. Table 9 shows the observed mean scanner
score by grade and condition.
Baseline 1 to Phase 4
For B1 to P4 there was a significant time by condition interaction with a small
effect size (P =.001, partial η2 = .051, see Figure10). One-way ANOVA run at B1
showed a significant difference in mean scanner score between praise and control
conditions (P<.05). One-way ANOVA run at P4 showed no significant difference in
mean scanner score by condition (P>.05). Table 10 shows the observed mean scanner
score by grade and condition.
FVSQ P3 and P4 ANOVA
One-way ANOVA was run to test differences in sugar-sweetened beverage, salty
snack, sweet snack, total fruit, total vegetable, total FV, lunch fruit, and lunch vegetable
intake between 6th graders in the control, praise, prize, and middle school control groups.
Descriptive statistics with the number of participants and the mean and standard deviation
by group are listed in Table 11. Significant differences between the means were found for
total fruit, total vegetable, and total FV at P3 and only for total fruit at P4 (P<0.05).
Bonferoni post hoc analysis found a significant difference between the middle school
control and praise group for total fruit at P3 (P<0.05), a significant difference for total
vegetable between the middle school control and control group (P<0.05) and between the
middle school control and praise group (P<0.05) at P3, a significant difference for total
FV between the middle school control group and the praise group at P3 (P<0.05), and a
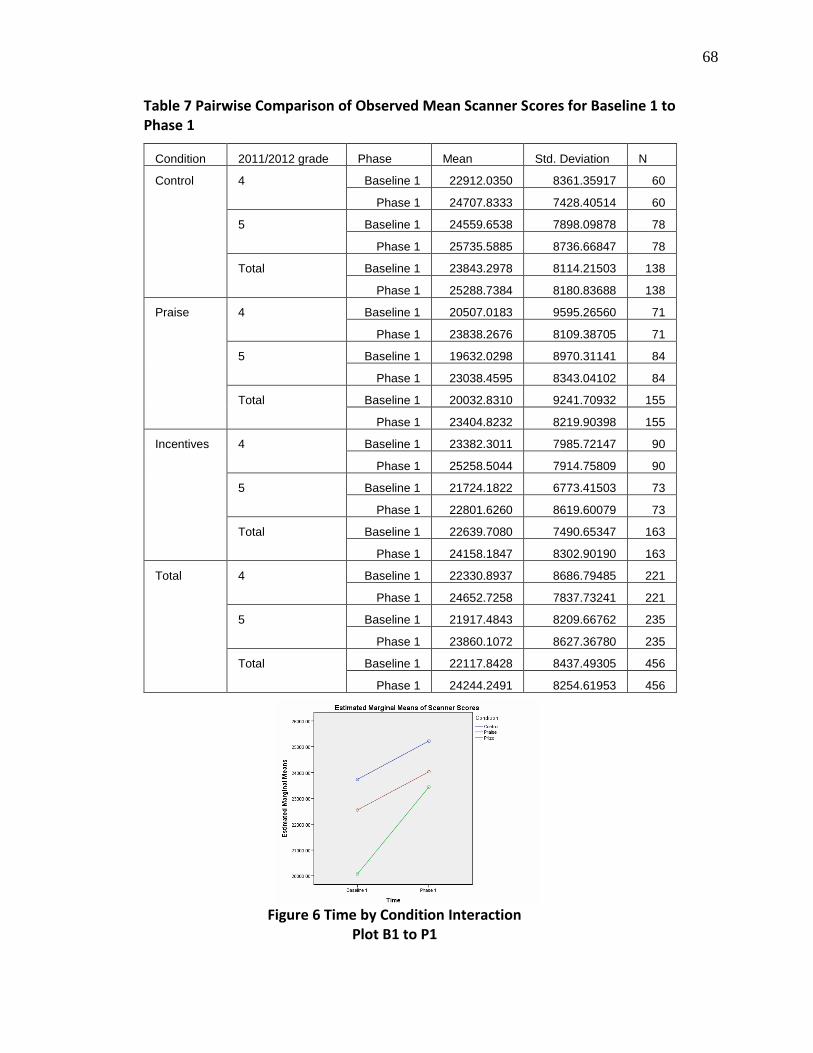
68
Table 7 Pairwise Comparison of Observed Mean Scanner Scores for Baseline 1 to Phase 1
Condition 2011/2012 grade Phase Mean Std. Deviation N
Control 4 Baseline 1 22912.0350 8361.35917 60
Phase 1 24707.8333 7428.40514 60
5 Baseline 1 24559.6538 7898.09878 78
Phase 1 25735.5885 8736.66847 78
Total Baseline 1 23843.2978 8114.21503 138
Phase 1 25288.7384 8180.83688 138
Praise 4 Baseline 1 20507.0183 9595.26560 71
Phase 1 23838.2676 8109.38705 71
5 Baseline 1 19632.0298 8970.31141 84
Phase 1 23038.4595 8343.04102 84
Total Baseline 1 20032.8310 9241.70932 155
Phase 1 23404.8232 8219.90398 155
Incentives 4 Baseline 1 23382.3011 7985.72147 90
Phase 1 25258.5044 7914.75809 90
5 Baseline 1 21724.1822 6773.41503 73
Phase 1 22801.6260 8619.60079 73
Total Baseline 1 22639.7080 7490.65347 163
Phase 1 24158.1847 8302.90190 163
Total 4 Baseline 1 22330.8937 8686.79485 221
Phase 1 24652.7258 7837.73241 221
5 Baseline 1 21917.4843 8209.66762 235
Phase 1 23860.1072 8627.36780 235
Total Baseline 1 22117.8428 8437.49305 456
Phase 1 24244.2491 8254.61953 456
Figure 6 Time by Condition Interaction Plot B1 to P1

69
Table 8 Pairwise Comparison of Observed Mean Scanner Scores for Baseline 1 to Phase 2
Condition 2011/2012 grade Phase Mean Std. Deviation N
Control 4 Baseline 1 22340.4576 7759.33771 59
Phase 2 21723.3237 7551.07763 59
5 Baseline 1 25103.7530 8173.03142 83
Phase 2 23868.2386 9764.34805 83
Total Baseline 1 23955.6232 8092.03468 142
Phase 2 22977.0415 8945.79074 142
Praise 4 Baseline 1 20117.9274 9530.03965 62
Phase 2 24395.3823 8521.12488 62
5 Baseline 1 19654.0048 8833.99670 83
Phase 2 23451.4675 9116.74780 83
Total Baseline 1 19852.3717 9108.52700 145
Phase 2 23855.0724 8849.13741 145
Incentives 4 Baseline 1 23976.0551 7308.81924 89
Phase 2 22723.7472 7207.06689 89
5 Baseline 1 21102.3813 6844.83196 64
Phase 2 19718.4641 7848.82661 64
Total Baseline 1 22773.9954 7236.58086 153
Phase 2 21466.6353 7603.74584 153
Total 4 Baseline 1 22377.4638 8265.06585 210
Phase 2 22936.2062 7742.86939 210
5 Baseline 1 22023.6796 8394.26292 230
Phase 2 22563.1187 9165.94901 230
Total Baseline 1 22192.5311 8325.24769 440
Phase 2 22741.1832 8508.95301 440
Figure 7 Time by Condition Interaction Plot B1 to P2

70
Table 9 Pairwise comparison of observed mean scanner scores for Baseline 1 to Phase 3
Condition 2011/2012 grade Phase Mean Std. Deviation N
Control 4 Baseline 1 22644.1183 8257.88042 60
Phase 3 21457.2633 7197.15979 60
5 Baseline 1 24812.1689 8229.98330 61
Phase 3 24563.3180 8115.89082 61
Total Baseline 1 23737.1025 8281.25340 121
Phase 3 23023.1256 7799.58743 121
Praise 4 Baseline 1 22809.3174 11513.17842 23
Phase 3 21425.5087 8535.02454 23
5 Baseline 1 17476.1732 7565.33070 41
Phase 3 20316.0854 6846.02257 41
Total Baseline 1 19392.7719 9448.79486 64
Phase 3 20714.7844 7448.74820 64
Incentives 4 Baseline 1 23538.6278 7472.93985 72
Phase 3 23811.3875 8050.43580 72
5 Baseline 1 22330.4750 6278.12775 24
Phase 3 25362.3958 7559.01510 24
Total Baseline 1 23236.5896 7180.23512 96
Phase 3 24199.1396 7919.97293 96
Total 4 Baseline 1 23084.1458 8425.66592 155
Phase 3 22546.0800 7844.07024 155
5 Baseline 1 21952.3556 8286.70042 126
Phase 3 23333.4873 7851.27883 126
Total Baseline 1 22576.6527 8367.76298 281
Phase 3 22899.1523 7843.09243 281
Figure 8 Time by Condition Interaction Plot B1 to P3
Figure 9 Time by Grade Interaction Plot B1 to P3
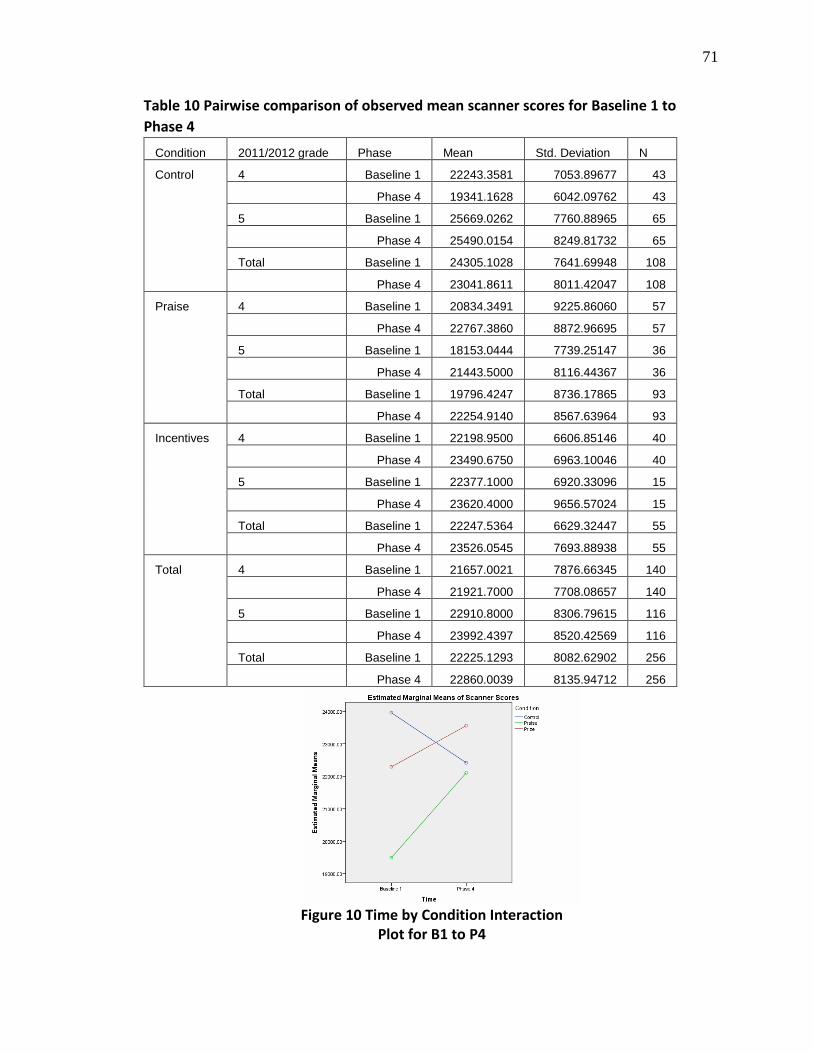
71
Table 10 Pairwise comparison of observed mean scanner scores for Baseline 1 to
Phase 4
Condition 2011/2012 grade Phase Mean Std. Deviation N
Control 4 Baseline 1 22243.3581 7053.89677 43
Phase 4 19341.1628 6042.09762 43
5 Baseline 1 25669.0262 7760.88965 65
Phase 4 25490.0154 8249.81732 65
Total Baseline 1 24305.1028 7641.69948 108
Phase 4 23041.8611 8011.42047 108
Praise 4 Baseline 1 20834.3491 9225.86060 57
Phase 4 22767.3860 8872.96695 57
5 Baseline 1 18153.0444 7739.25147 36
Phase 4 21443.5000 8116.44367 36
Total Baseline 1 19796.4247 8736.17865 93
Phase 4 22254.9140 8567.63964 93
Incentives 4 Baseline 1 22198.9500 6606.85146 40
Phase 4 23490.6750 6963.10046 40
5 Baseline 1 22377.1000 6920.33096 15
Phase 4 23620.4000 9656.57024 15
Total Baseline 1 22247.5364 6629.32447 55
Phase 4 23526.0545 7693.88938 55
Total 4 Baseline 1 21657.0021 7876.66345 140
Phase 4 21921.7000 7708.08657 140
5 Baseline 1 22910.8000 8306.79615 116
Phase 4 23992.4397 8520.42569 116
Total Baseline 1 22225.1293 8082.62902 256
Phase 4 22860.0039 8135.94712 256
Figure 10 Time by Condition Interaction Plot for B1 to P4

72
significant difference for total fruit between the prize group and the control group at P4
(P<0.05).
The large standard deviations compared to the means seen in the demographic
table demonstrate the inherent issue of variability with the FVSQ self-reported data. Also,
the data was positively skewed, but it was determined that one-way ANOVA was still an
appropriate measure due to the robustness of the test and the large sample size available.
Correlation Between Self-Reported and PWPA Lunchtime FV Intake
Associations between self-reported lunch time FV intake from the FVSQ and
lunch time FV intake from the PWPA were examined using Spearman’s rank order
correlation. The test was run at B1 and P1-P4. Lunch time fruit intake had a significant
medium positive correlation at all times measured (range of r across assessment periods =
.313 to .411, P<0.01, see Table 12). Lunch time vegetable intake had a significant small
to medium positive correlation across all times measured (range of r across assessment
periods = .286 to .380, P<0.01, see Table 12).
Correlation Between Scanner Score and Self-Reported Total FV Intake
Spearman’s rank order correlations were also done to compare scanner score and
self-reported total FV intake for time B1 and P1-P4. A significant, small to medium
positive correlation was found at all times measured (range of r across assessment periods
= .154 to .330 P<0.01, see Table 13).
Correlation Between Scanner Score and Lunchtime FV Intake
Spearman’s rank order correlations were also done to compare scanner score and
lunch time FV intake from PWPA for time B1 and P1-P4. A significant, small to medium
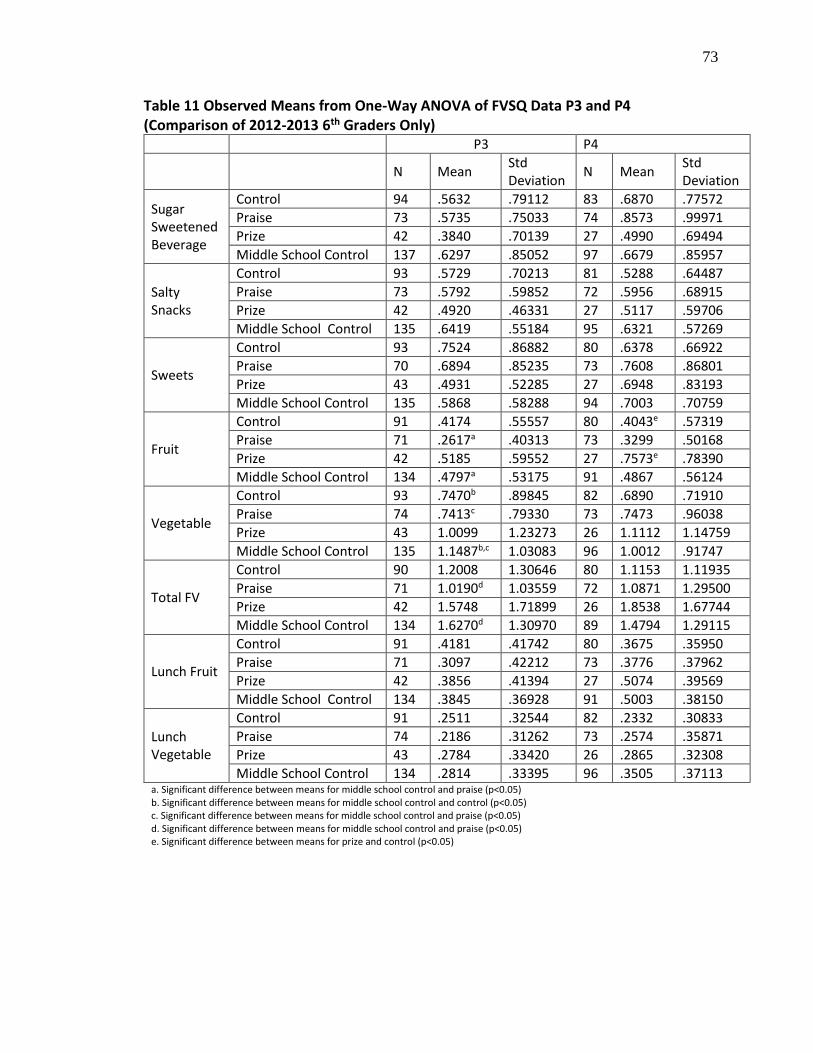
73
Table 11 Observed Means from One-Way ANOVA of FVSQ Data P3 and P4 (Comparison of 2012-2013 6th Graders Only)
P3 P4
N Mean
Std Deviation
N Mean Std Deviation
Sugar Sweetened Beverage
Control 94 .5632 .79112 83 .6870 .77572
Praise 73 .5735 .75033 74 .8573 .99971
Prize 42 .3840 .70139 27 .4990 .69494
Middle School Control 137 .6297 .85052 97 .6679 .85957
Salty Snacks
Control 93 .5729 .70213 81 .5288 .64487
Praise 73 .5792 .59852 72 .5956 .68915
Prize 42 .4920 .46331 27 .5117 .59706
Middle School Control 135 .6419 .55184 95 .6321 .57269
Sweets
Control 93 .7524 .86882 80 .6378 .66922
Praise 70 .6894 .85235 73 .7608 .86801
Prize 43 .4931 .52285 27 .6948 .83193
Middle School Control 135 .5868 .58288 94 .7003 .70759
Fruit
Control 91 .4174 .55557 80 .4043e .57319
Praise 71 .2617a .40313 73 .3299 .50168
Prize 42 .5185 .59552 27 .7573e .78390
Middle School Control 134 .4797a .53175 91 .4867 .56124
Vegetable
Control 93 .7470b .89845 82 .6890 .71910
Praise 74 .7413c .79330 73 .7473 .96038
Prize 43 1.0099 1.23273 26 1.1112 1.14759
Middle School Control 135 1.1487b,c 1.03083 96 1.0012 .91747
Total FV
Control 90 1.2008 1.30646 80 1.1153 1.11935
Praise 71 1.0190d 1.03559 72 1.0871 1.29500
Prize 42 1.5748 1.71899 26 1.8538 1.67744
Middle School Control 134 1.6270d 1.30970 89 1.4794 1.29115
Lunch Fruit
Control 91 .4181 .41742 80 .3675 .35950
Praise 71 .3097 .42212 73 .3776 .37962
Prize 42 .3856 .41394 27 .5074 .39569
Middle School Control 134 .3845 .36928 91 .5003 .38150
Lunch Vegetable
Control 91 .2511 .32544 82 .2332 .30833
Praise 74 .2186 .31262 73 .2574 .35871
Prize 43 .2784 .33420 26 .2865 .32308
Middle School Control 134 .2814 .33395 96 .3505 .37113 a. Significant difference between means for middle school control and praise (p<0.05) b. Significant difference between means for middle school control and control (p<0.05) c. Significant difference between means for middle school control and praise (p<0.05) d. Significant difference between means for middle school control and praise (p<0.05) e. Significant difference between means for prize and control (p<0.05)
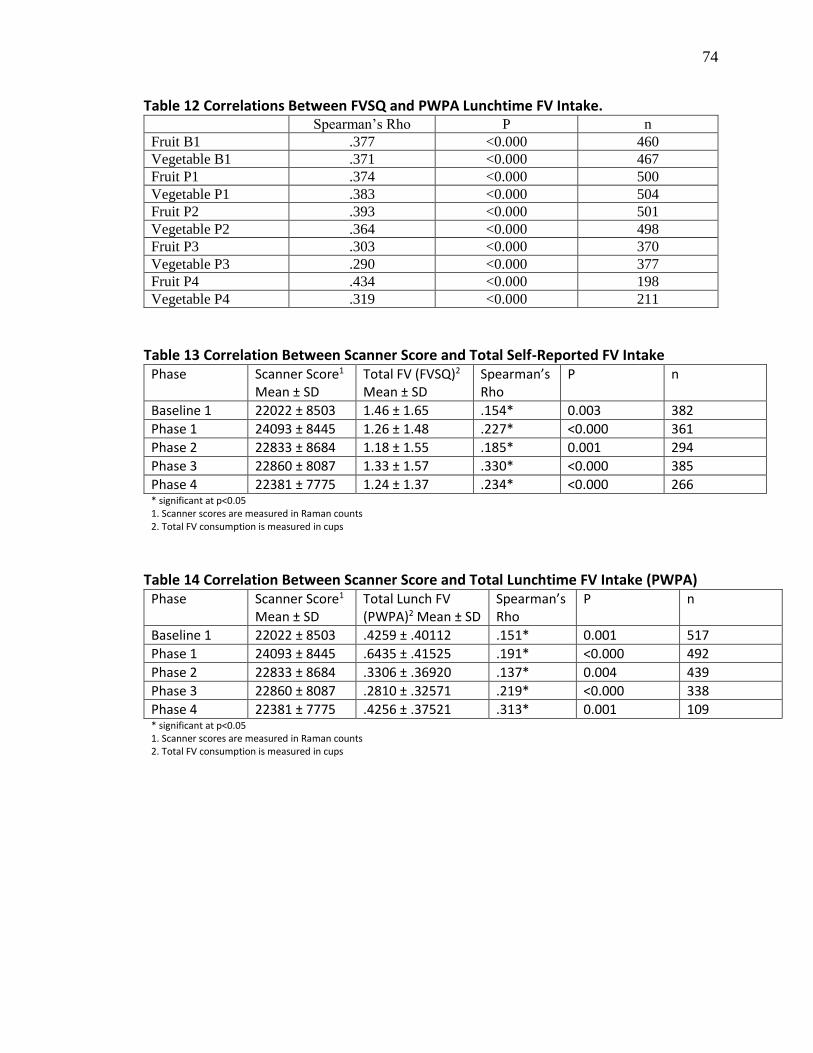
74
Table 12 Correlations Between FVSQ and PWPA Lunchtime FV Intake. Spearman’s Rho P n
Fruit B1 .377 <0.000 460
Vegetable B1 .371 <0.000 467
Fruit P1 .374 <0.000 500
Vegetable P1 .383 <0.000 504
Fruit P2 .393 <0.000 501
Vegetable P2 .364 <0.000 498
Fruit P3 .303 <0.000 370
Vegetable P3 .290 <0.000 377
Fruit P4 .434 <0.000 198
Vegetable P4 .319 <0.000 211
Table 13 Correlation Between Scanner Score and Total Self-Reported FV Intake
Phase Scanner Score1
Mean ± SD Total FV (FVSQ)2 Mean ± SD
Spearman’s Rho
P n
Baseline 1 22022 ± 8503 1.46 ± 1.65 .154* 0.003 382
Phase 1 24093 ± 8445 1.26 ± 1.48 .227* <0.000 361
Phase 2 22833 ± 8684 1.18 ± 1.55 .185* 0.001 294
Phase 3 22860 ± 8087 1.33 ± 1.57 .330* <0.000 385
Phase 4 22381 ± 7775 1.24 ± 1.37 .234* <0.000 266 * significant at p<0.05 1. Scanner scores are measured in Raman counts 2. Total FV consumption is measured in cups
Table 14 Correlation Between Scanner Score and Total Lunchtime FV Intake (PWPA) Phase Scanner Score1
Mean ± SD Total Lunch FV (PWPA)2 Mean ± SD
Spearman’s Rho
P n
Baseline 1 22022 ± 8503 .4259 ± .40112 .151* 0.001 517
Phase 1 24093 ± 8445 .6435 ± .41525 .191* <0.000 492
Phase 2 22833 ± 8684 .3306 ± .36920 .137* 0.004 439
Phase 3 22860 ± 8087 .2810 ± .32571 .219* <0.000 338
Phase 4 22381 ± 7775 .4256 ± .37521 .313* 0.001 109 * significant at p<0.05 1. Scanner scores are measured in Raman counts 2. Total FV consumption is measured in cups
75
positive correlation was found at all times measured (range of r across assessment periods
= .137 to .313 P<0.01, see Table 13).
FVSQ Correlations
Associations between sugar-sweetened beverage, salty snack, sweet snack, and
total FV intake were assessed using Spearman’s rank order correlation. At B1, P1, and P2
there was a small, but significant positive correlation between sugar-sweetened beverage
intake and total FV intake (range of r across assessment periods = .145 to .181, P<0.01).
At P3 and P4 no correlation was found between sugar-sweetened beverage intake and
total FV intake. At all of the time points measured there was a weak, but significant
positive correlation between salty snack intake and total FV intake (range of r across
assessment periods = .125 - .324, P<0.01). At all of the time points measured there was
also a significant small to medium positive correlation between sweet snack intake and
total FV intake (range of r across assessment = .198 to .355, P<0.01). These correlations
seem to suggest that an increase in FV intake may be associated with an increase in
overall food intake.
There was a significant small to medium positive correlation between sugar-
sweetened beverage intake and salty snack intake (range of r across assessment periods =
.274 to .329, P<0.01). There was a significant small to medium positive correlation
between sugar-sweetened beverage intake and sweet snack intake (range of r across
assessment periods = .267 to .366, P<0.01). There was a significant medium positive
correlation between salty snack intake and sweet snack intake (range of r across
assessment periods = .328 to .424, P<0.01). These correlations suggest that for
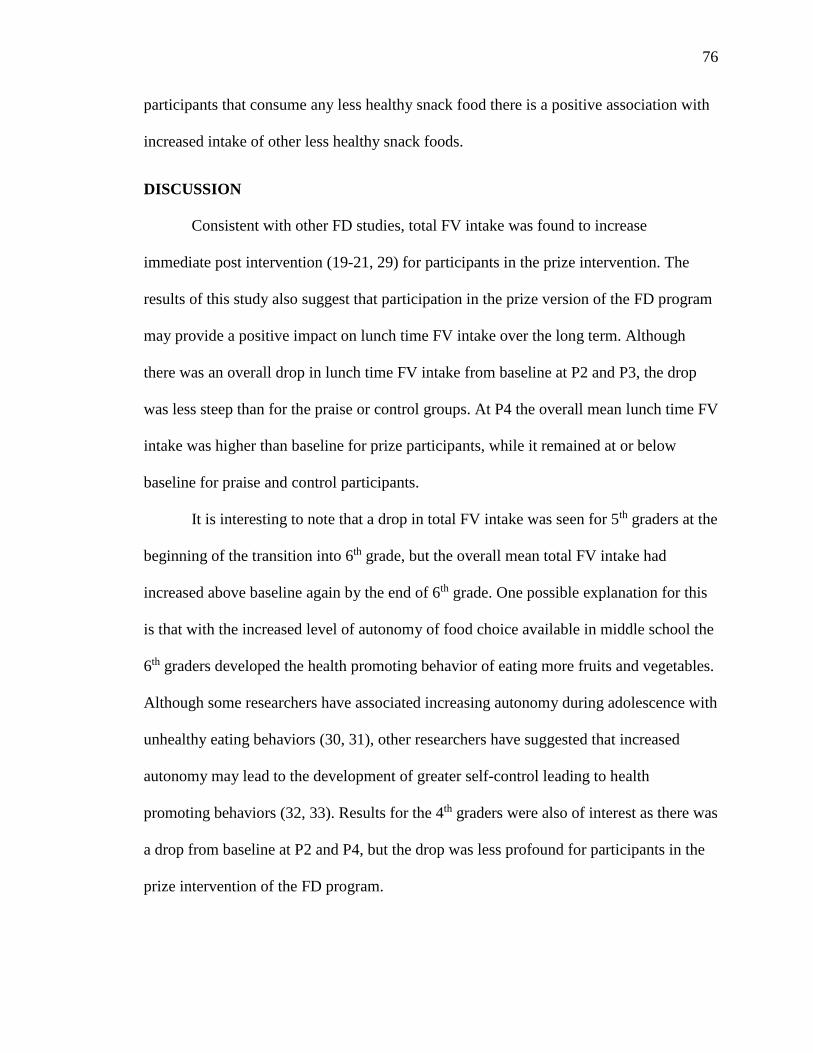
76
participants that consume any less healthy snack food there is a positive association with
increased intake of other less healthy snack foods.
DISCUSSION
Consistent with other FD studies, total FV intake was found to increase
immediate post intervention (19-21, 29) for participants in the prize intervention. The
results of this study also suggest that participation in the prize version of the FD program
may provide a positive impact on lunch time FV intake over the long term. Although
there was an overall drop in lunch time FV intake from baseline at P2 and P3, the drop
was less steep than for the praise or control groups. At P4 the overall mean lunch time FV
intake was higher than baseline for prize participants, while it remained at or below
baseline for praise and control participants.
It is interesting to note that a drop in total FV intake was seen for 5th graders at the
beginning of the transition into 6th grade, but the overall mean total FV intake had
increased above baseline again by the end of 6th grade. One possible explanation for this
is that with the increased level of autonomy of food choice available in middle school the
6th graders developed the health promoting behavior of eating more fruits and vegetables.
Although some researchers have associated increasing autonomy during adolescence with
unhealthy eating behaviors (30, 31), other researchers have suggested that increased
autonomy may lead to the development of greater self-control leading to health
promoting behaviors (32, 33). Results for the 4th graders were also of interest as there was
a drop from baseline at P2 and P4, but the drop was less profound for participants in the
prize intervention of the FD program.
77
The results of the mixed-design ANOVA for the scanner scores gave a less clear
picture. The mean baseline scanner scores were not the same between groups which
makes interpretation of this test more difficult. The changes scanner scores do not follow
the same pattern as the changes in lunch time FV intake. One possibility for this
difference is that children who were consuming more FV at school may not have been
consuming more FV at home. Lunch time FV intake was found to have only a small to
medium positive correlation with scanner scores. Because the self-reported total FV
intake also showed only a small to medium positive correlation with scanner scores, we
cannot rely on that data to help give a clearer picture of total FV intake compared to
lunch time FV intake.
The results of the total diet portion of the study are also not clear. The results of
the Spearman correlation analyses run to compare the intake of energy dense snacks and
beverages to the intake of FV showed a weak positive correlation between sugar-
sweetened beverage, salty snack, and sweet snack intake and total FV intake. This seems
to suggest that if children are eating more of one type of food they are likely increasing
their overall intake of other foods as well. There have been few studies looking at the
impact of increasing FV intake in children on the intake of less healthy, energy dense
foods. A study by Looney and Raynor found no relationship between increasing FV
intake and intake of unhealthy snack foods and drinks (15).
Comparison of self-reported lunch time FV intake with lunch time FV intake data
from PWPA showed only a mild correlation, suggesting that the self-reported data is
likely not an accurate way to assess actual FV intake. This was further confirmed by
comparing self-reported total FV intake with skin carotenoid scan data, which also

78
showed only a weak correlation between the two. There was no objective measure of
energy dense food intake to be able to compare to, but given the poor quality of the self-
reported data for FV intake, it is likely that the FVSQ is also an unreliable measure of
actual energy dense food and beverage intake.
One way ANOVA done at P3 and P4 showed very little difference between 6th
graders intake of sugar-sweetened beverages, salty snacks, sweets snacks, fruits, and
vegetables, regardless of what intervention group they were part of. This may be because
there was no actual difference, but also may have been due to the unreliable nature of
self-reported diet data from children (34). The FVSQ does not seem to be an effective
tool for comparing total diet between study participants.
It is of interest to note that mean intake levels reported during baseline 1 were
higher for almost all categories than during subsequent measurements. This was found to
be true even after excluding the schools that completed a different FVSQ at baseline.
This is consistent with a review by McPherson et al. which found that when children
complete FFQs for the first intake is generally reported as higher than on subsequent
administrations of the same FFQ.
Aside from the limitations of the FVSQ that have already been addressed, this
study had other limitations. One issue is the reliability of the scanner scores. Although a
previous USU study has confirmed the validity of skin carotenoid scans in children (26),
a difference in calibration between the Pharmanex biophotonic scanners used to obtain
skin carotenoid levels was found. Subsequent studies that have used the scanners have
been careful to scan the same child on the same scanner for each measurement so the
scores can be adjusted for differences between the scanners, but the issue was discovered
79
too far into this study to be able to implement that procedure. Another issue with the
scanner scores is that there confounding factors that can influence the reliability of
scanner scores including illness, radiation from the sun, and smoking or second hand
smoke exposure (35).
Another concern was the decrease in participation as the study went on.
Participation in the lunch time PWPA portion of the study was especially poor during P4
for 5th graders who had moved into 6th grade. For the P4 analysis there was only PWPA
data for seven participants who were original 5th graders and part of the prize intervention
group, compared to data for 160 from the same category for P1 analysis. Photo data for
three of the elementary schools was also missing for phase 4 (one praise school, one prize
school, and one control school) further decreasing the power of the phase 4 analysis.
IMPLICATIONS FOR FUTURE RESEARCH
Low FV consumption in children and adolescents remains a serious health
concern (1, 2). The results of this study appear to suggest that the FD program may help
to improve or at least stabilize intake of FV at school over the long term, but further
research needs to be done to confirm these results. Future research also needs to be done
to find a better method for accurately measuring changes in total FV consumption, since
FVSQ data was found to be a poor indicator of actual total FV intake.
REFERENCES
1. Guenther PM, Dodd KW, Reedy J, Krebs-Smith SM. Most Americans eat much
less than recommended amounts of fruits and vegetables. J Am Diet Assoc
2006;106:1371-9.
80
2. Lorson BA, Melgar-Quinonez HR, Taylor CA. Correlates of fruit and vegetable
intakes in US children. J Am Diet Assoc 2009;109:474-8.
3. Currie C, Robert, C., Morgan, A., Smith, R., Setterbulte, W., Samdal, O.,
Rasmussen, V. B. Young people's health in context. Health behaviour in school-
aged children. Copenhagen: WHO, 2004.
4. Lytle LA, Seifert S, Greenstein J, McGovern P. How do children's eating patterns
and food choices change over time? Results from a cohort study. Am J Health
Promot 2000;14:222-8.
5. Perez A, Hoelscher DM, Brown HS, 3rd, Kelder SH. Differences in food
consumption and meal patterns in Texas school children by grade. Prev Chronic
Dis 2007;4:A23.
6. Reilly JJ, Methven E, McDowell ZC, Hacking B, Alexander D, Stewart L, Kelnar
CJ. Health consequences of obesity. Arch Dis Child 2003;88:748-52.
7. Boeing H, Bechthold A, Bub A, Ellinger S, Haller D, Kroke A, Leschik-Bonnet
E, Muller MJ, Oberritter H, et al. Critical review: vegetables and fruit in the
prevention of chronic diseases. Eur J Nutr 2012;51:637-63.
8. Matthews VL, Wien M, Sabate J. The risk of child and adolescent overweight is
related to types of food consumed. Nutr J 2011;10.
9. Tohill BC, Seymour J, Serdula M, Kettel-Khan L, Rolls BJ. What epidemiologic
studies tell us about the relationship between fruit and vegetable consumption and
body weight. Nutr Rev 2004;62:365-74.

81
10. Evidence Analysis: Fruit and Vegetable Intake and Childhood Overweight. 2014
http://andevidencelibrary.com/evidence.cfm?evidence_summary_id=25 (accessed
21 March 2014)
11. Ogden CL, Carroll MD, Curtin LR, Lamb MM, Flegal KM. Prevalence of high
body mass index in US children and adolescents, 2007-2008. J Am Med Assoc
2010;303:242-9.
12. Freedman DS, Mei ZG, Srinivasan SR, Berenson GS, Dietz WH. Cardiovascular
risk factors and excess adiposity among overweight children and adolescents: The
Bogalusa Heart Study. J Pediatr 2007;150:12-7.
13. Rolls BJ, Ello-Martin JA, Tohill BC. What can intervention studies tell us about
the relationship between fruit and vegetable consumption and weight
management? Nutr Rev 2004;62:1-17.
14. Epstein LH, Paluch RA, Beecher MD, Roemmich JN. Increasing healthy eating
vs. reducing high energy-dense foods to treat pediatric obesity. Obesity (Silver
Spring) 2008;16:318-26.
15. Looney SM, Raynor HA. Are changes in consumption of "healthy" foods related
to changes in consumption of "unhealthy" foods during pediatric obesity
treatment? Int J Environ Res Public Health 2012;9:1368-78.
16. Rasmussen M, Krolner R, Klepp K-I, Lytle L, Brug J, Bere E, Due P.
Determinants of fruit and vegetable consumption among children and adolescents:
a review of the literature. Part I: Quantitative studies. Int J Behav Nutr Phys Act
2006;3:22.
82
17. National school lunch program: Participation and lunches served. Available from:
http://www.fns.usda.gov/pd/slsummar.htm (accessed 2013)
18. Evans CE, Christian MS, Cleghorn CL, Greenwood DC, Cade JE. Systematic
review and meta-analysis of school-based interventions to improve daily fruit and
vegetable intake in children aged 5 to 12 y. Am J Clin Nutr 2012;96:889-901.
19. Horne PJ, Tapper K, Lowe CF, Hardman CA, Jackson MC, Woolner J. Increasing
children's fruit and vegetable consumption: a peer-modelling and rewards-based
intervention. Eur J Clin Nutr 2004;58:1649-60.
20. Lowe CF, Horne PJ, Tapper K, Bowdery M, Egerton C. Effects of a peer
modelling and rewards-based intervention to increase fruit and vegetable
consumption in children. Eur J Clin Nutr 2004;58:510-22.
21. Wengreen HJ, Madden GJ, Aguilar SS, Smits RR, Jones BA. Incentivizing
children's fruit and vegetable consumption: results of a United States pilot study
of the Food Dudes Program. J Nutr Educ Behav 2013;45:54-9.
22. Lowe CFaH, P. J. 'Food Dudes': Increasing children's fruit and vegetable
consumption. Cases in Public Health Communication & Marketing 2009;3:161-
85.
23. Lambert A. A multiday record-assisted fruit, vegetable, and snack questionnaire
to assess intake among fourth and fifth grade students. Unpublished master's
thesis. Utah State University, Logan, Utah, 2013.
24. Dietary reference intakes for vitamin C, vitamin E, selenium, and carotenoids. .
In: Institute of Medicine NAoS, Food and Nutrition Board, Panel on Dietary
83
Antioxidants and Related Compounds, editor. Washington D.C.: National
Academies Press, 2000.
25. Mayne ST, Cartmel B, Scarmo S, Lin HQ, Leffell DJ, Welch E, Ermakov I,
Bhosale P, Bernstein PS, Gellermann W. Noninvasive assessment of dermal
carotenoids as a biomarker of fruit and vegetable intake. Am J Clin Nutr
2010;92:794-800.
26. Aguilar SS, Wengreen HJ, Lefevre M, Madden GJ, Gast J. Skin carotenoids: a
biomarker of fruit and vegetable intake in children. J Acad Nutr Diet 2014.
27. Richardson JTE. Eta squared and partial eta squared as measures of effect size in
educational research. Educ Res Rev 2011;6:135-47.
28. Hemphill JF. Interpreting the magnitudes of correlation coefficients. Am Psychol
2003;58:78-9.
29. Horne PJ, Hardman CA, Lowe CF, Tapper K, Le Noury J, Madden P, Patel P,
Doody M. Increasing parental provision and children's consumption of lunchbox
fruit and vegetables in Ireland: the Food Dudes intervention. Eur J Clin Nutr
2009;63:613-8.
30. Stevenson C, Doherty G, Barnett J, Muldoon OT, Trew K. Adolescents' views of
food and eating: Identifying barriers to healthy eating. J Adolesc 2007;30:417-34.
31. Bassett R, Chapman GE, Beagan BL. Autonomy and control: The co-construction
of adolescent food choice. Appetite 2008;50:325-32.
32. Spear HJ, Kulbok P. Autonomy and adolescence: A concept analysis. Public
Health Nurs 2004;21:144-52.
84
33. Stok FM, De Ridder DTD, Adriaanse MA, De Wit JBF. Looking cool or attaining
self-rule. Different motives for autonomy and their effects on unhealthy snack
purchase. Appetite 2010;54:607-10.
34. McPherson RS, Hoelscher DM, Alexander M, Scanlon KS, Serdula MK. Dietary
assessment methods among school-aged children: Validity and reliability. Prev
Med. 2000;31:S11-S33.
35. Lademann J, Meinke MC, Sterry W, Darvin ME. Carotenoids in human skin. Exp
Dermatol 2011;20:377-82.
85
CHAPTER 4
SUMMARY AND CONCLUSION
SUMMARY
Americans are not consuming as many FV as they should be (1). The stats are
even more alarming for adolescents. Results from both cross sectional and cohort studies
have shown a significant decreases in FV intake occur during the transition from
childhood into adolescence (2-5). Cross sectional data from the 1999-2002 NHANES
study for children and adolescents age 2-18 showed adolescents ages 12-18 to be the least
likely to meet recommendations for FV intake (5). Increased consumption of less healthy,
energy dense foods over this same time period contributes to overall poor diet quality (2-
5).
Increasing FV intake in adolescents is an important goal as diets rich in FV have
been associated with decreased risk for many chronic diseases and obesity (6-9). Studies
have also indicated that childhood FV intake carries over into adolescence (10), so
targeting children before they transition into secondary school may be an important
means of improving future adolescent nutrition. School based nutrition interventions have
been targeted as a cost effective way of reaching large numbers of children, but although
many of the studies have shown statistical significance, few have demonstrated clinical
significance (11). The FD program uses repeated tasting, rewards, and modeling. Studies
have shown the FD program to increase children’s lunch time school FV intake at a
clinically significant level (12-15), especially for those children who consumed little or
no FV to begin with. Most of the research that was cited to justify the effectiveness of the
program was done in pre-school or early elementary school age children, but a review of
86
the literature on repeated tasting, rewards, and peer modeling supports the use of these
elements to increase FV intake in older children as well.
The purpose of this study was to answer the question: Does participation in the
Food Dudes program help to offset the decrease in FV intake and the increase in energy
dense food commonly seen during the transition from 5th grade (elementary school) into
6th grade (middle school)? To answer this question, data from 4th and 5th grade students
who were part of the larger six school FD intervention was analyzed from baseline
through the transition into 5th and 6th grade, when an additional control group of 6th
graders was recruited. Students’ lunch time FV consumption was measured by plate
waste photo analysis (PWPA). A fruit, vegetable, and snack questionnaire (FVSQ) was
used to estimate total diet intake of fruits, vegetables, and less healthy snack foods. Skin
carotenoid levels were also measured as an indicator of long-term FV intake.
The limitations of the study design made it difficult to fully answer the question
posed. Results from the PWPA seem to show that the FD program may have long term
effects, even over the transition into middle school. Although the 5th grade cohort initially
saw a decrease from baseline FV consumption upon entering middle school (6th grade),
data from the final follow-up done at the end of the school year suggests that overall FV
intake returned to higher than baseline. The prize group appeared to have the greatest
increase in FV intake, but the limited number of students from this group who had PWPA
done for this phase made it difficult to accurately measure the change.
The study was also limited because the middle school control group did not
participate in PWPA, so comparisons with the other groups was difficult. The FVSQ was
not found to be a good indicator of actual lunch time FV intake or long term FV intake.
87
Comparisons on sugar sweetened beverage, salty snack, sweet snack, and total FV intake
seemed to suggest that increased consumption of any one food was positively associated
with an increased intake of all of the others. Since there was no way to test the validity of
the questions about less healthy snack and beverage intake, it is difficult to make any
definitive conclusions about the results found from that data. Future research
investigating the influence increased FV intake on total diet in adolescents will need a
better method for measuring actual food intake.
Another significant limitation to this study came from the skin carotenoid scanner
scores. Skin carotenoids have been validated an indicator of long term FV intake in both
adults and children (16), but there are other confounding factors that can influence skin
carotenoid levels. Exposure to solar radiation, illness, and smoking (or exposure to
second hand smoke) can all impact skin carotenoid levels (17). Furthermore, for this
particular study there was an issue in differences in calibration between the scanners used
to measure skin carotenoid levels. The issue with the scanners was not apparent until late
in the study, so little could be done about it since students were measured with multiple
scanner units over time.
CONCLUSION
Creating time and cost effective interventions that target increased FV intake in
children and adolescents is an important goal that has the potential to decrease rates of
obesity and chronic disease. This study demonstrated that the elements of the FD
program, repeated tasting, rewards, and role modeling may be effective tools in reaching
that goal among children transitioning from elementary to secondary schools. We found
that although decreases in lunch time FV intake were seen following the initial transition
88
into middle school, by the end of the school year FV intake levels exceeded baseline FV
intake, with the greatest increase seen in the FD prize group.
Plate waste photo analysis was an effective way of measuring changes in FV at
school, but it was a time consuming practice and gave no feedback about changes in total
FV intake or overall diet quality. The FVSQ used for this study proved inaccurate at
measuring school FV intake and thus likely total FV and other food intake. Future efforts
need to target creating a cost effective, but more accurate way to study changes in total
FV intake and overall diet quality.
REFERENCES
1. Guenther PM, Dodd KW, Reedy J, Krebs-Smith SM. Most Americans eat much
less than recommended amounts of fruits and vegetables. J Am Diet Assoc
2006;106:1371-9.
2. Currie C, Robert, C., Morgan, A., Smith, R., Setterbulte, W., Samdal, O.,
Rasmussen, V. B. Young people's health in context. Health behaviour in school-
aged children. Copenhagen: WHO, 2004.
3. Perez A, Hoelscher DM, Brown HS, 3rd, Kelder SH. Differences in food
consumption and meal patterns in Texas school children by grade. Prev Chronic
Dis 2007;4:A23.
4. Lytle LA, Seifert S, Greenstein J, McGovern P. How do children's eating patterns
and food choices change over time? Results from a cohort study. American
Journal of Health Promotion 2000;14:222-8.
5. Lorson BA, Melgar-Quinonez HR, Taylor CA. Correlates of fruit and vegetable
intakes in US children. J Am Diet Assoc 2009;109:474-8.
89
6. Boeing H, Bechthold A, Bub A, Ellinger S, Haller D, Kroke A, Leschik-Bonnet
E, Muller MJ, Oberritter H, et al. Critical review: vegetables and fruit in the
prevention of chronic diseases. Eur J Nutr 2012;51:637-63.
7. Newby PK. Plant foods and plant-based diets: protective against childhood
obesity? Am J Clin Nutr 2009;89:1572S-87S.
8. Rolls BJ, Ello-Martin JA, Tohill BC. What can intervention studies tell us about
the relationship between fruit and vegetable consumption and weight
management? Nutr Rev 2004;62:1-17.
9. Tohill BC, Seymour J, Serdula M, Kettel-Khan L, Rolls BJ. What epidemiologic
studies tell us about the relationship between fruit and vegetable consumption and
body weight. Nutr Rev 2004;62:365-74.
10. Rasmussen M, Krolner R, Klepp K-I, Lytle L, Brug J, Bere E, Due P.
Determinants of fruit and vegetable consumption among children and adolescents:
a review of the literature. Part I: Quantitative studies. Int J Behav Nutr Phys Act
2006;3:22.
11. Evans CE, Christian MS, Cleghorn CL, Greenwood DC, Cade JE. Systematic
review and meta-analysis of school-based interventions to improve daily fruit and
vegetable intake in children aged 5 to 12 y. Am J Clin Nutr 2012;96:889-901.
12. Horne PJ, Tapper K, Lowe CF, Hardman CA, Jackson MC, Woolner J. Increasing
children's fruit and vegetable consumption: a peer-modelling and rewards-based
intervention. Eur J Clin Nutr 2004;58:1649-60.
13. Horne PJ, Hardman CA, Lowe CF, Tapper K, Le Noury J, Madden P, Patel P,
Doody M. Increasing parental provision and children's consumption of lunchbox
90
fruit and vegetables in Ireland: the Food Dudes intervention. Eur J Clin Nutr
2009;63:613-8.
14. Lowe CF, Horne PJ, Tapper K, Bowdery M, Egerton C. Effects of a peer
modelling and rewards-based intervention to increase fruit and vegetable
consumption in children. Eur J Clin Nutr 2004;58:510-22.
15. Wengreen HJ, Madden GJ, Aguilar SS, Smits RR, Jones BA. Incentivizing
children's fruit and vegetable consumption: results of a United States pilot study
of the Food Dudes Program. J Nutr Educ Behav 2013;45:54-9.
16. Mayne ST, Cartmel B, Scarmo S, Lin HQ, Leffell DJ, Welch E, Ermakov I,
Bhosale P, Bernstein PS, Gellermann W. Noninvasive assessment of dermal
carotenoids as a biomarker of fruit and vegetable intake. Am J Clin Nutr
2010;92:794-800.
17. Lademann J, Meinke MC, Sterry W, Darvin ME. Carotenoids in human skin. Exp
Dermatol 2011;20:377-82.
91
APPENDIX - FVSQ
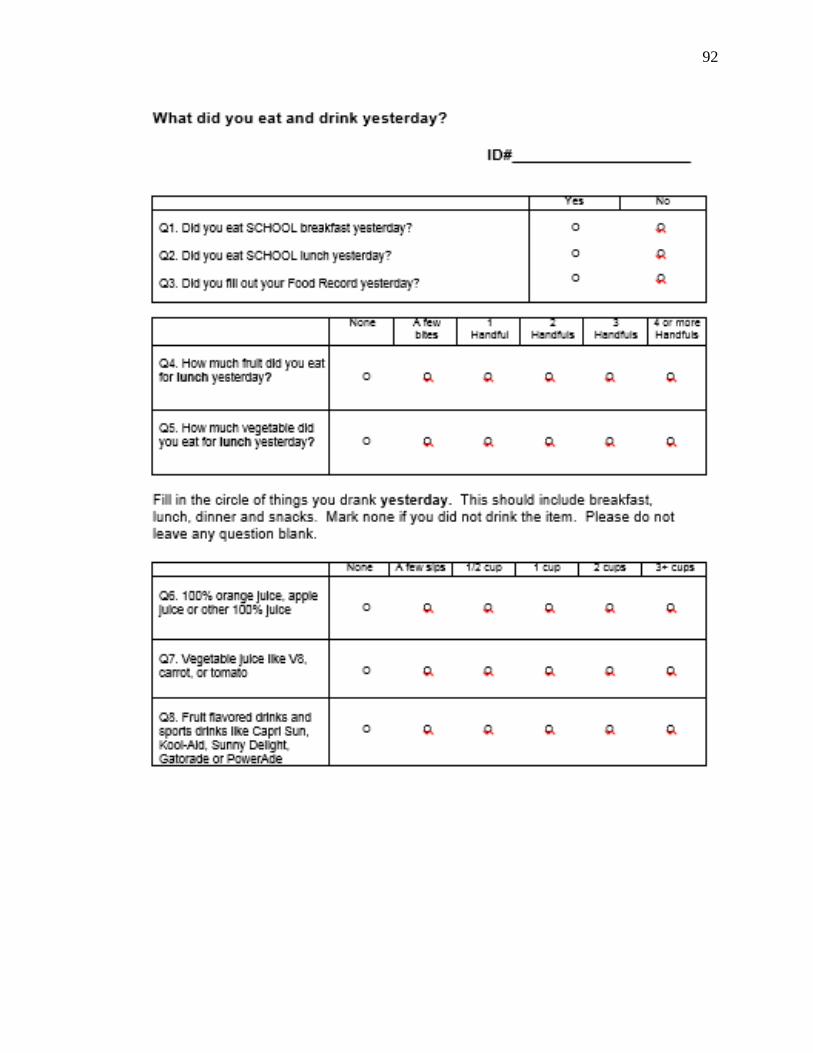
92
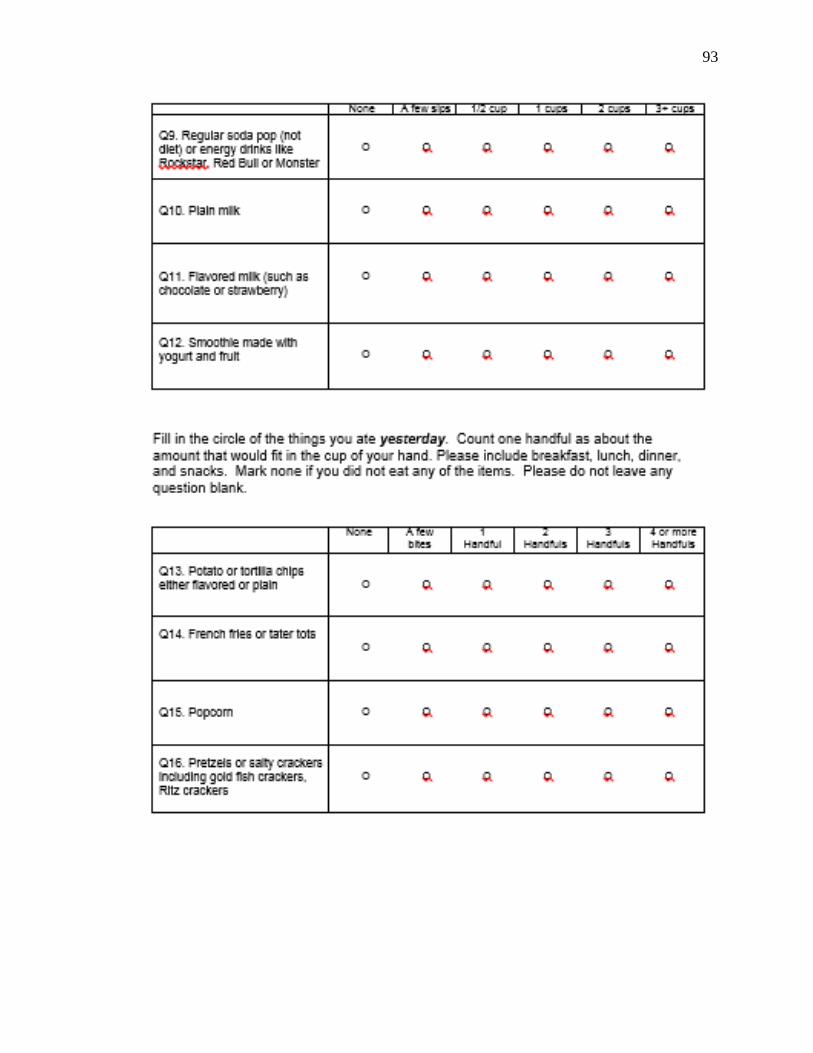
93
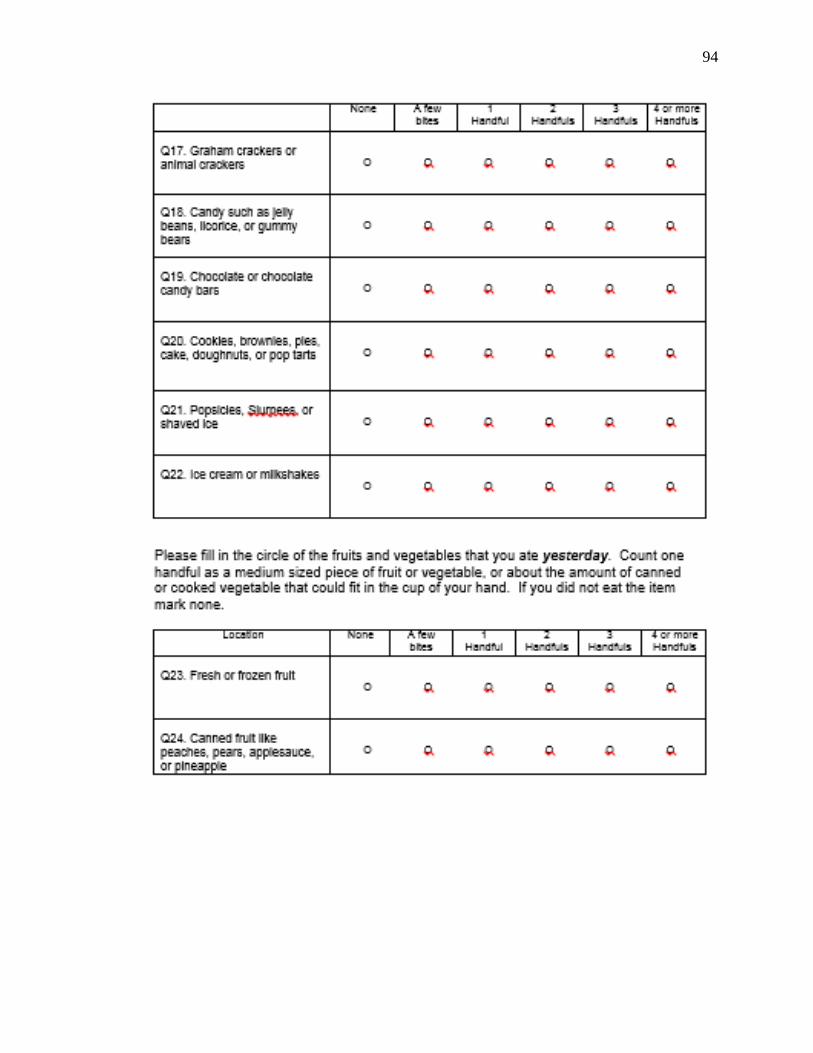
94
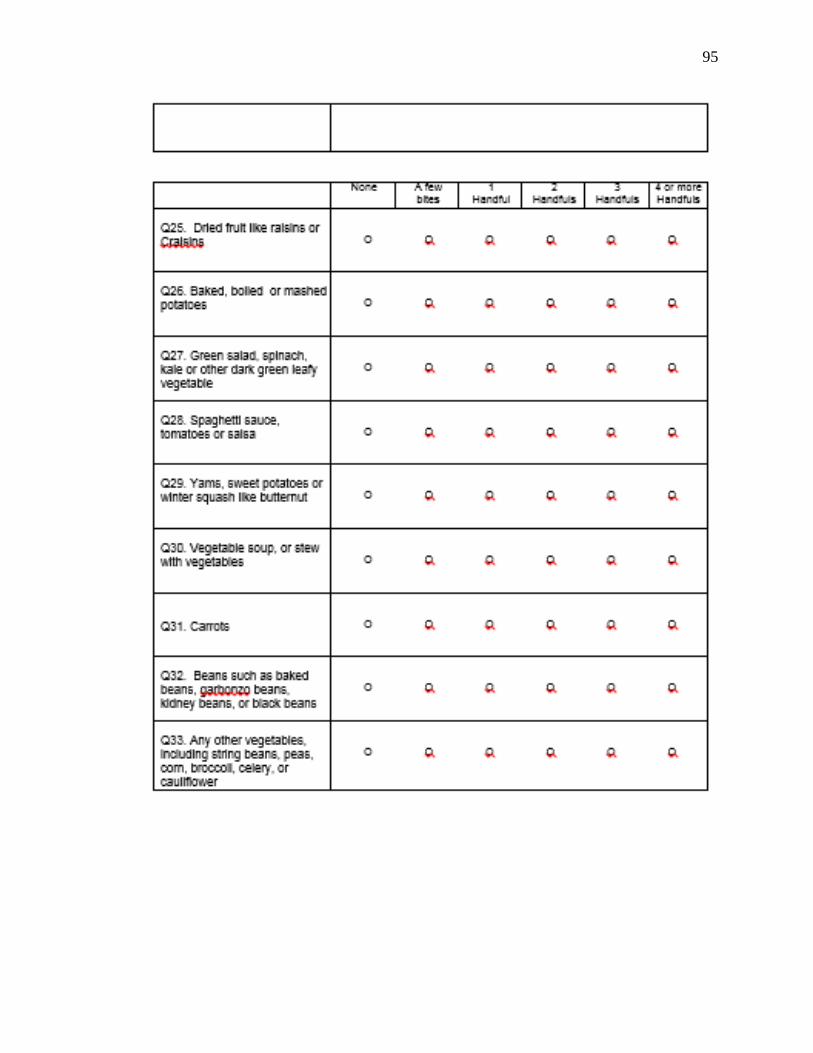
95