The Impact of Oil Consumption Mechanisms on Diesel …/67531/metadc777281/m2/1/high...modifying the...
9
Proceedings of Insert Conference Abbreviation: Insert Conference Name Insert Conference Date and Location Put Paper Number Here The Impact of Oil Consumption Mechanisms on Diesel Exhaust Particle Size Distributions and Detailed Exhaust Chemical Composition John Stetter Engine Research Center University of Wisconsin - Madison Nathan Forster Engine Research Center University of Wisconsin - Madison Jaal Ghandhi Engine Research Center University of Wisconsin - Madison David Foster Engine Research Center University of Wisconsin - Madison ABSTRACT Detailed exhaust emission data have been taken from a Cummins N-14 single cylinder research engine in which the oil consumption was varied by different engine modifications. Low sulfur fuel was used, and oil consumption was varied by modifying the intake valve stem seals, the exhaust valve stem seals, the oil control ring and combinations of these modifications. Detailed measurements of exhaust gas particle size distributions and chemical composition were made for the various oil consumption configurations for a range of engine loads and speeds. The particulate mass was measured with TEOM and traditional gravimetric filter methods. Filter data for EC/OC, sulfates and trace metals have been taken and analyzed. The trace metals in the particulate mass serve as the basis for assessing oil consumption at the different operating conditions. The data indicate that the oil consumption for the steady state testing done here was approximately an order of magnitude below oil consumption values cited in the literature. We did measure changes in the details of the chemical composition of the particulate for the different engine operating conditions, but it did not correlate with changes in the oil consumption. Furthermore, the data indicate that the particle size distribution is not strongly impacted by low level oil consumption variations observed in this work. INTRODUCTION Oil consumption is naturally regarded as one of the indices to evaluate the engine performance. Unreacted lubricating oil may contribution to the nucleation of nanoparticles [1]. Particulates from unburnt lubricating oil may be significant especially at low load engine operating conditions [2]. Consequently the reduction of oil consumption becomes important in its own right, as well being a component of reducing PM. For the measurement of oil consumption, many methods have been used. The weighing methods and the volumetric methods, including the “drain method”, the “constant weight method”, and the “constant oil level method”, require considerable engine operating time to acquire reliable results. In addition to the time requirements, the accuracy can be problematic because of oil hang-up and fuel dilution. To compensate for such defects, tracer methods have been used [3]. Tracer methods involve exhaust sampling, typically using filters. In the work reported here detailed chemical composition of the particulate matter was determined through exhaust sampling, hence the potential exists to extract oil consumption information from these measurements, similar to a tracer technique. In this research, Inductively Coupled Plasma Mass Spectrometer (ICPMS) and Aerosol Time-of-Flight Mass Spectrometer (ATOFMS) were applied to the diesel exhaust. ICPMS, which uses the filter sampling technique, gives a detailed chemical composition of PM. Via its trace metal concentration, we can determine the relative lubricating oil consumption using a chemical mass balance, which then allows us to examine the effect of engine operating condition on lubricating oil consumption. EXPERIMENTAL DESCRIPTION ENGINE BENCH SETUP The schematic of the research engine bench is shown in Figure 1. The engine employed in the experiment is a research single-cylinder direct-injection (DI) 4-cycle diesel, adapted from an in-line six-cylinder Cummins N14-series engine, which has a low swirl, turbo-charged, 4-valve, centrally located direct- injection combustion system. The combustion chamber of the engine is a quiescent, shallow dish type and it uses a CELECT 1 Copyright © #### by ASME
Transcript of The Impact of Oil Consumption Mechanisms on Diesel …/67531/metadc777281/m2/1/high...modifying the...
Proceedings of Insert Conference Abbreviation: Insert Conference Name
Insert Conference Date and Location
Put Paper Number Here TThhee IImmppaacctt ooff OOiill CCoonnssuummppttiioonn MMeecchhaanniissmmss oonn DDiieesseell EExxhhaauusstt PPaarrttiiccllee SSiizzee DDiissttrriibbuuttiioonnss aanndd DDeettaaiilleedd EExxhhaauusstt CChheemmiiccaall CCoommppoossiittiioonn
John Stetter Engine Research Center
University of Wisconsin - Madison
Nathan Forster Engine Research Center
University of Wisconsin - Madison
Jaal Ghandhi Engine Research Center
University of Wisconsin - Madison
David Foster Engine Research Center
University of Wisconsin - Madison ABSTRACT
Detailed exhaust emission data have been taken from a Cummins N-14 single cylinder research engine in which the oil consumption was varied by different engine modifications. Low sulfur fuel was used, and oil consumption was varied by modifying the intake valve stem seals, the exhaust valve stem seals, the oil control ring and combinations of these modifications. Detailed measurements of exhaust gas particle size distributions and chemical composition were made for the various oil consumption configurations for a range of engine loads and speeds.
The particulate mass was measured with TEOM and traditional gravimetric filter methods. Filter data for EC/OC, sulfates and trace metals have been taken and analyzed. The trace metals in the particulate mass serve as the basis for assessing oil consumption at the different operating conditions.
The data indicate that the oil consumption for the steady state testing done here was approximately an order of magnitude below oil consumption values cited in the literature. We did measure changes in the details of the chemical composition of the particulate for the different engine operating conditions, but it did not correlate with changes in the oil consumption. Furthermore, the data indicate that the particle size distribution is not strongly impacted by low level oil consumption variations observed in this work.
INTRODUCTION
Oil consumption is naturally regarded as one of the indices to evaluate the engine performance. Unreacted lubricating oil may contribution to the nucleation of nanoparticles [1]. Particulates from unburnt lubricating oil may be significant especially at low load engine operating conditions [2]. Consequently the reduction of oil consumption becomes important in its own right, as well being a component of reducing PM.
For the measurement of oil consumption, many methods have been used. The weighing methods and the volumetric methods, including the “drain method”, the “constant weight method”, and the “constant oil level method”, require considerable engine operating time to acquire reliable results. In addition to the time requirements, the accuracy can be problematic because of oil hang-up and fuel dilution. To compensate for such defects, tracer methods have been used [3]. Tracer methods involve exhaust sampling, typically using filters. In the work reported here detailed chemical composition of the particulate matter was determined through exhaust sampling, hence the potential exists to extract oil consumption information from these measurements, similar to a tracer technique.
In this research, Inductively Coupled Plasma Mass Spectrometer (ICPMS) and Aerosol Time-of-Flight Mass Spectrometer (ATOFMS) were applied to the diesel exhaust. ICPMS, which uses the filter sampling technique, gives a detailed chemical composition of PM. Via its trace metal concentration, we can determine the relative lubricating oil consumption using a chemical mass balance, which then allows us to examine the effect of engine operating condition on lubricating oil consumption.
EXPERIMENTAL DESCRIPTION
ENGINE BENCH SETUP
The schematic of the research engine bench is shown in Figure 1. The engine employed in the experiment is a research single-cylinder direct-injection (DI) 4-cycle diesel, adapted from an in-line six-cylinder Cummins N14-series engine, which has a low swirl, turbo-charged, 4-valve, centrally located direct-injection combustion system. The combustion chamber of the engine is a quiescent, shallow dish type and it uses a CELECT
1 Copyright © #### by ASME
unit injector. The specification of the engine is given in Table 1.
Figure 1. Schematic of the research single-cylinder Cummins N14 engine bench layout.
The laboratory has a full-dilution tunnel system to collect particulate samples from the engine. Gaseous emissions such as nitrogen oxides (NOx), carbon monoxide (CO), total hydrocarbon (THC), and carbon dioxide (CO2) are measured using a ThermoNicolet FTIR.
Table 1. The research single-cylinder Cummins N14 engine specification.
Engine Type Research Single-Cylinder Diesel Cycle 4-stroke Combustion Chamber Quiescent Piston Chamber Shallow Dish Number of Intake Valves 2 Number of Exhaust Valves 2 Compression Ratio 13.1:1 Swirl Ratio 1.4 Displacement 2333 cc Bore/Stroke 139.7 mm / 152.4 mm Combustion Chamber Diameter
97.8 mm
Connecting Rod Length 304.8 mm Piston Pin Offset None Injection System Unit Injector, Direct Injection
Nozzle Dimension 8 × φ 0.2 mm Length/Diameter of holes
(l/d) 4.1
Spray Angle 152°
AUGMENTED FULL DILUTION TUNNEL SYSTEM
For the current study an augmented sampling system, which was designed and installed according to the EPA ambient air quality measurement protocol, was used. Specifically, the secondary dilution tunnel of a typical full dilution tunnel was enhanced to allow more detailed assessment of the individual chemical components of the particulate matter. The design of the augmented sampling system was based on the study by Hildemman et al. [4] and Schauer et al. [5,6,7]
Figure 2 shows the schematic of the augmented sampling system, which consists of a primary dilution tunnel (PDT), secondary dilution tunnel (SDT), residence time chamber (RTC), and subsystems such as a 142 mm filter holder, two PM2.5 cyclones, several 47 mm filter holders, vacuum pumps, etc.
FUEL TANK
PUMP
FILTER
MICROMOTION
TANK PUMP
HEAT EXCHANGERH2O
ENGINE AND DYNAMOMETER
BUILDINGAIR
FILTER
REGULATOR
HEATER
CRITICAL FLOWORIFICES
TOFTIR
HEATEDFILTER
INTAKESURGETANK
EXHAUSTSURGETANK
CHARGEAMPLIFIER
STRAIN GAGEAMPLIFIER
ELECTRONICINJECTION CONTROL SYSTEM (SHAFT8)
ECMFR
OM
ENC
OD
ER
FRO
MO
PTIC
AL
INTE
RR
UPT
ER
EXHAUST
BUILDINGAIR
ARROW PNEUMATICSLARGE CAPACITY FILTEROILESCER FILTER
REGULATOR
FLOW ORIFICE
AIR
TO F
TIR
EXH
AU
ST
EXHAUST
MINI DILUTIONTUNNEL
FILTER
REGULATOR
FULL
DIL
UTI
ON
TUN
NEL
EXH
AU
ST
NI DAQ
Because diesel particles are naturally charged, as a result of the combustion process, which can cause electrostatic deposition in the sampling system, the current sampling system was made with electrically non-chargeable materials, such as 304, 316, and 316L stainless steels. Thermophoretic deposition is caused by asymmetric forces, which arises from a temperature gradient. To minimize the temperature gradient inside the sampling line, its main body was made with a thin 304 stainless steel tube (thickness = 0.16 cm) and insulated. In addition, the surface temperature of the residence time chamber can be controlled to be approximately the same temperature as the inside gas temperature by using four rows of heated bands and respective temperature controller. The sampling system inlet, which supplies the secondary dilution tunnel, was made thin and sharp to facilitate isokinetic sampling, and its diameter was gradually increased to minimize inertial deposition of particles in bends of the pipe.
EXHAUST
SECONDARY DILUTION TUNNEL
RESIDENCETIMECHAMBER
PRIMARY DILUTION TUNNEL
PRIMARY DILUENTS
FLOW ORIFICE
REGULATOR
FILTER
BUILDING AIR
TO R
EAC
TO REAC
TO REAC
TO REAC
T
T
142 MM FILTER HOLDER
FLOW ORIFICES
EXHAUST
VACUUMPUMP
47 MMFILTER HOLDER
EXHAUST FLOW ORIFICEVACUUM PUMP
T, P
T, P_VAC
T, P_ABS
P_VAC
P_VAC
INCLINED MANOMETER
AIHH CYCLONE
Figure 2. Schematic of the augmented sampling system in the Cummins N14 engine bench.
The residence time chamber was designed to give a residence time of between 30 and 60 seconds, under isokinetic sampling, which is believed to be sufficient time to allow all the condensation processes to take place for the current system [8].
At the bottom of the residence time chamber, a 142 mm filter holder is attached. It has two functions. First, the 142 mm filter holder allows a large range of sample flow rates, which enables us to control the residence time in the residence time chamber, while maintaining isokinetic flow from the primary dilution tunnel. Second, a large amount of sample can
2 Copyright © #### by ASME
be collected for the analyses such as soluble organic fraction (SOF).
The augmented sampling system has many extra sampling ports to collect many different kinds of samples. The relative humidity (RH) of the diluted gases is measured with dry- and wet-bulb thermometers installed in one of the available sampling ports. All the flow rates of air and diluents are controlled by critical flow orifices.
DETAILED CHEMICAL COMPOSITION
The two types of sampling trains that were used are shown in Figure 3. These are attached to the residence time chamber and are operated in parallel. All the flow rates are controlled with critical flow orifices located downstream of the filter holders. The first component of each sampling train is an AIHH aluminum Teflon coated PM2.5 cyclone, which is operated at a flowrate of 24 liter/min.
As shown in Figure 3 (top), the first sampling train consists of a cyclone followed by three Teflon membrane filters (47 mm diameter, Gelman Teflo, 2 µm pore size) and one baked quartz fiber filters (47 mm diameter, Pallflex Tissuequartz 2500 QAO). The first Teflon membrane filter is used for gravimetric determination of the PM and is analyzed for sulfate ions by ion chromatography (IC). The second is for a duplicate PM concentration measurement, and the third is used for an analysis of trace metals by ICP-mass spectrometry (ICP-MS). The quartz fiber filter is for determination of elemental and organic carbon (ECOC), which is analyzed with a Sunset Laboratories Carbon Analyzer, the operation of which follows NIOSH method 5040. Figure 3. Sholders wit
The second sampling train shown in Figure 3 (bottom) is composed of a cyclone followed by three baked quartz fiber filters operated in parallel, which are then followed by a polyurethane foam (PUF) cartridge (Atlas Foam; density = 0.022 g/cm3, ILD = 30, 5.7 cm diameter by 7.6 cm long) in series. The PUF cartridge is pre-cleaned with solvent. The particle-phase organic compounds are collected on the three quartz fiber filters and the PUF cartridges downstream of the filters collect semi-volatile organic compounds. The sampled filters and PUF cartridges are analyzed with a HP5973 gas chromatography/mass spectrometry (GC/MS) with a 30-meter HP-5MS GC column.
Particle Number Concentration and Size Distribution
A TSI 3936L10 Scanning Mobility Particle Sizer (SMPS) is connected to one of the sampling ports of the residence time chamber to measure particle size distributions of the particulates. The 3936L10 SMPS consists of a TSI Model 3081 Electrostatic Classifier, a TSI Model 3077 Kr-85 Aerosol Neutralizer, and a TSI Model 3010 Condensation Particle Counter (CPC). This instrument measures particle number concentrations and size distributions in terms of number-, mass-, volume-, and surface area-weighted.
EXPERIMENTAL DESIGN AND RUN CONDITIONS
Engine Operating Conditions
Experiments were performed at selected points of the California Air Resources Board (CARB) 8 mode test cycle. Figure 4 shows an engine map with the eight operating modes identified. The arrows on the figure depict the operating conditions evaluated in this research effort, modes 1, 4 and 5. Diluted exhaust
ample trains of four (top) and three (bottom) filter h respective PM2.5 AIHH cyclone.
PM 2.5cyclone
TFF TFF TFF QFF
PM 2.5cyclone
QFF QFF QFF
Diluted exhaust
PUF PUF PUF
TFF: Teflon filterQFF: Quartz fiber filter
: Critical flow orifice
600 800 1000 1200 1400 1600 1800 20000
20
40
60
80
100
120
140
160
180
200
220
240
260
(50% load)
(75% load)
(100% load)
(25% load)
(50% load)
(75% load)
(100% load)
Rated Speed
Peak Torque
Mode 3
Mode 2
Mode 1
Mode 5
Mode 6
Mode 4
Mode 7
Mode 8(Idling)
Eng
ine
Torq
ue/C
ylin
der [
Nm
]
Engine Speed [rpm]
Figure 4. California eight mode test cycle with modes, 1, 4 and 5 identified. These were the conditions studied in this research.
Specific identification of the operating conditions for each
of the operating modes for the Cummins N14 engine is shown in Table 2. Box borders highlight the operating conditions for the three modes run in this program. The fuel used was a low
3 Copyright © #### by ASME

sulfur EPA 2006 compliant fuel. The fuel specification are shown in the appendix, Table A1.
Table 2, Details of California eight mode test cycle with operating modes of this research highlighted
The purpose of this program was to assess the impact of
different lubrication consumption mechanisms and rates on the resultant particulate and exhaust gas composition and characteristics. There are several avenues by which lubricating oil can be consumed during engine operation. Figure 5 shows a schematic of these different mechanisms.
Figure 5. Schematic of different mechanisms for oil consumption. (From SAE 1999-01-3460)
As shown in the figure, lubricating oil can be consumed via: 1. blowby gases which are reintroduced into the intake flow by the PCV system; 2. leakage past the valve stem seals; 3. leakage past the rings; and 4. (not shown in the figure) leakage at the turbocharger.
In this experiment, we did not have a turbocharger and the crankcase was ventilated directly into the test cell exhaust system. Consequently we only investigated mechanisms 2 and 3, valve stem seal leakage and leakage past the rings, for their impact on diesel exhaust composition.
The oil consumption was determined through the measurement of the trace metals in the particulate [9, 10]. The most prominent trace metal in the particulate was found to be calcium. Analysis of the fuel indicated that there was no calcium in the fuel, so this should be a good indicator of lubricating oil consumption. By measuring the calcium concentration in the oil one could then calculate the oil consumption that would be necessary for the different calcium levels to exist in the particulate. This was the approach taken in the results reported here. As an internal check we also calculated, using the same procedure, the oil consumption using the zinc concentration measured in the particulate. Figure 6 shows a comparison of the oil consumption determined using the two different markers, calcium and zinc. The agreement between the two techniques is very good.
Figure 6. Lubricating Oil Consumption (LOC) as determined using calcium and zinc as tracers
RESULTS AND DISCUSSION
Various approaches were taken to vary the oil consumption of the engine. Engine runs were made with the
Mode 1 Mode 4 Mode 5 Mode 2 Mode 3 Mode 6 Mode 7 Mode 8 Speed [rpm] 1800 1800 200 1200 700 1800 1200 1200 1
Load [%] 75 50 0 10 (idle) 100 25 100 75 5
Remark Rated speed Peak
torque Intake T [°C] 46.48 46.48 5.74 46.30 45.74 46.48 46.11 45.93 4Intake P [kPa] 148.97 143.00 57.01 162.07 164.37 148.05 160.46 152.87 1
Exhaust P [kPa] 195.54 160.23 02.67 182.18 151.52 181.91 162.41 152.94 2SOI, CA aTDC
[degrees] -5.0 -5.0 .0 -2.0 -2.0 -5.0 -2.0 -11.0 -2
0.0 0.5 1.0 1.5 2.0
0.0
0.5
1.0
1.5
2.0
LOC
Rat
e C
alcu
late
d by
Zin
c [g
/hr]
LOC Rate Calculated by Calcium [g/hr]
4 Copyright © #### by ASME

intake valve stem seals removed, with the exhaust valve stem seals removed, with both intake and valve stem seals removed and with the oil control ring pressure spring reduced by 50 percent. Duplicate runs were made for several test conditions.
Figure 7 shows the oil consumption for the different test cases examined in the research. The data are plotted as a percent difference from the base case, which is the normal engine configuration. Figure 7. Relative oil consumption for different approaches of altering oil consumption.
In looking at Figure 7 one is immediately struck by the fact that for the situation of no intake and exhaust valve stem seals and for the case of no exhaust valve stem seals the oil consumption was measured as less than the base case. This occurred for both mode 1 and mode 5 operating conditions. These data repeated. It is the authors’ opinion that leakage past the exhaust valve stem, enhanced by the absence of the valve stem seal, is responsible for this observation. In a normal engine these gases would be routed back into the intake manifold via the crankcase ventilation system. In our engine, these gases would be directed into the building exhaust system. Consequently the oil and particulate matter would not exit the engine in the exhaust and would not be measured in our analysis.
Note that for the case of no intake valve stem seal there was a measured increase in the oil consumption. Likewise for the case of a 50% reduction in oil control ring pressure there was a measured increase in oil consumption. For the oil consumption increase caused by the absence of the intake valve seals there was no impact of the two different engine operating conditions. However, for the case of the oil control ring pressure reduction there was a dependence on the engine operating condition, with the maximum power condition resulting in higher oil consumption.
It is important to put the relative oil consumptions into perspective in terms of their absolute magnitudes. Based on the measurements of calcium in the particulates and the calcium concentration in the oil the lubricating oil consumption was determined. The consumption rates were shown in figure 6 but are repeated here in Table 3 for emphasis.
The magnitudes of oil consumption given in Table 3 are for our experiment in which the engine was run under steady state conditions. The typical in-use oil consumptions were general values for engines operating over a range of conditions, which includes transient operation.
It is striking the difference between the oil consumption rates measured in this experiment and those typical for in-use operation. The principle difference between our operating conditions and those of in use operation is the prevalence of engine transients. As such one would conclude that a very important operational characteristic that impacts oil consumption is transient operation.
Table 3.
Oil Consumption For Steady State Engine Operation and “Typical” Values of In-Use Oil Consumption
Exhaust Lube Oil Consumption Variation from Base Condition
-80%
-60%
-40%
-20%
0%
20%
40%
60%
80%
100%
120%
No IntakeVSS
No E or IVSS
No E or IVSS
NoExhaust
VSS
Base 50% OCR 50% OCR
Mode 5 - Peak Torque 1200 rpmMode 1 - Peak Power 1800 rpm
N14 Steady State Oil Consumption - Modes 1 & 5
0.3 - 1.5 g/hr
N14 Steady State Oil Consumption - Mode 4
< 0.1 g/hr
Typical “in-use” oil consumption
0.1 - 0.5% full load fuel consumption: 7.0 - 40 g/hr
We have some data which supports this premise. Figure 8
shows the results obtained from an Aerosol Time of Flight Mass Spectrometer (ATOFMS). These data were obtained during a step change in operating conditions for the Cummins N14 engine used in this research using a TSI Inc., Model 3800 ATOFMS. The data are qualitative but trends are discernible.
11:4
7:00
11:4
7:30
11:4
8:00
11:4
8:30
11:4
9:00
11:4
9:30
11:5
0:00
11:5
0:30
11:5
1:00
11:5
1:30
11:5
2:00
11:5
2:30
11:5
3:00
11:5
3:30
11:5
4:00
11:5
4:30
11:5
5:00
11:5
5:30
11:5
6:00
11:5
6:30
Mn+P-Fe+Ca+ECOC
0
5
10
15
20
25
30
35
40
# of
par
ticle
s(C
a+, F
e+, M
n+, P
-, EC
)
Time
Timeline 31502m415TR
Mn+P-Fe+Ca+ECOC
BP-ARCO fuel
Ca
11:4
7:00
11:4
7:30
11:4
8:00
11:4
8:30
11:4
9:00
11:4
9:30
11:5
0:00
11:5
0:30
11:5
1:00
11:5
1:30
11:5
2:00
11:5
2:30
11:5
3:00
11:5
3:30
11:5
4:00
11:5
4:30
11:5
5:00
11:5
5:30
11:5
6:00
11:5
6:30
Mn+P-Fe+Ca+ECOC
0
5
10
15
20
25
30
35
40
# of
par
ticle
s(C
a+, F
e+, M
n+, P
-, EC
)
Time
Timeline 31502m415TR
Mn+P-Fe+Ca+ECOC
11:4
7:00
11:4
7:30
11:4
8:00
11:4
8:30
11:4
9:00
11:4
9:30
11:5
0:00
11:5
0:30
11:5
1:00
11:5
1:30
11:5
2:00
11:5
2:30
11:5
3:00
11:5
3:30
11:5
4:00
11:5
4:30
11:5
5:00
11:5
5:30
11:5
6:00
11:5
6:30
Mn+P-Fe+Ca+ECOC
0
5
10
15
20
25
30
35
40
# of
par
ticle
s(C
a+, F
e+, M
n+, P
-, EC
)
Time
Timeline 31502m415TR
Mn+P-Fe+Ca+ECOC
BP-ARCO fuel
Ca
Figure 8. ATOFMS data of number of particles containing various trace metals as the engine moves through a step load change. Even though the data is qualitative, the sudden spike in Ca is quite apparent. This sudden spike occurs at the time of the step change in load. Again, even though the data is qualitative, it is interesting that the magnitude of the number of particles containing calcium during the transient is approximately an order of magnitude larger than the number of particles containing calcium during the steady state operation before and after the transient step. This observation is consistent with the premise that oil consumption is linked to transient operation.
It seems apparent that for this engine the steady state operating conditions the oil consumption is very small. However, it was decided to continue with the data analysis to
5 Copyright © #### by ASME

determine if differences in the detailed composition of the particulate could be correlated with variation in oil consumption rates.
To make this assessment, the mass based measurements of organic and elemental carbon and trace species were examined more closely. Since the measurements of the total particulate mass and resolved components, i.e. elemental carbon, organic carbon, trace metals and sulfates were done on separate filters, we first verified the consistency of the data by comparing the total mass measured on the particulate filters with the sum of the mass of the individual components, measured on individual filters. This comparison is shown in Figure 9. As seen in the figure, we get good agreement between the total mass of particulate and the sum of the individual components, which were each measured on separate filters at the same operating condition. Figure 9. Comparison of the reconstructed mass, the sum of the individual components - each measured on separate filters, with the total filter PM 2.5 mass measurements.
Figure 10, a, b, and c show the partitioning of the particulate matter into elemental carbon (EC), organic matter (OM), sulfates and ash for the three different engine conditions run in this research. It is readily apparent that there is significant variation in particulate composition with changes in engine operating conditions.
Figure 10a. Particle composition distribution for Mode 4, 25% load, 1200 rpm
Mode 5 100% Load 1200 rpm
OM38%
EC61%
Ash0.13%
SO40.13%
0 1 2 3 4 5 6 7 8
0
1
2
3
4
5
6
7
8
1:1 Slope
Reconstructed Mass = EC+1.2*OC+sulfates
Rec
onst
ruct
ed M
ass
[mg/
m3]
Filter PM2.5 Mass [mg/m3]
Figure 10b. Particle composition distribution for Mode 5, 100 % load, 1200 rpm
Mode 1 100% Load 1800 rpm
SO40.7%
Ash0.2%
EC85%
OM14%
Figure 10c. Particle composition distribution for Mode 1, 100 % load, 1800 rpm
What is not shown in Figures 10 a-c is that the relative partition of the particulate composition did not change appreciably with changes in lubricating oil consumption. The variation in the distribution of the components of the particulate matter at any particular operating condition was within 5 percent, plus or minus, for the different oil consumption builds of the engine. Mode 4 25% Load 1200 rpm
OM83%
EC16%
Ash0.01%
SO40.33%
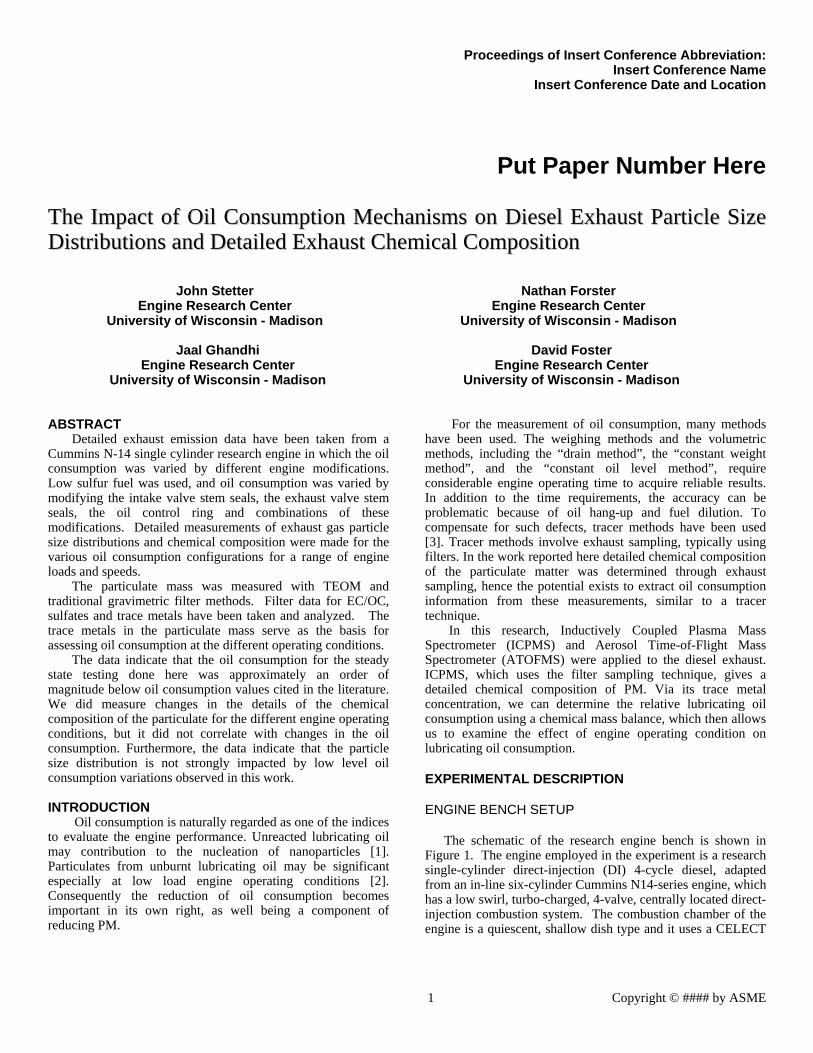
These results are shown as bar graphs in Figures 11 a-c. In viewing Figures 11 a-c, notice the discontinuity in the ordinate axes. For mode 4, 25% load, 1200 rpm, the majority of the particulate is composed of organic matter. Within the measurement variation for a given oil consumption build, there is no significance different between the organic matter with changes in the steady state oil consumption. The elemental carbon composition is approximately an order of magnitude less than the organic material, and like the organic material, the variation in EC between the different oil consumption engine builds is statistically insignificant. The variation of the sulfate composition is at the detection limit of our measurement.
6 Copyright © #### by ASME
0.000.020.040.060.080.100.120.140.160.180.20
0.40.60.81.0
SulfateDetectionLimit
EC OC LOC SO4
Figure 11a. Variation in particle composition at mode 4 operating condition versus different oil consumption engine builds.
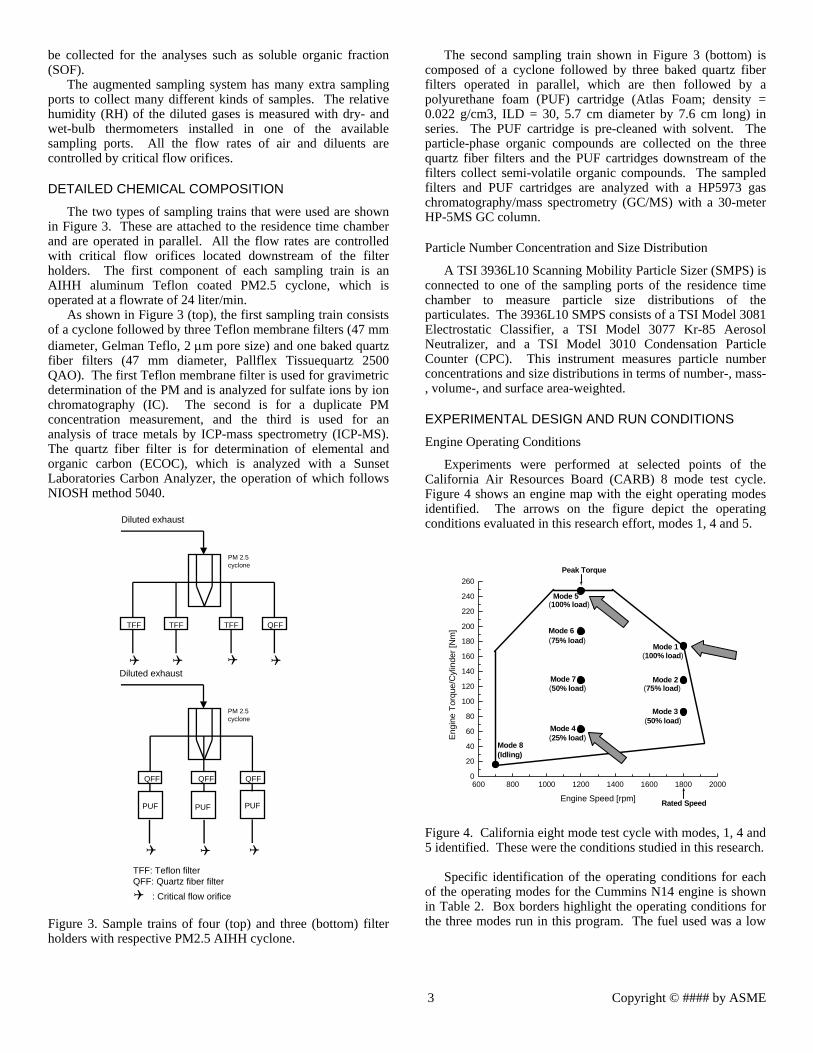
Figure 11b. Variation in particle composition at mode 5 operating condition versus different oil consumption engine builds.
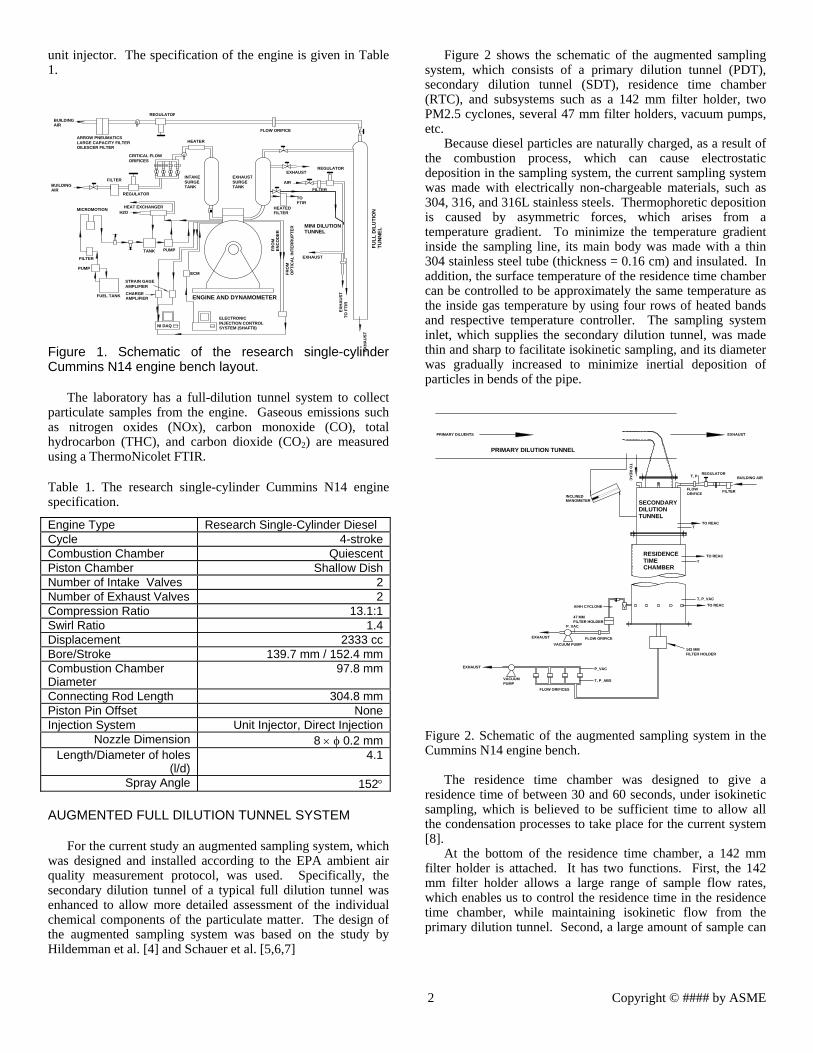
For the operating conditions at heavier load, mode 5 and
mode 1 - shown in Figures 11 b and c, the elemental carbon is the dominant component of the particulate matter. In both cases there appears to be no statistically significant difference in the mass loading of the particulate which is elemental carbon for the different oil consumption engine builds. However, we see that there is a difference in the proportioning of the particulate that is organic matter, or sulfate, with changes in oil consumption engine builds. Furthermore, although the organic matter composition is less than the elemental carbon its magnitude is on the same order as that of the elemental carbon.
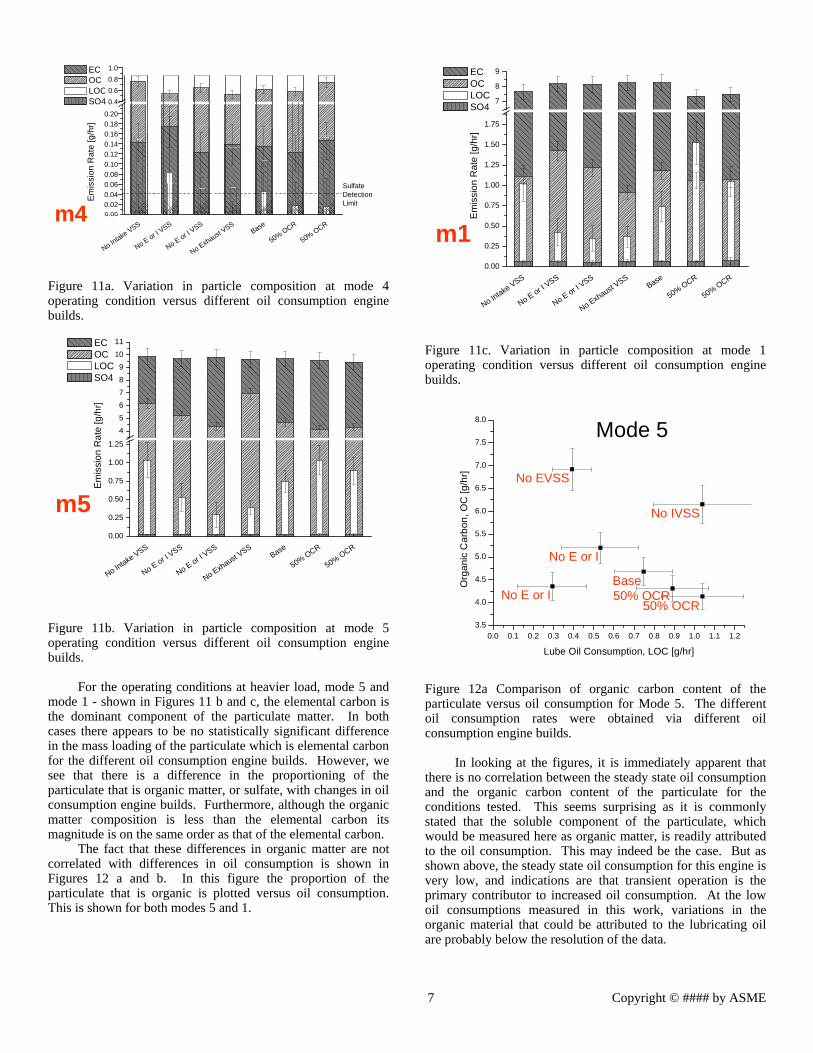
The fact that these differences in organic matter are not correlated with differences in oil consumption is shown in Figures 12 a and b. In this figure the proportion of the particulate that is organic is plotted versus oil consumption. This is shown for both modes 5 and 1.
No Intake VSS
No E or I VSS
No E or I VSS
No Exhaust VSS
Base
50% OCR
50% OCR
0.00
0.25
0.50
0.75
1.00
1.25
1.50
1.75
7
8
9
EC OC LOC SO4
Figure 11c. Variation in particle composition at mode 1 operating condition versus different oil consumption engine builds. Figure 12a Comparison of organic carbon content of the particulate versus oil consumption for Mode 5. The different oil consumption rates were obtained via different oil consumption engine builds.
In looking at the figures, it is immediately apparent that there is no correlation between the steady state oil consumption and the organic carbon content of the particulate for the conditions tested. This seems surprising as it is commonly stated that the soluble component of the particulate, which would be measured here as organic matter, is readily attributed to the oil consumption. This may indeed be the case. But as shown above, the steady state oil consumption for this engine is very low, and indications are that transient operation is the primary contributor to increased oil consumption. At the low oil consumptions measured in this work, variations in the organic material that could be attributed to the lubricating oil are probably below the resolution of the data.
Em
issi
on R
ate
[g/h
r]
EC OC LOC SO4
No Intake VSS
No E or I VSS
No E or I VSS
No Exhaust VSS
Base
50% OCR
50% OCR
0.00
mis
sion
Rat
e [g
/hr]
m4
No Intake VSS
No E or I VSS
No E or I VSS
No Exhaust VSS
Base
50% OCR
50% OCR
0.00
0.25
0.50
0.75
1.00
1.25
456789
1011
EC OC LOC SO4
Em
issi
on R
ate
[g/h
r]
m5 E
m1
0.0 0.1 0.2 0.3 0.4 0.5 0.6 0.7 0.8 0.9 1.0 1.1 1.23.5
4.0
4.5
5.0
5.5
6.0
6.5
7.0
7.5
8.0
Org
anic
Car
bon,
OC
[g/h
r]
Lube Oil Consumption, LOC [g/hr]
No E or I
No EVSS
No E or I
Base
No IVSS
50% OCR50% OCR
Mode 5
0.0 0.1 0.2 0.3 0.4 0.5 0.6 0.7 0.8 0.9 1.0 1.1 1.23.5
4.0
4.5
5.0
5.5
6.0
6.5
7.0
7.5
8.0
Org
anic
Car
bon,
OC
[g/h
r]
Lube Oil Consumption, LOC [g/hr]
No E or I
No EVSS
No E or I
Base
No IVSS
50% OCR50% OCR
0.0 0.1 0.2 0.3 0.4 0.5 0.6 0.7 0.8 0.9 1.0 1.1 1.23.5
4.0
4.5
5.0
5.5
6.0
6.5
7.0
7.5
8.0
Org
anic
Car
bon,
OC
[g/h
r]
Lube Oil Consumption, LOC [g/hr]
No E or I
No EVSS
No E or I
Base
No IVSS
50% OCR50% OCR
Mode 5
7 Copyright © #### by ASME
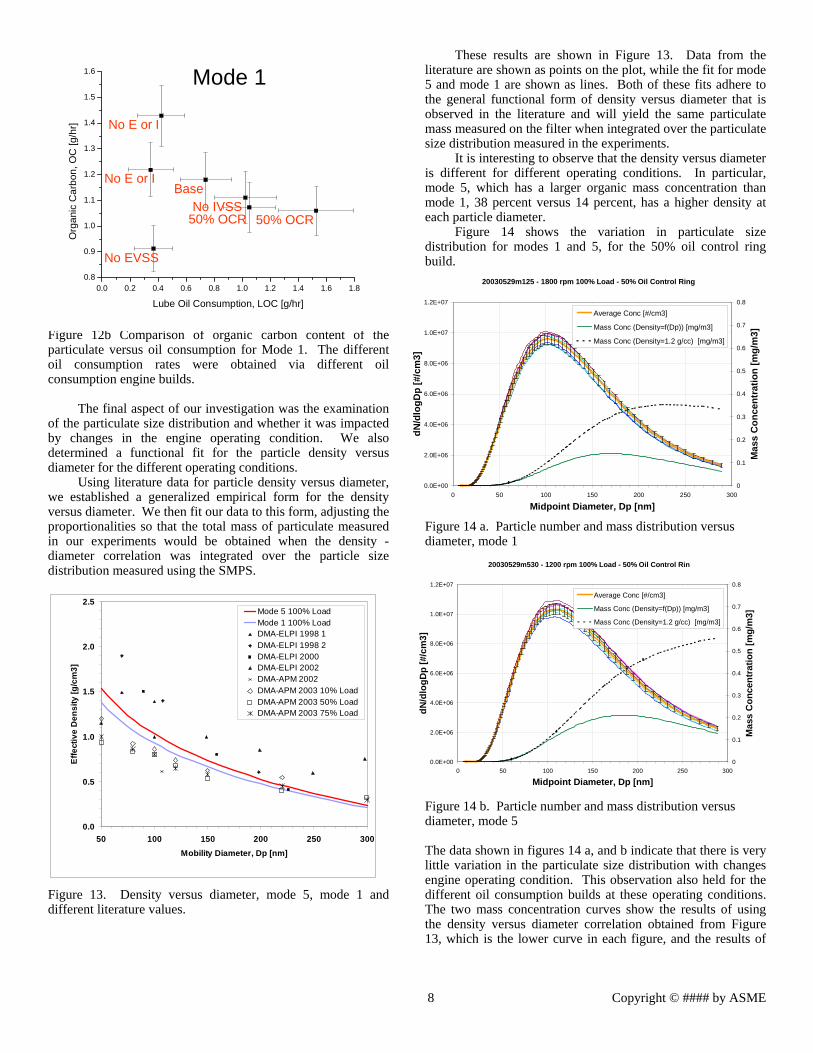
Figure 12b Comparison of organic carbon content of the particulate versus oil consumption for Mode 1. The different oil consumption rates were obtained via different oil consumption engine builds.
The final aspect of our investigation was the examination
of the particulate size distribution and whether it was impacted by changes in the engine operating condition. We also determined a functional fit for the particle density versus diameter for the different operating conditions.
Using literature data for particle density versus diameter, we established a generalized empirical form for the density versus diameter. We then fit our data to this form, adjusting the proportionalities so that the total mass of particulate measured in our experiments would be obtained when the density - diameter correlation was integrated over the particle size distribution measured using the SMPS.
Figure 13. Density versus diameter, mode 5, mode 1 and different literature values.
These results are shown in Figure 13. Data from the literature are shown as points on the plot, while the fit for mode 5 and mode 1 are shown as lines. Both of these fits adhere to the general functional form of density versus diameter that is observed in the literature and will yield the same particulate mass measured on the filter when integrated over the particulate size distribution measured in the experiments.
0.0 0.2 0.4 0.6 0.8 1.0 1.2 1.4 1.6 1.80.8
0.9
1.0
1.1
1.2
1.3
1.4
1.5
1.6O
rgan
ic C
arbo
n, O
C [g
/hr]
Lube Oil Consumption, LOC [g/hr]
No EVSS
No IVSS
No E or I
No E or IBase
50% OCR 50% OCR
Mode 1
0.0 0.2 0.4 0.6 0.8 1.0 1.2 1.4 1.6 1.80.8
0.9
1.0
1.1
1.2
1.3
1.4
1.5
1.6O
rgan
ic C
arbo
n, O
C [g
/hr]
Lube Oil Consumption, LOC [g/hr]
No EVSS
No IVSS
No E or I
No E or IBase
50% OCR 50% OCR
0.0 0.2 0.4 0.6 0.8 1.0 1.2 1.4 1.6 1.80.8
0.9
1.0
1.1
1.2
1.3
1.4
1.5
1.6O
rgan
ic C
arbo
n, O
C [g
/hr]
Lube Oil Consumption, LOC [g/hr]
No EVSS
No IVSS
No E or I
No E or IBase
50% OCR 50% OCR
Mode 1
It is interesting to observe that the density versus diameter is different for different operating conditions. In particular, mode 5, which has a larger organic mass concentration than mode 1, 38 percent versus 14 percent, has a higher density at each particle diameter.
Figure 14 shows the variation in particulate size distribution for modes 1 and 5, for the 50% oil control ring build.
20030529m125 - 1800 rpm 100% Load - 50% Oil Control Ring
0.0E+00
2.0E+06
4.0E+06
6.0E+06
8.0E+06
1.0E+07
1.2E+07
0 50 100 150 200 250 300
Midpoint Diameter, Dp [nm]
dN/d
logD
p [#
/cm
3]
0
0.1
0.2
0.3
0.4
0.5
0.6
0.7
0.8
Mas
s C
once
ntra
tion
[mg/
m3]
Average Conc [#/cm3]
Mass Conc (Density=f(Dp)) [mg/m3]
Mass Conc (Density=1.2 g/cc) [mg/m3]
Figure 14 a. Particle number and mass distribution versus diameter, mode 1 20030529m530 - 1200 rpm 100% Load - 50% Oil Control Rin
Figure 14 b. Particle number and mass distribution versus diameter, mode 5 The data shown in figures 14 a, and b indicate that there is very little variation in the particulate size distribution with changes engine operating condition. This observation also held for the different oil consumption builds at these operating conditions. The two mass concentration curves show the results of using the density versus diameter correlation obtained from Figure 13, which is the lower curve in each figure, and the results of
0.0
0.5
1.0
1.5
2.0
2.5
50 100 150 200 250 300Mobility Diameter, Dp [nm]
Effe
ctiv
e D
ensi
ty [g
/cm
3]
Mode 5 100% LoadMode 1 100% LoadDMA-ELPI 1998 1DMA-ELPI 1998 2DMA-ELPI 2000DMA-ELPI 2002DMA-APM 2002DMA-APM 2003 10% LoadDMA-APM 2003 50% LoadDMA-APM 2003 75% Load
0.0E+00
0E+06
4.0E+06
6.0E+06
8.0E+06
0E+07
2E+07
0 50 100 150 200 250 300
Midpoint Diameter, Dp [nm]
dN/d
logD
p [#
/cm
3]
0
0.1
0.2
0.3
0.4
0.5
0.6
0.7
0.8
Mas
s C
once
ntra
tion
[mg/
m3]
2.
1.
1.
Average Conc [#/cm3]
Mass Conc (Density=f(Dp)) [mg/m3]
Mass Conc (Density=1.2 g/cc) [mg/m3]
8 Copyright © #### by ASME
assuming a constant density regardless of particle diameter, which is shown in the upper curve. It is easily seen that the calculation of particulate mass from size distribution would be in error if a constant density were used.
CONCLUSIONS
As a result of this research effort we reached the following conclusions.
1. Lube oil consumption for steady state operation has insignificant effect on diesel particulate matter
2. It appears that transient operation is responsible for the
majority of the lubricating oil consumption.
3. Under steady state operation, lubricating oil makes only a small contribution to the organic matter in the particulate
4. Effective density calculations provide insight into the
importance of the engine operating conditions and the relative composition of the particulate matter on the density versus diameter relationship, and ultimately on the mass loading.
5. There was no apparent change in particulate size
distribution with the small changes in lubricating oil consumption measured in this research.
ACKNOWLEDGMENTS
The authors would like to acknowledge the financial and technical support of the Army Research Office, Nippon Mitsubishi Oil, Yanmar Company, Cummins Engine Company, BP Amoco and Lubrizol, for their contributions to this research effort.
REFERENCES 1. John H. Johnson, Susan T. Bagley, et. al., ”A Review of
Diesel Particulate Control Technology and Emissions Effects 1992 Horning Memorial Award Lecture”, SAE paper No.940233
2. Kent Froelund, Ed C. Owens, et al., “Impact of Lubricant Oil on Regulated Emissions of a Light-Duty Mercedes-Benz OM611 CIDI-Engine”, SAE paper No.2001-01-1901
3. Brent K. Bailey, Susumu Ariga, “On-Line Diesel Engine Oil Consumption Measurement”, SAE paper No.902113
4. Hildemann, L.M., Cass, G.R., Markowski, G.R., “A Dilution Stack Sampler for Collection of Organic Aerosol Emissions: Design, Characterization and Field Tests”, Aerosol Science and Technology Vol. 10, pp. 193-204, 1989.
5. Schauer, J.J., Kleeman, M.J., Cass, G.R., and Simoneit, B.R.T., “Measurement of Emissions from Air Pollution
Sources. 1. C1 through C29 Organic Compounds from Meat Charbroiling”, Environmental Science and Technology, Vol. 33, No 10, pp. 1566-1577, 1999.
6. Schauer, J.J., Kleeman, M.J., Cass, G.R., and Simoneit, B.R.T., “Measurement of Emissions from Air Pollution Sources. 2. C1 through C30 Organic Compounds from Medium Duty Diesel Trucks”, Environmental Science and Technology, Vol. 33, No 10, pp. 1578-1587, 1999.
7. Kleeman, M.J., Schauer, J.J., and Cass, G.R., “Size and Composition of Fine Particulate Matter Emitted from Motor Vehicles”, Environmental Science and Technology, Vol. 34, No 7, pp. 1132-1142, 2000.
8. Private Communication with Schauer, J.J., 1999 9. Andrews, G. E., Elamir, I. E., Abdelhalim, S., Ahamed, F.
M., and Shen, Y., "The Measurement of Lubricating Oil Combustion Efficiency Using Diesel Particulate Analysis", SAE Technical Paper 980523, 1998.
10. Okada, S., Kweon, C., Stetter, J. C., Foster, D. E., Shafer, M. M., Christensen, C. G., Schauer, J. J., Schmidt, A. M., Silverberg, A. M., and Gross, D. S., "Measurement of Trace Metal Composition in Diesel Engine Particulate and its Potential for Determining Oil Consumption", SAE Technical Paper 2003-01-0076, 2003.
APPENDIX
Table A1. Test fuel properties Unitskg/m3 830.5mm2/s 2.43
38.8Distillation IBP oC 177.8
50% oC 259.490% oC 324.4EPT oC 356.1
oC 6552.9
kJ/kg 45644ppm 14
SFC Aromatics wt% 22.1Mono-Aromatics wt% 19.4
PNA's wt% 2.71.889
Selected Trace Metals Magnesium (Mg) ppm < 0.1Calcium (Ca) ppm < 0.1
Manganese (Mn) ppm < 0.1Iron (Fe) ppm < 0.1Lead (Pb) ppm < 0.1
H / C
Flash pointCetane number
Gross Heating ValueSulfur
API Gravity (16/16oC)Viscosity (@40oC)Density (@15oC)
Property
9 Copyright © #### by ASME

![Estimation of Particulate Matter from Smoke, Oil ......... Gas turbine experiments [8] ... valve stem seals and cylinder system [9]. ... Lub oil - 0.2% of fuel, S=10,0000ppm Lub oil](https://static.fdocuments.us/doc/165x107/5acddfcc7f8b9a27628e258f/estimation-of-particulate-matter-from-smoke-oil-gas-turbine-experiments.jpg)