The impact of land management on drinking water …€¢ Modelling: What has caused ... of...
31
The impact of land management on drinking water quality: A water industry application, East of England Presented by Jenny Sandberg, Catchment Modeller, Anglian Water Services Co-author: Frances Elwell, Water Quality Scientist, Mott MacDonald 2011 International SWAT Conference, Toledo, Spain
Transcript of The impact of land management on drinking water …€¢ Modelling: What has caused ... of...

The impact of land management on drinking water
quality: A water industry application, East of England
Presented by
Jenny Sandberg, Catchment Modeller, Anglian Water Services
Co-author: Frances Elwell, Water Quality Scientist, Mott MacDonald
2011 International SWAT Conference, Toledo, Spain

Content
• Background
• The Study Area
– Catchment characteristics
– Data availability and data processing
• Results
– Calibration and Validation
– Land use scenarios
• Conclusion/Discussion
• Time for questions

3
Background
• The UK Water industry
• Anglian Water
• Anglian Water’s Catchment Management Programme

The UK Water Industry
• In England and Wales water companies
are privately owned
• The water industry is highly regulated:
• Economic: the Water Services Regulation
Authority (OFWAT) and Consumer Council for
Water (CCwater)
• Environmental: the Environment Agency
• Drinking Water Quality: the Drinking Water
Inspectorate (DWI).
• The water industry operates on five-
yearly asset management cycles.
• Prices are set by Ofwat at the beginning
of each period, following submissions
from each company about what it will cost
to deliver their business plans.
4

Anglian Water
• Water and wastewater company
supplying water and wastewater
services to more than 6 million
domestic and business
customers in the East of
England and Hartlepool.
• ~1,300 Ml/d* raw water
abstractions
• 50:50 groundwater and surface
water
5
* Ml/d = Mega-litre per day, one thousand cubic metres (TCM), or one million litres

Catchment Management Programme - Is catchment management a cost-effective alternative to traditional treatment
solutions?
• Stakeholder Liaison:
Gain understanding of stakeholders’ role, working relationships, influences and
interests
Raise awareness
Build up knowledge of the catchments
• Modelling:
What has caused the pollution problem?
What land use management practices to promote and where?
What impacts on raw water quality would different practices have?
How soon would the impacts be seen?
Can we do without raw water treatment?
6

Higher Priority Risk
• Surface Water:
• 13 water treatment works (25 catchments)
• Mainly metaldehyde
• Modelling tool: The SWAT model
• Groundwater:
• 7 water treatment works (15 catchments)
• Mainly nitrate
• Modelling tool: Wave/Modflow/MT3D
7
Drinking Water Standards: • Nitrate: 50 mg/l
• Individual Pesticides: 0.10 µg/l
• Total Pesticides: 0.50 µg/l

Timeline – Higher Priority Risk
Scoping phase:
To evaluate and identify modelling options
Pilot Phase: Development of modelling approaches for
pesticide and nitrate transport simulations
Roll-out Phase:
The selected modelling approaches to be applied to the remaining catchments
8
Summer 2010 September 2010 –
May 2011
July 2011 – mid 2013
9
Surface Water Pilot study
- The Study Area
• Catchment characteristics
• Data Availability

The Study Area - Two SWAT models were built
• A raw water storage reservoir fed by
two catchments:
• The direct catchment to the reservoir (50
Km2)
• A larger pumped catchment (320 Km2)
from which water is being pumped from
the River Nene
• Metaldehyde has been detected at
levels exceeding the drinking water
standard of 0.1µg/l.
10
Two SWAT models were built; one
for the pumped and one for the
direct catchment.

Data Availability
11
Data Type Description Data Source
Topography Topographic map. Topographical data from UK Ordnance Survey
Land use Land use information was obtained from a
number of sources of various spatial resolution
and level of detail on land use categories.
The European Environment Agency (EEA,
2004), Edina Agcensus data set (The University
of Edinburgh, 2004), land use mapping from UK
Ordnance Survey (OS, 2011).
Soil An ArcGIS map layer (1:250 000) outlining the
dominant soil types (soil series) in the region,
and a number of non-spatial datasets which
describe the characteristics of the soil types.
National Soil Resources Institute (NSRI), 2010
Weather Precipitation, wind speed, solar radiation,
relative humidity, temperature.
A local weather station, the UK Met Office and
the European Commission Joint Research
Centre
Reservoir Historical water level data, abstraction and
operational details.
AWS
River/stream hydrology Gauging Stations and spot measurements. The Environment Agency, AWS
Pesticide Management Monthly pesticide application by region. The UK Food and Environment Research
Agency (FERA)
Water Quality Pesticide concentrations in raw water (streams,
river and reservoir).
AWS, the UK Environment Agency

Catchment characteristics
- Land Use
• Dominated by cereal production,
where winter wheat and winter
oilseed rape are the main crops.
• Hence, metaldehyde is commonly
used in the autumn to protect crops
against slugs.
12

13

Catchment characteristics
- Soil Type
Heavy Clay soils/loamy soils
14
Denchworth: Clay (clay 57%, silt 35%, sand 8%)
Hanslope: Clay/clay loam (42% clay, 37% silt, 21%
sand)
Banbury: Loam (Clay 23%, silt 28%, sand 49%)
Soil Texture

SWAT user soil database
• Based on national soil maps (NSRI,
2010) and associated datasets describing
physical and hydrological properties of
the dominant soil types.
• The hydrological soil group and maximum
crack volume was estimated based on
the shrink-swell potential of each soil.
15
Shrink-swell
Potential*
Hydrological Soil
Group
Crack volume
Very Low A 0
Low B 0
Moderate C 0.1
High - very high D 0.25
*NSRI, 2010

Drainage system
16 *Boorman et al., 1995
• The location and design of drainage
systems were estimated based on soil
hydrology, soil texture (clay content) and
land use.
• Low permeability soils were identified
based on the Hydrology of Soil Types*
(HOST) classification system.
Spatial distribution and drainage design estimated based
on soil type and land use.
Hydrology of Soil Types (HOST)* is a
categorisation of the British soils based
on their soil hydrology.

17
Results

Model Calibration and Validation - The hydrological model
The pumped catchment
• Gauged flows
18

Model Calibration and Validation - The hydrological model
The direct catchment
• Reservoir volumes
19

Model Calibration and Validation - The water quality model
The pumped catchment
• River abstraction point
20

Model Calibration and Validation - The water quality model
The direct catchment
• Metaldehyde concentrations in the reservoir
21

22
Land Use Scenarios

Initial Scenario Runs
• Filter strips
• Baseline: 3 m
• Scenario 1: 0 m – the peak concentrations
almost doubled.
• Scenario 2: 6 m – reduction of
approximately 1/3 of the peak in-stream
concentrations.
• Excluding metaldehyde application in
over half of the area under wheat
production
• 40 % reduction in peak metaldehyde
levels at the river abstraction point
23

24
Concluding Remarks

Conclusions
• Overall the SWAT model has proved to perform well in the two catchments and will be a
useful tool for our future work.
• For the reservoir, the model slightly underestimates metaldehyde concentrations and is not
able to replicate peaks. Two potential explanations were identified:
• Local source in the catchment close to the reservoir abstraction point; and
• Pesticide accumulation.
To assess this we would need to run the scenarios using a 2D reservoir model to take into
account spatial variability within the reservoir.
• Due to the importance of accurately predicting surface runoff and infiltration when assessing
the impacts of land management measures (particularly filter strips) on water quality, it is
recommended that, in the future, detailed sensitivity runs of parameters controlling bypass
flow and drain flow, are carried out.
• In this pilot study, the feature of dual hydrological soil groups was not applied. This resulted
in the need for significantly reducing the curve number (CN) in the calibration process. In
the future, it is recommended that the hydrological soil groups are reviewed for the two
catchments and dual hydrological soil groups are applied where applicable.
25

26
Any Questions?

27
Acknowledgements
The authors would like to thank the following people who have
contributed to the work of this project at various stages:
Anna Chivers, Mike Cook, Jane Dottridge, Peter Ede, Simon
Eyre, Louisa Peaver, and Gerry Spraggs.
The views expressed in this presentation are those of the authors only.

28
References
• Boorman, D.B., Hollis, J.M and Lilly, A. 1995. Hydrology of soil types: a hydrologically-based classification of the soils of
the United Kingdom. Institute of Hydrology Report No.126. Institute of Hydrology, Wallingford.
• European Environment Agency (EEA). 2010. Corine Land Cover 2000 (CLC 2000) Map. Available at:
http://www.eea.europa.eu/data-and-maps/data/corine-land-cover-2000-raster. Accessed 15.05.2011.
• National Soil Resources Institute (NSRI). 2010. Land Information System (LandIS) Digital soil dataset.
• Neitsch, S.L., Arnold, J.G., Kiniry, J.R., and Williams, J.R. 2005. Soil and Water Assessment Tool. Theoretical
Documentation. Grassland, Soil and Water Research Laboratory, Agricultural Research Service, Temple, Texas.
• Novák, V. 1999. Soil-Crack Characteristics—Estimation Methods Applied to Heavy Soils in the NOPEX Area. Agricultural
and Forest Meteorology. 98: 501-507.
• Olsen, P.A., and Haugen, L.E. 1998. A new model to of the shrinkage characteristics applied to some Norwegian soils.
Geoderma. 83(1-2):67-81.
• The UK Ordnance Survey (OS). 2011. UK Ordnance Survey VectorMap District. Available at:
http://www.ordnancesurvey.co.uk/oswebsite/products/os-vectormap-district/index.html. Accessed 16.05.2011.
• The University of Edinburgh. 2004. Edina Agcensus for 2004. Available at: http://edina.ac.uk/agcensus/. Accessed on
16.05.11.

29
Parameter Description Calibration
CH_N Manning’s ―n‖ (roughness coefficient) in channel Set to 0.08
OV_N Manning’s ―n‖ for overland flow Set to 0.5
CN Curve number – controls the amount of rainfall
runoff
Initial values were selected based on the SWAT
user guide. These were reduced to 70% of initial
estimates.
CH_L Channel length – estimated by SWAT based on
topography but details of meandering can be lost
due to resolution
Increase by 20% to account for meandering.
GWLAG Groundwater lag – controls response time of
baseflow to rainfall
Set to 150 days
CNCOEFF Plant ET curve number coefficient – allows the
model to adjust the curve number based on the
plant evapotranspiration
Set to 2
ESCO Soil evaporation compensation factor Default value reduced to 0.7 to account for some
cracking.
FFCB Initial soil water storage Set to 0.8 for the pumped catchment and 1.0 for
the direct reservoir catchment.
Primary SWAT model hydrological parameters adjusted during calibration

30
Primary SWAT model pesticide parameters adjusted during calibration
Parameter Description Calibration
AP_EF Application efficiency, i.e. fraction of pesticide
applied that is deposited on soil or foliage.
0.5
FILTERW Width of filter strips at edge of fields 3 m
CHPST_REA Reaction rate of pesticides in stream, calculated
from information on half-life in water.
0.07
HLIFE_S Half-life in soil 10
HLIFE_F Half-life on foliage 5
SKOC Soil adsorption coefficient 120
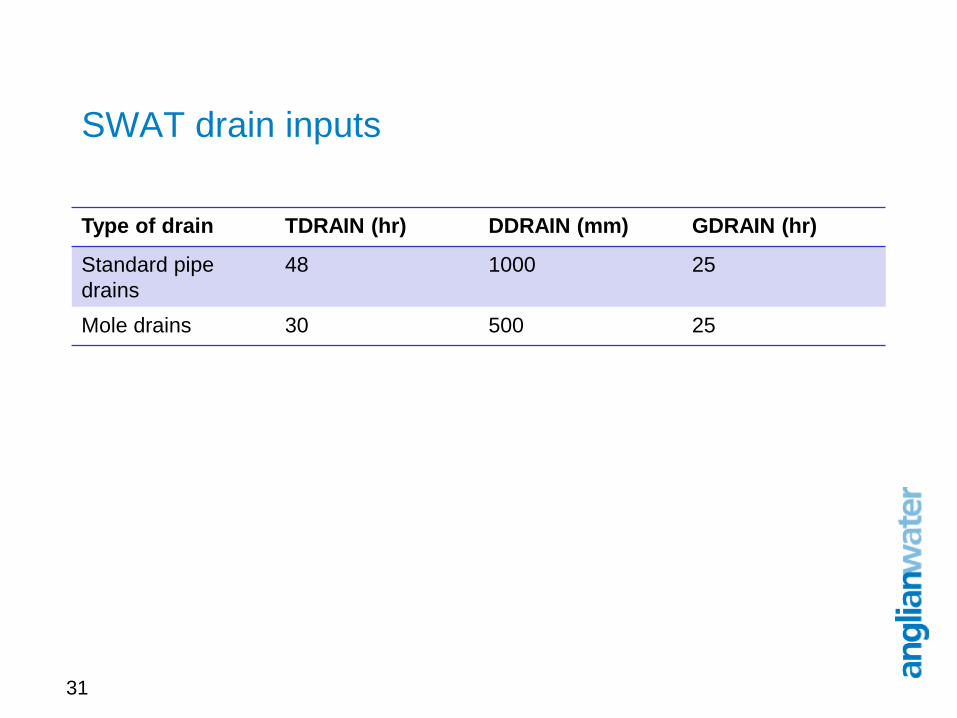
SWAT drain inputs
Type of drain TDRAIN (hr) DDRAIN (mm) GDRAIN (hr)
Standard pipe
drains
48 1000 25
Mole drains 30 500 25
31