The Impact of Immigration on the Educational Attainment … · THE IMPACT OF IMMIGRATION ON THE...
57
NBER WORKING PAPER SERIES THE IMPACT OF IMMIGRATION ON THE EDUCATIONAL ATTAINMENT OF NATIVES Jennifer Hunt Working Paper 18047 http://www.nber.org/papers/w18047 NATIONAL BUREAU OF ECONOMIC RESEARCH 1050 Massachusetts Avenue Cambridge, MA 02138 May 2012 I thank, without implicating, Leah Brooks, David Figlio, Tommaso Frattini, James Heckman, John Eric Humphries, Ethan Lewis, Marguerite Lukes, James MacKinnon, Daniel Parent, Steve Pischke and participants in numerous seminars for comments and data advice. I am grateful to the Social Science and Humanities Research Council of Canada for financial support. I am also affiliated with the CEPR (London) and DIW (Berlin). The views expressed herein are those of the author and do not necessarily reflect the views of the National Bureau of Economic Research. NBER working papers are circulated for discussion and comment purposes. They have not been peer- reviewed or been subject to the review by the NBER Board of Directors that accompanies official NBER publications. © 2012 by Jennifer Hunt. All rights reserved. Short sections of text, not to exceed two paragraphs, may be quoted without explicit permission provided that full credit, including © notice, is given to the source.
-
Upload
hoangnguyet -
Category
Documents
-
view
218 -
download
1
Transcript of The Impact of Immigration on the Educational Attainment … · THE IMPACT OF IMMIGRATION ON THE...
NBER WORKING PAPER SERIES
THE IMPACT OF IMMIGRATION ON THE EDUCATIONAL ATTAINMENT OFNATIVES
Jennifer Hunt
Working Paper 18047http://www.nber.org/papers/w18047
NATIONAL BUREAU OF ECONOMIC RESEARCH1050 Massachusetts Avenue
Cambridge, MA 02138May 2012
I thank, without implicating, Leah Brooks, David Figlio, Tommaso Frattini, James Heckman, JohnEric Humphries, Ethan Lewis, Marguerite Lukes, James MacKinnon, Daniel Parent, Steve Pischkeand participants in numerous seminars for comments and data advice. I am grateful to the Social Scienceand Humanities Research Council of Canada for financial support. I am also affiliated with the CEPR(London) and DIW (Berlin). The views expressed herein are those of the author and do not necessarilyreflect the views of the National Bureau of Economic Research.
NBER working papers are circulated for discussion and comment purposes. They have not been peer-reviewed or been subject to the review by the NBER Board of Directors that accompanies officialNBER publications.
© 2012 by Jennifer Hunt. All rights reserved. Short sections of text, not to exceed two paragraphs,may be quoted without explicit permission provided that full credit, including © notice, is given tothe source.
The Impact of Immigration on the Educational Attainment of NativesJennifer HuntNBER Working Paper No. 18047May 2012JEL No. J15
ABSTRACT
Using a state panel based on census data from 1940-2010, I examine the impact of immigration onthe high school completion of natives in the United States. Immigrant children could compete for schoolingresources with native children, lowering the return to native education and discouraging native highschool completion. Conversely, native children might be encouraged to complete high school in orderto avoid competing with immigrant high-school dropouts in the labor market. I find evidence thatboth channels are operative and that the net effect is positive, particularly for native-born blacks, thoughnot for native-born Hispanics. An increase of one percentage point in the share of immigrants in thepopulation aged 11-64 increases the probability that natives aged 11-17 eventually complete 12 yearsof schooling by 0.3 percentage points, and increases the probability for native-born blacks by 0.4 percentagepoints. I account for the endogeneity of immigrant flows by using instruments based on 1940 settlementpatterns.
Jennifer HuntDepartment of EconomicsRutgers UniversityNew Jersey Hall75 Hamilton StreetNew BrunswickNJ, 08901-1248and [email protected]

The extent to which the children of low–education or low–income parents are able
to achieve their full potential in the United States is a cause for concern. Contrary to
popular mythology, there is less intergenerational mobility in earnings and education in
the United States than in continental Europe and Canada, and no more than in the United
Kingdom.1 An important step upward for many children from low socio–economic status
families is graduation from high school, yet U.S. high school graduation rates are no
longer increasing.2 In this paper, I contribute to our understanding of the determinants
of high school educational attainment by investigating the role of immigration. Increasing
immigration in recent decades has led to popular concern that immigration is reducing
the quality of K–12 education. If this concern is well founded, rising immigration could
reduce native high school graduation rates. Conversely, immigration–induced changes in
labor market incentives for educational attainment could have the opposite effect. I seek
evidence for these two channels and assess their net effect.
Immigrants and the young children of immigrants generally have a more limited com-
mand of English than natives. If immigrants and natives are taught in the same classes,
teachers of some subjects may slow the pace of instruction to accommodate non–native
speakers. If immigrant students have had worse quality prior education, or have less ed-
ucation than their native classmates, teachers may lower expectations for all students.
Immigrant students could also divert financial resources from native students, potentially
lowering the quality of their education. For example, Fix and Zimmerman (1993) find
that federal Chapter I spending per economically disadvantaged student fell due to the
immigration–induced expansion in the number of eligible children. If immigrants are
taught separately from natives, resources might also be diverted from natives. For ex-
ample, federal Title III money for Limited English Proficient education may come at the
expense of other federal funding. A lower educational quality for natives will reduce their
earnings capacity at a given number of years of education, and this lower return to edu-
cation in turn may induce natives to complete fewer years of high school. This prediction
1 Checchi, Ichino and Rustichini (1999); Corak (2006).2 Heckman and LaFontaine (2010).
1

is not unambiguous, however. If high school becomes easier, the fall in marginal cost may
outweigh the fall in the marginal benefit and lead to higher native completion rates. Fur-
thermore, if immigrant students are better educated or harder working than their native
classmates, they will provide positive peer effects and may relax the resource constraint,
and could increase native completion rates.
There exists a second channel through which immigration could influence natives’ high
school educational attainment (Betts 1998). Incentives to complete high school are influ-
enced by the wage structure, which is in turn affected by the entry of immigrant workers.
Immigration will affect wage inequality among natives if the distribution of immigrant
skill differs from that of natives. Compared to natives, immigrants to the United States
are very disproportionately poorly educated and somewhat disproportionately highly ed-
ucated. Immigrants are underrepresented among workers with an intermediate level of
education, such as a high school diploma. The effect of immigrants entering the labor
market should therefore be to increase wage inequality in the lower half of the native
distribution, particularly the wage gap between high school dropouts and high school
graduates. Empirical studies confirm this.3 The net effect of the changes in the wage
structure is likely to be to increase the return to completing high school, and hence native
completion rates.4 Native–born youth are likely to be well informed about the dropout
labor market even while still high school students, since this is the market in which many
seek part–time jobs.5
Any negative effects on the schooling quality of natives will affect the children of low
socio–economic status (SES) parents more than children of high SES parents. Families,
whether immigrant or native, tend to locate near other families of similar SES, and the
immigrants encountered by poorer native children in their local public school are more
3 Borjas and Katz (2007), Ottaviano and Peri (2012). Card (2009) views the induced increase in wageinequality as small, which he attributes to high school dropouts and high school graduates being perfectsubstitutes.
4 If high school dropout workers and workers with less than college are perfect substitutes, it is thereturn to college which will rise, which will also increase high school completion rates.
5 Smith (2012) presents evidence that adult immigrants with high school or less reduce the employ-ment rate of native high school students. This reduction could could provide an additional channel forimmigration to affect native graduation rates.
2

likely to have inadequate previous education than the immigrant classmates of richer
natives. Richer parents may more easily move their child to a learning environment
with either fewer immigrants or immigrants with better language skills and educational
background, by using private schools (Betts and Fairlie 2003; see also Hoxby 1998) or by
moving to a different school district (Cascio and Lewis forthcoming). Furthermore, the
educational quality of a child’s school is likely to have a smaller impact on the children
of high SES parents, as such parents can compensate in part for a school’s deficiencies
by providing the child with instruction at home. At the same time, any positive effects
of immigration on high–school graduation rates are likely to be larger for groups with
graduation rates that leave substantial room for improvement. Thus, effects through both
channels are more likely to affect low SES natives, and consequently to affect minorities
more than non–Hispanic whites. Furthermore, native minorities live in closer proximity
to immigrants than native non–Hispanic whites, as I show below, increasing their likely
responsiveness to immigration. Minority boys, who have particularly low high–school
graduation rates (Orfield et al. 2004, NCES 2008, Noguera et al. 2011, Noguera 2008),
may be particularly sensitive to immigration.
I focus on the impact of immigration on natives’ completion of 12 years of schooling,
comparing results across ethnicity, race and gender. I use the decennial censuses of 1940–
2000 and the pooled 2008–2010 American Community Surveys (ACS) to construct a state
panel. I extend two closely related papers, Betts (1998) and Betts and Lofstrom (2000),
in several ways. The most important extensions in practice are the distinction between
immigrants of different educational attainment, the measurement of the immigrant inflows
at the time natives were of school age, rather than later, and the use of a dependent
variable consistent over time. The extension to the use of instrumental variables based
on historical immigrant settlement patterns is important in principle but less important
in practice. Some of the analysis in Smith (2012) is also closely related to my paper:
he examines the effects of adult low–skill immigration on natives’ high school enrollment
rates. The estimates are imprecise, however, and for this reason I follow Betts (1998) and
Betts and Lofstrom (2000) in examining completed education among several cohorts of
3
older respondents.6 Several papers have examined the impact of immigrants on native
test scores in Europe and Israel, with mixed results.7
I measure the shares of immigrants in the population when natives are aged 11–17,
and I measure native educational attainment at ages 21–27. Unlike Betts (1998) and
Betts and Lofstrom (2000), who found a detrimental net effect of immigration on native
high school attainment for each native racial and ethnic group, I find the net effect of
immigration to be positive for natives generally, and especially for blacks: an increase
of one percentage point in the share of immigrants in the population aged 11–64 (0.13
standard deviations) increases the probability natives complete 12 years of schooling by
0.3 percentage points, and increases the probability for blacks by 0.4 percentage points. I
estimate a detrimental net effect for native–born Hispanics of -0.2 percentage points that
is statistically insignificant. All effects are rather small compared to the average native
completion rate of 87.8% (81.0% for native blacks; 81.3% for native Hispanics) and given
the average immigrant share of 8.9% (8.1% for blacks; 15.5% for Hispanics). The standard
error on the coefficient for native Hispanics allows moderately sized negative effects to be
ruled out.
The finding that poorly educated natives upgrade their education in response to im-
migration adds to our understanding of why the wages of high school dropouts decline so
little in the face of immigration.8 Peri and Sparber (2009) have previously documented
that unskilled natives exploit their comparative advantage to avoid competition with im-
migrants, by shifting to more communication–intensive occupations. By distinguishing
among immigrants by age and education, I find support for the labor market channel for
education upgrading proposed by Betts (1998): a one percentage point increase in the
6 Jackson (2011) finds that when a greater share of adult immigrants is unskilled, native collegeenrollment rises; the effect on contemporaneous completed high school is mixed. Borjas (2006) finds thatforeign students do not reduce native enrollment in graduate school. Llull (2010) and Eberhard (2012)find in a structural model that natives increase their years of education in response to adult immigrants.Neymotin (2009) finds native SAT scores and probability of applying to top colleges are not negativelyaffected by the school’s share of immigrant test–takers.
7 Brunello and Rocco (2011), Geay et al. (2012), Gould et al. (2009), Jensen and Rasmussen (2011),Ohinata and van Ours (2011).
8 Card (2009) and Ottaviano and Peri (2012) believe the wage declines to be small. Borjas, Groggerand Hanson (2011) disagree.
4
share of immigrants with less than 12 years school in the population aged 18–64 (0.27 stan-
dard deviations) increases the eventual native completion rate by 0.8 percentage points,
with larger effects for native–born minorities. Effects of more educated adult immigrants
are not precisely estimated.
Considering the school channel, I find that immigrants have at most a small negative
effect on natives as a whole. All specifications indicate that child immigrants reduce
native completion rates, with the instrumental variables specification indicating a one
percentage point increase in the share of immigrants in the population aged 11–17 (0.22
standard deviations) reduces the probability natives eventually complete 12 years of school
by 0.2 percentage points. Moderately negative magnitudes can be ruled out, even though
the instrumental variables coefficient is statistically insignificant. Conversely, the more
negative point estimate for native blacks means that moderately negative magnitudes
cannot be ruled out. There is no effect on non–Hispanic white natives. The results for
native Hispanics are more subtle, as the effect of immigrant children depends strongly
on the education of the immigrants’ parents: child immigrants of more educated parents
have moderately–sized positive effects, offsetting moderately–sized negative effects of child
immigrants of poorly educated parents. These effects are present for male Hispanic natives
only.
The evidence that some child immigrants reduce the educational attainment of some
minority natives suggests the need for reform in immigrant education, though the re-
sults are also consistent with a neighborhood rather than a school mechanism. Reform
could include both increased resources for schools in areas with high immigration (Singer
2008) and the implementation of best practices regarding improving language skills of
non–native speakers, remedying educational deficiencies of immigrants, and integrating
immigrants with native students (Garcıa, Kleifgen and Falchi 2008).
5

1 Data and descriptive statistics
The principal data for regression analysis are the IPUMS micro–data samples for the 1940–
2000 decennial censuses and the pooled 2008–2010 American Community Surveys (which
I refer to as the 2010 ACS data), from which I construct a panel of states.9 I supplement
them with data from the Bureau of Economic Analysis on state personal income per
capita. I choose the census and ACS data for the large sample sizes they afford for the
measurement of both state immigrant shares and the shares of native cohorts by race and
ethnicity attaining a given educational level. Even with the large census samples, I am
forced to consider a native cohort as one spanning several birth years. A disadvantage
of the data is that they do not contain information about parental education or income,
except for children living with their parents. I check the sensitivity of the analysis to using
metropolitan areas instead of states (the construction of the metropolitan area sample is
described in the Data Appendix).
In order to have a consistent outcome variable over all years, I define the outcome of
interest as the completion of 12 years of schooling, with or without the obtention of a high
school diploma, as the two may be distinguished only from 1990 onwards.10 I focus on the
native–born who were aged 11–17 in the previous census: this implies current ages 21–27
(20–26 in 2009, 19–25 in 2008). Most covariates are lagged one census, to correspond to
the time when natives were aged 11–17. I construct samples of all races and ethnicities
pooled, blacks, Hispanics and non–Hispanic whites. Being black and Hispanic are not
mutually exclusive, so there is some overlap in the two minority samples. Immigrants are
defined as those born abroad, including those born in U.S. territories. I drop the states
of Alaska and Hawaii, as their absence from the 1940 and 1950 censuses complicates the
use of the instruments and covariates measured in 1940.
Figure 1 depicts the shares of native–born 21–27 year olds who have completed at least
9 Ruggles et al. (2010).10 Betts (1998) uses 12 years of schooling for 1980, and obtention of a high school diploma in 1990.
This discrepancy drives the negative effect he finds of immigration on native Hispanics.
6

12 years of schooling, by race and ethnicity, for 1940–2010.11 The shares increase strongly
over the early decades then level off around 1990. Minorities begin the period with much
lower education, and converge towards non–Hispanic white rates from 1960 until 1980 or
1990. At the start of the period, both blacks and Hispanics (concentrated in different
regions) were educated in segregated, inferior schools. As a result of court decisions in
the 1940s and 1950s, the Civil Rights Act of 1964 and the Coleman Report (Coleman et
al. 1966), educational quality, integration and attainment increased for minorities.12
Heckman and LaFontaine (2010) have cautioned that both the increase in high school
completion observed in the census and the convergence between whites and minorities
mask an increasing share of individuals receiving a General Equivalency Degree (GED).
For the purposes of this paper, it is desirable to know whether any response in native
education is coming through time in regular high school, or the propensity to obtain a
GED. The measurement difficulty is that, unlike in the ACS, is it impossible to identify
GED holders in the census micro–data. In early censuses, when GEDs were uncommon,
no specific instructions concerning GEDs were given to the respondents. In 1980, GED
recipients were instructed to respond they had completed 12 years of high school, while
in 1990 and 2000 they were instructed to respond that they had a high school diploma.
I therefore correct the 12–year completion rates using annual published tables on GEDs
awarded by state and age, and using the Heckman and LaFontaine appendix for method-
ological guidance. However, the GED recipients I am subtracting, while not holders of
regular high school diplomas, do have the possibility of attending college, so the adjusted
measure understates final educational attainment. The adjustment for GEDs becomes
increasingly crude as the data get older, as explained in the Data Appendix, and I do
not attempt to adjust 1970 and earlier years.13 Appendix Table 1 shows the 12–year
completion rates measured in different ways.
Figure 2 shows the evolution of the share of immigrants over the period, by age group.
11 For the purposes of the graph, I use 21–27 for all years including 2008–2010.12 MacDonald and Monkman (2005), Valencia et al. (2002).13 Heckman and LaFontaine report in their appendix that the adjustment for 1970 is small; furthermore,
in 1970 GED holders may not have claimed to have completed 12 years of high school.
7
The share of immigrants in the population of working age, 18–64, traces out a U shape,
falling from 12.1% in 1940 to 6.1% in 1970, before rising to 18.4% in 2010 (top line). The
share of immigrants in the school–age population, 11–17, traces a different path, rising
almost monotonically from 1.6% in 1940 to a still modest 7.2% in 2010 (bottom line).
Figure 3 shows the time paths of three additional key covariates: the shares of the
population aged 18–64 composed of immigrants with less than 12 years of education,
exactly 12 years of education, and more than 12 years of education. The share of the
lowest education immigrants falls from a high of 10.1% in 1940 to a low of 2.8% in 1980,
before rising again to 4.8% in 2010. The shares of the immigrants from the two more
educated groups rise monotonically from 0.7-1.1% in 1940 to 5.4% in 2010 for those with
exactly 12 years of education and 8.1% for those with more than 12 years education.
Appendix Tables 2 and 3 give further means of variables measured at the individual level,
while Appendix Table 4 gives means of variables measured at the state level.
The Census Bureau produces tabulations of their census data at the school district
level. The 1990 tabulations, known as the School District Database (SDDB), may be used
to assess which native children are most likely to interact with immigrants in school.14
The first four columns of Table 1 are based on samples of children of kindergarten, primary
or secondary school age, from which I have discarded the small number of school districts
with no high school. Panel A column 1 shows that the share of immigrants among such
children is 4.2%, but that a native–born child is on average in a school district with only
3.8% immigrants, with corresponding numbers of 2.5% for white non–Hispanic natives,
5.2% for black natives, 10.7% for Hispanic natives, and 14.3% for immigrants.
However, this does not necessarily show that Hispanic natives interact more with
immigrants than non–Hispanic white natives within a given state (the relevant question
given that my subsequent analysis will rely on within–state variation). This pattern could
emerge if Hispanic immigrants and Hispanic natives were concentrated in one region of
the country and white natives in another. I therefore compute the panel A numbers for
each state, calculate differences between groups for each state, and report the population–
14 The data are available at www.nber.org/sddb/, accessed 3 April 2012.
8
weighted average differences across states in panel B. Column 1 shows that while native
blacks and native Hispanics are both more likely than native whites to be in school
districts with many immigrants, black and Hispanic shares are more similar to each other
than panel A indicated. On average (within state), a native black child is in a school
district with 2.7 percentage points more immigrants than a native white child, while a
native Hispanic child is in a school district with 3.6 percentage points more immigrants.
Column 2 panel B shows that the black–Hispanic difference is larger when proximity to
Hispanic immigrants is measured, but columns 3 and 4 show there is no sizeable difference
in the black–Hispanic exposure to white non–Hispanic immigrants or Asian immigrants.
Columns 5 and 6 are based on data on the parents of children of school age. The share of
immigrants among parents is higher than among children, but generally similar patterns
prevail.
These statistics suggest that any effect of child immigration and probably also adult
immigration to a given state will be larger for native blacks and especially Hispanics
than for non–Hispanic whites, as native minorities interact more with immigrants in
their schools and neighborhoods, and probably labor markets. The implication of the
high degree of contact between Hispanic natives and Hispanic immigrants is unclear:
immigrants may have less impact on natives similar to themselves, or they could have
more impact, for example by encouraging native–born Hispanics to speak more Spanish,
possibly at the expense of English, or by straining resources directed at those native–born
Hispanics who have limited English proficiency.
2 Estimation
Rather than analyze native schooling determinants at the individual level, I reduce the
sample size by calculating state schooling variables adjusted for individual characteristics,
and conduct the main analysis on a panel of states. Specifically, for natives aged 21–27
(20–26 in 2009 and 19–25 in 2008) at time t and born in state s, I first run the following
linear probability regression for each of the samples, for 1940–2010:
9

P (Eist ≥ 12) = α0 + α1Fist +a=27∑a=20
γaAaist +
∑s
∑t
λst(δs × νt) + ηist, (1)
where i indexes individuals and s individuals’ birth state, E represents years of completed
schooling, F is a gender dummy, Aa are dummy variables for age, δs are state dummies and
νt are year dummies. I match individuals to their birth state to avoid endogenous moves of
young adults that would plague the use of state of current residence. When I use samples
of all races and ethnicities, I also control for race (Asian, black, race missing) and Hispanic
ethnicity (Mexican, Puerto Rican, Cuban, other, Hispanic ethnicity missing). I control for
black race and Hispanic ethnicity when using Hispanic samples, and for Hispanic ethnicity
when using black samples.15 I experimented with including three dummies for whether
the individual could have left school at age 14/15, 16, or 17 given his or her birth state and
birth year, but their coefficients were never jointly significant, so I report results without
these controls.16
I weight this regression using weights based on the census weights. The census weights
sum to the U.S. population of the census year, while I wish the standard errors to reflect
the variation in sample sizes from year to year. I adjust the census weights so that the
ratios of their sums for each year reflect the ratio of the census sample sizes, resulting in
considerably more weight being put on recent years. The average year in the weighted
data is 1989 for non–Hispanic whites, 1991 for blacks and 1995 for Hispanics.17
In a second step, I use the coefficients λst as the dependent variable in a state panel
analysis:
λst = β0+β1I11−17s,t−10+β2I
E<12s,t−10+β3I
E=12s,t−10+β4I
E>12s,t−10+β5Xs,t−10+β6Ys,1940t+γs+νt+εst. (2)
15 To the degree that controlling for natives’ Hispanic ethnicity implies controlling for the effects ofsecond generation immigrants, the impacts of immigrants estimated below will be those of the firstgeneration only.
16 The coefficients on the school leaving dummies are identified despite the state–year effects, as eachyear has several birth cohorts. The data sources are Acemoglu and Angrist (2000) and the Digest ofEducation Statistics, various issues.
17 The 1940, 1960 and 1970 censuses are 1% samples, the 1980–2000 censuses are 5% samples, the ACShas a more complicated sampling scheme which results in the pooled 2008–2010 sample being smallerthan the 2000 sample. The 1950 census only asked education questions of a subset of the main 1% sample.
10
I weight the regressions with the inverse of the squared standard errors on the λst in the
first step, and cluster the standard errors by state. I11−17s,t−10 represents the share of the
population aged 11–17 that is foreign–born in the previous census, when the native–born
cohort was itself aged 11–17, and is designed to capture natives’ exposure to immigrant
classmates. Ideally, an additional covariate would capture the presence of immigrants
when natives were of elementary school age, but the ten–year spacing of the census pre-
cludes this. The null hypothesis to be tested is that β1 is negative because immigrant
children reduce current school quality. Measurement error, including errors in matching
individuals to the state in which they went to school, may bias the coefficient towards
zero.
IE<12t−10 represents the share of the population aged 18–64 when natives were aged 11–17
that was immigrants with less than 12 years of schooling, and IE=12t−10 and IE>12
t−10 are defined
similarly. The null hypothesis to be tested is that β2 is positive, because the presence
of immigrants with less than 12 years education increases the return to completing 12 or
more years of education. The necessity of using multi–year birth cohorts is likely to bias
β2 towards zero, since the younger members of the age range 11–17 are likely to base their
years of schooling decision on the wage structure, and hence immigration rates, of later
years. The signs of β3 and β4 are ambiguous, as the inflows of more educated immigrants
have opposite effects on the return to exactly 12 years of education versus more than 12
years of education (relative to less than 12 years).
This regression suffers from endogeneity problems, however. Native high school ed-
ucational attainment and high shares of low–education immigrants in a state may be
spuriously negatively correlated. What makes the state economically attractive for im-
migrants, such as the availability of low–skill jobs, may by the same token mean that
natives have a low incentive to complete 12 years of schooling. For example, a downturn
in a state’s low–skill industries could deter unskilled immigrants from moving to the state
and encourage its natives to graduate from high school, leading β2 to be biased down
(the same direction as the measurement error bias, if β2 > 0). Similar reasoning suggests
that β3 and β4 could be biased up by endogeneity. β1 could be biased up if immigrants
11
with children choose states with high educational attainment (the same direction as the
measurement error bias, if β1 < 0), but there may be other biases due to endogeneity in
their parents’ choice of state if these have not been controlled for properly.
These considerations lead me to implement an instrumental variables strategy using
ten–year differences of equation (2):
∆λst = τ0+β1∆I11−17s,t−10+β2∆I
E<12s,t−10+β3∆I
E=12s,t−10+β4∆I
E>12s,t−10+β5∆Xs,t−10+β6Ys,1940+νt+∆εst.
(3)
I estimate this using weights 1/(1/ws,t + 1/ws,t−10), where w is the weight used in equa-
tion (2). I devise instruments for the differenced immigration covariates, based on the
flows of immigrants to a state that would have been expected given the 1940 geographic
distribution of immigrants from different regions and the subsequent national inflows from
those regions.18 To illustrate, if immigrants from Europe prefer the northeastern United
States because it is closer to home and because other Europeans are already there because
of geography, and Mexican immigrants prefer the southern border states for analogous
reasons, the large national increase since 1940 in the share of immigrants that are Mex-
ican will be associated with an increase in immigration to the southern border states
relative to the northeast. The predicted flows captured in the instrumental variable will
therefore be strongly, though not perfectly, correlated with actual immigrant flows to
states. Furthermore, since the national increase in Mexican immigration appears to be
the result of increasingly large birth cohorts entering the Mexican labor market19, and
the national decrease in European immigration is due to Europe’s having become richer,
the decrease in immigration to the Northeast relative to the border states is unrelated to
non–immigration factors affecting native education choices.
I define an instrument for each of the education–specific immigration variables as
follows. For a state s, the predicted change in the number of immigrants of education
18 These instruments are similar to the instrument developed by Card (2001), and also used by Jackson(2011) and Hunt and Gauthier–Loiselle (2010).
19 Hanson and McIntosh (2007).
12
level E (aged 18–64), caused by changing origin regions k, can be written as
∆MEs =
∑k
Msk
Mk
∆MEk =
∑k
µsk∆MEk , (4)
where µsk is state s’s share in 1940 of the national total of immigrants who originate from
region k, and ∆MEk is the national change in the number of immigrants with education
E (aged 18–65) from that region. I use 18 source regions or countries, listed in Appendix
Table 5. Because the variables to be instrumented are percentage point changes, I convert
∆MEs to percentage points by dividing by the population level (aged 18–65) at the start
of the period to which ∆ refers, to define the final instrument as:
ZEs =
∆MEs
POPs
. (5)
I deliberately base the µsk on immigrants of all educations (and ages) to emphasize the
role of geography and taste and minimize the role of economic factors that might dispro-
portionately attract workers of a specific education level. The instrument will be invalid
if non–immigration shocks to high school completion are correlated with 1940 immigrant
densities; for example, if improvements to the California and Texas school systems caused
a national–level increase in Mexican immigration.20 By defining an instrument for each
education level, I assume that improvements to the California and Texas school systems
did not cause a national–level increase in Mexican immigration of any education group.
It is easy to construct instruments for different immigrant age groups, in particular
for ∆I11−17, by replacing the education–specific variables in equations (4) and (5) with
age–specific variables, and I do so. However, the intuition of the instruments extends less
easily to subdivisions by age group, as immigrant numbers in an age group are strongly
influenced by aging as well as immigration, and furthermore, for the 11–17 age group in
particular, it is obvious that changes in their inflows will be closely linked to those of
adult immigrants.
I choose to use a common first stage for all four race/ethnicity samples, weighting
each first stage with the denominator of its dependent variable (the population 11–17 or
20 See Beaudry et al. (2010) for a formal treatment.
13
the population 18–64) in order to improve efficiency. This approach also means the first
stage always includes all states and years: some early state–year cells have no native–born
blacks or Hispanics aged 21–27.
It proves useful to further distinguish among immigrants in equation (2). Immigrant
students could have either positive or negative spillovers on their native classmates, de-
pending upon the quantity and quality of their prior education, their English skills, their
industriousness, and the extent to which their parents contribute to their education.
Parental education is likely to be a proxy for some of these characteristics, and because
most children aged 11–17 live with their parents, we can observe their parents’ education
in the census data. It is therefore possible to split the share of the population 11–17
that is immigrant into immigrants whose parent or parents in the household have less
than 12 years schooling, immigrants with at least one parent with 12 years or more, and
immigrants with neither parent living in the household. The expectation is that children
of more educated parents will make better peers and require fewer resources than children
of less educated parents. The difficulty with regressions distinguishing child immigrants
according to parental characteristics is that the number of endogenous variables becomes
too large for the use of 2SLS.21
Although the natural level at which to examine school quality is the school, there
are some reasons to use more aggregated data beyond the limited availability of school–
level data. If some natives move out of their school and neighborhood when immigrants
move in, analysis at the school or school–district level will not attribute any change in
schooling of the native movers to the arrival of the immigrants. If public school data are
used, even natives who move to private schools in the same school district will cause the
same problem. Also, it is difficult to find an instrument at the school level which accounts
for immigrants’ potentially endogenous choice of location (and school). I base the main
analysis on states, but also repeat the estimates using metropolitan areas (cities). The
21 I have experimented with using the (OLS) state–year return to completing 12 years schooling asthe independent variable of interest, instrumenting it with actual or predicted immigrant flows. Thecoefficient on the return is always very imprecisely estimated, and the first–stage immigrant coefficientsare often wrongly signed.
14

advantages of using cities rather than states are that the analysis is slightly closer to
the ideal school or labor–market level analysis, while still permitting the construction of
instruments, that there are (or may be) enough observations to identify the effects for
more recent years, and that if this is the case, the information on English proficiency
of immigrants may be used. The disadvantages are that the city of birth is not known,
constraining the analysis to be based on city of current residence, and that rural areas
are excluded.
3 Results
I examine the impact of immigration on the probability of natives’ completing 12 years of
schooling, for all native–born, non–Hispanic whites, blacks and Hispanics, first assessing
the net impact of immigration, then decomposing the impact into school quality versus
labor market channels, distinguishing child immigrants by parental education, checking
the robustness of the results to the treatment of GED holders and finally distinguishing
natives by gender.
3.1 The net effect of immigrants ages 11–64
In Table 2, I investigate the impact of the immigrant share of the population aged 11–
64, initially using as the dependent variable the 12–year completion rate adjusted for
age and sex only. With only state and year effects in column 1, or with unemploy-
ment rates and native cohort size (see Card and Lemieux 2001) as additional controls
in column 2, immigration’s coefficient is small and statistically insignificant. Neither
the youth unemployment rate nor the prime–age unemployment rate has a statistically
significant coefficient, possibly because many of the respondents were some years from
graduation when the unemployment rate was measured.22 However, once controls allow-
ing for convergence amongst states, and linear trends for eight BEA regions are included
22 State–level unemployment rates are not available from other sources for earlier decades, so theunemployment rate cannot be matched to the year the respondent was aged 17, for example.
15

in column 3, immigration’s coefficient becomes a statistically significant 0.20. The 1940
share of non–Hispanic whites aged 21–27 who had less than 12 years education is sta-
tistically significantly positive, capturing convergence. The trend in the 1940 share of
workers in agriculture is included to capture convergence for minorities, and its coefficient
is insignificant for the full sample of natives.
Changing the dependent variable to one also adjusted at the individual level for race
and ethnicity in column 4 raises the immigration coefficient from 0.20 to 0.29. This indi-
cates that increases in immigration are positively correlated with increases in native–born
minorities, not surprisingly in the case of Hispanics, and that once this is controlled for
and immigration no longer picks up the under–performance of native minorities, immi-
gration appears a more positive force. In column 5, I take into account that one would
expect richer states to be able to afford better educational systems. However, states with
better educational systems should become richer, so the coefficient on a control for state
income would be biased up. The results show that the correlation between log state per-
sonal income per capita and completion of 12 years of schooling is indeed positive and
statistically significant, and that the coefficient on the immigrant variable, now a lower
bound on the true coefficient, is reduced somewhat from 0.29 to 0.22.
I base the differenced specifications of columns 6 and 7 on the specification of column 4.
Differencing does not change the coefficients greatly (column 6), while the preferred 2SLS
coefficient in column 7 is the largest of all specifications, at a statistically significant 0.34.
The instrument is strong in the first stage, as evidenced by its associated F–statistic of
25. A coefficient of 0.34 implies that a one percentage point increase in the share of immi-
grants in the population 11–64 increases the native probability of eventually completing
12 years of education by 0.34 percentage points. This is a small effect considering that the
(weighted) mean completion rate is 87.8%, and the share of immigrants in the population
8.9% (the implied elasticity is 0.035).
In Table 3, I analyze natives by race and ethnicity, using the same specifications as
Table 1, reporting only the coefficient on the immigrant covariate.23 For reference, I
23 For blacks and Hispanics, there is a large positive coefficient on the share of agricultural workers
16
reproduce the coefficients from the first row of Table 1, for all natives, in the first row of
Table 3. The coefficients for non–Hispanic whites, in the second row, are always smaller
than those for all natives; the preferred 2SLS coefficient in column 7 is 0.21, significant only
at the 10% level. For blacks in the third row, once state–specific trends and convergence
are controlled for in column 3, there is a robust positive coefficient. The preferred 2SLS
coefficient is 0.36 (column 7), small compared to the mean black completion rate of 81.0%
and a black–white completion gap of 8.5 percentage points. For Hispanics, in the fourth
row, an effect of 0.32–0.53 is robust in the least squares columns 3–6, but it disappears
(coefficient of -0.22) with 2SLS in column 7. I conclude that the net effect of immigration
on native completion of 12 years of schooling is positive and small for natives generally,
blacks and non–Hispanic whites, and is possibly negative for Hispanics, though also small,
as moderately sized negative effects can be ruled out.
3.2 Decomposing the impact of immigration into school quality
and labor market channels
I now turn to decomposing the impact of immigration into school quality and labor market
channels. I return in Table 4 to the sample of all natives, presenting the same specifications
as in Tables 2 and 3, except with immigrants split into four categories. The first row
shows that the effect on natives of immigrants aged 11–17, likely to have been natives’
classmates, is negative: the coefficient is in the range -0.29– -0.45 in columns 3–6, but
2SLS (column 7) causes the point estimate to become less negative (-0.18), confounding
my expectation that least squares would be biased towards zero. The 2SLS coefficient is
not statistically significant, however, since the standard error rises considerably to 0.17.
While the instruments are apparently not sufficiently powerful to allow identification of
small effects, it is possible to rule out moderately–sized negative effects. As the system is
exactly identified, 2SLS itself introduces no bias.
in 1940, which captures convergence among states: agricultural states in 1940 had large shares of eitherblacks or Hispanics in the population, who were poorly educated. I do not control for the educationalattainment of blacks and Hispanics in 1940, as they are based on very small samples for many states.White educational attainment in 1940 is statistically insignificant in the regressions for minorities.
17

The first stage information for the instrumenting of this variable is presented in Table 5,
column 2 (in column 1, I present the first stage used for immigrants 11–64 in the tables
above). Although the predicted share of the population 11–17 has a statistically significant
coefficient, it is not much more significant than those of the other excluded instruments,
suggesting that I have not managed successfully to instrument the share of immigrants in
the population 11–17. The F–statistic for the joint significance of the excluded instruments
is only 8, while the more appropriate Angrist and Pischke (2008) F–statistic (an F–statistic
adapted for multiple endogenous variables) is somewhat higher at 15.
The second row of Table 4 shows that the effect on natives’ acquiring 12 years of
schooling of immigrants aged 18–64 with less than 12 years of schooling is positive and
statistically significant in every specification, with a coefficient of 0.81 in the preferred
2SLS in column 7. This is consistent with the hypothesis that the presence of unskilled
immigrants in the labor market alters the wage structure in such a way as to give natives
an incentive to complete 12 years of schooling. A comparison of columns 6 and 7 shows
that using 2SLS does not increase the coefficient greatly, despite the expectation it would
be biased down in least squares. Column 3 of Table 5 shows that the predicted share
of immigrants with less than 12 years’ schooling in the population 18–64 is a strong
predictor in the first stage, much stronger than the other excluded instruments, and the
Angrist–Pischke F–statistic is very high.
The third row of Table 4 shows that the impact of adult immigrants with exactly 12
years of education is imprecisely estimated. In the fourth row, the impact of adult immi-
grants with more than 12 years of education appears positive and significant until 2SLS
is employed, when the coefficient falls to essentially zero (column 7). The instruments
associated with these covariates are fairly strong in their respective first stages (Table 5
columns 4 and 5).
I repeat the exercise of Table 4 for native non–Hispanic whites in Table 6. The least
squares results are qualitatively similar to those for all natives, but the absolute values
of the coefficients are smaller. For this sample, however, 2SLS reduces the point estimate
on child immigrants to essentially zero (c.f. columns 5 and 6), suggesting there is no
18
negative effect on native non–Hispanic whites through the schooling channel (or that it is
cancelled out by natives’ anticipation of their immigrant classmates’ future labor market
effect). Nevertheless, the WLS and 2SLS coefficients are not statistically significantly
different. The coefficient on the adult immigrants with less than 12 years of education is
a statistically significant 0.41 under 2SLS (column 6), half the size for the whole sample
in Table 4.
In Table 7, I turn to native–born blacks, for whom the negative effect of immigrants
11–17 is larger in absolute value than for non–Hispanic whites. As for the previous
samples, 2SLS renders this coefficient statistically insignificant, although in this sample
the point estimate is almost unchanged at -0.34. The positive effect of adult immigrants
with less than 12 years of education is robust and larger than for non–Hispanic whites,
with a moderately sized, statistically significant 2SLS coefficient of 1.03 (column 7). The
effects of adult immigrants with exactly 12 years education and with more than 12 years
are imprecisely estimated. From Tables 4–7 I conclude that the labor market channel
through which immigration might operate works as expected, with a larger effect for
native blacks than non–Hispanics whites, also as expected. The schooling channel is
imprecisely estimated under 2SLS, and while moderately sized effects can be ruled out
for natives generally and for non–Hispanic whites, this is not the case for blacks.
Finally, I examine native–born Hispanics in Table 8. While the sign of the coefficient
on immigrants aged 11–17 is always negative, it is imprecisely measured in many speci-
fications (first row). The evidence of a positive effect of adult immigrants with less than
12 years of education is not robust, since in differenced specifications the sign is negative.
Another difference from results for other native groups is that immigrants adults with
more than 12 years of education have relatively large positive effects, even under 2SLS.
The results for Hispanics therefore appear to provide only weak support for the hypothe-
ses being tested. In the next section, however, I show that this is because the Table 8
regressions are misspecified.
19

3.3 Distinguishing child immigrants according to parental char-
acteristics
Distinguishing among immigrants aged 11–17 according to their parents’ education proves
helpful for interpreting the effects of immigration on native–born Hispanics, and these
results are presented in column 2 of Table 9. Column 1 reproduces the fixed effects
specification of Table 8 (column 4). As hypothesized (albeit not for Hispanics specifically),
the coefficient on child immigrants with parents with less than 12 years of education is
negative and statistically significant, with the relatively large magnitude (in absolute
value) of -2.00 in column 2, while the coefficient on child immigrants with more educated
parents is positive and statistically significant, with a relatively large coefficient of 3.46.
The magnitude of the two coefficients implies a one percentage point increase in the
relevant immigrant share changes the 12–year completion rate by 2–3 percentage points.
This compares to shares of immigrants in the 11–17 population of 3.3% with parents
with less than 12 years schooling and 4.7% for those with a parent with at least 12 years
schooling, and a Hispanic completion rate of 81.3%.24 These numbers imply moderate
elasticities of -0.08 for children of unskilled parents and 0.20 for children of more educated
parents.
It appears that in the specification with the undifferentiated child immigrant variable,
the unskilled adult immigrant coefficient was capturing the opposing effects of the un-
skilled adult immigrants and their children: the coefficient on adult immigrants with less
than 12 years of education rises from 0.48 in column 1 to a statistically significant 1.74 in
column 2, in accordance with the theory. At the same time, the effect of child immigrants
with more educated parents was being picked up by the educated adult immigrant variable
in the simpler specification: the coefficient on adult immigrants with more than 12 years
of education falls from the anomalously high 1.87 in column 1 to -0.35 (and statistically
insignificant) in column 2.
The coefficient on the small share of the 11–17 year–old population that is immigrants
24 The shares of immigrants in the population 11–17 are computed using Hispanic weights, and arehence higher than implied in Figure 2. See Appendix Table 4.
20

with no parent in the household is strongly negative in both columns. There are several
possible explanations for this. The first is causal: such immigrants, who tend to have
very low enrollment rates, drop out early from school and have very negative peer effects
in the short time they are in school in the United States. If this is so, one might expect
a similarly negative impact of children of the lowest educated immigrants. However, un-
reported regressions splitting parental dropouts into those with more or less than nine
years of education do not point to clear differences between the two groups. Two other
explanations rely on endogeneity, and imply a negative bias on the coefficient. To the
extent that the young immigrants move to the United States without their parents in
order to work (Oropesa and Landale 2009), they are the immigrants most likely to move
to states with (imperfectly controlled) favorable labor market conditions for youth, con-
ditions which would incite the closely substitutable native students to drop out. To the
extent that some young immigrants move to the United States with their parents and
initially attend school, (imperfectly controlled) favorable youth labor market conditions
are likely to entice both immigrants and natives to drop out of school to work, and hence
also to leave home.
Since it is not possible to instrument all the immigrant variables in the expanded
specification of column 2, it is not possible to make statements about causal effects.
Nevertheless, Table 9 suggests that for Hispanic natives, just as for other natives, adult
immigrants with less than 12 years schooling have a positive effect on completing 12
years of schooling, and that for Hispanic natives, classmates with educated parents have
positive effects, while classmates with poorly educated parents have detrimental effects.
It is likely that the large effect of child immigrants with no parent in the household reflects
endogeneity.
I present the corresponding regressions for native non–Hispanic whites (column 3) and
native–born blacks (column 4). For these natives, there is no indication that grouping all
child immigrants introduced misspecification, as the coefficients on the adult immigrant
variables do not change much when the child immigrant variable is split into components.
Neither is there a clear distinction between the effects of child immigrants with lower and
21
higher education parents, and indeed, these coefficients are all statistically insignificant.
The coefficient on child immigrants with no parent in the household is not nearly as
negative for non–Hispanic whites as for native Hispanics, and is positive for blacks. The
larger correlation for native Hispanics may be related to the fact that in recent decades,
such child immigrants are very disproportionately Mexican–born and are more likely to
live in states with Hispanic natives.
3.4 Robustness checks and further results
For the sample of all native–born, I can test the sensitivity of the results to classifying
GED holders as having less than 12 years of education. There is no apparent way to do
this for the 12–year completion rate adjusted for sex and age (and race and ethnicity),
so I use the unadjusted 12–year completion rate as the basis for the state panel analysis.
In Table 10, I present results from regressions with a single immigration covariate (upper
panel), and from regressions with immigration split by age and education (lower panel).
The fixed effects results in column 1 (corresponding to column 3 in Tables 2 and 4)
and column 2 show that the failure to adjust for sex and age has no effect in the upper
panel, but in the lower panel reduces the absolute value of the coefficients, rendering the
coefficient on child immigrants statistically insignificant.
Reclassifying the GED holders in column 3 increases the immigration impact from
0.20 to 0.31 in the upper panel; in the lower panel it generally increases slightly both the
absolute value of the coefficients and the standard errors, leaving the results qualitatively
the same. The use of the differenced specification in column 4 returns the upper panel
coefficient to 0.23, and in the lower panel makes the coefficient on child immigrants sta-
tistically significantly negative once more. 2SLS in column 5 increases the coefficient in
the upper panel to 0.48, larger than the coefficient of 0.34 in Tables 2 and 3 column 7,
though not statistically significantly so. In the lower panel, 2SLS flips the sign of the in-
significant coefficient on child immigrants and raises the point estimate on adult dropout
immigrants to 0.97, a similar magnitude to the 0.81 estimated in Table 4 column 7. The
22

coefficients on the two other immigrant variables become large in absolute value, but
are statistically insignificant. The comparison of Table 10 with earlier tables indicates
that natives do adjust to schooling through changes in years of regular high school, and
schooling adjustment is not driven by changes in the propensity to obtain a GED.
I have also experimented with adding further covariates to the regressions with the
original dependent variable. The share of native children 11–17 who are second gener-
ation immigrants, distinguished by parental education, and the share of third or higher
generation children 11–17 whose parents are high school dropouts yield some interesting
coefficients, but do not affect the main results of interest. The student–teacher ratio for all
grades in public schools always has a statistically insignificant coefficient (the sources are
the Digest of Education Statistics and the Biennial Survey of Education, various years).
Finally, matching state characteristics to natives’ state of current residence, rather than
state of birth, does not change the qualitative picture. For all races and ethnicities to-
gether, coefficients are smaller in absolute value, while for minorities there is no clear
pattern.
As a check on the effects of immigrant children distinguished by the education of the
parent, I can instead distinguish immigrant children by their birth region (these results
are not reported; including both birth region and parental education causes all relevant
coefficients to become insignificant). Child immigrants from Latin America have a sta-
tistically significant negative effect on natives generally (coefficient -0.49), and this effect
is statistically significant at the 10% level for each of the three native groups consid-
ered. This is consistent with a negative effect of child immigrants from low SES or low
education families. The effect of Asian children is negative and significiant at the 10%
level for all natives (coefficient -0.56) and insignificant for native groups individually. The
effect of European and Canadian (and Australian and New Zealand) children is small
and insignificant for all natives, but has a relatively large significant positive effect for
native–born Hispanics (coefficient 1.75), whereas the coefficient for blacks is negative and
statistically insignificant (and is zero for non–Hispanic whites). This is consistent with
native–born Hispanics responding positively to high–SES or high–education schoolmates
23

or neighborhood companions.
Native males and native females could be differently affected by immigration, either
due to differing degrees of labor market substitutability with immigrants, or due to dif-
fering performance in school, or different types or degrees of interaction with immigrants
in school (or the neighborhood). I have therefore repeated all the analysis distinguishing
natives by gender. I present two panels of results in Table 11, using a single immigration
covariate in the upper panel, and distinguishing among immigrants in the lower panel.
The analysis for native Hispanics shows that the subtle effects of immigrants age 11–17
come entirely from the effects on males (lower panel, columns 1 and 2). The fact that
these effects are found only for males and not for females means it is unlikely that they
are explained by endogeneity of location of various types of child immigrants. The table
also shows that the negative sign of the net effect of immigration on native Hispanics in
the 2SLS comes from native males, though standard errors remain large (upper panel,
columns 3 and 4).25
The results for native–born blacks (columns 5–8) show coefficients for native–born
black females are very imprecisely estimated, indicating that the statistical significance of
earlier results was driven by males, though the general pattern of results is similar for the
two genders. The analysis for all natives and white non–Hispanic natives does not reveal
any noteworthy differences by gender (see Appendix Table 6).
Finally, I reestimate the regressions using 130 metropolitan areas (cities) instead of
49 states, reporting results for each race and ethnicity sample in Table 12. The upper
panel shows the effect of overall immigration in the 11–64 age group. In column 1,
the fixed effects specification shows a very small positive and statistically effect of 0.09
for all natives. 2SLS increases the coefficient substantially to a statistically significant
0.26 in column 2, similar to the 0.34 found for the states sample in Tables 2 and 3
column 7. The F–statistic for the excluded instrument in the first stage is 14. However,
the 2SLS coefficients for the separate race and ethnic groups are statistically insignificant
25 In British schools, Lavy et al. (2012) find greater sensitivity of girls than boys to peer effects inBritish schools, while Gibbons and Telhaj (2012) find no difference.
24
(columns 4, 6 and 8).
In the lower panel, where types of immigrant are distinguished, the odd columns show
that fixed effects estimation yields small, insignificant coefficients whose point estimates
do not correspond to the hypotheses of the paper. On the other hand, the even columns,
containing 2SLS coefficients, indicate point estimates larger in absolute value than in the
odd columns, and similar to those for the states sample. For all natives in column 2,
the coefficient on adult immigrants with less than 12 years education is a statistically
significant 0.70, compared to a corresponding coefficient of 0.81 for the states sample
(Table 4 column 7), and the point estimates on child immigration are identical for cities
and states (-0.18). The coefficients for the separate race and ethnic groups are statistically
insignificant, however, and as the tables notes indicate, the instruments are weak in the
first stage for the 2SLS regressions of the lower panel, leading to generally high standard
errors in the second stage. Native Hispanics are a special case, as I do not attempt to
instrument, and so cannot judge if 2SLS returns the patterns found in the state data.
It is noteworthy that when the regression of column 7 (lower panel) is run with state
data confined to 1980–2010, the point estimates of the coefficients are almost unchanged
compared to the regression using all years of data.
It appears that analysis at the level of the city introduces more endogeneity to be
repaired by 2SLS, and the 2SLS results are similar to those at the state level using all
years. However, generally standard errors are large due to weak first stages when types
of immigrant are distinguished. The greater need for 2SLS precludes analysis of child
immigrants distinguished according to their English ability, as 2SLS would involve too
many instruments; the unreported coefficients from fixed effects estimation are all small
and statistically insignificant.
4 Conclusion
In this paper, I have shown that natives’ probability of completing 12 years of education
is increased by immigration, albeit by a small magnitude, an effect that is larger for
25

blacks than non–Hispanic whites. The effect for Hispanic natives, on the other hand, is
a small (statistically insignificant) negative one. Consistent with the hypothesis that this
education upgrading is prompted by a higher return to high school due to immigration of
high school dropouts, I find that natives’ probability of completing 12 years of education
is increased by greater presence of adult immigrants with less than 12 years of education.
This effect is larger for native minorities than for non–Hispanic whites, which probably
reflects a greater effect for individuals from low SES families generally. Even for minorities,
however, the effects are small, though larger than the effect of immigrants of all ages.
While immigrants age 11–17 have no effect on the 12–year completion rates of non–
Hispanic white natives, moderate negative effects on the completion rates of black natives
cannot be excluded, though the instruments are not sufficiently powerful to identify the
size of the effect precisely. For native–born Hispanics, the effects of child immigrants are
more subtle, strongly dependent on the education of the child immigrants’ parents: chil-
dren of parents with less than 12 years of education have a deleterious impact on native
completion rates, while children with a parent with 12 or more years of education have
a positive effect. These effects are of moderate size, larger than any others found in the
study, and are found for males only. That some native–born minorities are negatively
affected by some child immigrants suggests the need for reform in accommodating immi-
grant students, particularly those with less educated parents and in schools with many
native–born minorities.
Hispanics are the native group living in school districts with the most immigrants, and
black and Hispanic males have the lowest native graduation rates, so it is not surprising
that native Hispanic males are most sensitive to child immigration. The relatively large
negative effect on native Hispanic males of child immigrants of poorly educated parents
may be an indicator that native students are most affected in school when exposed to cul-
turally similar immigrants. However, it is not entirely clear why black males, for example,
do not also increase their 12–year completion rates in response to child immigrants of ed-
ucated parents. The fact that native Hispanics increase their 12–year completion rates in
response to European and Canadian (and Australian and New Zealand) child immigrants,
26

while blacks do not, suggests that the explanation can be at most in part related to sim-
ilarity between native and immigrant Hispanics, and at most in part due to differential
exposure to immigrant children of higher SES, since native blacks and Hispanics have
very similar exposure to white non–Hispanic immigrant children.
27
References
Acemoglu Daron and Joshua Angrist. 2000. “How Large are Human–Capital Externali-ties? Evidence from Compulsory Schooling Laws”. NBER Macroeconomics Annual, 15pp. 9–74.
Angrist, Joshua D. and Jorn–Steffen Pischke. 2008. Mostly harmless econometrics: anempiricist’s companion, Princeton University Press.
Beaudry, Paul, David A. Green and Benjamin Sand. 2010. “Does Industrial CompositionMatter for Wages? An Empirical Evaluation Based on Search and Bargaining Theory”.UBC working paper.
Betts, Julian R. 1998. “Educational Crowding Out: Do Immigrants Affect the EducationalAttainment of American Minorities?”. In Daniel S. Hamermesh and Frank D. Bean(Eds.), Help or Hindrance? The Economic Implications of Immigration for African-Americans, New York: Russell Sage Foundation.
Betts, Julian R. and Robert Fairlie. 2003. “Does Immigration Induce ‘Native Flight’ FromPublic Schools into Private Schools?”, Journal of Public Economics, 87 (5–6) pp.987–1012.
Betts, Julian R. and Magnus Lofstrom. 2000. “The Educational Attainment of Immi-grants: Trends and Implications”. In George J. Borjas ed. Issues in the Economics ofImmigration, Chicago: University of Chicago Press.
Borjas, George J. 2007. “Do Foreign Students Crowd Out Native Students from Gradu-ate Programs?”. In Ronald G. Ehrenberg and Paula E. Stephan eds. Science and theUniversity, Madison: University of Wisconsin Press.
Borjas, George J, Jeffrey Grogger and Gordon H. Hanson. 2011. “Substitution BetweenImmigrants, Natives and Skill Groups”. Harvard University working paper.
Borjas, George J. and Lawrence F. Katz. 2007. “The Evolution of the Mexican–BornWorkforce in the United States”. In George J. Borjas ed. Mexican Immigration to theUnited States, Chicago: University of Chicago Press.
Brunello, Giorgio and Lorenzo Rocco. 2011. “The Effect of Immigration on the SchoolPerformance of Natives: Cross–Country Evidence Using PISA Test Scores”. IZA Dis-cussion Paper 5479.
Card, David. 2009. “Immigration and Inequality”. American Economic Review, 99 (20)pp.1–21.
Card, David. 2001. “Immigrant Inflows, Native Outflows and the Local Labor MarketImpacts of Higher Immigration”. Journal of Labor Economics, 19 (1) pp.22–64.
28

Card, David and Thomas Lemieux. 2001. “Dropout and Enrollment Trends in the PostWar Period: What Went Wrong in the 1970s?”. In Jonathan Gruber ed. An EconomicAnalysis of Risky Behavior Among Youth, Chicago: University of Chicago Press.
Cascio, Elizabeth and Ethan Lewis. Forthcoming. “Cracks in the Melting Pot: Immigra-tion, School Choice and Segregation”. American Economic Journal: Economic Policy.
Checchi, Daniele, Andrea Ichino and Aldo Rustichini. 1999. “More equal but less mobile?Education financing and intergenerational mobility in Italy and the US”. Journal ofPublic Economics, 74 pp.351–393.
Coleman, J.S., E.Q. Campbell, C.J. Hobson et al. 1966. Equality of Educational Oppor-tunity, Washington D.C.: Office of Education, U.S. Department of Health, Educationand Welfare.
Corak, Miles. 2006. “Do Poor Children Become Poor Adults? Lessons for Public Policyfrom a Cross Country Comparison of Generational Earnings Mobility”. Research onEconomic Inequality, Vol. 13.
Cragg, J. G., and Donald, S. G. 1993. “Testing Identifiability and Specification in Instru-mental Variable Models, Econometric Theory, 9 pp.222240.
Eberhard, Juan. 2012. “Immigration, Human Capital and the Welfare of Natives”. Uni-versity of Southern California working paper.
Fix, Michael and Wendy Zimmerman. 1993. Educating Immigrant Children: Chapter I inthe Changing City, Washington: Urban Institute Press.
Garcıa, Ofelia, Jo Anne Kleifgen and Lorraine Falachi. 2008. “From En-glish Language Learners to Emergent Bilinguals”. Equity Matters: Re-search Review No. I, New York, NY: Teachers College, Columbia University.www.tc.edu/i/a/document/6468 Ofelia ELL Final.pdf, accessed Sept 28, 2009.
Geay, Charlotte, Sandra McNally and Shqiponja Telhaj. 2012. “Non–Native Speakers ofEnglish in the Classroom: What Are the Effects on Pupil Performance?”. IZA Discus-sion Paper 6451.
Gibbons, Stephen and Shqiponja Telhaj. 2012. “Peer Effects: Evidence from SecondarySchool Transition in England”. IZA Discussion Paper 6455.
Gould, Eric D., Victor Lavy and M. Daniele Paserman. 2009. “Does Immigration Af-fect the Long-Term Educational Outcomes of Natives? Quasi-Experimental Evidence”.Economic Journal, 119 (540) pp. 1243–1269.
Hanson, Gordon H. and Craig McIntosh. 2007. “The Great Mexican Emigration”. Na-tional Bureau of Economic Research Working Paper 13675.
29
Heckman, James J. and Paul A. LaFontaine. 2010. “The American High School Gradua-tion Rate: Trends and Levels”. Review of Economics and Statistics, 92 (2) pp. 244–262.
Hoxby, Caroline M. 1998. “Do Immigrants Crowd Disadvantaged American Natives outof Higher Education?”. In Daniel S. Hamermesh and Frank D. Bean (Eds.), Help orHindrance? The Economic Implications of Immigration for African-Americans, NewYork: Russell Sage Foundation.
Hunt, Jennifer and Marjolaine Gauthier–Loiselle. 2010. “How Much Does ImmigrationBoost Innovation?”, American Economic Journal: Macroeconomics, 2 (2) pp. 31–56.
Jackson, Osborne. 2011. “Does Immigration Crowd Natives Into or Out of Higher Edu-cation?”. Northeastern University working paper.
Jensen, Peter and Astrid Wurtz Rasmussen. 2011. “The Effect of Immigrant Concen-tration in Schools on Native and Immigrant Children’s Reading and Math Skills”.Economics of Education Review, 30 pp.1503–1515.
Lavy, Victor, Olmo Silvar and Felix Weinhardt. 2012. “The Good, the Bad, and theAverage: Evidence on Ability Peer Effects in Schools”. Journal of Labor Economics,30(2) pp.367–414.
Llull, Joan. 2010. “Immigration, Wages and Education: A Labor Market EquilibriumStructural Model”. CEMFI working paper.
MacDonald, Victoria–Marıa and Karen Monkman. 2005. “Setting the Context: HistoricalPerspectives on Latino/a Education”. In Pedro Pedraza and Melissa Rivera eds. LatinoEducation: An Agenda for Community Action Research, Mahwah, N.J.: Lawrence Erl-baum Associates.
National Center for Education Statistics (NCES). 2008. “Dropout and Completion Ratesin the United States: 2006”. nces.ed.gov/pubs2008/2008053.pdf, accessed September27, 2009.
Neymotin, Florence. 2009. “Immigration and its Effects on the College–going Outcomesof Natives”. Economics of Education Review, 28 pp. 538–550.
Noguera, Pedro. 2008. The Trouble With Black Boys: And Other Reflections on Race,Equity and the Future of Public Education. Hoboken, N.J.: John Wiley.
Noguera, Pedro, Aıda Hurtado and Edward Fergus, eds. Invisible No More: Understand-ing the Disenfranchisement of Latino Men and Boys. New York, N.Y.: Routledge.
Ohinata, Asako and Jan C. van Ours. 2011. “How Immigrants Children Affect the Aca-demic Achievement of Native Dutch Children.” CEPR Discussion Paper 8718.
30

Orfield, Gary, Daniel Losen, Johanna Wald and Christopher B. Swanson. 2004. LosingOur Future: How Minority Youth are Being Left Behind by the Graduation Rate Cri-sis. Cambridge, M.A.: The Civil Rights Project at Harvard University. Contributors:Advocates for Children of New York, The Civil Society Institute.
Oropesa, R.S. and Nancy S. Landale. 2009. “Why Do Immigrant Youths Who NeverEnroll in U.S. Schools Matter? School Enrollment Among Mexicans and Non–HispanicWhites”. Sociology of Education, 82 pp.240–266.
Ottaviano, Gianmarco and Giovanni Peri. 2012. “Rethinking the Effects of Immigrationon Wages”. Journal of the European Economic Association, 10(1) pp.78–119.
Peri, Giovanni and Chad Sparber. 2009. “Task Specialization, Immigration and Wages”.American Economic Journal: Applied Economics, 1 (3) pp.135–169.
Ruggles, Steven, J. Trent Alexander, Katie Genadek, Ronald Goeken, Matthew B.Schroeder and Matthew Sobek. 2010. Integrated Public Use Microdata Series: Version5.0 [Machine-readable database]. Minneapolis: University of Minnesota.
Singer, Audrey. 2008. “Reforming U.S. Immigration Policy: Opening New Path-ways to Integration”. Opportunity 08: A Project of the Brookings Institution.www.brookings.edu/papers/2007/0228demographics singer Opp08.aspx, accessed 29March 2012.
Smith, Christopher L. 2012. “The Impact of Low–Skilled Immigration on the Youth LaborMarket”. Journal of Labor Economics, 30 (1) pp. 55–89.
Stock, James H. and Motohiro Yogo. 2005. “Testing for Weak Instruments in Linear IVRegression”. In James H. Stock and Donald W.K. Andrews eds. Identification and In-ference for Econometric Models: Essays in Honor of Thomas J. Rothenberg, CambridgeUniversity Press.
U.S. Department of Education, National Center for Education Statistics. Digest of Edu-cation Statistics, various issues 1965–2010.
U.S. Department of the Interior, Bureau of Education Bulletin. Biennial Survey of Edu-cation, various issues 1939–1958.
Valencia, Richard R., Martha Menchaca and Ruben Donato. 2002. “Segregation, deseg-regation, and integration of Chicano students: old and new realities”. In Richard R.Valencia ed. Chicano School Failure and Success: Past, Present and Future, London:Routledge.
31
Data Appendix
Analysis of Metropolitan Areas
I have linked metropolitan areas (cities) across the 1980–2000 censuses and the 2010 ACSusing code generously provided by Ethan Lewis. It is only from 1980 onwards, whenthe census sample rises from 1% to 5%, that samples are large enough to perform theanalysis by city. I use the 130 cities (excluding Honolulu, for consistency with the stateanalysis) for which there are at least 75,000 observations on native 21–27 year olds in thewhole period; even using so few cities, some city–year cells are very small, especially forminorities. I retain the same specifications as for the state–level analysis, merely replacingtrends based on 1940 values of certain variables with trends based on their 1980 values. Icalculate the instruments in a parallel way, computing national shares of immigrants fromdifferent countries across cities in 1980, and retaining the same set of countries as for thestate–level analysis. The means of the city–based samples are available upon request.
GED Analysis
I correct the 12–year completion rates using annual published tables on GEDs awardedby state and age, using the Heckman and LaFontaine (2010) appendix for methodologicalguidance. I scale down the published figures so as to reflect only native–born GEDrecipients with the help of the pooled 1999–2001 October supplement to the CurrentPopulation Survey and the 2008–2010 pooled ACSs, but the CPS samples sizes do notpermit a break–down by race and ethnicity. The published GED data indicate that onlya small minority (less than 5%) of GED recipients had completed 12 years of high school,so I reduce the reported number of native completers by the estimated number of nativeGED recipients to obtain a “true” number of native completers of 12 years of schooling.
Official GED Data
The basic data on GEDs are taken from the annual GED Statistical Reports (“Who Tookthe GED?”, available at www.acenet.edu/Content/NavigationMenu/ged/pubs/GEDArchived Annual .htm, accessed 23 March 2012). From 1989 onwards, statistics are avail-able for the age distribution by state of GEDs awarded. A few missing and implausiblevalues are filled in with linear interpolation, and for a number of states that began re-porting the statistics only later, linear extrapolation back to 1989 is used. From 1974 to1988, the age distribution is only available for those tested, rather than those who wereawarded a GED. For these years, I compute for each age group the pass rate in the mostrecent year for which both the distribution of test–takers and the distribution of creden-tials awarded are available (1989 for most states), and use the pass rates to adjust thedistribution of test–takers in 1974–1988 to obtain the age distribution of GEDs awarded.New York begins reporting information by age only from 1984, and I impute 1974–1983values by extrapolating the 1984–1988 trends. Before 1974, no information is provided byage and state, and for 1969–1973, I assume the age distribution is the same as in 1974.
32

The age categories are not the same in all years, and the age categories for test–takersare not always the same as those for GEDs awarded. When the age categories change (ingeneral they become finer over time), I split the coarser categories based the distributionin the nearest year with finer categories. Even the finest divisions do not give the agedistribution for each year of age (above age 19), so after I harmonize the data at thefinest categorization, I assume that GEDs are uniformly distributed within an age group.I assume that recipients 16 or younger are age 16. The final age distributions are combinedwith statistics for total GEDs awarded by state and year to obtain GEDs awarded by stateand year for each year of age.
I use these numbers to calculate how many 21–27 years olds held GEDs in 1980, 1990,and 2000, assuming that by the census date, one third of the year’s GEDs had beenreceived. For “2010”, I average the age 19–25 stock in 2008, the age 20–26 stock in 2009,and the age 21–27 stock in 2010.
Birthplace of GED recipients
The official GED statistics give no breakdown by birthplace, a breakdown necessary sinceI seek statistics for natives only. The October supplement to the CPS allows those whosehighest degree is a GED to be identified, and from 1994 onwards, the basic monthlyCPSs contain birthplace. The ACS contains both the GED and birthplace information.I therefore use the pooled 1999–2001 October CPSs and the pooled 2008–2010 ACSs toestimate the immigrant share among those who completed a GED but had no college. Thesample sizes are too small, however, to do this for each state (and too small to allow thecalculation of the shares of minorities, which I do not attempt). I instead distinguish threegroups of states in the CPS and six groups in the ACS, based on the share of immigrantsin the population aged 21–27.
Combining the data sources
For 2000 and 2010, it is straightforward to adjust the total GED stocks calculated fromofficial GED data with the share of immigrants from the census and ACS data to reflectnatives only. For 1980 and 1990, I assume that the share of immigrants among GEDholders aged 21–27 changes proportionately to immigrants’ share in the 21–27 population.I calculate the latter shares for the three state groups using the 1980 and 1990 censuses.
I then calculate the share of the native population aged 21–27 that holds a GEDby dividing the GED stocks of natives 21–27 by the native population aged 21–27 (orthe equivalent for 2008–2010), the latter computed by summing the census weights fornatives, including those whose native status is imputed. I subtract this fraction from thefraction of natives with 12 years of schooling or more, which had been calculated basedon a sample with non–missing (and non–imputed) education and birthplace.
33
GED–adjusted statistics
The first row of Appendix Table 1 shows the national raw native 12–year completion rates,while the second row shows the rates adjusted to count GED holders as non–completers.The adjustment reduces the completion rate by five percentage points in 1980, and bymore in later years. Nevertheless, the adjusted completion rate is estimated to haveincreased between 1980 and 2010, with stagnation between 1990 and 2000. The third rowprovides the 12–year completion rate as directly measured in the 2010 ACS. This rate of87.8% lies between the rates of the first two rows (84.9% adjusted, 92.3% unadjusted),indicating that too many GEDs have been subtracted in the adjustment. One reason forthis would be that some of the GED holders subtracted in fact went on to obtain moreeducation, and do not appear as GED holders in the 2010 ACS. In panel B, I consider highschool graduation rates, which must be lower than 12-year completion rates. I measurethis rate directly in the pooled 2008–2010 ACSs as 86.3%.
In panel C, I present for comparison the Heckman and LaFontaine (2010) high schoolgraduation estimates for 1970–2000. They use age groups that do not quite match mine,and remove only recent immigrants from their GED counts. I assume that their rawnumbers for 1970 and 1980 include 12–year completers, since they cannot be distinguishedfrom high school graduates, and that their raw numbers from 1990 onwards exclude them.This would account for the lack of progress between 1980 and 1990 in their graduationrates, in constrast to my adjusted 12–year completion rates in panel A. Our 1980 ratesshould be similar, which they are. The graduation rate for 2010 measured directly (panelB) appears high compared to the estimated Heckman and LaFontaine rates for 2000.
34

Fig
ure
1:Shar
eof
nat
ives
wit
hat
leas
t12
year
sof
school
ing,
by
race
and
ethnic
ity
All
Non−
His
panic
whites
Bla
cks
His
panic
s
0.1.2.3.4.5.6.7.8.91Share natives ages 21−27 at least 12 years schooling
1940
1950
1960
1970
1980
1990
2000
2010
Year
Not
e:T
he
shar
eof
nat
ives
aged
21–2
7w
ho
hav
eco
mple
ted
atle
ast
12ye
ars
ofsc
hool
ing.
Sou
rce:
U.S
.C
ensu
s19
40–2
000,
Am
eric
anC
omm
unit
ySurv
ey20
08–2
010.
35

Fig
ure
2:Im
mig
rant
shar
ein
vari
ous
age
grou
ps
Age 1
8−
64
Age 1
1−
64
Age 1
1−
17
0.02.04.06.08.1.12.14.16.18Immigrants as share of age group
1940
1950
1960
1970
1980
1990
2000
2010
Year
Not
e:Im
mig
rants
asa
shar
eof
each
age
grou
p.
Sou
rce:
U.S
.C
ensu
s19
40–2
000,
Am
eric
anC
omm
unit
ySurv
ey20
08–2
010.
36

Fig
ure
3:Im
mig
rant
educa
tion
grou
ps
assh
are
ofth
ep
opula
tion
,ag
es18
–64
Few
er
than 1
2 y
ears
schoolin
g
More
than 1
2 y
ears
schoolin
g
Exactly 1
2 y
ears
schoolin
g
0.02.04.06.08.1.12Immigrant−education group as share of population 18−64
1940
1950
1960
1970
1980
1990
2000
2010
Year
Not
e:Im
mig
rants
18–6
4w
ith
vari
ous
educa
tion
leve
lsas
shar
eof
the
tota
lp
opula
tion
aged
18–6
4.Sou
rce:
U.S
.C
ensu
s19
40–2
000,
Am
eric
anC
omm
unit
ySurv
ey20
08–2
010.
37

Table 1: Interaction of natives by ethnicity with immigrants, school district level 1990
Immigrants Hispanic immigrants
White non-Hispanic
immigrants
Asian immigrants
Immigrant parents
Hispanic immigrant
parents (1) (2) (3) (4) (5) (6) A. National level shares Overall 0.042 0.023 0.0055 0.010 0.102 0.044 In native’s district 0.038 0.020 0.0052 0.009 0.078 0.031 In native white’s district 0.025 0.011 0.0045 0.008 0.069 0.025 In native black’s district 0.052 0.028 0.0060 0.011 0.120 0.055 In native Hispanic’s district 0.107 0.074 0.0084 0.017 0.201 0.139 In immigrant’s district 0.143 0.088 0.0138 0.028 0.312 0.159 B. Difference in state shares Native black-native white 0.027 0.016 0.0014 0.005 0.061 0.033 Native Hispanic-native white 0.036 0.027 0.0017 0.004 0.072 0.049 Native Hispanic-native black 0.009 0.011 0.0003 -0.002 0.012 0.015
Source: School District Database (tabulations of the 1990 census at school district level). Notes: Based on school districts including a high school: 10,935 school districts for children and 12,503 for parents of children (the reason for the difference is unknown). In panel B, the shares by race/ethnicity are calculated at the state level, then averaged across states weighting with total enrollment in the state. An immigrant is a child of school age born abroad; an immigrant parent is someone born abroad who is the parent of a school-aged child (born anywhere). White denotes non-Hispanic white.

Table 2: Effects of immigrants in population 11-64 on native probability of completing 12 years education (1) (2) (3) (4) (5) (6) (7) Fixed effects 10-year differences
WLS 2SLS Share population 11-64 which is immigrant; t-10
0.03 (0.13)
0.07 (0.08)
0.20** (0.06)
0.29** (0.06)
0.22** (0.07)
0.26** (0.05)
0.34** (0.11)
Unemployment rate age 18-24; t-10
-- 0.69* (0.38)
-0.11 (0.17)
-0.09 (0.17)
-0.03 (0.16)
-0.07 (0.10)
-0.09 (0.10)
Unemployment rate age 25-54; t-10
-- -0.68 (0.79)
0.31 (0.40)
0.27 (0.41)
0.22 (0.37)
0.25 (0.24)
0.28 (0.24)
Share of native population which is age 11-17; t-10
-- -1.36** (0.36)
-0.24 (0.25)
-0.20 (0.25)
0.08 (0.22)
0.02 (0.17)
0.03 (0.18)
Share workers in agriculture 1940*year -- -- 0.006 (0.003)
0.006 (0.003)
0.003 (0.003)
0.047 (0.033)
0.053 (0.034)
Share white natives 21-27 less than 12 years school 1940*year
-- -- 0.007** (0.003)
0.007** (0.003)
0.006** (0.003)
0.067** (0.027)
0.071** (0.028)
Log personal income per capita; t-10 -- -- -- -- 0.100** (0.026)
-- --
BEA regions*year (p-value) -- -- 0.00 0.00 0.00 0.00 0.00 Outcome adjusted for race, ethnicity -- -- -- Yes Yes Yes Yes R2 0.91 0.92 0.97 0.97 0.98 0.85 -- Observations 343 294 Notes: The dependent variable is the share of natives age 21-27 who have completed 12 years of education, adjusted at the individual level for age and sex, and also for black, Asian, missing race, Mexican, Cuban, Puerto Rican, other Hispanic, and missing Hispanic in columns 4-7. Estimation is by weighted least squares columns 1-6, and two-stage least squares column 7, with weights w the inverse of the squared standard errors on the state-year interaction coefficient in the individual regression for columns 1-5, and 1/(1/wt+1/wt+10) for columns 6 and 7. All specifications include year dummies; fixed effects specifications also include state dummies. The dependent variable is based on 1950-2010 data, the independent variables on data from 1940-2000. The instrument in column 7 is based on the 1940 distribution of immigrants from different regions (see text). Standard errors are clustered by state and reported in parentheses.
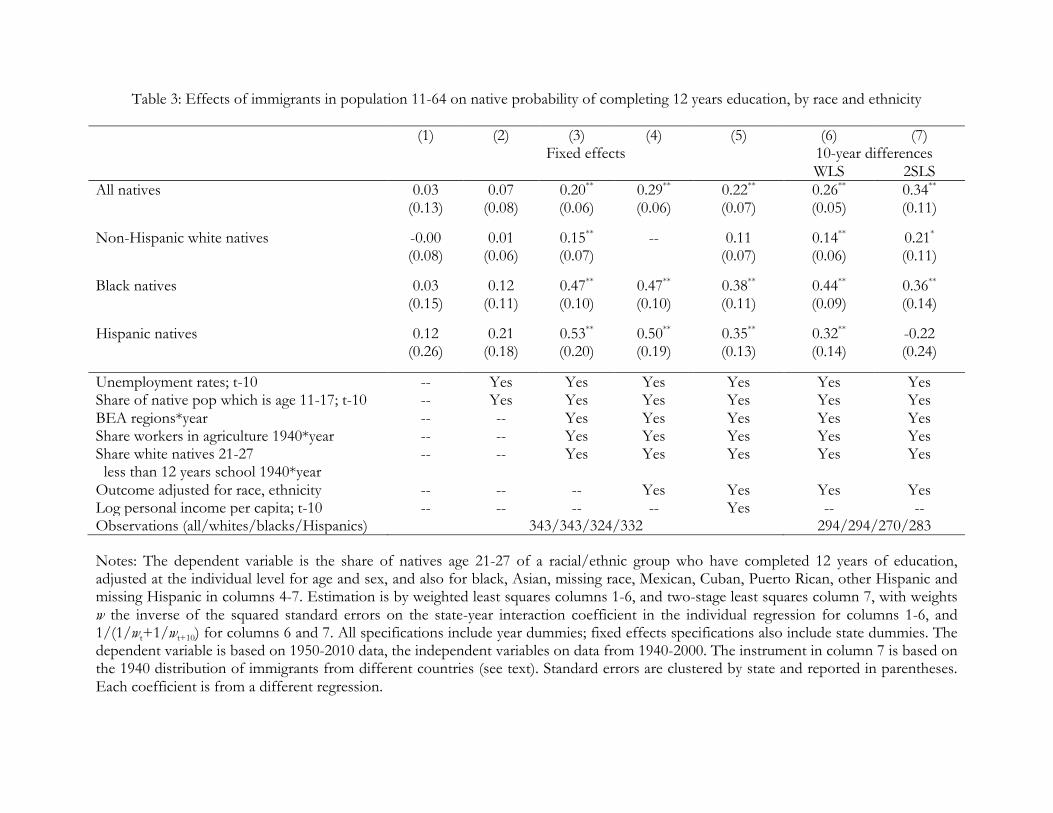
Table 3: Effects of immigrants in population 11-64 on native probability of completing 12 years education, by race and ethnicity (1) (2) (3) (4) (5) (6) (7) Fixed effects 10-year differences
WLS 2SLS All natives 0.03
(0.13) 0.07
(0.08) 0.20** (0.06)
0.29** (0.06)
0.22** (0.07)
0.26** (0.05)
0.34** (0.11)
Non-Hispanic white natives -0.00 (0.08)
0.01 (0.06)
0.15** (0.07)
-- 0.11 (0.07)
0.14** (0.06)
0.21* (0.11)
Black natives 0.03 (0.15)
0.12 (0.11)
0.47** (0.10)
0.47** (0.10)
0.38** (0.11)
0.44** (0.09)
0.36** (0.14)
Hispanic natives 0.12 (0.26)
0.21 (0.18)
0.53** (0.20)
0.50** (0.19)
0.35** (0.13)
0.32** (0.14)
-0.22 (0.24)
Unemployment rates; t-10 -- Yes Yes Yes Yes Yes Yes Share of native pop which is age 11-17; t-10 -- Yes Yes Yes Yes Yes Yes BEA regions*year -- -- Yes Yes Yes Yes Yes Share workers in agriculture 1940*year -- -- Yes Yes Yes Yes Yes Share white natives 21-27 less than 12 years school 1940*year
-- -- Yes Yes Yes Yes Yes
Outcome adjusted for race, ethnicity -- -- -- Yes Yes Yes Yes Log personal income per capita; t-10 -- -- -- -- Yes -- -- Observations (all/whites/blacks/Hispanics) 343/343/324/332 294/294/270/283 Notes: The dependent variable is the share of natives age 21-27 of a racial/ethnic group who have completed 12 years of education, adjusted at the individual level for age and sex, and also for black, Asian, missing race, Mexican, Cuban, Puerto Rican, other Hispanic and missing Hispanic in columns 4-7. Estimation is by weighted least squares columns 1-6, and two-stage least squares column 7, with weights w the inverse of the squared standard errors on the state-year interaction coefficient in the individual regression for columns 1-6, and 1/(1/wt+1/wt+10) for columns 6 and 7. All specifications include year dummies; fixed effects specifications also include state dummies. The dependent variable is based on 1950-2010 data, the independent variables on data from 1940-2000. The instrument in column 7 is based on the 1940 distribution of immigrants from different countries (see text). Standard errors are clustered by state and reported in parentheses. Each coefficient is from a different regression.

Table 4: Effects of immigrants by age and education on native probability of completing 12 years education (1) (2) (3) (4) (5) (6) (7) Fixed effects 10-year differences
WLS 2SLS Share population 11-17 which is immigrant; t-10
-0.55** (0.22)
-0.62** (0.15)
-0.45** (0.10)
-0.42** (0.11)
-0.36** (0.12)
-0.29** (0.07)
-0.18 (0.17)
Share population 18-64 which is immigrant < 12 years education; t-10 0.90**
(0.24) 0.98** (0.16)
0.88** (0.15)
0.90** (0.15)
0.83** (0.15)
0.74** (0.14)
0.81** (0.16)
immigrant 12 years education; t-10 0.46 (0.62)
0.63 (0.57)
-0.45 (0.28)
-0.37 (0.27)
-0.32 (0.26)
-0.12 (0.24)
0.58 (0.72)
immigrant > 12 years education; t-10 -0.31 (0.63)
-0.29 (0.48)
0.67** (0.28)
0.78** (0.28)
0.64** (0.30)
0.55** (0.23)
-0.08 (0.66)
Unemployment rates; t-10 -- Yes Yes Yes Yes Yes Yes Share of native pop which is age 11-17; t-10 -- Yes Yes Yes Yes Yes Yes BEA regions*year -- -- Yes Yes Yes Yes Yes Share workers in agriculture 1940*year -- -- Yes Yes Yes Yes Yes Share non-Hispanic whites less than 12 years education 1940*year
-- -- Yes Yes Yes Yes Yes
Outcome adjusted for race and ethnicity -- -- -- Yes Yes Yes Yes Log personal income per capita; t-10 -- -- -- -- Yes -- -- R2 0.94 0.95 0.98 0.98 0.98 0.87 -- Observations 343 294 Notes: The dependent variable is the share of natives ages 21-27 who have completed 12 years of education, adjusted at the individual level for age and sex, and also for black, Asian, missing race, Mexican, Cuban, Puerto Rican, other Hispanic and missing Hispanic in columns 4-7. Estimation is by weighted least squares columns 1-6, and two-stage least squares column 7, with weights w the inverse of the squared standard errors on the state-year interaction coefficient in the individual regression for columns 1-5, and 1/(1/wt+1/wt+10) for columns 6 and 7. All specifications include year dummies; fixed effects specifications also include state dummies. The dependent variable is based on 1950-2010 data, the independent variables on data from 1940-2000. The instruments in column 7 are based on the 1940 distribution of immigrants from different countries (see text). Standard errors are clustered by state and reported in parentheses.

Table 5: First stage of two-stage least squares (1) (2) (3) (4) (5) Share of immigrants in age group Share of population aged 18-64 which is immigrant with 11-64 11-17 less than 12
years education exactly 12 years
education more than 12
years education Predicted share population 11-64 which is immigrant
0.27** (0.05)
-- -- -- --
Predicted share population 11-17 which is immigrant
-- 0.68** (0.26)
-0.00 (0.07)
-0.04 (0.02)
0.05 (0.06)
Predicted share population 18-64 which is immigrant < 12 years education -- 0.00
(0.09) 0.72** (0.07)
0.04 (0.04)
0.10 (0.07)
which is immigrant 12 years education -- -1.40** (0.52)
-0.82** (0.22)
0.24** (0.09)
-0.24 (0.14)
which is immigrant > 12 years education -- 0.67** (0.25)
0.44** (0.11)
0.09 (0.06)
0.43** (0.09)
F statistic for joint significance 24.9 8.3 65.5 43.4 29.3 Angrist-Pischke F statistic -- 15.1 103.7 55.0 18.8 Partial R2 0.40 0.39 0.56 0.36 0.42 Observations 294 294 294 294 294 Notes: Estimation is by weighted least squares on 10-year differenced data, with weights 1/(1/ht+1/ht+10), where h is the denominator of the dependent variable in each regression: population age 11-64 in column 1, population age 11-17 in column 2, population age 18-64 with less than 12 years education column 3, population age 18-64 with exactly 12 years education column 3, population age 18-64 with more than 12 years education column 5. All specifications include year dummies and the (differenced) non-immigrant covariates of Table 2 column 7. The excluded instruments (predicted shares) are based on historical patterns of settlement by age and education. The dependent variable and excluded instruments are based on data from 1940-2000 (i.e. from t-10), while other covariates are based on data from 1950-2010. Standard errors are clustered by state and reported in parentheses.
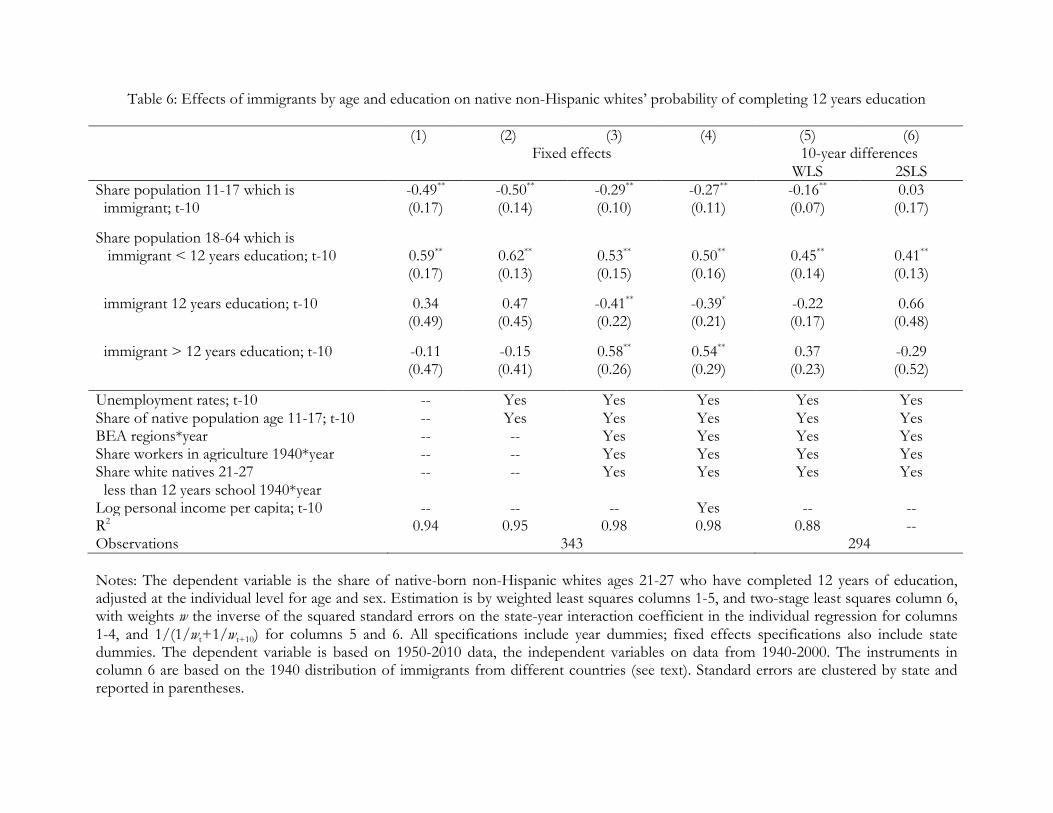
Table 6: Effects of immigrants by age and education on native non-Hispanic whites’ probability of completing 12 years education (1) (2) (3) (4) (5) (6) Fixed effects 10-year differences
WLS 2SLS Share population 11-17 which is immigrant; t-10
-0.49** (0.17)
-0.50** (0.14)
-0.29** (0.10)
-0.27** (0.11)
-0.16** (0.07)
0.03 (0.17)
Share population 18-64 which is immigrant < 12 years education; t-10 0.59**
(0.17) 0.62** (0.13)
0.53** (0.15)
0.50** (0.16)
0.45** (0.14)
0.41** (0.13)
immigrant 12 years education; t-10 0.34 (0.49)
0.47 (0.45)
-0.41** (0.22)
-0.39* (0.21)
-0.22 (0.17)
0.66 (0.48)
immigrant > 12 years education; t-10 -0.11 (0.47)
-0.15 (0.41)
0.58** (0.26)
0.54** (0.29)
0.37 (0.23)
-0.29 (0.52)
Unemployment rates; t-10 -- Yes Yes Yes Yes Yes Share of native population age 11-17; t-10 -- Yes Yes Yes Yes Yes BEA regions*year -- -- Yes Yes Yes Yes Share workers in agriculture 1940*year -- -- Yes Yes Yes Yes Share white natives 21-27 less than 12 years school 1940*year
-- -- Yes Yes Yes Yes
Log personal income per capita; t-10 -- -- -- Yes -- -- R2 0.94 0.95 0.98 0.98 0.88 -- Observations 343 294 Notes: The dependent variable is the share of native-born non-Hispanic whites ages 21-27 who have completed 12 years of education, adjusted at the individual level for age and sex. Estimation is by weighted least squares columns 1-5, and two-stage least squares column 6, with weights w the inverse of the squared standard errors on the state-year interaction coefficient in the individual regression for columns 1-4, and 1/(1/wt+1/wt+10) for columns 5 and 6. All specifications include year dummies; fixed effects specifications also include state dummies. The dependent variable is based on 1950-2010 data, the independent variables on data from 1940-2000. The instruments in column 6 are based on the 1940 distribution of immigrants from different countries (see text). Standard errors are clustered by state and reported in parentheses.

Table 7: Effects of immigrants by age and education on native blacks’ probability of completing 12 years education (1) (2) (3) (4) (5) (6) (7) Fixed effects 10-year differences
WLS 2SLS Share population 11-17 which is immigrant; t-10
-0.73** (0.29)
-0.74** (0.19)
-0.56** (0.16)
-0.56** (0.16)
-0.54** (0.17)
-0.33** (0.14)
-0.34 (0.28)
Share population 18-64 which is immigrant <12 yrs education; t-10 0.64**
(0.34) 0.73** (0.23)
1.09** (0.21)
1.09** (0.21)
1.06** (0.24)
0.86** (0.20)
1.03** (0.23)
immigrant 12 yrs education; t-10 -0.26 (0.62)
0.18 (0.68)
0.04 (0.64)
0.05 (0.65)
0.05 (0.64)
0.37 (0.57)
1.32 (1.30)
immigrant > 12 yrs education; t-10 0.65 (0.70)
0.57 (0.62)
1.00* (0.57)
0.99* (0.57)
0.95 (0.58)
0.64 (0.47)
-0.48 (1.06)
Unemployment rates; t-10 -- Yes Yes Yes Yes Yes Yes Share native population age 11-17; t-10 -- Yes Yes Yes Yes Yes Yes BEA regions*year -- -- Yes Yes Yes Yes Yes Share workers in agriculture 1940*year -- -- Yes Yes Yes Yes Yes Share white natives 21-27 less than 12 years school 1940*year
-- -- Yes Yes Yes Yes Yes
Outcome adjusted for race and ethnicity -- -- -- Yes Yes Yes Yes Log personal income per capita; t-10 -- -- -- Yes -- -- R2 0.96 0.97 0.98 0.98 0.98 0.86 -- Observations 324 270 Notes: The dependent variable is the share of native-born blacks age 21-27 who have completed 12 years of education, adjusted at the individual level for age and sex, and also for Mexican, Cuban, Puerto Rican and other Hispanic in columns 4-7. Estimation is by weighted least squares columns 1-6, and two-stage least squares column 7, with weights w the inverse of the squared standard errors on the state-year interaction coefficient in the individual regression for columns 1-5, and 1/(1/wt+1/wt+10) for columns 6 and 7. All specifications include year dummies; fixed effects specifications also include state dummies. The dependent variable is based on 1950-2010 data, the independent variables on data from 1940-2000. The instruments in column 6 are based on the 1940 distribution of immigrants from different countries (see text). Standard errors are clustered by state and reported in parentheses.

Table 8: Effects of immigrants by age and education on native Hispanics’ probability of completing 12 years education (1) (2) (3) (4) (5) (6) (7) Fixed effects 10-year differences
WLS 2SLS Share population 11-17 which is immigrant; t-10
-0.18 (0.27)
-0.39 (0.29)
-0.54** (0.27)
-0.49* (0.26)
-0.25 (0.30)
-0.26 (0.21)
-0.58 (0.40)
Share population 18-64 which is immigrant < 12 years education; t-10 0.74
(0.48) 1.18** (0.51)
0.35 (0.46)
0.48 (0.49)
0.29 (0.50)
-0.39 (0.43)
-0.13 (0.52)
immigrant 12 years education; t-10 2.40 (1.35)
1.15 (1.17)
-0.67 (0.83)
-0.43 (0.79)
-0.30 (0.84)
0.17 (0.87)
-3.05* (1.80)
immigrant > 12 years education; t-10 -1.68 (1.28)
-0.74 (1.06)
2.27** (0.79)
1.87** (0.75)
1.30* (0.79)
1.67** (0.80)
2.62** (1.25)
Unemployment rates; t-10 -- Yes Yes Yes Yes Yes Yes Share of native pop age 11-17; t-10 -- Yes Yes Yes Yes Yes Yes BEA region trends -- -- Yes Yes Yes Yes Yes Share agricultural workers 1940*year -- -- Yes Yes Yes Yes Yes Share white natives 21-27 less than 12 years school 1940*year
-- -- Yes Yes Yes Yes Yes
Outcome adjusted for race and ethnicity -- -- -- Yes Yes Yes Yes Log personal income per capita; t-10 -- -- -- -- Yes -- -- R2 0.91 0.91 0.94 0.94 0.94 0.58 -- Observations 332 283 Notes: The dependent variable is the share of native—born Hispanics age 21-27 who have completed 12 years of education, adjusted at the individual level for age and sex, and also for black, Mexican, Cuban, Puerto Rican and other Hispanic in columns 4-7. Estimation is by weighted least squares columns 1-6, and two-stage least squares column 7, with weights w the inverse of the squared standard errors on the state-year interaction coefficient in the individual regression for columns 1-5, and 1/(1/wt+1/wt+10) for columns 6 and 7. All specifications include year dummies; fixed effects specifications also include state dummies. The dependent variable is based on 1950-2010 data, the independent variables on data from 1940-2000. The instruments in column 8 are based on the 1940 distribution of immigrants from different countries (see text). Standard errors are clustered by state and reported in parentheses.
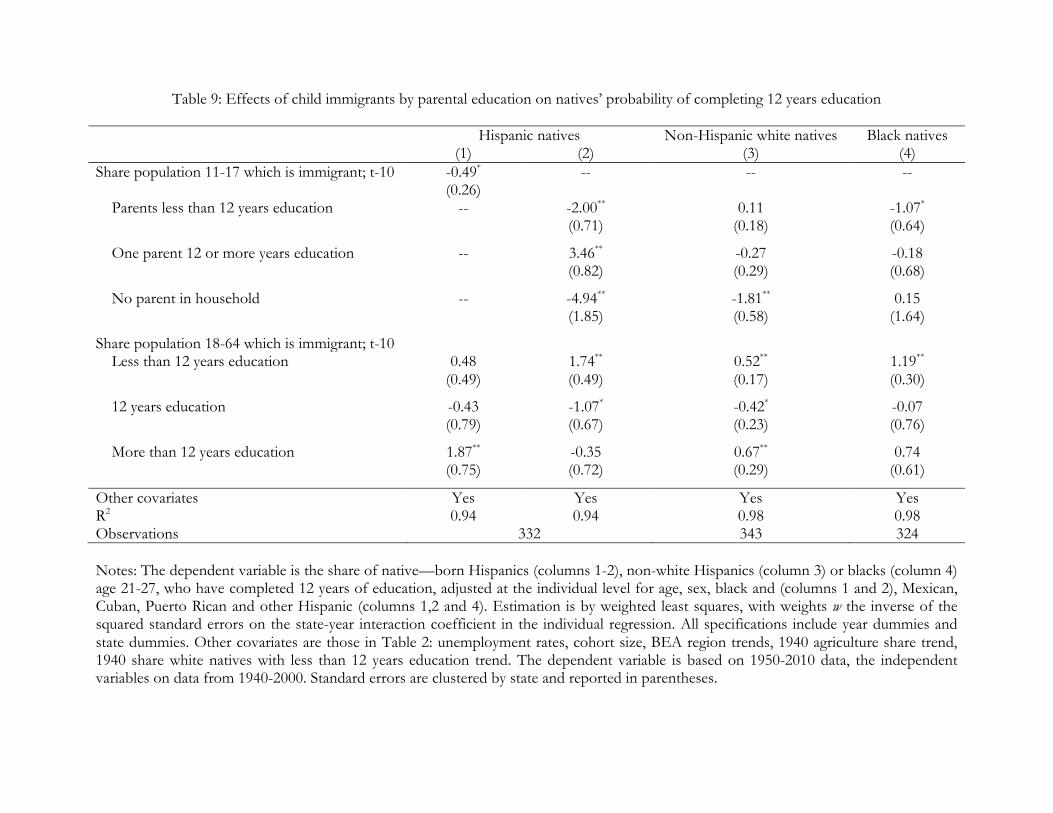
Table 9: Effects of child immigrants by parental education on natives’ probability of completing 12 years education Hispanic natives Non-Hispanic white natives Black natives (1) (2) (3) (4) Share population 11-17 which is immigrant; t-10 -0.49*
(0.26) -- -- --
Parents less than 12 years education -- -2.00** (0.71)
0.11 (0.18)
-1.07* (0.64)
One parent 12 or more years education -- 3.46** (0.82)
-0.27 (0.29)
-0.18 (0.68)
No parent in household -- -4.94** (1.85)
-1.81** (0.58)
0.15 (1.64)
Share population 18-64 which is immigrant; t-10 Less than 12 years education 0.48
(0.49) 1.74** (0.49)
0.52** (0.17)
1.19** (0.30)
12 years education -0.43 (0.79)
-1.07* (0.67)
-0.42* (0.23)
-0.07 (0.76)
More than 12 years education 1.87** (0.75)
-0.35 (0.72)
0.67** (0.29)
0.74 (0.61)
Other covariates Yes Yes Yes Yes R2 0.94 0.94 0.98 0.98 Observations 332 343 324
Notes: The dependent variable is the share of native—born Hispanics (columns 1-2), non-white Hispanics (column 3) or blacks (column 4) age 21-27, who have completed 12 years of education, adjusted at the individual level for age, sex, black and (columns 1 and 2), Mexican, Cuban, Puerto Rican and other Hispanic (columns 1,2 and 4). Estimation is by weighted least squares, with weights w the inverse of the squared standard errors on the state-year interaction coefficient in the individual regression. All specifications include year dummies and state dummies. Other covariates are those in Table 2: unemployment rates, cohort size, BEA region trends, 1940 agriculture share trend, 1940 share white natives with less than 12 years education trend. The dependent variable is based on 1950-2010 data, the independent variables on data from 1940-2000. Standard errors are clustered by state and reported in parentheses.
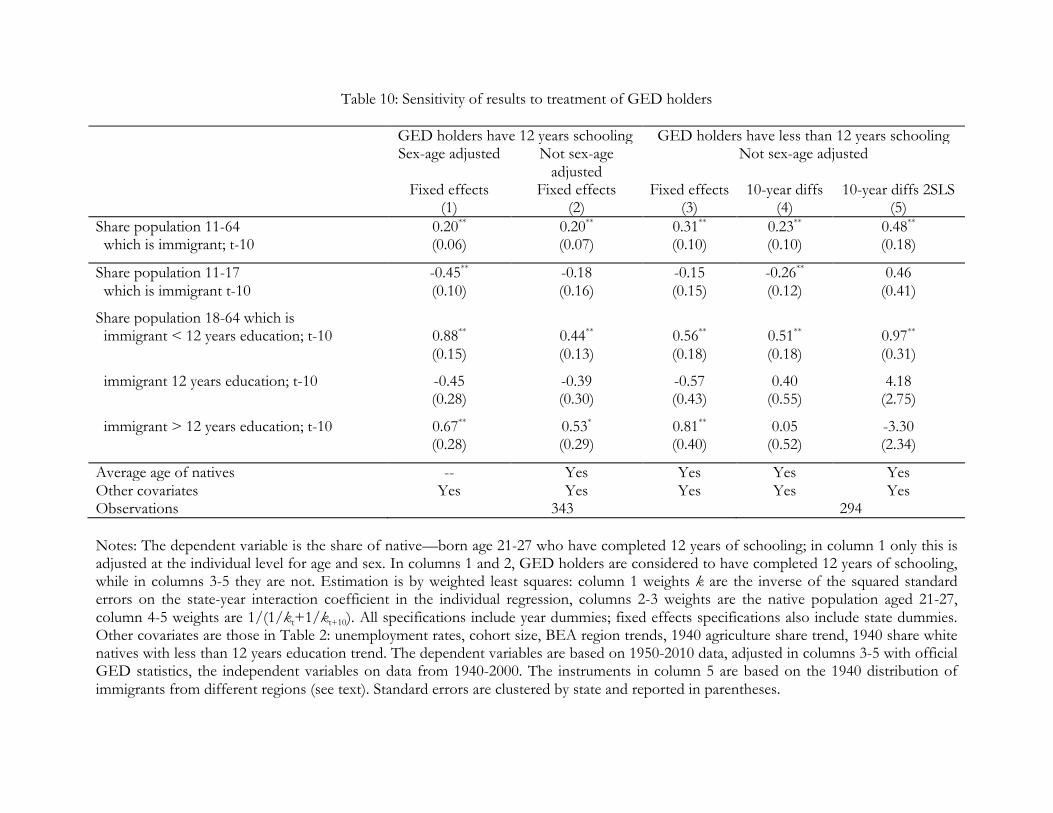
Table 10: Sensitivity of results to treatment of GED holders
GED holders have 12 years schooling GED holders have less than 12 years schooling Sex-age adjusted Not sex-age
adjusted Not sex-age adjusted
Fixed effects Fixed effects Fixed effects 10-year diffs 10-year diffs 2SLS (1) (2) (3) (4) (5)
Share population 11-64 which is immigrant; t-10
0.20** (0.06)
0.20** (0.07)
0.31** (0.10)
0.23** (0.10)
0.48** (0.18)
Share population 11-17 which is immigrant t-10
-0.45** (0.10)
-0.18 (0.16)
-0.15 (0.15)
-0.26** (0.12)
0.46 (0.41)
Share population 18-64 which is immigrant < 12 years education; t-10 0.88**
(0.15) 0.44** (0.13)
0.56** (0.18)
0.51** (0.18)
0.97** (0.31)
immigrant 12 years education; t-10 -0.45 (0.28)
-0.39 (0.30)
-0.57 (0.43)
0.40 (0.55)
4.18 (2.75)
immigrant > 12 years education; t-10 0.67** (0.28)
0.53* (0.29)
0.81** (0.40)
0.05 (0.52)
-3.30 (2.34)
Average age of natives -- Yes Yes Yes Yes Other covariates Yes Yes Yes Yes Yes Observations 343 294
Notes: The dependent variable is the share of native—born age 21-27 who have completed 12 years of schooling; in column 1 only this is adjusted at the individual level for age and sex. In columns 1 and 2, GED holders are considered to have completed 12 years of schooling, while in columns 3-5 they are not. Estimation is by weighted least squares: column 1 weights k are the inverse of the squared standard errors on the state-year interaction coefficient in the individual regression, columns 2-3 weights are the native population aged 21-27, column 4-5 weights are 1/(1/kt+1/kt+10). All specifications include year dummies; fixed effects specifications also include state dummies. Other covariates are those in Table 2: unemployment rates, cohort size, BEA region trends, 1940 agriculture share trend, 1940 share white natives with less than 12 years education trend. The dependent variables are based on 1950-2010 data, adjusted in columns 3-5 with official GED statistics, the independent variables on data from 1940-2000. The instruments in column 5 are based on the 1940 distribution of immigrants from different regions (see text). Standard errors are clustered by state and reported in parentheses.

Table 11: Results by gender for native-born Hispanics and blacks
Hispanic Natives Black natives Fixed effects 10-year differences 2SLS Fixed effects 10-year differences 2SLS Women Men Women Men Women Men Women Men (1) (2) (3) (4) (5) (6) (7) (8)
Share pop 11-64 which is immigrant; t-10
1.67** (0.61)
0.48** (0.22)
0.06 (0.72)
-0.31 (0.27)
0.42 (0.35)
0.42** (0.12)
0.52 (0.62)
0.48** (0.15)
Share population 11-17 which is immigrant; t-10
-- -- -- -0.52 (0.79)
-0.79** (0.22)
-1.03 (1.64)
-0.15 (0.40)
Parents less than 12 years edu 0.54 (2.50)
-2.27** (0.72)
-- -- -- -- -- --
One parent 12 or more years 1.08 (2.94)
4.10** (0.98)
-- -- -- -- -- --
No parent in household 5.55 (13.08)
-5.80** (2.03)
-- -- -- -- -- --
Share population 18-64 which is immigrant; t-10
Less than 12 years education 1.98 (1.29)
1.88** (0.61)
-- -- 0.52 (0.67)
1.44** (0.29)
0.97 (1.18)
1.23** (0.33)
12 years education -2.77 (2.69)
-1.02 (0.81)
-- -- 1.24 (1.96)
-0.52 (0.86)
-4.18 (6.50)
2.81 (2.04)
More than 12 years edu 2.51 (2.18)
-0.76 (0.84)
-- -- 0.01 (1.91)
1.38* (0.74)
4.23 (5.43)
-1.55 (1.69)
Other covariates Yes Yes Yes Yes Yes Yes Yes Yes Observations 326 326 276 276 314 317 263 264 Notes: The dependent variable is the share of native-born Hispanics (columns 1-4) or blacks (columns 4-8) age 21-27 of the gender specified who have completed 12 years of education, adjusted at the individual level for age and sex, and also for Mexican, Cuban, Puerto Rican, and other Hispanic, and (in columns 1-4) also for black. Estimation is by weighted least squares, with weights w the inverse of the squared standard errors on the state-year interaction coefficient in the gender-specific individual regression for columns 1, 2, 5 and 6 and 1/(1/wt+1/wt+10) for columns 3, 4, 7 and 8. All specifications include year dummies; fixed effects specifications also include state dummies. Other covariates are those listed in Table 2. The dependent variable is based on 1950-2010 data, the independent variables on data from 1940-2000. The instruments in columns 3,4,7 and 8 are based on the 1940 distribution of immigrants from different regions (see text). Standard errors are clustered by state and reported in parentheses.

Table 12: Sensitivity of results to using metro areas and restricting the sample to 1980-2010
All Natives Native non-Hispanic whites Native blacks Native Hispanics Fixed
effects 10-year
differences 2SLS
Fixed effects
10-year differences
2SLS
Fixed effects
10-year differences
2SLS
Fixed effects
10-year differences
2SLS (1) (2) (3) (4) (5) (6) (7) (8)
Share pop 11-64 which is immigrant; t-10
0.09** (0.04)
0.26** (0.09)
0.03 (0.03)
0.10 (0.08)
0.18** (0.08)
0.41 (0.27)
0.34** (0.12)
0.12 (0.15)
Share population 11-17 which is immigrant; t-10
-0.04 (0.05)
-0.18 (0.32)
0.02 (0.04)
0.16 (0.28)
-0.10 (0.18)
-0.49 (0.95)
-- --
Parents less than 12 years edu -- -- -- -- -- -- -0.06 (0.18)
--
One parent 12 or more years -- -- -- -- -- -- 0.07 (0.14)
--
No parent in household -- -- -- -- -- -- -0.33 (0.42)
--
Share population 18-64 which is immigrant; t-10
Less than 12 years education 0.10 (0.12)
0.70** (0.30)
0.06 (0.08)
0.39* (0.23)
0.19 (0.26)
1.39 (0.91)
0.13 (0.17)
--
12 years education 0.13 (0.15)
0.12 (0.86)
0.01 (0.13)
0.58 (0.71)
-0.11 (0.31)
-0.53 (2.54)
0.08 (0.19)
--
More than 12 years edu 0.12 (0.11)
0.32 (0.88)
0.00 (0.10)
-0.50 (0.77)
0.52** (0.25)
1.38 (2.62)
0.09 (0.12)
--
Other covariates Yes Yes Yes Yes Yes Yes Yes Yes Observations 390 260 390 260 390 260 390 260 Notes: The dependent variable is the share of natives age 21-27 of a racial/ethnic group who have completed 12 years of education, adjusted at the individual level for age and sex, as well as race and ethnicity (except columns 3 and 4). Estimation is by weighted least squares, with weights w the inverse of the squared standard errors on the metro area-year interaction coefficients in the individual regression (odd columns), or with weights 1/(1/wt+1/wt+10) (even columns). All specifications include year dummies and metro area dummies. Other covariates are those listed in Table 2, or their equivalent based where relevant on 1980 rather than 1940. The dependent variable is based on 1990-2010 data, the independent variables on data from 1980-2000. Standard errors are clustered by metro area and reported in parentheses. The instruments are based on the 1940 distribution of immigrants from different regions (see text). The F-statistic for the excluded instrument in the first stage is 13.9 in the upper panel (even columns). The Angrist-Pischke F-statistics for the four instruments in the first stage of the lower panel are 1.0, 3.9, 2.1 and 3.5 (even columns).
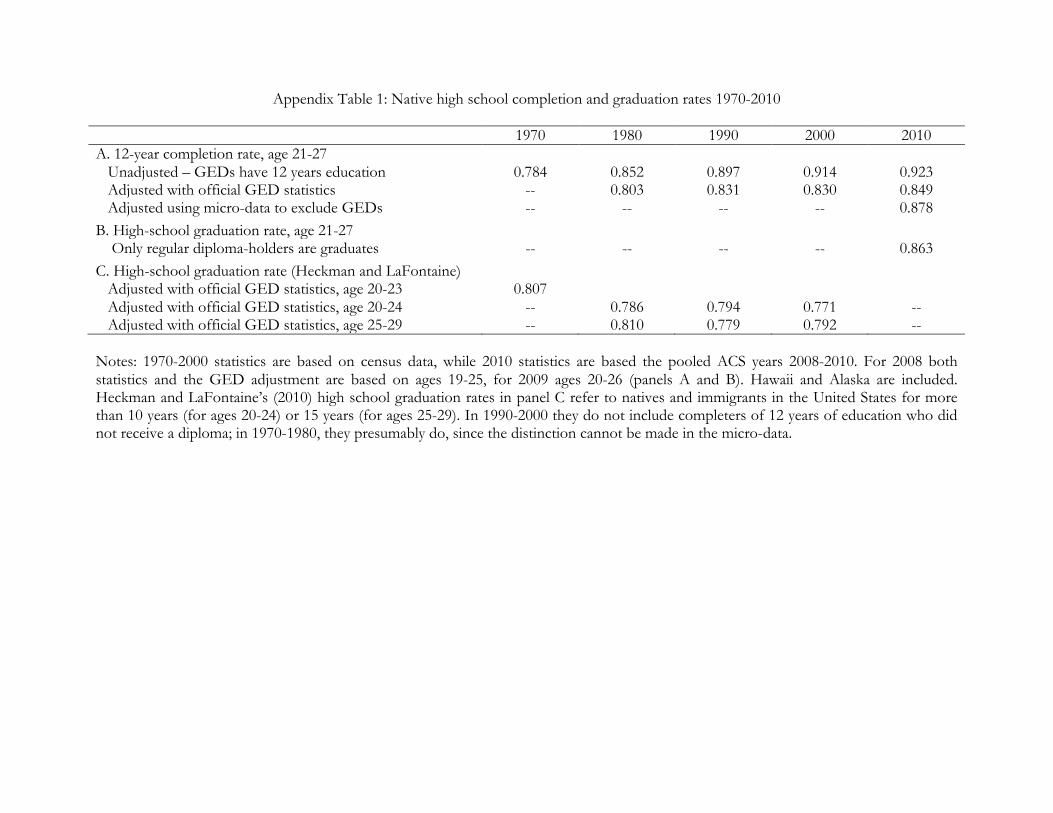
Appendix Table 1: Native high school completion and graduation rates 1970-2010 1970 1980 1990 2000 2010 A. 12-year completion rate, age 21-27 Unadjusted – GEDs have 12 years education 0.784 0.852 0.897 0.914 0.923 Adjusted with official GED statistics -- 0.803 0.831 0.830 0.849 Adjusted using micro-data to exclude GEDs -- -- -- -- 0.878 B. High-school graduation rate, age 21-27 Only regular diploma-holders are graduates -- -- -- -- 0.863 C. High-school graduation rate (Heckman and LaFontaine) Adjusted with official GED statistics, age 20-23 0.807 Adjusted with official GED statistics, age 20-24 -- 0.786 0.794 0.771 -- Adjusted with official GED statistics, age 25-29 -- 0.810 0.779 0.792 -- Notes: 1970-2000 statistics are based on census data, while 2010 statistics are based the pooled ACS years 2008-2010. For 2008 both statistics and the GED adjustment are based on ages 19-25, for 2009 ages 20-26 (panels A and B). Hawaii and Alaska are included. Heckman and LaFontaine’s (2010) high school graduation rates in panel C refer to natives and immigrants in the United States for more than 10 years (for ages 20-24) or 15 years (for ages 25-29). In 1990-2000 they do not include completers of 12 years of education who did not receive a diploma; in 1970-1980, they presumably do, since the distinction cannot be made in the micro-data.
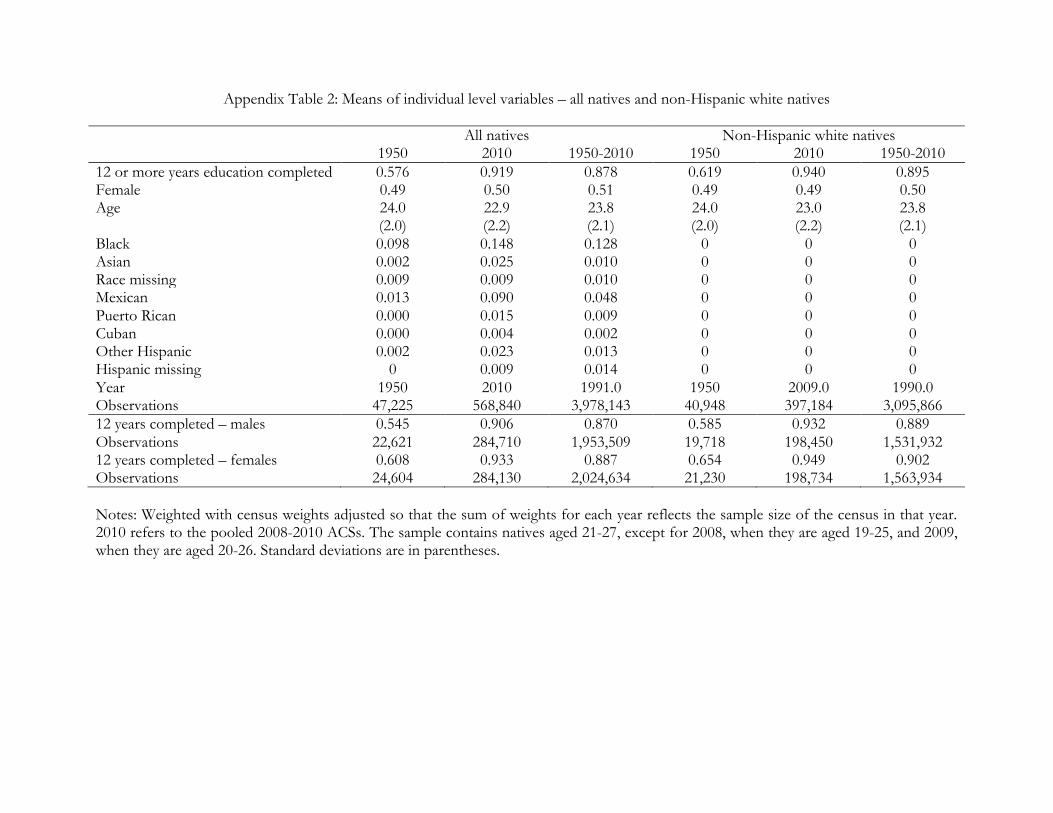
Appendix Table 2: Means of individual level variables – all natives and non-Hispanic white natives All natives Non-Hispanic white natives 1950 2010 1950-2010 1950 2010 1950-2010 12 or more years education completed 0.576 0.919 0.878 0.619 0.940 0.895 Female 0.49 0.50 0.51 0.49 0.49 0.50 Age 24.0
(2.0) 22.9 (2.2)
23.8 (2.1)
24.0 (2.0)
23.0 (2.2)
23.8 (2.1)
Black 0.098 0.148 0.128 0 0 0 Asian 0.002 0.025 0.010 0 0 0 Race missing 0.009 0.009 0.010 0 0 0 Mexican 0.013 0.090 0.048 0 0 0 Puerto Rican 0.000 0.015 0.009 0 0 0 Cuban 0.000 0.004 0.002 0 0 0 Other Hispanic 0.002 0.023 0.013 0 0 0 Hispanic missing 0 0.009 0.014 0 0 0 Year 1950 2010 1991.0 1950 2009.0 1990.0 Observations 47,225 568,840 3,978,143 40,948 397,184 3,095,866 12 years completed – males 0.545 0.906 0.870 0.585 0.932 0.889 Observations 22,621 284,710 1,953,509 19,718 198,450 1,531,932 12 years completed – females 0.608 0.933 0.887 0.654 0.949 0.902 Observations 24,604 284,130 2,024,634 21,230 198,734 1,563,934 Notes: Weighted with census weights adjusted so that the sum of weights for each year reflects the sample size of the census in that year. 2010 refers to the pooled 2008-2010 ACSs. The sample contains natives aged 21-27, except for 2008, when they are aged 19-25, and 2009, when they are aged 20-26. Standard deviations are in parentheses.

Appendix Table 3: Means of individual level variables – black and Hispanic natives Black natives Hispanic natives 1950 2010 1950-2010 1950 2010 1950-2010 12 or more years education completed 0.250 0.865 0.810 0.273 0.869 0.813 Female 0.53 0.51 0.54 0.52 0.50 0.51 Age 24.1
(2.0) 22.8 (2.2)
23.7 (2.1)
23.9 (1.9)
22.8 (2.2)
23.5 (2.1)
Black 1 1 1 0.016 0.023 0.020 Asian 0 0 0 -- -- -- Race missing 0 0 0 0.059 0.035 0.055 Mexican 0.001 0.005 0.003 0.805 0.682 0.670 Puerto Rican 0.000 0.008 0.004 0.031 0.114 0.121 Cuban 0.000 0.001 0.001 0.014 0.030 0.026 Other Hispanic 0.001 0.006 0.004 0.150 0.174 0.184 Hispanic missing 0 0.015 0.026 0 0 0 Year 1950 2009.0 1992.4 1950 2009.0 1996.8 Observations 4936 68,652 463,844 956 67,613 263,446 12 years completed – males 0.216 0.830 0.786 0.252 0.850 0.804 Observations 2236 34,556 214,262 435 33,795 128,890 12 years completed – females 0.281 0.899 0.831 0.292 0.889 0.823 Observations 2700 34,096 249,582 521 33,818 134,556 Notes: Weighted with census weights adjusted so that the sum of weights for each year reflects the sample size of the census in that year. 2010 refers to the pooled 2008-2010 ACSs. The sample contains natives age 21-27, except for 2008, when they are age 19-25, and 2009, when they are age 20-26. Standard deviations are in parentheses.
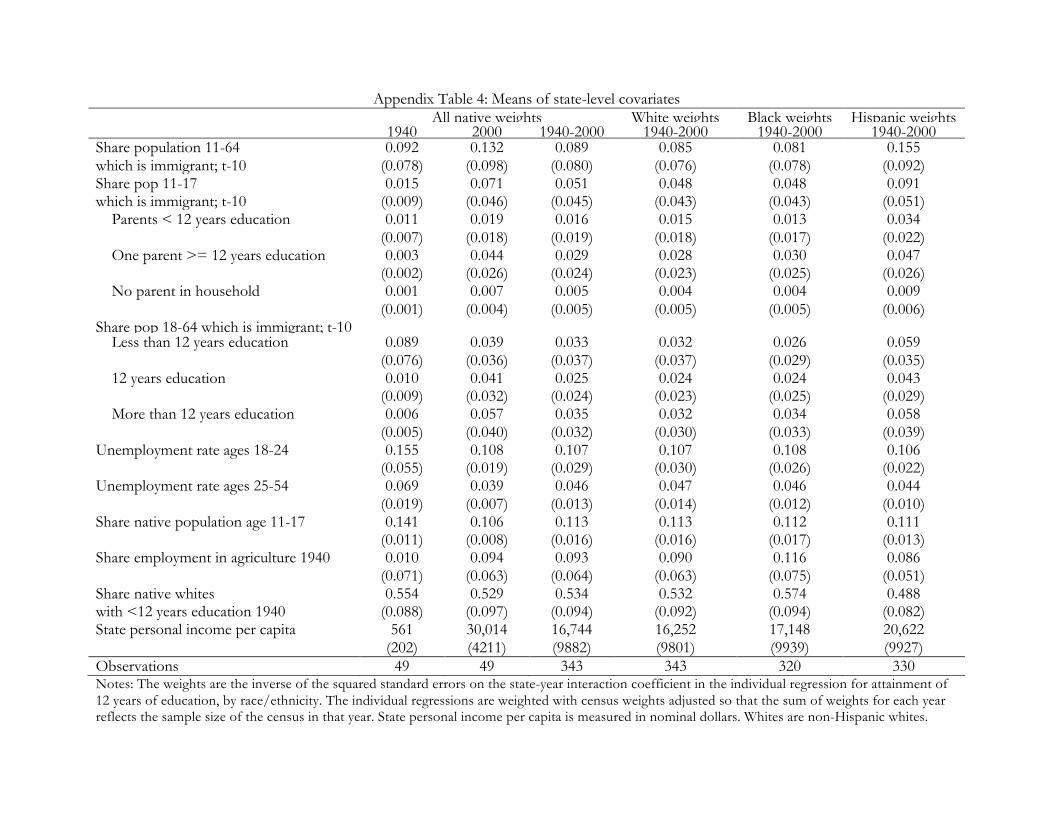
Appendix Table 4: Means of state-level covariates All native weights White weights Black weights Hispanic weights 1940 2000 1940-2000 1940-2000 1940-2000 1940-2000 Share population 11-64 which is immigrant; t-10
0.092 (0.078)
0.132 (0.098)
0.089 (0.080)
0.085 (0.076)
0.081 (0.078)
0.155 (0.092)
Share pop 11-17 which is immigrant; t-10
0.015 (0.009)
0.071 (0.046)
0.051 (0.045)
0.048 (0.043)
0.048 (0.043)
0.091 (0.051)
Parents < 12 years education 0.011 (0.007)
0.019 (0.018)
0.016 (0.019)
0.015 (0.018)
0.013 (0.017)
0.034 (0.022)
One parent >= 12 years education 0.003 (0.002)
0.044 (0.026)
0.029 (0.024)
0.028 (0.023)
0.030 (0.025)
0.047 (0.026)
No parent in household 0.001 (0.001)
0.007 (0.004)
0.005 (0.005)
0.004 (0.005)
0.004 (0.005)
0.009 (0.006)
Share pop 18-64 which is immigrant; t-10 Less than 12 years education 0.089
(0.076) 0.039
(0.036) 0.033
(0.037) 0.032
(0.037) 0.026
(0.029) 0.059
(0.035) 12 years education 0.010
(0.009) 0.041
(0.032) 0.025
(0.024) 0.024
(0.023) 0.024
(0.025) 0.043
(0.029) More than 12 years education 0.006
(0.005) 0.057
(0.040) 0.035
(0.032) 0.032
(0.030) 0.034
(0.033) 0.058
(0.039) Unemployment rate ages 18-24 0.155
(0.055) 0.108
(0.019) 0.107
(0.029) 0.107
(0.030) 0.108
(0.026) 0.106
(0.022) Unemployment rate ages 25-54 0.069
(0.019) 0.039
(0.007) 0.046
(0.013) 0.047
(0.014) 0.046
(0.012) 0.044
(0.010) Share native population age 11-17 0.141
(0.011) 0.106
(0.008) 0.113
(0.016) 0.113
(0.016) 0.112
(0.017) 0.111
(0.013) Share employment in agriculture 1940 0.010
(0.071) 0.094
(0.063) 0.093
(0.064) 0.090
(0.063) 0.116
(0.075) 0.086
(0.051) Share native whites with <12 years education 1940
0.554 (0.088)
0.529 (0.097)
0.534 (0.094)
0.532 (0.092)
0.574 (0.094)
0.488 (0.082)
State personal income per capita 561 (202)
30,014 (4211)
16,744 (9882)
16,252 (9801)
17,148 (9939)
20,622 (9927)
Observations 49 49 343 343 320 330 Notes: The weights are the inverse of the squared standard errors on the state-year interaction coefficient in the individual regression for attainment of 12 years of education, by race/ethnicity. The individual regressions are weighted with census weights adjusted so that the sum of weights for each year reflects the sample size of the census in that year. State personal income per capita is measured in nominal dollars. Whites are non-Hispanic whites.

Appendix Table 5: 1940 shares of national-level immigrants from various origins, all ages and educations Origin Share United Kingdom 0.050 Ireland 0.059 Italy 0.062 Germany 0.052 Poland 0.060 Russia 0.064 Other Europe 0.050 Mexico 0.043 Puerto Rico 0.096 Canada 0.038 Central America 0.052 South America 0.069 Other Caribbean 0.073 Cuba 0.047 China 0.058 India 0.047 Other Asia 0.045 Rest of world 0.054

Appendix Table 6: Results by gender for native-born non-Hispanic whites and all races and ethnicities
Native non-Hispanic whites Natives of all races and ethnicities Fixed effects 10-year differences 2SLS Fixed effects 10-year differences 2SLS Women Men Women Men Women Men Women Men (1) (2) (3) (4) (5) (6) (7) (8)
Share population 11-64 which is immigrant; t-10
0.23** (0.10)
0.16** (0.07)
0.35* (0.19)
0.22** (0.11)
0.29** (0.07)
0.28** (0.06)
0.35** (0.12)
0.32** (0.11)
Share population 11-17 which is immigrant; t-10
0.06 (0.27)
-0.25** (0.11)
-0.03 (0.29)
0.14 (0.18)
-0.42** (0.11)
-0.46** (0.12)
-0.25 (0.18)
-0.11 (0.21)
Share population 18-64 which is immigrant; t-10
Less than 12 years education 0.43** (0.17)
0.42** (0.15)
0.30 (0.23)
0.33** (0.14)
0.97** (0.17)
0.83** (0.15)
0.91** (0.16)
0.71** (0.17)
12 years education -0.37 (0.50)
-0.55** (0.26)
0.75 (1.26)
0.97 (0.51)
-0.17 (0.29)
-0.56* (0.31)
0.35 (0.85)
0.84 (0.77)
More than 12 years edu 0.20 (0.39)
0.75** (0.28)
0.18 (1.09)
-0.51 (0.52)
0.60** (0.30)
0.96** (0.31)
0.12 (0.72)
-0.28 (0.74)
Other covariates Yes Yes Yes Yes Yes Yes Yes Yes Observations 343 343 294 294 343 343 294 294 Notes: The dependent variable is the share of native—born non-white Hispanics (columns 1-4) or all races and ethnicities (columns 4-8) age 21-27 of the gender specified who have completed 12 years of education, adjusted at the individual level for age and sex, and also for black, Asian, Mexican, Cuban, Puerto Rican and other Hispanic in columns 5-8. Estimation is by weighted least squares, with weights w the inverse of the squared standard errors on the state-year interaction coefficients in the gender-specific individual regression for columns 1, 2, 5 and 6 and 1/(1/wt+1/wt+10) for columns 3, 4, 7 and 8. All specifications include year dummies; fixed effects specifications also include state dummies. Other covariates are those listed in Table 2. The dependent variable is based on 1950-2010 data, the independent variables on data from 1940-2000. The instruments in columns 3,4,7 and 8 are based on the 1940 distribution of immigrants from different regions (see text). Standard errors are clustered by state and reported in parentheses.