The Impact of Hurricanes Strikes on the Tourism in the...
21
The Impact of Hurricanes Strikes on the Tourism in the Caribbean Charley Granvorka Université des Antilles et de la Guyane (CEREGMIA) Eric Strobl Ecole Polytechnique & SALISES Hurricanes can potentially wreak havoc in the Caribbean, inducing considerable physical damages and potentially discouraging tourism. Given the apparent rise in the number of hurricanes in the region, possibly linked to climatic changes, over the last number of years, the potential future impact on tourism – a major industry for many nations in this part of the globe - may thus be regarded as worrisome. In this paper we attempt to quantify exactly how such hurricane strikes have affected the tourism industry in the Caribbean in the past, giving us a tool to predict potential future losses. To this end we first derive a hurricane damages index by using historical 3-hourly hurricane track data within a scientifically based wind field model which allows one to calculate the actual wind speed experienced at any locality relative to the hurricane eye of a passing or landfalling hurricane. We then employ this hurricane destruction index within a cross-country panel data context to estimate its impact on country-level tourist numbers and expenditures. Predictions concerning future hurricane activity allow us to use our results to quantify potential future loss scenarios. Key words : Hurricanes’ strikes – Tourism - Caribbean
Transcript of The Impact of Hurricanes Strikes on the Tourism in the...

The Impact of Hurricanes Strikes on the Tourism in the Caribbean
Charley Granvorka
Université des Antilles et de la Guyane (CEREGMIA)
Eric Strobl
Ecole Polytechnique & SALISES
Hurricanes can potentially wreak havoc in the Caribbean, inducing considerable physical
damages and potentially discouraging tourism. Given the apparent rise in the number of
hurricanes in the region, possibly linked to climatic changes, over the last number of years,
the potential future impact on tourism – a major industry for many nations in this part of the
globe - may thus be regarded as worrisome. In this paper we attempt to quantify exactly
how such hurricane strikes have affected the tourism industry in the Caribbean in the past,
giving us a tool to predict potential future losses. To this end we first derive a hurricane
damages index by using historical 3-hourly hurricane track data within a scientifically based
wind field model which allows one to calculate the actual wind speed experienced at any
locality relative to the hurricane eye of a passing or landfalling hurricane. We then employ
this hurricane destruction index within a cross-country panel data context to estimate its
impact on country-level tourist numbers and expenditures. Predictions concerning future
hurricane activity allow us to use our results to quantify potential future loss scenarios.
Key words : Hurricanes’ strikes – Tourism - Caribbean
2
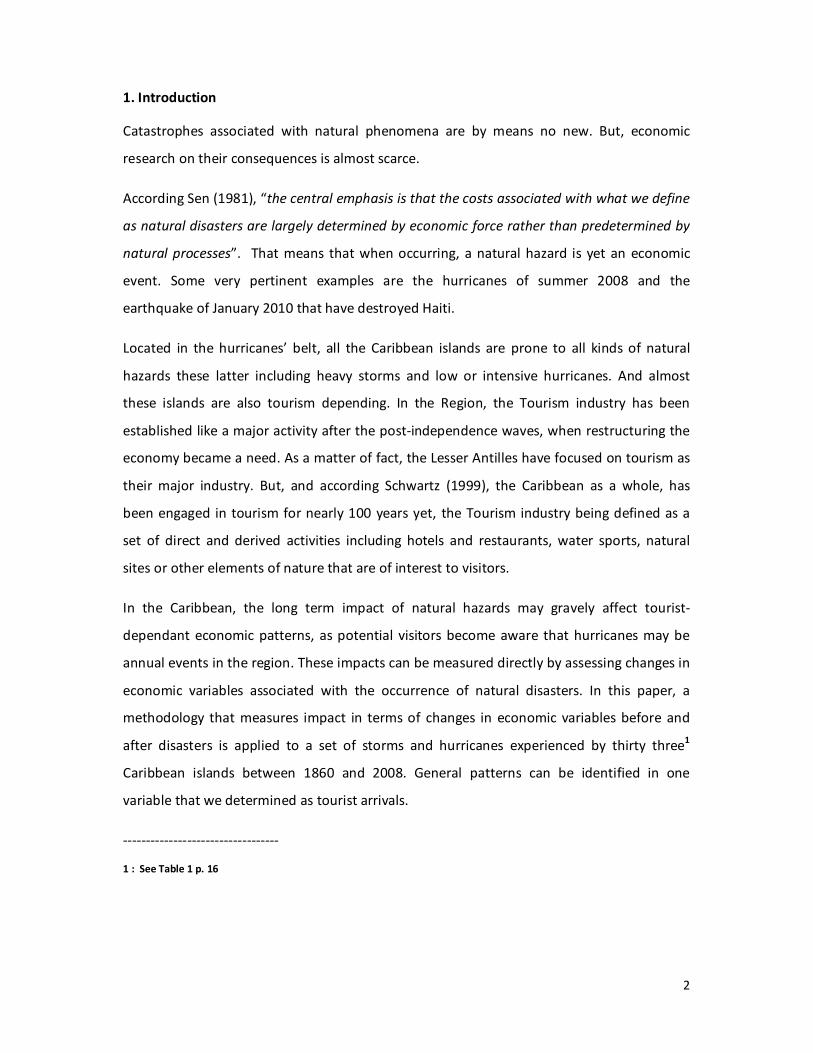
1. Introduction
Catastrophes associated with natural phenomena are by means no new. But, economic
research on their consequences is almost scarce.
According Sen (1981), “the central emphasis is that the costs associated with what we define
as natural disasters are largely determined by economic force rather than predetermined by
natural processes”. That means that when occurring, a natural hazard is yet an economic
event. Some very pertinent examples are the hurricanes of summer 2008 and the
earthquake of January 2010 that have destroyed Haiti.
Located in the hurricanes’ belt, all the Caribbean islands are prone to all kinds of natural
hazards these latter including heavy storms and low or intensive hurricanes. And almost
these islands are also tourism depending. In the Region, the Tourism industry has been
established like a major activity after the post-independence waves, when restructuring the
economy became a need. As a matter of fact, the Lesser Antilles have focused on tourism as
their major industry. But, and according Schwartz (1999), the Caribbean as a whole, has
been engaged in tourism for nearly 100 years yet, the Tourism industry being defined as a
set of direct and derived activities including hotels and restaurants, water sports, natural
sites or other elements of nature that are of interest to visitors.
In the Caribbean, the long term impact of natural hazards may gravely affect tourist-
dependant economic patterns, as potential visitors become aware that hurricanes may be
annual events in the region. These impacts can be measured directly by assessing changes in
economic variables associated with the occurrence of natural disasters. In this paper, a
methodology that measures impact in terms of changes in economic variables before and
after disasters is applied to a set of storms and hurricanes experienced by thirty three1
Caribbean islands between 1860 and 2008. General patterns can be identified in one
variable that we determined as tourist arrivals.
----------------------------------
1 : See Table 1 p. 16

3
Has, and to what extent, the Tourism Industry within the Caribbean been affected by
hurricanes strikes?
In this regard one should expect the impact to take place on two fronts a priori. On the one
hand, there will be direct costs like the destruction of infrastructure and coastal degradation,
which will make the quality of the location as a tourist destination in question lower, at least
in the short run. Related to this, on the other hand, one might anticipate hurricanes strikes
increasing the subjective perceived probability of future hurricanes, further discouraging
tourists on the margin from choosing the affected country relative to alternatives, as well as
reducing future investment in the tourist industry. Even if tourist industry is not affected in
terms of direct damages or perceived probability or reoccurrence, if a hurricane affects
other sectors of the economy, such as agriculture or manufacturing, then there may
nevertheless be spill over effects through increased prices. As a consequence, wages could
further reduce the profit margin of tourist enterprises.
There is also a general consensus stating that the effects due to a hurricane in terms of
subsequent structural damage and storm surge in any location is intrinsically linked to the
wind generated by the storm at that point2 . Thus, estimating the maximum wind
experienced in any location can circumvent the need for difficult to obtain ex post
information on damages and cost occurred. One may want to note in this regard that this
approach of using pre-defined information of a natural disaster event to proxy its impact has
recently not only gained popularity in academic circles3 but also appears to have generated
interest among policy makers. For instance, the recently established Caribbean Catastrophe
Risk Insurance Facility set up by the World Bank now uses the maximum wind speed of a
hurricane to partially determine the amount of funds to disperse in the case of a hurricane
strike within the region for participating countries.
The contribution of this paper is to provide for the first time comprehensive estimates of
tourism losses for the Caribbean region.
------------------
2. : See Yang, D. (2007). “Coping with Disaster: The Impact of Hurricanes on International Financial Flows, 1970-2002”,
Advances in Economic Analysis & Policy (B.E. Press), forthcoming.
3. : The well known EM-DAT database does compile an historical account of natural disasters worldwide. However, a closer
comparison of the hurricane events contained within this data with actual events that have taken place reveals
considerable holes and inconsistencies. See Bluedorn, J.C. (2005). “Hurricanes: Intertemporal Trade and Capital Shocks”,
Nuffield College Economics Paper 2005-W22.

4
Moreover, rather than using measurement prone ex post loss data or simple incidence
proxies of the disaster events - as is prominent in essentially all of the literature cited above -
we will here also use ex ante data on the nature of the striking hurricanes to develop a proxy
of damages incurred that will arguably provide a much more accurate measure of large
exogenous negative shocks to the tourism industry.
The remainder of the paper is as follows: Section 2 presents the Caribbean tourism context,
Section 3 reviews the literature related to the tourist demand. Section 4 presents the data,
methodology and results while Section 5 concludes.
2. The Tourism within a Caribbean and vulnerable environment
Tourism is dominant in the Caribbean which is in fact the most-tourism penetrated region in
the world as Tourism is reported to be the major earner of foreign exchange in near all the
Caribbean islands. According to the latest comprehensive reports for the Caribbean
published by the World Travel and Tourism Council (WTTC, 2004,2009), travel and tourism
demand in the region amounted to US$ 40.3 billion in 2004 (out of US$ 5.5 trillion worldwide
or 0.7 % of the total), and is expected to rise to US $ 81.9 billion by 2014. By this indicator,
the largest travel and tourism economies in the Caribbean are Puerto Rico (22.4 % of total
regional demand), Dominican Republic accounted for 12.9 %, Cuba rose up to 12 %, the
Bahamas reached, 9 % and Jamaica 8.2 %. These five destinations accounted for almost two
thirds of the total regional market demand. In terms of output generation, based on figures,
three islands gained 70 % of GDP where growth has been fuelled by travel and tourism.
These islands are British Virgin Islands, Antigua and Barbuda and Anguilla. In islands like
Aruba, Barbados and Bahamas, the tourism industry accounted for 50 to 70 % in GDP and in
others as shown by the following histogram (IMF source, 2008).
Tourism part in GDP in the Caribbean for 2004
0
10
20
30
40
50
60
70
80
90
Angu
illa
Ant ig
ua &
Bar
buda
Arub
a
Baham
as
Barb
ados
Belize
Berm
uda
British
Virg
in Is
land
s
Cay
man
Island
s
Cuba
Cur
açao
Domin
ica
Dom
inican
Rep
ublic
Grenad
a
Gua
deloup
e
Guy
ana
Haiti
Jam
aica
Mar
tiniqu
e
Mon
tser
rat
Puerto
Rico
Saba
Saint
Eusta
tius
Saint K
itts
& Nev
is
Saint L
ucia
Saint M
aarte
n
Saint V
ince
nt &
the
Grena
dine
s
Trinid
ad &
Tob
ago
Turks
& Cai
cos
Islan
ds
U.S V
irgin
Isla
nds
Série1
5
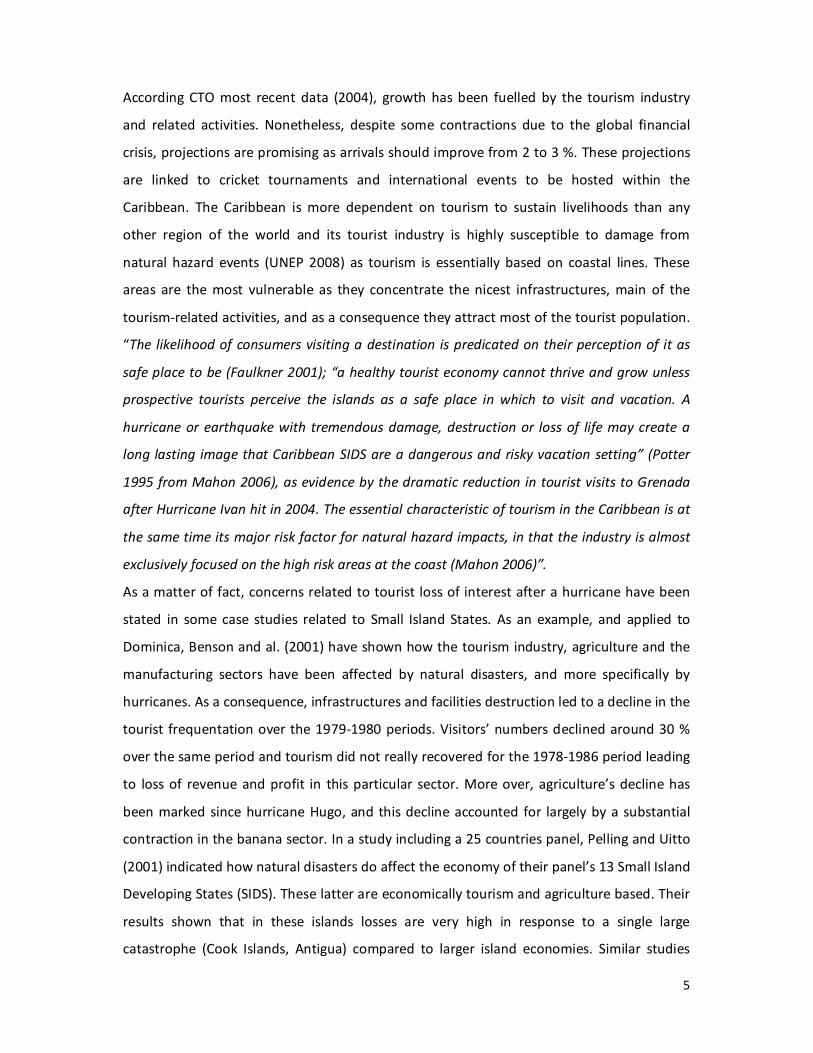
According CTO most recent data (2004), growth has been fuelled by the tourism industry
and related activities. Nonetheless, despite some contractions due to the global financial
crisis, projections are promising as arrivals should improve from 2 to 3 %. These projections
are linked to cricket tournaments and international events to be hosted within the
Caribbean. The Caribbean is more dependent on tourism to sustain livelihoods than any
other region of the world and its tourist industry is highly susceptible to damage from
natural hazard events (UNEP 2008) as tourism is essentially based on coastal lines. These
areas are the most vulnerable as they concentrate the nicest infrastructures, main of the
tourism-related activities, and as a consequence they attract most of the tourist population.
“The likelihood of consumers visiting a destination is predicated on their perception of it as
safe place to be (Faulkner 2001); “a healthy tourist economy cannot thrive and grow unless
prospective tourists perceive the islands as a safe place in which to visit and vacation. A
hurricane or earthquake with tremendous damage, destruction or loss of life may create a
long lasting image that Caribbean SIDS are a dangerous and risky vacation setting” (Potter
1995 from Mahon 2006), as evidence by the dramatic reduction in tourist visits to Grenada
after Hurricane Ivan hit in 2004. The essential characteristic of tourism in the Caribbean is at
the same time its major risk factor for natural hazard impacts, in that the industry is almost
exclusively focused on the high risk areas at the coast (Mahon 2006)”.
As a matter of fact, concerns related to tourist loss of interest after a hurricane have been
stated in some case studies related to Small Island States. As an example, and applied to
Dominica, Benson and al. (2001) have shown how the tourism industry, agriculture and the
manufacturing sectors have been affected by natural disasters, and more specifically by
hurricanes. As a consequence, infrastructures and facilities destruction led to a decline in the
tourist frequentation over the 1979-1980 periods. Visitors’ numbers declined around 30 %
over the same period and tourism did not really recovered for the 1978-1986 period leading
to loss of revenue and profit in this particular sector. More over, agriculture’s decline has
been marked since hurricane Hugo, and this decline accounted for largely by a substantial
contraction in the banana sector. In a study including a 25 countries panel, Pelling and Uitto
(2001) indicated how natural disasters do affect the economy of their panel’s 13 Small Island
Developing States (SIDS). These latter are economically tourism and agriculture based. Their
results shown that in these islands losses are very high in response to a single large
catastrophe (Cook Islands, Antigua) compared to larger island economies. Similar studies

6
have also been led in the British Virgin Islands (1998), and the U.S. Virgin Islands by their
Department of Disaster Management in collaboration with CDERA. The economy of St. Kitts
and Nevis experienced strong growth for most of the 1990s but hurricanes in 1998 and 1999
contributed to a sharp slowdown. Real economic growth was 0.75 % in 2002 after a decline
of 4.3 % in 2001 manufacturing and hotels and restaurants also recorded significant declines
of 4.01 and 9.89 % respectively.
Section 3. Literature review and demand model
While there are a number of case studies of the effect of a particular hurricane strike within
the Caribbean, there is of date no comprehensive statistical analysis that provides any
quantitative estimates of the impact on the tourism industry of an affected island across the
Caribbean. For example, Sahely (2005) examines tourism demand in three major non-
banana producing countries (Anguilla, Antigua and Barbuda, and St. Kitts and Nevis) and
finds no negative effects of hurricanes, although it must be noted that the author only used
hurricane incidence dummies and thus abstracted from differences in hurricane strengths
and destruction. While there is no other econometric analysis of the impact of hurricanes on
tourism outside the Caribbean region that we are aware of, there are a few studies on other
types of disasters. For instance, examining the case of an earthquake in Taiwan, Huang and
Min (2002) find that it took the tourism industry at least a year to recover. Also, Hultkrantz
and Olsson (1997) found that the Chernobyl unclear accident caused losses of 2.5 billion SEK
in revenues from incoming tourism. Moreover, there is also a relatively larger literature of
the effects of terrorism attacks on tourism, which can similarly be viewed as an exogenous
shock to the industry. Most of these seem to similarly find a significant negative impact; see,
for instance, Sloboda (2003) and Pizzam and Fleischer (2002).
Tourism demand is defined as the share of the expenditure of each sending country to the
total expenditures on tourism in the receiving country (Aslan and al. 2009). So the tourism
demand may be written as follows and according to Witt and Witt (1992), “tourism is a
luxury good with an expected income elasticity of demand above unity”.
V i,t = Tourism expenditure in the sending country (1)
Total tourism expenditure in the destination country

7
There are different factors liable to affect tourism demand, and the specifications vary with
regard to the country considered. They may be the four “S” (Sea, Sex, Sun and Sand), sport
or cultural events, relative prices, per capita income, supply factor, airlines. But the studies
generally consider variables related to economic factors i.e the income level in the source
country, relative prices in the origin and destination countries, supply in the recipient
country and random factors related to external shocks such as hurricanes and terrorists
attacks. If we consider the more common variable used by studies, i.e the per capita income,
thus the demand dynamic is of the form:
Yit = GDPit
CPIi,t POPi,t (2)
where GDP is the Gross Domestic Product, POP, the Total Population and CPI the Consumer
Price Index from the origin country.
The demand for tourism has been examined from different variables as tourist expenditure,
length of stay, sport and/or cultural events or number of arrivals. Estimating tourism
demand in Spain, Gonzales and Moral (1995) considered three determinant factors: tourists
arrivals, length of stay and their daily average expenditure. This latter also seems to be the
more accurate for other researchers as Cunha (2001), Tse (1999), Lathiras and Siriopoulos
(1998). But, focusing on arrivals leads to ignore the length of stay as well the expenditure
average. The reason is that the number of arrivals seems to be the more prominent variable
in a demand function. According to Lim (1997,2006) common dependent variables used in
tourism models include the number of visitors (arrivals and/or departures to a destination)
and/or expenditures and/or receipts, travel exports and/or imports, tourist length of stay,
nights spent at tourist accommodations, and other. She found that tourist arrivals/or
departures are the most common dependent variables used. If other studies use the number
of nights in the recipient country as a dependant variable in tourism function demand,
(Ledesma-Rodriguez and Navarro-Ibanez, 2001) the literature seems to consider the number
of arrivals as the more prominent variable.
When examining price, it is through the relative price between the origin and the destination
countries, as price elasticity do vary across countries. Crouch (1994) “examine the

8
importance of price movements using competitor-based and customer-based indices of the
real effective exchange rate. We also investigate whether oil price changes influence tourism
demand, since they would clearly affect the cost of transportation” as unexpected signs.
Relative price is given by the ratio of the price index level of the receiving country and the
sending country adjusted by the bilateral exchange rate between the Caribbean countries
and the rest of the world. So the third equation comes as :
Pi,t = CPI T,t (3)
CPIi,t EX I,t
The inclusion of the supply factor as a determinant of the tourism demand has been found
rather scarce in studies. But, applied to Portugal, Proenca and Soukiazis (2005) found that
only accommodation capacity related to airlines flying to destination is important. At least,
the random variable or the exogenous shock liable to affect tourism demand such as sport
and/or cultural events and hurricanes are considered to be of transitory influence over the
number of arrivals. The model of the demand could therefore be of the form:
V i,t = αt + β1 1nV it-1 + β2 1nY i,t + β3 1nPi,t + β4 1n St +β5 1n PIt + β6 D* +εi,t (4)
Where Vit is the tourist expenditure ratio in the recipient country,
Yi,t the real per capital income of the origin country,
Pit the relative price between the two countries,
St, is the accommodation capacity of the destination country
PIt the public investment ratio in the destination country
D* is an exogenous shock such as hurricane
ε is the stochastic error
The empirical literature indicates that the specifications generally used in estimate the
demand function of tourism is linear and non linear functions. But it also indicates that
privilege may be given to a double log functional form as the results are clearer as so the
estimated coefficients through the demand elasticity.
Section 4. Data and Summary Statistics
Hurricane strikes

9
A tropical cyclone is a meteorological term for a storm system which forms almost
exclusively in tropical regions of the globe. Tropical storms in the North Atlantic and the
North East Pacific region, as we study here, are referred to as hurricanes if they are of
sufficient strength1 and their season can start as early as the end of May and last until the
end of November. In terms of its structure, a hurricane will typically harbor an area of
sinking air at the center of circulation, known as the ‘eye, where weather in the eye is
normally calm and free of clouds, though the sea may be extremely violent.2 Outside of the
eye curved bands of clouds and thunderstorms move away from the eye wall in a spiral
fashion, where these bands are capable of producing heavy bursts of rain, wind, and
tornadoes. Hurricane strength tropical cyclones are normally about 483 km wide, although
this can vary considerably.
Damages due to hurricanes typically take a number of forms. Firstly, their strong winds may
cause considerable structural damage to crops as well as buildings. Secondly, the heavy
rainfall can result in extensive flooding and, in sloped areas, landslides. Finally, the high
winds pushing on the ocean’s surface cause the water near the coast to pile up higher than
the ordinary sea level, resulting in storm surges. The flooding inland due storm surges
generally occurs as early as 3-5 hours before arrival of hurricane and is often its most
damaging aspect, causing severe property damage and destruction and salt contamination
of agricultural areas.3 One may also want to note that hurricanes lose their strength as they
1 Generally at least 119 km/hr.
2 National Weather Service (October 19, 2005). Tropical Cyclone Structure. JetStream - An Online School for
Weather. National Oceanic & Atmospheric Administration.
3 Yang (2007).
10
of agricultural areas.4 One may also want to note that hurricanes lose their strength as they
move over land.
While the extent of potential damages caused by hurricanes may depend on many factors,
such as slope of the continental shelf and the shape of the coastline in the landfall region in
the case of storm surges, it is typically measured in terms of wind speed. A popular
classification has been the Saffir-Simpson (SS) Scale, where values from 1 through 5
correspond to wind speeds of 119-153 km/hr, of 154-177 km/hr, of 178-209 km/hr, of 210-
249 km/hr, and 250+ km/hr, respectively. In this regard, it is generally agreed that
considerable damages only occur once a hurricane reaches a strength of 3 on the SS scale in
approaching the coast and/or making landfall.5
Our hurricane wind damage index is based on being able to estimate local wind speeds at
any particular locality where a hurricane strength tropical storm directly passes over or
nearby. To do so we rely on the meteorological wind field model developed by Boose et al
(2004)6, which provides estimates of wind field velocity at any point relative to the ‘eye’ of
the hurricane. This model, based on Holland’s well known equation for cyclostrophic wind
and sustained wind velocity7, estimates wind speed at any point P to be:
4 Yang (2007).
5 For instance, for the United States Pielke et al (2008) that over 85% of total damages are due to hurricanes of
strength 3 and above, although these have only comprised 24 per cent of all U.S. landfalling tropical cyclones.
Similarly Vickery et al (2006) show using the loss functions of the HAZUS-MH model that loss ration is minimal
for wind speeds below 177 km/hr.
6 This wind field model was, for instance, verified by the authors on data for Puerto Rico.
7 See Holland (1980).

11
( )( )2
1
1exp2
sin1
−
−−=
B
m
B
mhm
F
R
R
RVTSVGFV (1)
where Vm is the maximum sustained wind velocity anywhere in the hurricane , T is the
clockwise angle between the forward path of the hurricane and a radial line from the
hurricane center to the point of interest, P, Vh is the forward velocity of the hurricane, Rm is
the radius of maximum winds, R is the radial distance from the center of the hurricane to
point P, and G is the gust wind factor. The relationship between these parameters and P are
depicted in Figure 1. The remaining ingredients, F, S, and B, are scaling parameter for
surface friction, asymmetry due to the forward motion of the storm, and the shape of the
wind profile curve, respectively.
If we take as a given that the power dissipation, and hence subsequent damage, of a
hurricane is intrinsically related to its wind speed, then we can propose the following index,
WIND, of total destruction due of a storm r over its life time τ in any country i at time t:8
WINDi, r,t =
∫∑
=
τ
λ
0
,,,
1
drwV trjijt
J
j
if Vjt>177 km/hr (SS≥3) and zero otherwise (2)
Where V are estimates of local wind speed at localities j, J is the set of localities j within
country i, w are weights assigned according to characteristics of the locality to capture the
‘potential’ damage there, and λ is a parameter that relates local wind speed to the local level
of damage.9 In terms of the weights w we use the time varying share of population of each
8 In essence this is a modified version of Emanuel’s (2005) proposed destruction index.
9 Dilley et al (2005) use a wind field model, albeit a different one, and intra-national population figures to
identify local tropical cyclone hazard areas across the globe. In his study of the impact of hurricane events on
international financial aid flows, Yang (2007) uses the wind field model employed by Dilley et al (2005) to

12
individual locality j at t-1, where the underlying argument is that, even if severely damaged
by hurricane winds, sparsely populated areas are unlikely to play a significant role in the
overall macroeconomic impact of a hurricane for a country in any year. In this regard, it has
been noted by McGranaham et al (2007) that in developing countries a significant share of
the population tends to live in coastal areas, especially in small island countries, which are of
course more vulnerable to tropical storm incidence. Alternatively we will also experiment
with using the land use type of areas j to create weights w. One should note that in (2) we
focus only on wind speeds that cause significant damages, i.e., on those that that are of least
strength 3 on the SS scale, as discussed above.
An important input variable to (2) is λ, i.e., the parameter that links wind speed to its level of
destruction. In this regard Emanuel (2005) noted that both the monetary losses as well as
the power dissipation of hurricanes tend to increase as the cube of the maximum observed
wind speed rises, and hence argues that the destructiveness of a hurricane can roughly be
measured by the cubic value of its maximum observed wind speed.10
However, it should be
noted that his proposed ‘cubic’ relationship between monetary damages and wind speed is
based only on a few rudimentary calculations by Southern (1979).
In contrast Nordhaus (2006) conducts a more comprehensive statistical analysis and shows
that data for the US suggests that the relationship between wind speed and damages is
more closer to the eighth power. More specifically, he takes data on total costs and
calculate out local hurricane speeds and time invariant population weights to generate an index of hurricane
severity. Our approach in modeling hurricane destruction differs in two regards to these studies. Firstly, we
base our destruction measure on a statistically based equation of power dissipation and damages. Secondly, in
terms of implementation, we use time varying rather than time invariant population shares. Moreover, we
experiment with using local land cover type to capture differences in ‘potential’ local damage.
10 This cubic ‘regularity’ is based on a some figures contained in Southern, R. (1979).

13
maximum wind speeds for a set of 20th
century hurricanes and regresses the log of the cost
per hurricane normalized by US GDP on the logged maximum wind speed and finds a
coefficient of around 8 on wind speed. However, arguably total US GDP is unlikely to be a
good normalization for costs, since hurricanes typically only affect areas close to the coast
which constitute only a small proportion of the US. Moreover, the relative local wealth that
was affected is likely to have changed substantially over the period as coastal communities
have grown in size and income.11
Given that many of the latter hurricanes in the 20th
century were particularly strong, neglecting these features is likely to bias his estimate of λ
upward.
In order to address the shortcomings of Nordhaus’ (2006) estimates, we instead regressed
the log of the normalized cost values calculated by Pielke et al (2008) - who normalized
hurricane damages with regard to changes in inflation, population, and wealth of only the
counties affected - on the log of maximum observed wind speeds of the hurricanes in
Nordhaus’ data set, and found that the resultant coefficient implies that costs rise to the
3.8th not the 8th power of wind speed.12 Given that Emmanuel’s (2005) proposed cubic
relationship is not based on any comprehensive statistical analysis and Nordhaus’ (2005)
statistical analysis does not take into account the local nature of natural disasters, we thus
here take our estimate of 3.8 as the relatively more accurate proxy of λ and assume that is
also applicable to the Caribbean region.13
11 See Rappaport and Sachs (2003).
12 Our regression also includes a set of time dummies. Detailed results are available upon request.
13 Unfortunately no data exists to perform a similar estimation for the CCA region.

14
For data on hurricanes in the Caribbean and Central America (CCA) region14
we rely on two
data sources, the North Atlantic Hurricane database (HURDAT) and the Eastern North Pacific
Tracks File, maintained by the National Hurricane Center. The HURDAT database consists of
six-hourly positions and corresponding intensity estimates in terms of maximum wind speed
of tropical cyclones in the North Atlantic Basin over the period 1851-2008 and is the most
complete and reliable source of North Atlantic hurricanes.15
The Eastern North Pacific Tracks
File similarly consists of six-hourly positions and corresponding wind speeds of tropical
cyclones, albeit in the Eastern North Pacific Basin, which is the portion of the North Pacific
Ocean east of 140W, and is available from 1949 onwards. 16
We linearly interpolated the
positions and wind speeds between the six hourly data to obtain three hourly track data
since hurricanes can move considerable distance in just a few hours.17
Tourism Data
Our source for tourism demand is the monthly tourism data for the period 2003-2008
available online from www.onecaribbean.org, which is the official tourism business website
of the Caribbean Tourism Organisation. The data consists of information on tourism arrivals
for 33 countries/territories in the Caribbean as indicated in Tab.1 One should note that
14 The CCA region consists of 33 countries/territories. We list these in Table 1.
15 While due to differences in data collection methods for periods prior to the 1960s some weak tropical storms
may be missed, in terms of cyclones that reached hurricane density the data set can be considered essentially
to be exhaustive. For a detailed description see Elsner (2003) and Jagger and Elsner (2004).
16 As with HURDAT, in terms of tropical storms that reached hurricane intensity the data can be viewed as
essentially exhaustive; see Jarvinen et al (1998).
17 One should note that interpolating the track data to obtain more frequent observations of the tropical
cyclone is standard in the literature; see, for instance, Jagger and Elsner (2006).
15
while for most countries we have observations on all months over our sample period, for a
few there are some missing, and thus our data set consists of an unbalanced panel.
Section 5. Econometric Analysis
Our task is to econometrically determine the extent to which hurricane strikes affected the
extent of monthly tourism arrivals across Caribbean countries/territories over our sample
period, 2003-2008. Given that our dependent variable consists simple of the count of
tourists in any month, we thus need to employ a count data model. Popular choices in this
regard are the Poisson and Negative Binomial models, where the latter is normally preferred
where the data may be characterized by a significant number of outliers. Given that outliers
did not appear to be a problem in the tourism arrival data, we thus use the Poisson
specification. More specifically, we estimate the following:
Arrivalsit = α + βHURRit + γYDt + δMt + μi + ε
where i is a country subscript, t is a time subscript, HURR is our hurricane destruction index,
YD are a set of year dummies, M are a set of monthly dummies, μ is a time invariant
unobservable country specific effect, and ε is an i.i.d error term. Importantly one should
note that arguably hurricane shocks are of an exogenous nature. Thus, although we in this
preliminary analysis do not include any other explanatory variables, one can be reasonable
confident this should not result in a biased estimate of β. One possibility violating this
assumption may be that although hurricanes are not strictly predictable, there are clearly
spatial patterns to likelihood. As a matter of fact, a large climatological literature is devoted
to estimating their spatial return probabilities. If potential tourists have some, even
imperfect, information as to what the return probabilities are, then some destinations may

16
be relatively less visited because of such a return probability. Moreover, there may be
other country specific factors, such as geographical or climatic ones, that affect both the
attractiveness of a location and its likelihood of being subjecting to a hurricane strike. It
seems reasonable in this regard to assume that such factors would be time invariant over
our relatively short sample period and hence we run a (country) fixed effects version of the
Poisson specification above, thus purging the μ’s from the equation.
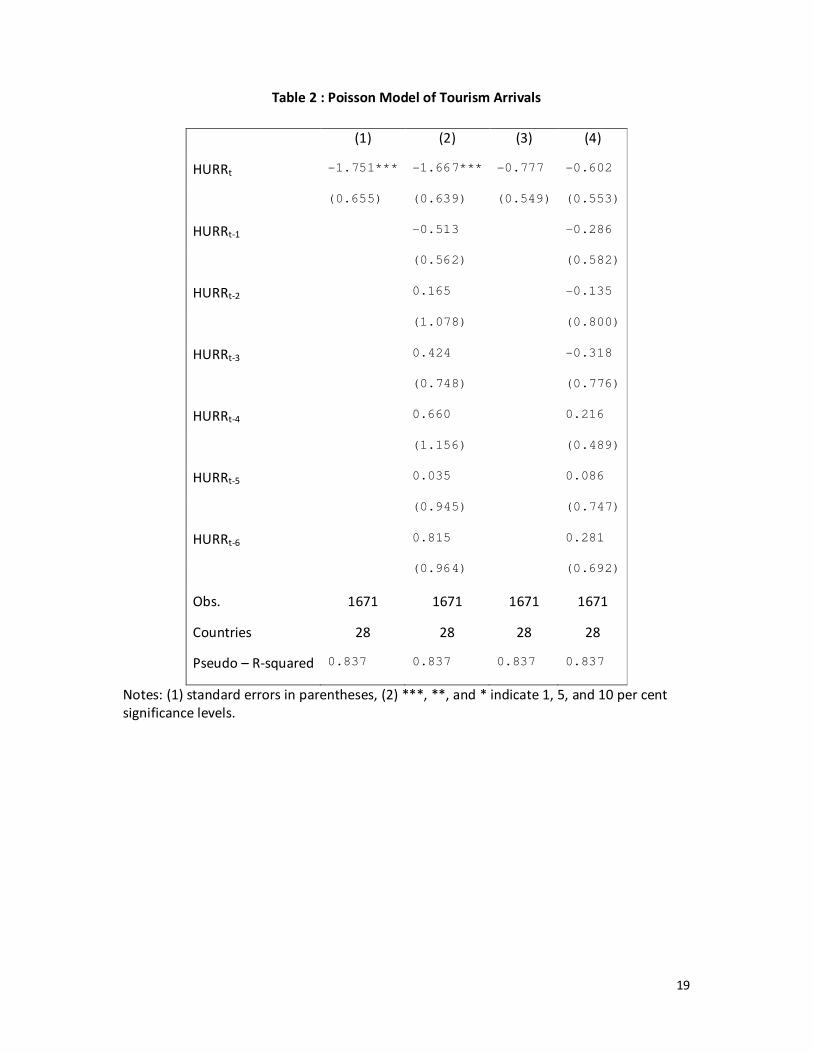
Our results of running such a fixed effects Poisson regression are shown in the first column
of Table 2, where we simply include current values of our HURR index in addition to the year
and month dummies as regressors. As can be seen, the coefficient on HURR is negative and
highly significant. As a matter of fact the coefficient suggests that an average hurricane
strike causes tourism arrivals to be about 0.98 of what it would be if not strike occurred. The
largest value of HURR over our sample period, which was for Jamaica in 2004 as a result of
Hurricane Ivan, in contrast reduced tourist arrivals by 20 per cent.
We also experimented with allowing for more longer term effects on tourist numbers by
including up to 6 lags of HURR, as shown the second column of Table 1. However, all of these
are statistically insignificant, and the coefficient on the current values is only marginally
changed. Thus our results indicate that hurricane strikes have a potentially large negative
impact but this lasts no longer than the actual month of the strike. One should note that
our index implicitly assumes that only wind speeds above the SS scale are destructive
enough to matter. To verify this we recalculated our destruction index but included all local
measured speeds that were of any strength above SS scale of1. As can be seen from the last
two columns, this result is producing a statistically insignificant coefficient on HURR, as well
as its lagged values.

17

18
Table 1 : Caribbean and Central America (CCA) Countries/Territories
Anguilla
Antigua & Barbuda
Aruba
Bahamas
Barbados
Belize
Bermuda
BVI
Cayman Islands
Cuba
Curaçao
Dominica
Dominican Republic
Grenada
Guadeloupe
Guyana
Haiti
Jamaica
Martinique
Montserrat
Puerto Rico
Saba
St. Eustatius
St. Kitts & Nevis
St. Marten
St.Vincent & the Grenadines
Trinidad & Tobago
Turks & Caicos
US Virgin Islands.
19
Table 2 : Poisson Model of Tourism Arrivals
(1) (2) (3) (4)
HURRt -1.751*** -1.667*** -0.777 -0.602
(0.655) (0.639) (0.549) (0.553)
HURRt-1 -0.513 -0.286
(0.562) (0.582)
HURRt-2 0.165 -0.135
(1.078) (0.800)
HURRt-3 0.424 -0.318
(0.748) (0.776)
HURRt-4 0.660 0.216
(1.156) (0.489)
HURRt-5 0.035 0.086
(0.945) (0.747)
HURRt-6 0.815 0.281
(0.964) (0.692)
Obs. 1671 1671 1671 1671
Countries 28 28 28 28
Pseudo – R-squared 0.837 0.837 0.837 0.837
Notes: (1) standard errors in parentheses, (2) ***, **, and * indicate 1, 5, and 10 per cent
significance levels.

20
REFERENCES
Aslan, A., Kula, F. Kaplan, M. (2009) “International Tourism demand for Turkey : A Dynamic
Panel Data Approach” in Research Journal of International Studies. Issue 9. January.
Benson, C., Clay, E. J. (2001). « Dominica: Natural Disasters and Economic Development in a
Small Island State. Disaster Risk Management Working Papers series no.2. World Bank,
Washington, DC. www.proventionconsortium.org/files/dominica.pdf
Caribbean Tourism Organisation onecaribbean.org
Crouch, G., Shaw, R. (1992), “International Tourism Demand: A Meta-Analytical Integration
of Research Findings,” in P. Johnson and B. Thomas (eds.), Choice and Demand in Tourism,
(London, UK: Cassell), pp. 175–207.
Cunha, L. (2001), “Introducao ao Turismo,” cited in S.A. Proença and E. Soukiazis (2005),
“Demand for Tourism in Portugal: A Panel Data Approach,” Discussion Paper No. 29,
(Coimbra, Portugal: Centro de Estudos da Uniao Européia).
Gonzales, P., Moral, P. (1995), “An Analysis of the International Tourism Demand in Spain,”
International Journal of Forecasting, Vol. 11, pp. 233–51.
Huang, J. And Min, J. (2002). “Earthquake Devastation and Recovery in Tourism: The Taiwan
Case”, Tourism Management, 23, pp. 145-154.
Hultkrantz, L. and Olsson, C. (1997). “Chernobyl Effect on Domestic and Inbound Tourism
in Sweden – A Time Series Analysis”, Environmental and Resource Economics, 9,l pp. 239-
258.
Ledesma –Rodriquez, F.J., Navarro-Ibanez, M. (2001), “Panel Data and Tourism: A Case
Study of Tenerife,” Tourism Economics, Vol. 7(1), pp. 75–88.
Lim, C. (1997) “An Econometric Classification and Review of International Tourism Demand
Models” in Tourism Economics, Vol. 3. pp. 69-81.
Pelling, M. Uitto, J.I. (2001) “Small Island Developing States : Natural Disaster Vulnerability
and Global Change”.
Pizam, A. and Fleischer, A. (2002). “Severety vs. Frequency of Acts of Terrorism: Which has a
Larger Impact on Tourism Demand?”
Proenca, S.A, Soukiazis, E. (2005), “Demand for Tourism in Portugal: A Panel Data
Approach,” Discussion Paper No. 29, (Coimbra, Portugal: Centro de Estudos da Uniao
Européia).
21
Sahely, Leah (2005) « Modelling Tourism Demand from Major International Markets to the
ECCU », paper presented at the 26th annual Review Seminar of the Central Bank of
Barbados.
Schwartz, R. (1999) “Pleasure Islands : Tourism and Temptation in Cuba”. Lincoln Nebraska.
University of Nebraska Press.
Sen, A. (1981)
Sloboda, B. (2003). « Assessing the Effects of Terrorism on tourism by the Use of Time Series
Methods », Tourism Economics : The Business and Finance of Tourism and Recreation, 9. Pp.
179-190.
Tse, R. (1999), “A Simultaneous Model of Tourism Flow, Spending and Receipts,” Tourism
Economics, Vol. 4(3), pp. 233–40.
Tsounta, E. (2008) “What Attracts Tourists to Paradise?” International Monetary Fund
Working Paper WP/08/27.
United Nations Environment Program (UNEP) (2008) “Marine Litter in the Wider Caribbean
Region: A Regional Overview. www.cep.unep.org
Witt, S.,Witt, C. (1995), “Forecasting Tourism Demand: A Review of Empirical Research,”
International Journal of Forecasting, Vol. 11, pp. 447–75.
World Travel and Tourism Council (WTTC, 2004,2009), www.wttc.org