The Impact of Food Stamp Program on Relative Food ...
13
Iran. Econ. Rev. Vol. 22, No. 4, 2018. pp. 1129 - 1138 The Impact of Food Stamp Program on Relative Food Consumption and Food Choices Filiz Guneysu Atasoy *1 Received: 2018, January 11 Accepted: 2018, May 11 Abstract n this paper, the effects of the Food Stamp (FS) Program (now referred to as Supplemental Nutrition Assistance Program-SNAP) on individuals’ food choices are evaluated. In other words, I examine how households' food choice or relative food consumption is changed by FS participation. For this purpose six food groups are created using 2016 Consumer Expenditure Diary Survey (CEDS) results and Consumer Price Index (CPI). Five of these food groups are food consumed at home which are bakery products, dairy products, meat and meat products, vegetables, and others. Also food consumed away from home is included as sixth group. Multinomial probit and conditional logit models are applied to analyze the data set. The analyses results show that FS can change individuals' food choices by decreasing the price effect on food since FS is a kind of income transfer which subsequently affects participants' price sensitivity. In addition, the results show that FSusage may increase the relative meat consumption of households and food consumed away from home in comparison to other food groups. Keywords: Consumption, Conditional Logit, Food Choices, Food Demand, Food Stamp Program, Multinomial Probit, SNAP. JEL Classification: D90, D91, E21, I38. 1. Introduction The United States offers numerous important governmental support programs, such as the Supplemental Nutrition Assistance Program (SNAP) (formerly known as Food Stamp Program 2 ), National School Lunch Program (NSLP), and the Special Supplemental Nutrition Program for Women, Infants and Children (WIC). The purpose of these programs is to increase food security, and more importantly the quality and quantity of food available to individuals. Considering its nutritional perspective, the WIC includes specific goods lists, such as 1. Department of Economics, Osmaniye Korkut Ata University, Osmaniye, Turkey (Corresponding Author: [email protected]). 2. Consistency of the literature, I use Food Stamp Program instead of SNAP. I
Transcript of The Impact of Food Stamp Program on Relative Food ...

Iran. Econ. Rev. Vol. 22, No. 4, 2018. pp. 1129 - 1138
The Impact of Food Stamp Program on Relative Food Consumption and Food Choices
Filiz Guneysu Atasoy*1
Received: 2018, January 11 Accepted: 2018, May 11
Abstract n this paper, the effects of the Food Stamp (FS) Program (now referred to as Supplemental Nutrition Assistance Program-SNAP)
on individuals’ food choices are evaluated. In other words, I examine how households' food choice or relative food consumption is changed by FS participation. For this purpose six food groups are created using 2016 Consumer Expenditure Diary Survey (CEDS) results and Consumer Price Index (CPI). Five of these food groups are food consumed at home which are bakery products, dairy products, meat and meat products, vegetables, and others. Also food consumed away from home is included as sixth group. Multinomial probit and conditional logit models are applied to analyze the data set. The analyses results show that FS can change individuals' food choices by decreasing the price effect on food since FS is a kind of income transfer which subsequently affects participants' price sensitivity. In addition, the results show that FSusage may increase the relative meat consumption of households and food consumed away from home in comparison to other food groups.
Keywords: Consumption, Conditional Logit, Food Choices, Food Demand, Food Stamp Program, Multinomial Probit, SNAP. JEL Classification: D90, D91, E21, I38.
1. Introduction
The United States offers numerous important governmental support
programs, such as the Supplemental Nutrition Assistance Program
(SNAP) (formerly known as Food Stamp Program2), National School
Lunch Program (NSLP), and the Special Supplemental Nutrition
Program for Women, Infants and Children (WIC). The purpose of
these programs is to increase food security, and more importantly the
quality and quantity of food available to individuals. Considering its
nutritional perspective, the WIC includes specific goods lists, such as
1. Department of Economics, Osmaniye Korkut Ata University, Osmaniye, Turkey (Corresponding Author: [email protected]). 2. Consistency of the literature, I use Food Stamp Program instead of SNAP.
I

1130 / The Impact of Food Stamp Program on Relative Food ...
milk, eggs, and vegetables. Similarly, the NSLP stipulates that each
meal for children must include vitamins A, and C, iron, calcium,
protein and less than 10% saturated fat. Hence, both the NSLP and
WIC address not only the quantity of food available but also the
quality. On the contrary to NSLP and WIC, food stamp program does
not have these types of restrictions1.
The body of literature regarding investigations of FS is broad.
Some studies indicate positive results, namely that FS participation
reduces food insecurity (FI) (Kabbani and Kmeid, 2005). Ratcliffe et
al. (2011) investigated the effectiveness of FS in reducing FI by using
a dummy endogenous variable model with instrumental variable (IV
estimator) to manage the most significant issue highlighted in the
literature which is selection bias problem. The results showed that by
using a strong IV model on nationally representative (Self Invested
Personal Pension) SIPP, FS reduced the food-related hardship of a
household. Furthermore, Mykerezi and Mills (2010) evaluated the
impact of FS on FI using the Panel Survey of Income Dynamics
(PSID) 1999 data. The authors investigated FS participants
endogenously to estimate treatment impacts as a binary choice by
using state-level errors in over payments or underpayments of FS
benefits and a one year FI scale. The results of study provided strong
positive evidence that FI may decrease at least 19% by participating in
FS.
The decrease of FI is deemed to increase participants' health.
However, some issues, such as obesity and diabetes have arisen with
program. It supplies additional food, but the goods chosen depend on
participants' preferences. In other words, FS does not restrict people's
food choices unlike the WIC or NSLP as mentioned previously.
Minnesota requested permission from the U.S. Department of
Agriculture (USDA) to prohibit the purchase of candy and soft drinks
with FS benefits (Guthrie et al., 2007). This proposal was intended to
promote diet quality by limiting the purchase of empty calories but it
was rejected. California, on the other hand, has passed a "Healthy
Purchase" pilot program. For every $1 of FS spent on fresh produce,
1. FS only has restriction about alcoholic beverage, tobacco and non-food items, such as pet foods and household supplies. For more information see: http://www.fns.usda.gov/snap/eligible-food-items.

Iran. Econ. Rev. Vol. 22, No.4, 2018 /1131
participants refunded a specific portion as a bonus under this program
(Guthrie et al., 2007). Nevertheless, no specific restrictions or
limitations exist regarding the purchasing of junk food such as candy,
soft drinks, or fatty foods.
Huang et al. (1981) conducted one of the early studies regarding FS
participants' food choices. The authors used Consumer Expenditure
Dairy Survey (CEDS) to examine the impact of FSonlow-income
families' food patterns. Their results indicated that behavior related to
the amount of food purchased by households may be influenced by
FS. These researchers focused only on the low-income group, but the
sample for current study includes different income groups.
Basiotis et al. (1983) evaluated the nutrition consumption patterns
of low-income FS receivers. They used the Engel curve and data from
1977-1978 Nationwide Food Consumption survey. The authors
applied a simultaneous equation system for the estimation of food
costs and diet component availability levels of food at home. The
results of the study showed that diet component availability level was
relatively constant across households with different income levels.
Because different income levels are addressed in the current study, I
believe it may provide more comprehensive knowledge about FS
participants' food choices than Huang et al. (1981) and Basiotis et al.
(1983) did.
Furthermore, Wilde and Ranney (2000) evaluated the mean of food
spending among FS users and found that participants spend increased
amounts within the first three days of receiving benefits. These
spending patterns represent shopping frequency and food intake
decisions over time in light of FS benefits. The researchers used a
non-linear Engel curve on CEDS data set. The results indicated that
the frequency of households' grocery shopping may be influenced by
involvement in the program.
Guthrie et al. (2007) mentioned the significance of FS participants
choosing food with high nutritional quality rather than focusing on
quantity. Their results suggested that the efficiency of the program
may be affected by economic factors such as, the budget share of FS
and food expenditure patterns of participants. Correspondingly, Wiig
and Smith (2009) investigated the relationship between low-income
women's shopping behavior and participation in FS to examine food
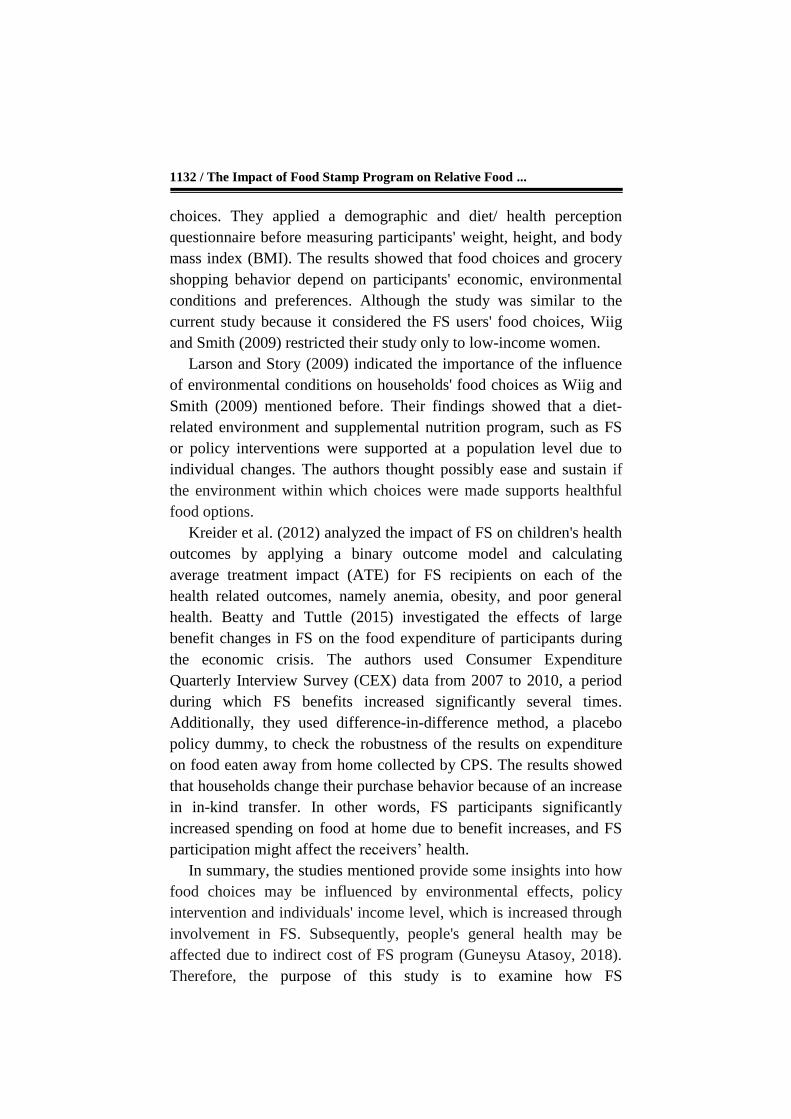
1132 / The Impact of Food Stamp Program on Relative Food ...
choices. They applied a demographic and diet/ health perception
questionnaire before measuring participants' weight, height, and body
mass index (BMI). The results showed that food choices and grocery
shopping behavior depend on participants' economic, environmental
conditions and preferences. Although the study was similar to the
current study because it considered the FS users' food choices, Wiig
and Smith (2009) restricted their study only to low-income women.
Larson and Story (2009) indicated the importance of the influence
of environmental conditions on households' food choices as Wiig and
Smith (2009) mentioned before. Their findings showed that a diet-
related environment and supplemental nutrition program, such as FS
or policy interventions were supported at a population level due to
individual changes. The authors thought possibly ease and sustain if
the environment within which choices were made supports healthful
food options.
Kreider et al. (2012) analyzed the impact of FS on children's health
outcomes by applying a binary outcome model and calculating
average treatment impact (ATE) for FS recipients on each of the
health related outcomes, namely anemia, obesity, and poor general
health. Beatty and Tuttle (2015) investigated the effects of large
benefit changes in FS on the food expenditure of participants during
the economic crisis. The authors used Consumer Expenditure
Quarterly Interview Survey (CEX) data from 2007 to 2010, a period
during which FS benefits increased significantly several times.
Additionally, they used difference-in-difference method, a placebo
policy dummy, to check the robustness of the results on expenditure
on food eaten away from home collected by CPS. The results showed
that households change their purchase behavior because of an increase
in in-kind transfer. In other words, FS participants significantly
increased spending on food at home due to benefit increases, and FS
participation might affect the receivers’ health.
In summary, the studies mentioned provide some insights into how
food choices may be influenced by environmental effects, policy
intervention and individuals' income level, which is increased through
involvement in FS. Subsequently, people's general health may be
affected due to indirect cost of FS program (Guneysu Atasoy, 2018).
Therefore, the purpose of this study is to examine how FS

Iran. Econ. Rev. Vol. 22, No.4, 2018 /1133
participation influences households' food choices or relative food
consumption.
2. Data
The Consumer Expenditure Diary Survey (CEDS) data was obtained
from a study conducted by Bureau of Labor Statistics in 2016. The
program produces quarterly data set. In this study, 1 year data were
used which included 4 quarterly data sets. It covers households'
weekly and monthly food expenditures and consumers' characteristics,
such as education, race, age, gender, and income level of individuals.
For the analysis, the data was divided into income categories, namely
low-income and high-income. For the income variable, CEDS has
different categories, so the factors were separated depending on FS
eligibility maximum income criteria. Thus, people who are eligible for
FS benefits have been categorized into low-income, and high-income
groups (1=high-income group; 0=low-income group). Similar to the
study by Huang et al. (1981), food consumed at home was categorized
into five groups:
1- Cereals and bakery products (Bakery products)
2- Meat, fish, poultry, and eggs (Meat Products)
3- Dairy (Milk and other dairy products)
4- Vegetables (Fresh fruit and veggies, Fruit production, Veggies
production)
5- Others (Sweet, nonalcoholic beverages, miscellaneous food, fats
and oils)
In addition to these five categories, food consumed away from
home was included because restaurant can be authorized to accept FS
benefits; this makes a total of 6 food groups.
The expenditure of these food groups was divided by total expenditure
before determining which of the food groups constituted the largest
percentage among others. Subsequently, the highest percentage of
group was used to identify individuals' food choice. This allowed the
determination of relative food change between different food groups.
Moreover, food quantities were obtained by using the consumer price
index and individuals' food expenditure. In the study 3,261

1134 / The Impact of Food Stamp Program on Relative Food ...
observations were used. The choices’ characteristic was price and
quantity while the choosers’ characteristics were gender, income, and
FS participation. Because FS benefits affect individuals' income levels
as an income increment would, their reaction or sensitivity to food
prices and quantity may differ (Wiig and Smith, 2009). In this study, I
did not include some variables such as race or marriage status of the
households. In an econometric analysis omitted variables can limit the
analysis results. However, FS is given any individual in a household
based on their income or disability without looking their race,
marriage status or even immigration status. For instance, in a
consisting of 4 people, households can obtain max $640 if all of them
are eligible; otherwise it is $194 per individual. Also in the literature
studies about FS generally focused on income level of users.
Therefore, in this study I only include income level of individuals.
3. Methodology
In this study, I used Conditional Logit and Multinomial Probit Model.
I gave brief explanation of these models below.
The Conditional logit model (CLM) was used with alternative-
invariant (or variant) regressors. The probability that observations
chosen to alternative j is:
𝑝𝑖𝑗 =𝑒𝑥𝑝(𝑥𝑖𝑗
′ 𝛽+𝑤𝑖′𝛾𝑗)
∑ 𝑒𝑥𝑝(𝑥𝑖𝑘′ 𝛽+𝑤𝑖
′𝛾𝑘)𝑚𝑘=1
(1)
where 𝑋𝑖𝑗 are alternative-specific regressors and wi are case specific
repressors. The conditional logit model has (j-1) sets of coefficients
( 𝛾𝑗 ) (with one set being normalized to zero) for case specific
regressors and one set of coefficients (𝛽 ) for alternative specific
regressors. The probability of choosing each alternative is 1 as total.
The Multinomial probit model (MPM) can be estimated when
there are relatively few small alternatives, like three or four, because
of computational intention with evaluating multiple integrals
(Maddalla, 1993). Since I used 6 different food groups, MPM is also
convenient for this study. The model is very similar to multinomial
logit model. The difference is that it uses the standard normal CDF.
The probability that observation selected to alternative j is;

Iran. Econ. Rev. Vol. 22, No.4, 2018 /1135
𝑝𝑖𝑗 = 𝑝(𝑦𝑖 = 𝑗) = ∅(𝑥𝑖𝑗′ 𝛽) (2)
The coefficients are different from logit models by a scale factor, but
marginal effect will be similar (Madalla, 1993; Cameron and Trivedi,
2005). Basically the differences these two models are that in a Conditional
Logit model the distribution of errors is given. Moreover, Multinomial
Probit errors identification lead to correlations between errors and it does
not need to satisfy the independence of irrelevant alternatives assumption
(IIA). Same data set was applied for these 2 methods, by this way I
expected the results of this study may interpret as more robust.
4. Analysis of Results
First the descriptive statistics, which are represented in Table 1 were
calculated. According to the results, bakery goods and dairy had the
highest monthly expenditure level of the food groups. The lowest
level of expenditure was on food consumed away from home.
Furthermore, 49% of the sample (or SNAP user) was female, and 59%
of the sample was classified as high income. To determine participant
food choices, multinomial probit and conditional logit models were
calculated from the 2016 CEDS data set. The multinomial probit
model results were given in Table 2. People were more likely to
choose food with a higher price such as cereal, meat, and vegetables in
comparison to other food. In addition, it is logical assumption that
people preferred larger quantities of food. Females were less likely
than males to choose meat and food consumed away from home with
higher prices, than the base group was. However, the quantities of
different foods purchased were not statistically significant for females.
When considering to the interaction of FS participants with price,
all estimations were negative which means FS users care less about
the price of food than non-FS users do for all kinds of food groups.
This result was accurate as FS benefits were in effect an income
increment. FS participants were more likely to purchase more meat
and food consumed away from home in comparison to the base
category. Even if FS users were more likely to choose bakery, dairy,
and vegetable products than others (sweet and nonalcoholic
beverages), this was not statistically significant, and thus couldn't be

1136 / The Impact of Food Stamp Program on Relative Food ...
evaluated. High income group were less likely to be affected by prices
across all food groups than the low-income group. Considering to high
price products mean better quality, the results was significant.
Moreover, all income*quantity estimations were negative for all food
groups; thus high-income people considered less about the quantity of
any kinds of food than the low-income group. In Table 3, the
conditional logit model results were provided and all results were
quite similar to multinomial probit model. Only the magnitude of
estimations differed slightly.
5. Conclusion
This paper used 2016 CEDS data to examine how individuals' food
choices may be altered by different choosers' characteristics, especially
participation in FS. As total 6 different food groups were used.
Huang et al. (1981) used food consumed at home, for the food
classifications in their study while, this research are included both
food consumed at home and food eaten away from home. Also
different income groups and food choices are included in the study.
By this way results may provide more comprehensive perspective of
the evaluation of food choices.
For analysis, Multinomial Probit and Conditional Logit Models
were applied. Both analyses generated quite similar results, indicating
FS participants considered less about the price of different food
groups than non-participants in comparison to the base group. The
difference between the effect of individuals' income and the effect of
FS benefits was that real income might change the effects on food
choices of both food price and food quantity. However, participating
in FS changed mainly the effect of food price. From this perspective,
it may imply that an increase in income is more reliable than using FS
benefits when people encounter different kinds of foods in markets.
This result corresponded to common sense because FS's benefits are
temporary, while a high income was considered more reliable.
Furthermore, FS changes the quantity of meat and food consumed
away from home, yet it does not have any significant effect on the
bakery, dairy and vegetable products. Overall, FS affects food
choices, and this influence is transferred through participants'

Iran. Econ. Rev. Vol. 22, No.4, 2018 /1137
sensitivity to prices, as they purchase more meat products and food
consumed away from home compared to the base group.
Appendix
Table 1: Descriptive statistics
Variable N Mean Std Dev Minimum Maximum
gender 3261 0.494327 0.500045 0 1
highincome 3261 0.592763 0.491395 0 1
Fstamp 3261 0.110089 0.313049 0 1
bakery 3261 10.3737 14.05038 0 303.67
meat 3261 17.22767 28.64452 0 535.47
Dairy 3261 8.19181 10.45895 0 108.34
veggie 3261 15.02768 19.11432 0 235.8981
other 3261 25.60772 30.0788 0 267.112
bakeryQ 3261 207.4739 281.0077 0 6073.4
meatQ 3261 9.57093 15.91362 0 297.4833
veggieQ 3261 30.05536 38.22863 0 471.7962
dairyQ 3261 9.102011 11.62106 0 120.3778
FoodAwayQ 3261 75.87251 106.8773 0 1565.12
otherQ 3261 10.24309 12.03152 0 106.8448
totalex 3261 886.8612 576.822 0 4239
bakex 3261 132.9171 164.7 0 1937.13
meatex 3261 87.16604 124.8279 0 1853.49
dairyex 3261 137.5791 143.7 0 2348
veggiex 3261 103.3132 165.5708 0 2835.51
otherex 3261 70.62611 144.1204 0 3261.11
FAHex 2261 49.60187 120.3698 0 1950.47

1138 / The Impact of Food Stamp Program on Relative Food ...
Table 2: Multinomial Probit Results
Variables Food Choices
Parameters Bakery Meat Dairy Veggies Food
Away
estimate estimate estimate estimate estimate
Constant
Price 0.0045*
0,181*
-0.051* 0.381** -0.078*
Quantity 0.131*
1.019*
0.084* 0.491* 0.375
Gender*
Price
Female 0.345* -0.105* 0.078* 0.075* -0.087*
Gender*
Quantity
Female -0.675 -0.789* 0.035 0.247 0.183
Income
*Price
High
Income
-0.907*
-0.109*
-0.165* -0.115* -0.123*
Income*
Quantity
High
Income
-0.075* -0.679* -0.705* -0.678* -1.078*
Snap*
Price
SNAP users -0.188* -0.175* 0.118 -0.257* -0.089*
Snap*
Quantity
SNAP users 0.205 1.785* 1.354 0.552 1.987*
Log likelihood Ratio = 63. 55 prob>chi2 = 0.000
* Significant at 5%. Base categories are male for gender, low income
for income category and non-SNAP users. Also for food choices,
other is chosen base category.

Iran. Econ. Rev. Vol. 22, No.4, 2018 /1139
Table 3: Conditional Logit Model Results
Variables Food Choices
Parameters Bakery Meat Dairy Veggies Food
Away
estimate
estimate
estimate
estimate estimate
Constant
Price 0.067*
0.225* -0.039* 0.242* -0.077*
Quantity 0.102*
1.185* 0.089* 0.543* 0.334
Gender*
Price
Female -0.312* -0.115* -0.092* 0.079* 0.091*
Gender*
Quantity
Female -0.612 -0.714 0.098 0.188 0.099
Income
*Price
High Income -0.103*
-0.217*
-0.068* -0.113* -0.030*
Income*
Quantity
High Income -0.081* -0.642* -0.715* -0.638* -1.065*
Snap*
Price
SNAP users -0.167* -0171* 0.215 -0.288* -0.078*
Snap*
Quantity
SNAP users 1.218 1.810* 1.336 0.478 1.984*
Log likelihood= 67.72 Prob>chi2=0.019
* Significant at 5%. Base categories are male for gender, low income
for income category and non-SNAP users. Also for food choices,
other is chosen base category.

1140 / The Impact of Food Stamp Program on Relative Food ...
References
Basiotis, P., Brown, M., Johnson, S. R., & Morgan, K. J. (1983).
Nutrient Availability, Food Costs, and Food Stamps. American
Journal of Agricultural Economics, 65(4), 685-693.
Beatty, T. K., & Tuttle, C. J. (2014). Expenditure Response to
Increases in In-kind Transfers: Evidence from the Supplemental
Nutrition Assistance Program. American Journal of Agricultural
Economics, 97(2), 390-404.
Cameron, A. C., & Trivedi, P. K. (2005). Microeconometrics:
Methods and Applications. Cambridge: Cambridge University Press.
Guneysu Atasoy, F. (2018). How Food Stamp Usage Impact on BMI:
A Quantile Regression Approach. International Journal Of Research
In Technology And Management, 4(4), 1-5.
Guthrie, J. F., Frazão, E., Andrews, M., & Smallwood, D. (2007).
Improving Food Choices-can Food Stamps Do More? Amber
Waves, 5, 46-47.
Huang, C. L., Fletcher, S. M., & Raunikar, R. (1981). Modeling the
Effects of the Food Stamp Program on Participating Households'
Purchases: An Empirical Application. Journal of Agricultural and
Applied Economics, 13(2), 21-28.
Kabbani, N. S., & Kmeid, M. Y. (2005). The Role of Food Assistance
in Helping Food Insecure Households Escape Hunger. Review of
Agricultural Economics, 27(3), 439-445.
Kreider, B., Pepper, J., Gundersen, C., & Jolliffe, D. (2009).
Identifying the Effects of Food Stamps on Child Health Outcomes
when Participation Is Endogenous and Misreported. Staff General
Research Papers, Retrived from
http://citeseerx.ist.psu.edu/viewdoc/download?doi=10.1.1.564.3885&r
ep=rep1&type=pdf.

Iran. Econ. Rev. Vol. 22, No.4, 2018 /1141
Larson, N., & Story, M. (2009). A Review of Environmental
Influences on Food Choices. Annals of Behavioral Medicine, 38(1),
56-73.
Mykerezi, E., & Mills, B. (2010). The Impact of Food Stamp Program
Participation on Household Food Insecurity. American Journal of
Agricultural Economics, 92(5), 1379-1391.
Ratcliffe, C., McKernan, S. M., & Zhang, S. (2011). How Much Does
the Supplemental Nutrition Assistance Program Reduce Food
Insecurity? American Journal of Agricultural Economics, 93(4), 1082-
1098.
Wiig, K., & Smith, C. (2009). The Art of Grocery Shopping on a Food
Stamp Budget: Factors Influencing the Food Choices of Low-income
Women as they Try to Make Ends Meet. Public Health Nutrition,
12(10), 1726-1734.
Wilde, P. E., & Ranney, C. K. (2000). The Monthly Food Stamp
Cycle: Shooping Frequency and Food Intake Decisions in An
Endogenous Switching Regression Framework. American Journal of
Agricultural Economics, 82(1), 200-213.
Wiig, K., & Smith, C. (2009). The Art of Grocery Shopping on a Food
Stamp Budget: Factors Influencing the Food Choices of Low-income
Women as They Try to Make Ends Meet. Public Health Nutrition,
12(10), 1726-1734.