The impact of EU-Korea FTA on China's economic and trade: Based on … · 2012-03-15 · The impact...
15
The impact of EU-Korea FTA on China's economic and trade: Based on the Dynamic GTAP model 1 LIU Yu ZHANG, Dong Wan lu, ZhangYa-xiong, Cai song feng 2 Abstract: EU-Korea FTA will come into effect in July 2011.European Union and South Korea is China's first and third largest trading partner. Therefore, the EU-Korea FTA will have an important impact on China's economy and trade. Based on the latest Dynamic GTAP model, this paper analyses the economic impact of the full realization of EU-Korea FTA in 2015 on China's macro economy and the various industrial sectors. The results show that China's overall economy was on the negative impact, but the magnitude is very small with only-0.007%. Compared with exports, imports fell more sharply, so China’s trade balance has improved. From the view of output, China's agricultural products, agricultural products’ processing industry and service sectors will suffer negative impact, while there is a certain role in promoting China's industrial sectors. From the view of regional product trade, the implementation of the EU-Korea FTA has a obvious diversion effect on China import and export trade, and China will be more inclined to export to EU market than Korean market. In contrast, there is a trend that the demand of importing China’s agricultural products and processed products will transfer from the EU to South Korea, which to a certain extent, form a export substitution of South Korean to the EU .Finally, some policy implications are discussed. Keywords: EU; Korea; FTA; Dynamic GTAP I. Research Background Along with the fast development of bilateral trade liberalization, the main trade partners of China are also actively promoting the establishment of Free Trade Agreements. After several rounds of negotiations, Korea-European Union Free Trade Agreement was finally concluded in July 13 th , 2009, which would be officially come into effect in July, 2011. With EU and Korea the largest and the 1 The authors show great appreciation to the subsidization of the Youth Special Fund from the National Information Center (project number: QN210113). All the mistakes in this paper will be assumed by the authors. 2 Liu Yu is the research associate of the simulation lab, economy forecast department in the National Information Center, email: liuy [email protected]. Dong Wan Lu is the graduate student of Center for Chinese Agriculture Policy, Chinese Academy of Sciences. Zhang Ya Xiong and Cai Song Feng are respectively the principle researcher and assistant researcher of the research associate of the simulation lab, economy forecast department in the National Information Center. Address: Beijing, Sanlihe Road 58. Zip code: 100045.
Transcript of The impact of EU-Korea FTA on China's economic and trade: Based on … · 2012-03-15 · The impact...

The impact of EU-Korea FTA on China's economic and trade:
Based on the Dynamic GTAP model1
LIU Yu ZHANG, Dong Wan lu, ZhangYa-xiong, Cai song feng2
Abstract: EU-Korea FTA will come into effect in July 2011.European Union and
South Korea is China's first and third largest trading partner. Therefore, the
EU-Korea FTA will have an important impact on China's economy and trade.
Based on the latest Dynamic GTAP model, this paper analyses the economic
impact of the full realization of EU-Korea FTA in 2015 on China's macro economy
and the various industrial sectors. The results show that China's overall economy
was on the negative impact, but the magnitude is very small with only-0.007%.
Compared with exports, imports fell more sharply, so China’s trade balance has
improved. From the view of output, China's agricultural products, agricultural
products’ processing industry and service sectors will suffer negative impact,
while there is a certain role in promoting China's industrial sectors. From the
view of regional product trade, the implementation of the EU-Korea FTA has a
obvious diversion effect on China import and export trade, and China will be
more inclined to export to EU market than Korean market. In contrast, there is a
trend that the demand of importing China’s agricultural products and processed products will transfer from the EU to South Korea, which to a certain extent, form
a export substitution of South Korean to the EU .Finally, some policy implications
are discussed.
Keywords: EU; Korea; FTA; Dynamic GTAP
I. Research Background
Along with the fast development of bilateral trade liberalization, the main trade
partners of China are also actively promoting the establishment of Free Trade
Agreements. After several rounds of negotiations, Korea-European Union Free
Trade Agreement was finally concluded in July 13th, 2009, which would be
officially come into effect in July, 2011. With EU and Korea the largest and the
1 The authors show great appreciation to the subsidization of the Youth Special Fund from the National
Information Center (project number: QN210113). All the mistakes in this paper will be assumed by the authors. 2 Liu Yu is the research associate of the simulation lab, economy forecast department in the National Information Center, email: [email protected]. Dong Wan Lu is the graduate student of Center for Chinese Agriculture
Policy, Chinese Academy of Sciences. Zhang Ya Xiong and Cai Song Feng are respectively the principle
researcher and assistant researcher of the research associate of the simulation lab, economy forecast department in
the National Information Center. Address: Beijing, Sanlihe Road 58. Zip code: 100045.

third largest trade partner of china, the Chinese government should pay attention
to the effects of the Korea-EU FTA on the international trade and overall economy
of china.
There has been lot of studies evaluating the economic effects of FTA, which can
be divided into two categories according to research perspectives. The first
category analyses the economic effects of china’s direct participation of FTAs
with abundant studies. An alternative of them concentrate on using GTAP model
to insight into the impacts of global and regional trade libelization. For example,
Huang and Young (2005) use the GTAP model to evaluate Global Trade
Liberalization’s influence on the economy of china as well as the whole world.
Huang and jin (2010) also analysis the possible outcomes of the tariff concessions on non-agricultural products in Doha Round. While Cao (2010)
studies CAFTA’s function on the economy of its members and the world. The
other alternative emphases on the outcomes of china’s bilateral trade
liberalization. Wang (2008) look into the economy effect of Shanghai Cooperation
Organization FTA. Wei and wei (2009), as well as Tan (2010) analysis the bilateral macro economy movements of China-Korea FTA.
The second category concentrates on the influence of the FTAs of China’s trade
partners on our economy. Studies on this aspect are relatively lack. Li (2008) and
Young (2010) simulate the effects of USA-Korea FTA on china’s economy with
GTAP model separately. Zhang (2006) calculate the results in cotton and clothing
industry of china and the whole world after America cancelling the subsidy on
cotton. Gao (2006) start from the trade relationship between East Asia and
America continent, using GTAP model to analysis the possible influence of the
America FTA on the economy of East Asia.
Overall, the current researches have two shortages. Firstly, most of the studies
are based on the comparative static GTAP model, which can only applied to
comparative static analysis and can’t afford to update the database dynamically
according to the time or establish simulative benchmark scenarios. So the
comparative static GTAP model is obviously inappropriate to analysis the
problem in a future year after the FTA fulfilled. Although some Chinese scholars
have carried out some tentative studies putting some dynamic elements in the
GTAP model, their efforts still have limitations. There is still a deep gap between
their works and the real dynamic GTAP model. For example, the researches of
Young (2005) and li (2008) combine recursive methods in the comparative
static GTAP model, only updating the population, GDP, unskilled labor, skilled
labor and natural resources to some future forecast year and conducting
comparative analysis of policy simulation on this baseline.
Secondly, most of the previous researches are based on the GTAP database
version 6. Alongside the development of trade liberalization, the total revenue
and structure of international trade are changing continuously. From this point,

continuing to adapt the GTAP database V6 driven from the economy and trade
relationship of 2001 obviously fail to reflect the real conditions. So, in this paper,
we use the latest dynamic GTAP model and dynamic GTAP database version 7
( driven from 2004) to analysis how the EU-Korea FTA affects China’s economy,
trade and industries.
This paper will pain main attention on the following questions. How will the
EU-Korea FTA influence the macro economy and social welfare of China? Will
the imports and exports of China with other partners suffer negative impact?
Will the industries within China get the same level of impact? Will EU market
see Chinese products substituted by Korea’s products on a large scale?
The remainder of this paper is organized as follows. In the next section, we give a
description of the dynamic GTAP model and the experimental design. In the
third section we proceed a series of simulations and analysis the results. Finally
the last section summarizes and puts up some policy suggestions.
II. Research methodology and scenarios
The Dynamic GTAP model (GTAP-Dyn) is a recursively dynamic applied general
equilibrium (AGE) model of the world economy. It extends the standard GTAP
model (Hertel, 1997) to include international capital mobility, capital
accumulation, and an adaptive expectations theory of investment.(这一段来自
Theoretical structure of dynamic GTAP)A salient technical feature of the new
extension is the treatment of time. Many dynamic models treat time as an index, so that each variable in the model has a time index. In GTAP-Dyn, time itself is a
variable, subject to exogenous change along with the usual policy, technology,
and demographic variables.
The differences between GTAP-Dyn and the standard GTAP model can be generalized as follows. Firstly, compared with the standard GTAP model,
GTAP-Dyn provides a better long-run analysis. Because the dynamic model needs
to construct the baseline scenario as well as take the accumulation effects of
varies factors into consideration. Secondly, in the standard GTAP model, capitals
are only allowed to move between industries within a region, but not between
regions. While in GTAP-Dyn, capitals can move across regions, which allows the
investment allocation and endowment to respond to region-specific rates of
return on capital. Thirdly, the adjustment for the rate of return needs time. The
standard GTAP model takes it for granted that the adjustment of the rate of
return in every country is instantaneous without any delay. While in GTAP-Dyn
we describe a lagged adjustment, which is more realistic. Fourthly, GTAP-Dyn
pulls in the adaptive expectations theory of investment. The investment
movements depend on the changes of investors’ expected rates of rates other
than the actual rates. Their expectations of rates of return may be in error in the
short-run, but stay consistent with the actual rates in the long-run. Fifthly,

GTAP-Dyn includes the capitals and gains of financial assets to achieve the
dynamic links across years. (Ianchovichina and McDougall,2001;Walmsley and Strutt,
2010)
This text uses the latest dynamic GTAP model and the GTAP database version 7,
which is based on the Social Accounting Matrix of countries in 2004 and covers
113 countries and 57 sectors. According to the requirement of our research, we
aggregate the database into 43 sectors and 4 countries/territories (China,
European Union, Korea and Rest of World).
According to the aim of the paper, we develop 2 scenarios—the baseline
scenario and the UN-Korea FTA scenario.
The baseline scenario: this paper uses the dynamic method to simulate the
expected changes over the 2004-2015 period to obtain the baseline scenario.
Apart from the assumption that all the countries will continue to execute the
current policies, we also include Chinese’s tariff adjustment according to the
WTO Agreement during the 2001-2010 period and withdrawal of Multi Fibres
Agreement (MFA) in January 2005 as well as EU enlargement.
The EU-Korea scenario: According to the EU-Korea Free Trade Agreement, in 3 years EU will reduce product tariff by 96%, Korea 99%. In 5 years, both
countries will cancel bilateral industrial product tariff. 3EU will approve Korea’s
retention of export tax rebate policy. We also assume EU and Korea’ tariff system
with other countries unchanged.4
III. Results and analysis
III.A Macro economy and welfare
III.A.a China suffers a slight negative impact in GDP and welfare.
Compared with the baseline scenario, in 2015 China’s real GDP will decrease by
0.007%, welfare by 964.5 million US dollars. Overall, the influence is not
significant. That is mainly because China’s capital stock suffers a relatively small
change (-0.014%5). There are two reasons of this relatively small decrease in
China’s capital stock: On one hand, the trade protection between Europe and
Korea concentrates on the agricultural products other than the industrial
3 In general, there are 2 paths to reduce tariff to zero: Path 1, take the identical cut down rate each year. Path 2,
take the identical reduction margin each year. In the final results the difference between the two paths are very
slight. In this paper we use the second reduction path. 4 In the tariff reduction procedure, we don’t take the sensitive products (special products) in to particular
consideration and believe all the products, including agricultural products, industrial products and services, are all faced with full tariff cuts. 5 In the dynamic GTAP model, in the long run, we assume that a country/region has fixed amount of labor and
land, while the capital stocks can be flexible. So the changes in the long run economy development are caused
entirely by the changes of capital stocks.

products. So tariff reduction has less effect on the industrial products of higher
capital intensity. On the other hand, agricultural products trade takes only a small
proportion in China-EU and China-Korea trading. As a result, the EU-Korea FTA
has a relatively small impact on China’s overall economy.
III.A.b Compared with the consumption expenditure, China’s export and
investment demand decrease greatly.
China’s export demand decreases by 0.04%, investment demand by 0.05%. While
the private consumption and government expenditure only fall by 0.01% and
0.02%. the export subside because the realization of the FTA raise the relative
prices of China’s export products to the FTA region, which decrease the demands towards China’s products. In the investment aspect, China mainly exports
labor-intensive products rather than capital-intensive products. So after the
shock the price of capital falls relatively insignificant, decreasing the return on
capital and retraining investment demand. As the decrease of GDP lead to the
decreases in private and government expenditure and the worse terms of trade lead to a greater fall in purchasing power, private and government expenditures
suffer a greater decline than the develonment of economy. The welfare
decomposition shows that the decline of China’s GDP mainly results from the
shrinks of investment and investment demands.
III.A.c The real exchange rate depreciation leads to an improvement in China’s trade
balance as well as a deterioration in terms of trade.
China’ input prices decrease more than the world average. As a result, China’s export prices
fall while import prices rise, leading to the terms of trade falling by 0.04%. Besides, due to
the decrease of investment demand, China’s real exchange rate depreciate, which improves
the trade balance. The model simulation result shows that although both the exports and
imports fall, the imports fall on a larger scale. As a result, the FTA agreement will improve
China’s trade balance to some extent. The welfare decomposition also indicate that the terms
of trade has a positive effect on GDP.
III.A.d EU-Korea FTA will benefit Korea’s welfare and economy development better.
Compared with the baseline scenario, in 2015, the GDPs of EU and Korea develop by 0.006%
and 0.183%, which shows that Korea enjoys a greater economy development than EU. The
same situation can be seen in the welfare aspect. In 2015, the welfares of EU and Korea be
improved by 827.1 million dollars and 2395.7 million dollars, indicating that Korea’s welfare
improvement is as 3 times large as EU’s. In conclusion, the realization of Korea -EU FTA
benefits the economy and welfare of Korea better.
III.A.e The prices of land as an endowment in China and Korea fall greatly.
In the GTAP model, land, regarded as an insensitive endowment, is supposed only to be used

in agriculture and mining industries. The redistribution of land among industries is not
completely mobile so the land prices in industries are different. The simulation result shows
that the land prices of China and Korea fall greatly due to the severer damages in agriculture
industry. (Table 1.1)
Table 1:compared with the baseline scenario,the main macro-parameters changes in the
2015 policy simulation
China EU Korea
welfare6 (million $) -964.5 827.1 2395.7
Real GDP(%) -0.007 0.006 0.183
investment(%) -0.05 0.07 1.50
Private consumption
(%) -0.01 0.01 0.30
Government
consumption(%) -0.02 -0.01 -0.08
exports(%) -0.04 0.07 0.91
imports(%) -0.11 0.11 2.08
Net exports(million
$)
174.0 -1407.0 -1799.2
Input prices(%)
Land -0.167 0.330 -2.755
Unskilled labor -0.039 0.043 1.033
Skilled labor -0.046 0.046 1.046
capital -0.027 0.039 0.812
Othermain
parameters(%)
Rate of return on
capital -0.004 0.032 0.359
Capital stock -0.014 0.010 0.231
CPI -0.044 0.016 0.133
Data resource:the dynamic GTAP model simulation results.
III.B The industry level influences on China
Overall, the signing of the Korea-EU FTA has no great impacts on industries of China,
although significant differences can be seen among different industries.
6 In this paper the welfare change refers to the equivalent (EV) changes, which means that faced with the price
level in the baseline scenario, the consumer should pay how much money to get the same utility level under the
policy simulation scenario. In this model, the unit of the EV change is calculated in million dollars under the
constant price of 2004, which is identical to the unit of the GTAP V7 database.
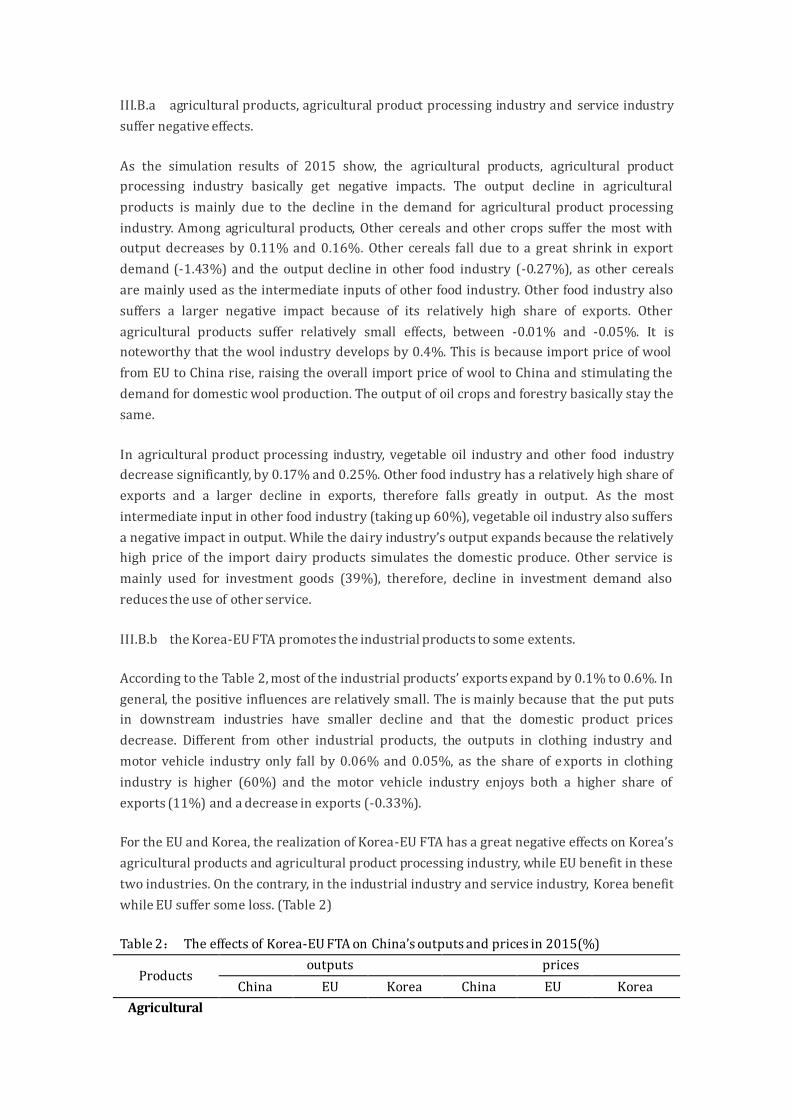
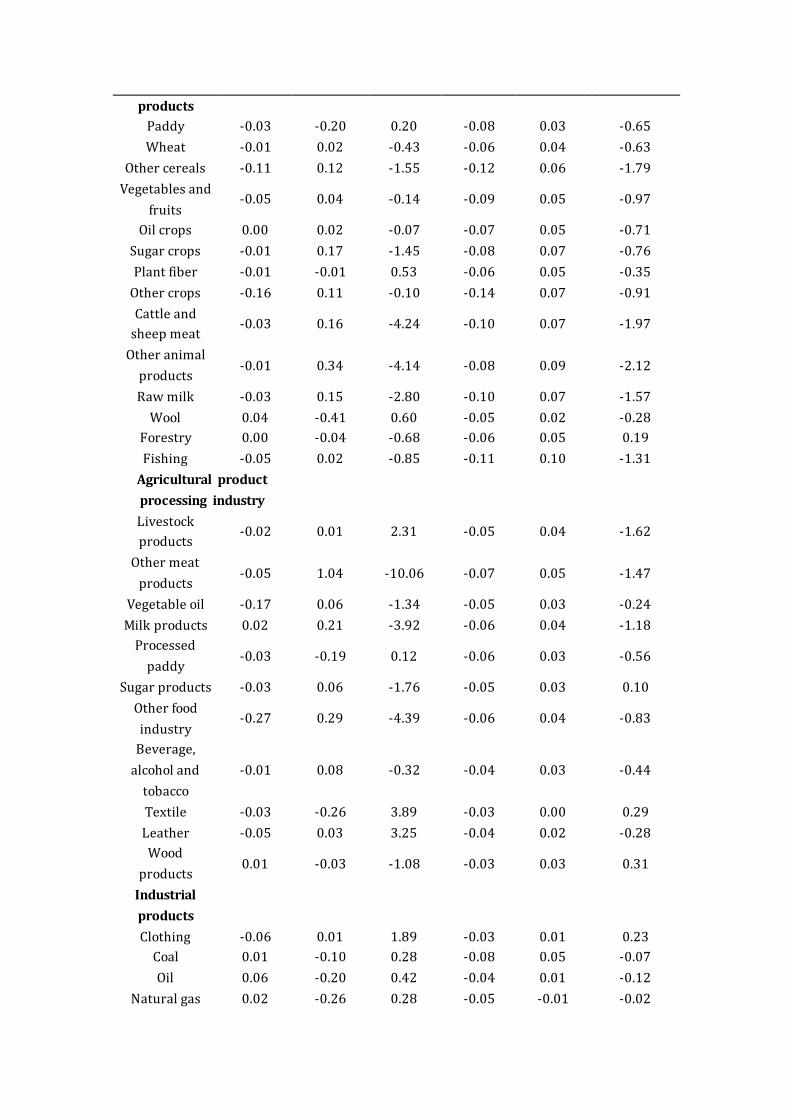
III.B.a agricultural products, agricultural product processing industry and service industry
suffer negative effects.
As the simulation results of 2015 show, the agricultural products, agricultural product
processing industry basically get negative impacts. The output decline in agricultural
products is mainly due to the decline in the demand for agricultural product processing
industry. Among agricultural products, Other cereals and other crops suffer the most with
output decreases by 0.11% and 0.16%. Other cereals fall due to a great shrink in export
demand (-1.43%) and the output decline in other food industry (-0.27%), as other cereals
are mainly used as the intermediate inputs of other food industry. Other food industry also
suffers a larger negative impact because of its relatively high share of exports. Other
agricultural products suffer relatively small effects, between -0.01% and -0.05%. It is
noteworthy that the wool industry develops by 0.4%. This is because import price of wool
from EU to China rise, raising the overall import price of wool to China and stimulating the
demand for domestic wool production. The output of oil crops and forestry basically stay the
same.
In agricultural product processing industry, vegetable oil industry and other food industry
decrease significantly, by 0.17% and 0.25%. Other food industry has a relatively high share of
exports and a larger decline in exports, therefore falls greatly in output. As the most
intermediate input in other food industry (taking up 60%), vegetable oil industry also suffers
a negative impact in output. While the dairy industry’s output expands because the relatively
high price of the import dairy products simulates the domestic produce. Other service is
mainly used for investment goods (39%), therefore, decline in investment demand also
reduces the use of other service.
III.B.b the Korea-EU FTA promotes the industrial products to some extents.
According to the Table 2, most of the industrial products’ exports expand by 0.1% to 0.6%. In
general, the positive influences are relatively small. The is mainly because that the put puts
in downstream industries have smaller decline and that the domestic product prices
decrease. Different from other industrial products, the outputs in clothing industry and
motor vehicle industry only fall by 0.06% and 0.05%, as the share of exports in clothing
industry is higher (60%) and the motor vehicle industry enjoys both a higher share of
exports (11%) and a decrease in exports (-0.33%).
For the EU and Korea, the realization of Korea-EU FTA has a great negative effects on Korea’s
agricultural products and agricultural product processing industry, while EU benefit in these
two industries. On the contrary, in the industrial industry and service industry, Korea benefit
while EU suffer some loss. (Table 2)
Table 2: The effects of Korea-EU FTA on China’s outputs and prices in 2015(%)
Products outputs prices
China EU Korea China EU Korea
Agricultural
products
Paddy -0.03 -0.20 0.20 -0.08 0.03 -0.65
Wheat -0.01 0.02 -0.43 -0.06 0.04 -0.63
Other cereals -0.11 0.12 -1.55 -0.12 0.06 -1.79
Vegetables and
fruits -0.05 0.04 -0.14 -0.09 0.05 -0.97
Oil crops 0.00 0.02 -0.07 -0.07 0.05 -0.71
Sugar crops -0.01 0.17 -1.45 -0.08 0.07 -0.76
Plant fiber -0.01 -0.01 0.53 -0.06 0.05 -0.35
Other crops -0.16 0.11 -0.10 -0.14 0.07 -0.91
Cattle and
sheep meat -0.03 0.16 -4.24 -0.10 0.07 -1.97
Other animal
products -0.01 0.34 -4.14 -0.08 0.09 -2.12
Raw milk -0.03 0.15 -2.80 -0.10 0.07 -1.57
Wool 0.04 -0.41 0.60 -0.05 0.02 -0.28
Forestry 0.00 -0.04 -0.68 -0.06 0.05 0.19
Fishing -0.05 0.02 -0.85 -0.11 0.10 -1.31
Agricultural product
processing industry
Livestock
products -0.02 0.01 2.31 -0.05 0.04 -1.62
Other meat
products -0.05 1.04 -10.06 -0.07 0.05 -1.47
Vegetable oil -0.17 0.06 -1.34 -0.05 0.03 -0.24
Milk products 0.02 0.21 -3.92 -0.06 0.04 -1.18
Processed
paddy -0.03 -0.19 0.12 -0.06 0.03 -0.56
Sugar products -0.03 0.06 -1.76 -0.05 0.03 0.10
Other food
industry -0.27 0.29 -4.39 -0.06 0.04 -0.83
Beverage,
alcohol and
tobacco
-0.01 0.08 -0.32 -0.04 0.03 -0.44
Textile -0.03 -0.26 3.89 -0.03 0.00 0.29
Leather -0.05 0.03 3.25 -0.04 0.02 -0.28
Wood
products 0.01 -0.03 -1.08 -0.03 0.03 0.31
Industrial
products
Clothing -0.06 0.01 1.89 -0.03 0.01 0.23
Coal 0.01 -0.10 0.28 -0.08 0.05 -0.07
Oil 0.06 -0.20 0.42 -0.04 0.01 -0.12
Natural gas 0.02 -0.26 0.28 -0.05 -0.01 -0.02

Other mineral
products 0.03 -0.03 -0.54 -0.04 0.05 0.15
Paper 0.02 -0.01 -0.85 -0.03 0.03 0.53
Oil and coal
products 0.01 0.02 -0.09 -0.03 -0.01 0.06
Chemical
products 0.02 0.03 -0.18 -0.02 0.02 0.19
Mineral
products 0.00 0.04 -0.64 -0.03 0.03 0.49
Steal 0.06 -0.04 -0.85 -0.03 0.03 0.43
Nonmetal
products 0.03 0.03 -1.20 -0.03 0.02 0.17
Metal products 0.03 -0.02 -0.49 -0.02 0.03 0.55
Motor vehicle -0.05 -0.48 7.01 -0.02 -0.02 0.29
Other
transportation 0.04 -0.06 -1.43 -0.02 0.02 0.42
Electronic
equipment 0.00 -0.19 -0.09 -0.01 0.01 0.21
Machinery
equipment 0.04 0.15 -1.22 -0.02 0.02 0.39
Other
manufactures 0.03 0.00 0.73 -0.03 0.03 0.39
services -0.01 0.00 0.14 -0.03 0.03 0.64
Data resource:the dynamic GTAP model simulation results.
III.C The influences on international trades in industry level
The Korea-EU FTA has a negative impact on China’s imports as well as exports. The
simulation results shows that in 2015, China’s total imports fall by 0.11%, while total exports
fall by 0.04%. But the reactions among industries have significant differences.
On the export side, agricultural products industry and agricultural product processing
industry get greater effect. Paddy (-2.8%), wheat (-1.3%), other cereal (-1.4%) and other
food and beverage get the hardest shock, while the other agricultural products and
agricultural product processing industry get relatively small impact (mostly between -0.8%
and 0.8%). The export of industrial products get even slighter fluctuation, generally between
-0.25% and 0.25%. (Table 3) From the contribution rate point of view, other food and
beverage industry’s export contribution rate falls mostly greatly (-0.023%), which
contributes to more than 50% of the total exports. Although the fluctuation of industrial
product industry is slight, its contribution to the total exports is greater than agricultural
product and its processing industry due to its higher export share.
Different from the exports, the imports of most industries suffer a relatively small negative
impact. Among them the natural gas industry suffers the most great decrease (-0.41%),

while the other industries generally fall by 0% to 0.3%. There are two reasons for the
decrease in natural gas industry: Firstly, the domestic and imported natural gas has little
difference in quality. So in the model, the substitution elasticity of the na tural gas is 17.2,
while the other products’ average substitution elasticity is merely 3.1. Secondly, the import
share of natural gas is very small so the substitute effect due to a fall in the import price is
relatively great. Different from other import products, other minerals’ import increases by
0.0117%, as the productions of steal and other metal increase, which stimulate the import
demand for mineral products. The proportions of other minerals as intermediate inputs in
the steel industry and other metal industry are 40% and 18%, so the production increases in
the steel industry and other metal industry give rise to a growth in the production of other
mineral products. The industries contributing the most to the imports are machinery and
equipment (-0.037%), chemical products (-0.015%) and electronic equipment (-0.014%).
Generally these three industries take two thirds of the total exports.
In the regional level, the realization of the FTA has an obvious trade diversion effect on
China’s exports. China’s exports has a bias on the EU market other than the Korea market,
which leads to a trade diversion from Korea to EU in export. (Table 3) The simulation result
shows that most of China’s export products to EU have increase tendency, between 0% and
1%. One reason is that the input prices of EU raise the domestic products prices and make
China’s products more competitive in EU market. The other reason is that EU’s the tariff cut
towards Korea decreases the composite import prices, which stimulates EU’s total import
demands. Compared to industrial products and services, the exports of agricultural products
and the related processing industry grow faster, due to the relative change in land rent. In the
simulation result, the land rent in EU rises (0.33%), while that in China falls greatly
(-0.167%), which decreases the relative prices of agricultural products and related
processing products and stimulates the import demands for China’s agricultural products.
But the exports of rice, textile, clothing, electronic equipment and motor vehicle fall
respectively by 0.03%, 0.85%, 0.09%, 1.11% and 0.34%. This is because EU holds high tariffs
to Korea before the FTA assigned, especially the tariff rates of rice, textile and clothing are
respectively 46%, 7.9% and 10.6%. So, the tariff reduction lowers Korea’s export prices
greatly and finally replaces China’s export demands.
But why Korea doesn’t replace China’s exports to EU on a larger scale? That is because Korea
only takes a small proportion in EU’s imports, especially in agricultural products and related
procession industry. The dynamic GTAP database indicates that Korea only accounts 1.3% in
EU’s total imports, while China takes 10%. Among that, Korea’s agricultural products and
related processing products are hardly exported to EU market. As a result, EU’s reducing
tariff to Korea has merely no impact on China’s exports to EU.
The assignment of Korea-EU FTA influences China’s export structure of agricultural products
and related processing products. The simulation suggests that china tend to import from
Korea other than EU, which to some extent becomes export substitution.
In general, EU’s exports to China have a decrease trend and agricultural products fall greater
than industrial products. The reason for EU’s exports decrease has two main reasons: firstly,

the slowdown of China’s economy development decreases China’s demands for imported
products; Secondly, EU’s input prices rise leads to a increase in its export products cost,
which strikes EU’s exports toward China. As the same, due to EU’s land rent rise brings its
agricultural product prices up, so EU agricultural products’ exports towards China suffer a
great decrease. But the motor vehicle and electronic equipment have grown in export,
because the demand for EU’s motor vehicle shrinks and drags its prices down by 0.019%,
while the export price of Korea’s motor vehicle rise by 0.28%. As a result in China market we
can see EU motor vehicle replaces Korea’s. As for the electronic equipment, its price in EU
rises by 0.012%, which is still much smaller than Korea (0.20%). Besides, Korea’s motor
vehicle and electronic equipment occupy large market shares in China (respectively 12% and
17%), so the substitution effects are also relatively significant.
Unlike EU, Korea’s agricultural products exports to China grow rapidly, among which the
exports of cattle and sheep meat product, other meat product and raw milk grow by more
than 10%. In general, the reason is that Korea’s land rent falls greatly (-2.67%), which
decreases the export prices and improves the competiveness of Korea’s agricultural products
in China market. But Korea’s forestry, sugar products, textile and wood products exports to
China suffer a falling tendency due to the absent use ( sugar products, textile and wood
products) or less use of land( forestry 19% compared to 57% as the average share of land in
agricultural products) and that causes the price distension. Unlike the agricultural products,
the industrial product exports of Korea to China decrease greatly. The main reason lies in
that Korea’s labor cost has a significant rise and that raises the prices of industrial products
and services, which harm Korea’s industrial products exported to China. While the exports in
oil industry rise by 0.915%, as Korea’s oil export price falls and oil from Korea only takes a
small part in China’s market.
Table 3 : The effects of Korea-EU FTA on China’s products trade in 2015(%)
Products Total
exports
Total
imports
China’s exports EU Korea
EU Korea China’s imports
Agricultural
products
Paddy -2.845 -0.192 0.745 -3.192 -0.946 6.206
Wheat -1.325 -0.132 0.813 -4.218 -0.765 5.444
Other cereals -1.434 -0.176 0.541 -4.250 -0.399 4.563
Vegetables
and fruits -0.094 -0.129 0.430 -3.570 -0.535 2.893
Oil crops 0.055 -0.082 0.383 -0.673 -0.399 2.856
Sugar crops 0.461 -0.141 0.728 -0.387 -0.721 3.807
Plant fiber 0.464 -0.104 0.312 3.390 -0.449 1.517
Other crops -0.666 -0.269 0.988 -7.722 -0.846 5.269
Cattle and
sheep meat 0.241 -0.165 0.762 -4.045 -0.526 7.980
Other animal
products 0.263 -0.098 0.750 0.798 -0.381 5.291

Raw milk 0.630 -0.292 1.034 -2.587 -0.933 11.769
Wool 0.385 -0.134 0.417 1.767 -0.697 3.071
Forestry 0.160 -0.082 0.323 -0.859 -0.412 -1.022
Fishing -0.665 -0.100 0.505 -2.409 -0.433 2.954
Agricultural product
processing industry
Livestock
products 0.194 -0.075 0.534 -3.540 -0.499 13.123
Other meat
products -0.593 -0.208 0.912 -55.951 -0.789 12.965
Vegetable oil -0.528 -0.199 0.304 -7.172 -0.565 1.064
Milk products -0.039 -0.128 0.678 -48.049 -0.466 8.316
Processed
paddy 0.004 -0.028 -0.030 -1.130 -0.444 2.663
Sugar
products 0.066 -0.093 0.321 -4.663 -0.301 -0.584
Other food
industry -1.877 -0.151 0.330 -28.775 -0.424 2.813
Beverage,
alcohol and
tobacco
-0.184 -0.053 0.155 -10.368 -0.140 0.868
Textile -0.109 -0.225 -0.851 -0.473 -0.037 -2.031
Leather -0.060 -0.003 0.082 -6.776 -0.614 1.712
Wood
products 0.006 -0.098 0.228 -3.300 -0.294 -1.961
Industrial
products
Clothing -0.092 -0.046 -0.094 -4.037 -0.234 -1.733
Coal 0.264 -0.187 0.406 0.247 -0.607 -0.078
Oil 0.086 -0.020 0.213 0.027 -0.384 0.915
Natural gas 0.929 -0.410 1.032 1.134 -0.954 -0.695
Other mineral
products -0.046 0.012 0.079 -0.952 -0.086 -0.220
Paper 0.119 -0.113 0.279 -0.086 -0.198 -2.695
Oil and coal
products 0.028 -0.048 0.067 -0.289 -0.027 -0.288
Chemical
products -0.057 -0.102 0.096 -3.441 -0.121 -1.090
Mineral
products -0.040 -0.188 0.194 -2.282 -0.156 -2.395
Steal 0.193 -0.228 0.190 0.392 -0.006 -2.173
Nonmetal
products -0.187 -0.098 0.186 -1.672 -0.211 -1.413
Metal 0.061 -0.265 0.174 -2.634 -0.087 -3.618

products
Motor vehicle -0.327 -0.141 -1.111 -2.905 0.087 -1.591
Other
transportation 0.152 -0.054 0.056 -0.641 -0.217 -3.471
Electronic
equipment -0.036 -0.067 -0.339 0.297 0.043 -1.617
Machinery
equipment -0.012 -0.194 0.100 -3.442 -0.054 -2.864
Other
manufactures 0.041 -0.147 0.148 -3.677 -0.243 -2.736
services 0.166 -0.066 0.205 1.343 -0.195 -2.481
Data resource:the dynamic GTAP model simulation results.
IV. Conclusions and policy suggestions.
First of all, although the realization of the Korea-EU FTA has a slight economy influence on
China, China will still get negative impacts in the dynamic procedures with the speed -up of
the FTA construction among its trade partners, especially when facing the pressure that the
United States is about to use the FTA strategy coming back to Asia. So China should speed up
the development of the Asian FTA and promote the negotiation processes of China -Korea
FTA, China-Japan-Korea FTA as well as the ASEAN+3. At the same time, China should also put
special efforts in opening up the developing countries and emerging markets, reducing the
risk of export concentration.
Secondly, the Korea-EU FTA has negative effects on China’s agricultural products, agricultural
product processing industry and services while positive influence on China’s industrial
products. Thus, for the agriculture, China should promote the adjustment of internal
structure and put emphasis on developing the processing industries on agricultural products
to increase the value-added and improve the competitiveness of China’s agricultural
products. For the industry departments, China should also take the opportunity to increase
investment and encourage the core technology innovation.
Thirdly, as the Korea-EU FTA has a greater negative impact on China’s investment than
consumption, which expands the share of consumption and lowers the overheated
investment ratio in the economic composition aspect, China should also take the chance to
stimulate consumption and change the development methods, as well as provide the
favorable conditions for FTA negotiations with the trade partners.
Finally, due to China’s consistent surplus to EU, EU continuously applies the anti-dumping
and countervailing trade remedies to Chinese products. As the realization of Korea -EU FTA
will expand China’s exports to EU, Chinese government and enterprises should strengthen
the researches on anti-dumping cases and laws involved with the key products to prevent the
trade disputes from getting exacerbated. Equally, China should also be prepared in
monitoring and early warning of imports form Korea, preventing the Korea’s agricultural

products from attacking domestic market.
References:
1. 曹亮、曾金玲、陈勇兵,(2010)“CAFTA 框架下的贸易流量和结构分析—基于 GTAP 模
型的实证研究,”《财贸经济》第 4 期,第 76-84 页。
2. 高静,(2006)“美洲自由贸易区对东亚经济的影响,”《拉丁美洲研究》第 1 期,第 32-37
3. 黄季焜、杨军,(2005)“全球贸易自由化对中国和世界经济的影响,”《地理科学进展》
第 1 期,第 1-10 页。
4. 黄鹏、金柳燕,(2010)“基于 GTAP模型对多哈回合非农产品关税减让可能效应的一般
均衡分析”《世界贸易组织动态与研究》第 1 期,第 12-18 页。
5. 李丽、陈迅、邵兵家,(2008)“韩美自由贸易协定全面实施对中国经济的影响,”《山
西财经大学学报》第 8 期,第 30-36 页。
6. 谈茜,(2010)“双边 FTA 谈判的策略选择模型与实证分析,”《世界经济研究》第 12
期,第 72-78 页。
7. 王飞,(2008)“上海合作组织建立自由贸易的 GTAP模型分析,”商务部贸研院《上海
合作组织自由区可行性研究》。
8. 魏巍、魏超,(2009)“中韩 FTA 的预期宏观经济效应—基于动态 GTAP 模型的分析,”
《山东经济》第 5 期,第 127-130页。
9. 吴凌燕、李众敏,(2007)“美国参与东亚区域合作对中国的影响研究,”《财贸研究》,
第 6 期,第 67-72页。
10. 杨军、黄季焜、仇焕广,(2005)“建立中国和澳大利亚自由贸易区的经济影响分析及
政策建议,”《国际贸易问题》,第 11 期,第 65-70页。
11. 杨欣、武拉平,(2010)“美韩自由贸易协定对中韩农产品贸易的潜在影响,”《中国农
村经济》第 7 期,第 12-18页。
12. 张海森、杨军,(2006)“美国取消棉花补贴对世界及我国棉业经济的影响,”《农业经
济问题》,第 1 期,第 75-78页。
13. Elena Ianchovichina, Robert McDougall, (2001),“Theoretical structure of Dynamic GTAP,”
GTAP working paper No.17, Edition 1.1, 1-74
14. Hertel, T.W., ed. (1997). “Global Trade Analysis Modeling and Applications. Cambridge,”
University Press, New York.

15. Walmsley, T L. and Strutt, A. (2010), “Trade and Sectoral Impacts of the Financial Crisis:
A Dynamic CGE Analysis,” Paper presented at Thirteenth Annual Conference on Global
Economic Analysis, Bangkok, Thailand.