Economic Partnership Agreements Putting Partnerships into ...

________________________________________________________________________________________ CREDIT Research Paper
No. 07/09 _________________________________________________________________________________________
The Impact of Economic Partnership Agreements on ACP Agriculture
Imports and Welfare
by
Oliver Morrissey and Evious Zgovu Abstract This paper estimates the impact on a sample of 36 ACP countries of eliminating tariffs on agricultural imports from the EU under EPAs, considering trade, welfare and revenue effects. Even assuming ‘immediate’ complete elimination of all tariffs on agriculture imports from the EU, and when excluding up to 20% of imports as sensitive products, over half of ACP countries are likely to experience welfare gains. However, although most LDCs gain (10 out of 13), most non-LDCs (about 60%) lose. The overall welfare effect relative to GDP tends to be very small, whether positive or negative. While potential tariff revenue losses are non-negligible, given that countries have at least ten years in which to implement the tariff reductions, there is scope for tax substitution. An important issue is identifying the sensitive products (SPs) to be excluded. In general, excluding SPs reduced the welfare gain (or increased the welfare loss) compared to estimates where no products are excluded. Key Words: EU-ACP, Economic Partnership Agreements, ACP Agriculture Imports JEL Classification: F14, F15, F17
_____________________________________________________________________ Centre for Research in Economic Development and International Trade, University of Nottingham
__________________________________________________________________________________________ CREDIT Research Paper
No. 07/09
The Impact of Economic Partnership Agreements on ACP Agriculture
Imports and Welfare
by
Oliver Morrissey and Evious Zgovu
Outline
1 Introduction
2 The Status of EPA Negotiations (August 2007)
3 Modeling Framework
4 Empirical Application to Agriculture Imports
5 Conclusions and Proposed Extensions
The Authors The authors are respectively Professor in Development Economics and Visiting Research Fellow, CREDIT, the School of Economics, University of Nottingham NG7 2RD. Corresponding author: [email protected].
Acknowledgements The research for this paper was funded by the European Commission under the TRADEAG research programme in FP6 (www.tradeag.eu). The views expressed are those of the authors alone and should not be attributed to the Commission or other TRADEAG partners. _____________________________________________________________________ Research Papers at www.nottingham.ac.uk/economics/credit/

1
1. INTRODUCTION
Although the European Union (EU) has provided trade preferences to the former colonies of
the African, Caribbean and Pacific (ACP) regions since 1975 under successive Lomé
conventions, these preferences have been of limited value (Langhammer, 1992). This is not
surprising as trade preferences in general have not provided significant benefits to developing
countries (Ozden and Reinhardt, 2003), especially Africa (Brenton and Ikezuki, 2007). One
reason for the limited effect is the conditions under which preferences were granted, either
restricting the products eligible for full preferences (often excluding products of particular
benefit to developing countries) or, especially in the context of EU preferences for the ACP,
imposing very restrictive Rules of Origin requirements (thus limiting opportunities for
diversification). Another reason relates to policy-induced distortions in the ACP countries, so
that actual incentives for production diversification are weak, exacerbating the problem of a
narrow production structure and primary commodity resource base. This is especially true for
Africa (but applies more generally to ACP). Furthermore, there is excessive emphasis on
expanding manufacturing, and recently services, exports. Thus, it is argued that achieving
sustained growth in Africa requires implementing policies to expand exports, and to diversify
exports away from dependence on a narrow range of (unprocessed) primary commodities
(Commission for Africa, 2005). Trade preferences can play a role, as the experience to date
with the US African Growth and Opportunity Act (AGOA) suggests (Frazer and van
Biesebroeck, 2007).
This emphasis on diversifying exports can divert attention away from what is required to
enhance the competitiveness of existing producers, whether import-competing or traditional
exports. In an ACP context, this means addressing the primary sector, especially agriculture,
and more generally considering the import side of any trade policy (Morrissey, 2005). This is
especially relevant to economic partnership agreements (EPAs) as they will require ACP
countries to eliminate tariffs on most imports from the EU, the impact of which will depend
primarily on the structure of a country’s imports (EPAs include many other provisions and
effects, as mentioned below, but the focus here is on ACP imports). There are benefits for
products where there are few or no competing domestic producers – consumption gains from
increased cheaper imports and potential welfare gains in sourcing imports from more efficient
EU producers. There are potential welfare losses, or adjustment costs, where cheap imports

2
from the EU domestic undermine domestic production or displace more efficient producers in
the rest of the world. As the production structure of the ACP countries is dependent on the
primary/agriculture sector, this paper concentrates on the impact of eliminating tariffs on
agriculture imports from the EU.
A specific feature of preferences under Lomé conventions is that they were granted to selected
countries that were not required to grant reciprocal concessions to the EU; this was challenged
under the rules of the World Trade Organization (WTO) and found to be ‘illegal’ under WTO
rules. To continue preferences, the EU agreed a waiver in the WTO in 2001 to remain in effect
until 2008, when a new WTO-compliant regime was to be in place. The Cotonou Agreement
proposed introducing reciprocity through the establishment of a series of economic partnership
agreements (EPAs), under which the EU and regional groupings of ACP countries offer
reciprocal trade preferences to each other, as the new regime. Negotiations between the EU and
ACP regional groups began in 2003 and entered the final stage in March 2007, with EPAs to be
implemented from 2008. Although complete negotiated agreements will not be in place by
2008, there are various options to sustain the process (Stevens, 2007). It seems quite likely that
a ‘framework agreement’ with commitments and an implementation timetable will be signed by
the end of 2007, with the details to be negotiated over another few years.
In principle, EPAs offer potential benefits to ACP countries beyond what was available under
Lomé conventions. The preferential access to the EU is less restrictive: all ACP countries
should have tariff-free access to the EU for almost all products; this should be available once
the agreements are in place, and restrictions, such as Rules of Origin requirements, should be
less than previously.1 The ACP member countries should derive some benefit from enhanced
regional integration as a precursor to EPAs: even if the actual trade benefits are limited, there
are benefits from regional economic co-operation. A range of trade-related policy reform
commitments are included in the EU proposals, covering trade facilitation and investment, and
perhaps also competition policy and government procurement. If implemented properly these
could enhance the business environment in ACP countries, attracting investment and promoting
1 The EU proposal for EPAs is a ‘30% local value added’ threshold, compared to the current Cotonou Rules of Origin which are equivalent to a 60% threshold. The details have not been agreed, and some ACP countries favour a ‘change of tariff heading’ test, i.e. if the activity in the ACP countries changes the tariff classification the exported product is deemed to have origin in that country (Pearson, 2007).
3
exports. There is an expectation that some increased aid will be made available by the EU to
support implementation of and adjustment to EPAs.
There are potential costs to ACP countries through reciprocity as they are required to grant
tariff-free access to imports from the EU. Although there is concern in ACP countries that such
opening up to import competition from the EU will displace domestic production, it is not
obviously the case that there will be adverse effects. The welfare impact of import liberalisation
depends on the production and trade structure of the country in question, and as such is an
empirical question. Of greater practical concern is the potential loss of revenue from tariffs on
imports from the EU. However, ACP countries have at least 10 years to phase in tariff
elimination,2 and even then can continue to exclude a range of designated ‘sensitive products’
(identifying these is a sticking point in negotiations). Thus, countries do have time to plan both
their adjustment to the economic effects of increased imports and the revenue effect of
eliminating tariffs. To design such plans they need information on the likely effects at a
disaggregated product level. The aim of this paper is to assess the trade, revenue and welfare
implications of EPAs on ACP countries’ agriculture imports from the EU, applying the
analytical framework used by McKay et al (2005).
The remainder of the paper is organised as follows. Section 2 reviews the progress of EPA
negotiations and discusses some of the existing literature estimating the effects. Section 3
presents the partial equilibrium method used to estimate trade, revenue and welfare effects of
introducing an EPA for agriculture imports to ACP countries. Section 4 provides our estimates,
covering the majority of ACP countries, and discusses the issue of identifying sensitive
products. Finally, section 5 sets out the implications of the analysis and summary conclusions.
2. THE STATUS OF EPA NEGOTIATIONS (AUGUST 2007)
The Cotonou Agreement between the EU and 71 ACP states was concluded in February 2000
covering various dimensions including economic relations, aid programmes, and trade co-
operation, specifically the proposal for EPAs to be implemented over a 10-15 year transitional
period starting by 2008 at the latest. The ACP countries were aware that EPAs offer limited
benefits, although the situation differs between least developed countries (LDCs) and non-

4
LDCs. The LDCs are entitled to essentially tariff-free access to the EU without committing to
reciprocity. The non-LDCs, however, could lose their Lomé-type preferences and would be
granted only GSP access if EPAs were not in place. This loss of preferences could significantly
undermine export competitiveness and damage major sectors dependent on exports to the EU,
such as beef in Namibia and horticulture in Kenya (Stevens, 2007). Thus, non-LDCs have a
strong incentive to sign EPAs to maintain preferential access for their exports to the EU.
For ACP countries, the first step was to form themselves into regional groups, some of which
are actually more advanced in regional integration than others, and six have emerged:
Caribbean, Pacific, Central Africa, West Africa, Southern Africa (SADC) and East and
Southern Africa (ESA, from which there is still a possibility of East Africa forming a separate
group). Some African countries have yet to decide which group they are in and some are
members of more than one group, e.g., Zambia in ESA and SADC; Tanzania in both of these
and also the East Africa Cooperation (EAC).3 Furthermore, for Africa at least, existing regional
integration arrangements (RIAs) are at best weak, have proved politically difficult to sustain
and have generated few clear economic benefits (Lyakurwa et al, 1997). While integration can
contribute to growth and development, notably by increasing the size of the market and
attracting foreign direct investment (FDI), most of the evidence for beneficial effects of RIAs
relate to developed or middle-income countries (Schiff and Winters, 2003). The general
problem has been that most of the benefits accrue to the largest and richest member, while few
economic benefits accrue to the poorest members so deep integration has been difficult to
achieve or sustain. This is an underlying problem in EPAs, especially in Africa, where the
regional groups include at least one ‘large’ non-LDC member with (economically) small LDC
members. The former stands to gain from securing trade preferences for the EU market
whereas the latter have no preferences to gain (beyond what they should be entitled to even
without EPAs). It is therefore relevant to assess the impact of reciprocity (offering tariff-free
2 There are ACP proposals to extend the transition period up to 20 years, given that the jurisprudence in relation to Article XXIV of GATT is not definitive and negotiations under Paragraph 29 of the Doha Mandate might be sympathetic to the ACP proposal for more flexibility. 3 SADC is a good example of the complexity in Africa. South Africa, the dominant member, only has ACP ‘observer status’ and had a free trade agreement with the EU. However, as of December 2006 the EU and South Africa agreed to abandon their Trade and Development Cooperation Agreement (TDCA) and allowed South Africa to become part of SADC in EPA negotiations. Botswana, Lesotho, Namibia and Swaziland are in a customs union with South Africa (SACU), whereas Angola, Mozambique and Tanzania (also in ESA and EAC) are not. It is far from clear how any EPA could treat all members of SADC equally.

5
access to imports from the EU), and whether this may differ between LDCs and non-LDCs; we
explore this for the agriculture sector.
Whilst it is important for ACP countries to assess the effects of reciprocity on trade, welfare
and revenue there are few assessments in the literature of the impact of EPAs. Busse and
Grossman (2007) apply a differentiated product partial equilibrium model to analyse the trade
and revenue effects of the EU-ECOWAS EPA. They find that the (static) trade effects are quite
high (imports from the EU increase by over 20 per cent for some products in some countries)
although trade creation dominates trade diversion, so the welfare effect is positive for all
countries. However, while revenue losses of 4 to 9 per cent are the norm, some countries face
much higher losses (among the non-LDCs, Ghana faces the highest revenue loss). Karingi et al
(2005) use a combination of general and partial equilibrium modeling techniques and conclude
that the likely revenue and adjustment will be costly for African countries. However, their
estimate of welfare effects is based on consumption effects only, so they found welfare gains
for all countries. McKay et al (2005) apply the partial equilibrium technique used below to East
Africa and conclude that although the welfare effects (excluding revenue loses) are small,
whether positive or negative, there are short-run adjustment costs and potentially large revenue
losses. They find a negative short-run welfare effect on Tanzania (because the trade diversion
effect from the rest of the world dominates) but a small positive short-run effect for Uganda
(because the consumption gain dominates and the increase in imports from the EU displaces
relatively inefficient imports from Kenya). Kenya is likely to experience a welfare loss, as it
loses regional market share and faces increased competition from EU imports, but this must be
set against the gains of preferential access to the EU (especially important for the now large
horticulture sector).
The EPAs can be WTO-compliant as long as, amongst other conditions, ‘substantially all the
trade’ between partners is liberalised (i.e. subject to zero tariffs). Although there is agreement
that this probably means about 80% of trade, it is not at all clear how this should be measured.
Is it 80% of tariff lines or of the value of trade, before or after liberalisation? Consequently, it is
not clear what proportion of ACP imports from the EU can be excluded from liberalisation, i.e.
what proportion can be deemed sensitive products? As exports to the EU typically account for
over 60% of total bilateral trade, ACP countries could exclude almost half of their imports from
6
the EU. We assume that ACP countries will have to liberalise at least 70 percent of trade
(imports from the EU), and that whole sectors, such as apparel, cannot be omitted. We return to
this issue when discussing sensitive sectors.
3. MODELING FRAMEWORK
We apply the partial equilibrium analytical framework used by McKay et al (2005) and outline
the core features here. This extends the established theoretical framework for analysing the
economic (welfare) effect of regional integration (e.g., Balassa, 1974; Lyakurwa et al., 1997;
Schiff and Winters, 2003) as applied by Panagariya (1998) to consider when small countries (in
our case ACP) integrate with large countries (the EU in this case). Two effects are of particular
importance in any analysis of the welfare effect of a regional integration agreement (RIA).
Beneficial trade creation arises where inefficient production by domestic firms in a member
country (ACP) is displaced by tariff-free imports by more efficient producers in another
member country (the EU). This increases welfare in total through a more efficient allocation of
production within the RIA. On the other hand, trade diversion imposes a welfare loss where
trade from more efficient extra-regional suppliers (ACP imports from the Rest of the World,
ROW) is diverted to less efficient intra-regional suppliers (the EU). For the RIA as a whole,
welfare increases if trade creation is greater than trade diversion. We assume that the EU
benefits, although we make no attempt to estimate this, and focus on the effects on ACP
countries (and further, here, on agriculture only).
Although partial equilibrium methods are limited and restrictive, they offer a number of
advantages over alternative computable general equilibrium (CGE) approaches which make
them attractive for our purposes. First, the data requirements are relatively simple: all we need
are data on imports for a representative year disaggregated by source (ACP, EU and ROW) and
product, whereas CGE analysis requires a model of the structure of the economy. Second, the
analysis can be conducted at a high level of product disaggregation, compared to CGE analysis
which typically requires sector aggregation, which is especially useful in attempting to identify
sensitive products. Third, the estimates are quite easy to interpret as proportional effects on
trade volumes and revenues. Fourth and consequently, the results are quite useful for policy-
makers and negotiators. Finally, a more general benefit is that estimates can be provided, based

7
on product detail, for a large number of ACP countries (whereas CGE studies tend to be
country-specific or to group countries).
There are limitations, although no approach is without weakness. We do have to make a
number of restrictive assumptions, such as on supply and import demand elasticities, although
arguably the assumptions are no more restrictive than for alternative methods (and results are
quite robust to sensitivity checks). More importantly, the analysis is limited to static trade
effects; it does not allow for effects on or responses by domestic producers, or for any effects
through factor markets and sector adjustment. Considering such effects would require general
equilibrium analysis. Furthermore, the analysis does not account for changes in partner
countries (e.g. if they also reduce tariffs) or the global market (e.g. world prices), or for
possible changes in demand for exports, for example if trade preferences change (as under an
EPA); addressing these issues would require a global model. The partial equilibrium approach
does estimate likely first order effects on imports and in principle these could form a basis for
more detailed CGE country studies where feasible. Thus, we consider the estimates to be
indicative of the potential impact of EPAs on agriculture imports in ACP countries,
highlighting products that individual countries may wish to consider in more detail.
We estimate and report results for three effects. Consumption effects arise from increased
imports at reduced prices; if the EU is initially the dominant supplier, the EPA results in pure
consumption effects only, and this is clearly beneficial. Trade creation (TC) arises in this
context when imports from the EU displace imports from other ACP countries; assuming the
EU is the more efficient producer, this increases welfare in the importing country (although
producers in the exporting ACP country lose).4 Trade diversion refers to a situation where the
elimination of tariffs allows EU suppliers to displace more efficient producers in the ROW; this
is likely to arise if pre-EPA the ROW is the dominant supplier.
4 This differs slightly from the standard TC case as the displaced producers are not in the importing country (whose welfare is being measured) but in another ACP country (so the producer loss is not included in the estimates). As the EU would only displace ACP suppliers if the tariff-free EU price is lower than the ACP supplier price, it is assumed that in this case the EU is more efficient. This is not valid if there are other factors distorting EU export prices (such as agriculture subsidies).
8
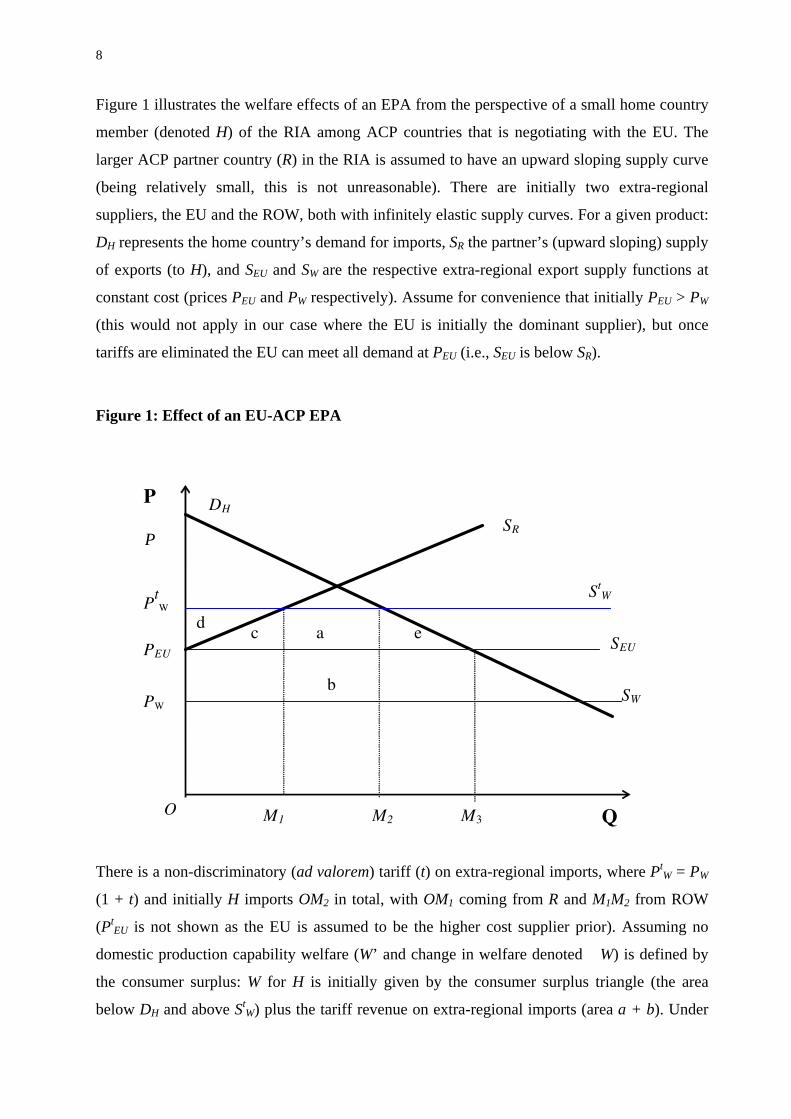
Figure 1 illustrates the welfare effects of an EPA from the perspective of a small home country
member (denoted H) of the RIA among ACP countries that is negotiating with the EU. The
larger ACP partner country (R) in the RIA is assumed to have an upward sloping supply curve
(being relatively small, this is not unreasonable). There are initially two extra-regional
suppliers, the EU and the ROW, both with infinitely elastic supply curves. For a given product:
DH represents the home country’s demand for imports, SR the partner’s (upward sloping) supply
of exports (to H), and SEU and SW are the respective extra-regional export supply functions at
constant cost (prices PEU and PW respectively). Assume for convenience that initially PEU > PW
(this would not apply in our case where the EU is initially the dominant supplier), but once
tariffs are eliminated the EU can meet all demand at PEU (i.e., SEU is below SR).
Figure 1: Effect of an EU-ACP EPA
PEU
PtW
Q M3 M1
DH P
P
PW
SR
M2 O
StW
SEU
SW
a
b
c d
e
There is a non-discriminatory (ad valorem) tariff (t) on extra-regional imports, where PtW = PW
(1 + t) and initially H imports OM2 in total, with OM1 coming from R and M1M2 from ROW
(PtEU is not shown as the EU is assumed to be the higher cost supplier prior). Assuming no
domestic production capability welfare (W’ and change in welfare denoted �W) is defined by
the consumer surplus: W for H is initially given by the consumer surplus triangle (the area
below DH and above StW) plus the tariff revenue on extra-regional imports (area a + b). Under

9
the EPA, t applies to ROW but not the EU. The relevant supply price is now PEU with the total
quantity of imports expanding from OM2 to OM3 (the consumption effect). Figure 1 illustrates a
case where all imports post-EPA come from the EU. The trade diversion effect is illustrated as
M1M2, and the trade creation effect OM1. Different scenarios could be illustrated in separate
figures, but it is more useful to consider other possibilities in describing how we estimate the
welfare effects.
3.1 Estimating Trade and Welfare Effects
In estimating effects we begin with the trade data and allocate imports by product into one of
three cases. If initially the EU is the dominant supplier (accounting for at least 40% of imports),
we assume that all effects are consumption gains (consumption effects only). If the ACP is
initially a significant supplier (accounting for at least 20% of imports), we allow for the TC of
the EU displacing ACP imports. If initially the ROW is the dominant supplier (accounting for
at least 40% of imports), we assume that at zero tariffs the EU can displace all imports from the
ROW to estimate the maximum TD potential (this is therefore unlikely to be the actual impact,
but is a useful base for considering sensitive products).
Consumption Effects Only (CE)
If the EU is initially the dominant supplier we can interpret this as PtW = Pt
EU in Figure 1;
imports increase by M2M3 and we measure the welfare gain as area e. The consumption effect
alone ( MC∆ ) is estimated relative to existing EU import volumes as (where elasticities are the
modulus, although of course a reduction in tariffs implies an increase in import demand):
EUdM
M Mt
tC 0..1
η⎟⎠⎞
⎜⎝⎛+
=∆ (1)
where t is current tariff imposed on imports from the EU, dMη is the price elasticity of demand
for imports, EUM 0 is the existing value of imports from the EU. As an EPA entails elimination
of tariffs on imports from the EU, the tariff revenue loss on imports ( EUM 0 = OM2) and welfare
effects can be estimated as follows:
EUC MtR 0.−=∆ (2)
MC CtW ∆=∆ .)( 21 (3)
10
‘Trade Creation’ with Consumption Effects (TC&CE)
For the case where an ACP partner supplies a relatively significant share of imports one can
estimate the effects of trade creation with consumption effects by considering the case where
the ACP price lies over the relevant range between tROWP and EUP . In this case all ACP imports
(OM1) will be replaced by imports from the EU. The maximum value of trade creation with
consumption effects ( CMTC∆ ) obtains where the price of ACP imports is as high as the tariff-
inclusive price of imports from the EU. Thus:
ACPdM
CM M
ttTC 02
1 ..1
)( η⎟⎠⎞
⎜⎝⎛+
=∆ (4)
where ACPM 0 is the current value of imports from ACP.
Welfare effects of trade creation with consumption effects can be estimated as the combination
of the maximum value of trade created by the displacement of ACP exports to partner country j
and consumption effects of trade creation defined in equation (4) as follows:
( ) ( )CM
ACPMTC TCttMW ∆+=∆ .)(. 2
10 (5)
‘Trade Diversion’ with Consumption Effects (TD&CE)
Relevant cases of trade diversion occur where more efficiently produced imports from the
ROW (M1M2) are displaced by relatively less efficiently produced commodities from the EU
due to an EPA. Commodities for which the ROW is a dominant supplier pre-EPA can be taken
to indicate that the ROW is more efficient than the EU. Where an EPA leads
to tROWEU PP < under the prevailing constant production cost conditions the EU becomes the sole
supplier to country j, and total import diversion will be the upper limit of trade diversion.
Obviously, not all imports will be diverted from ROW, and we assume the EU must initially be
supplying a reasonable share of imports of a product (at least 20%) to have a capacity for TD.
The consumption effects due to trade diversion ( CMTD∆ ) can be estimated in a similar way by
assuming (in the absence of information about the level at which the post-EPA EU price will
settle relative to tROWP and ROWP ) that on average the post-EPA price of imports from the EU
lies midway between the two. Thus:
ROWdM
CM M
ttTD 02
1 ..1
)( η⎟⎠⎞
⎜⎝⎛+
=∆ (6)
11
Evidently trade diversion will be associated with tariff revenue loss since country j switches
from taxed ROW sources to duty free EU sources. The tariff revenue loss due to trade
diversion (with consumption effects) is given by:
ROWCTD MtR 0.−=∆ (7)
Using the assumption that EUP lies halfway between tROWP and ROWP , the welfare impact of
trade diversion with consumption effects can be estimated as the combination of consumption
effects (from equation 6) and tariff revenue effects (from equation (7):
( ) ( )[ ]ROWCM
MTD MtTDtW 02
12
1 ..)()( −∆=∆ (8)
In the context of Figure 1 we are effectively measuring b – e minus revenue loss (a + b). In
general, rather than imposing assumptions on the welfare effects of (fiscal adjustments
associated with) the revenue loss, we will report the welfare effects excluding the revenue
losses, which are reported separately.
4. EMPIRICAL APPLICATION TO AGRICULTURE IMPORTS
Results are provided for 36 out of 71 ACP countries for which required data were available (the
countries are listed in the tables of country summary results; some results are also reported for
Cuba and Vanuatu, but we had no GDP data for these countries). We use the most recently
available data matching imports and import tariff rates, so for some countries the estimates use
data from 2003 (the most recent available), although some go as far back as 1997 (see
Appendix Table A1, which also highlights the 13 LDCs in the sample). Data on the value of
imports (cif) and import tariff rates were constructed from COMTRADE data at the 5-digit
level in SITC format showing commodity description, country of origin and values. The data
were then aggregated across categories and source to obtain ACP-EU and ACP-ROW values
for the 4-digit SITC level. The import tariff rates used were Most Favoured Nation (MFN) rates
as we did not have data on customs duty revenue collected (implicit tariffs). The 8-digit HS
MFN tariff rates data were first transformed to the 6-digit level and then to the SITC format
using an HS (6-digit) to SITC (4-digit) concordance. The trade elasticities used were obtained
from Stern et al (1976) supplemented by elasticities from the GTAP/World Bank database (see
www.worldbank.org/trade).

12
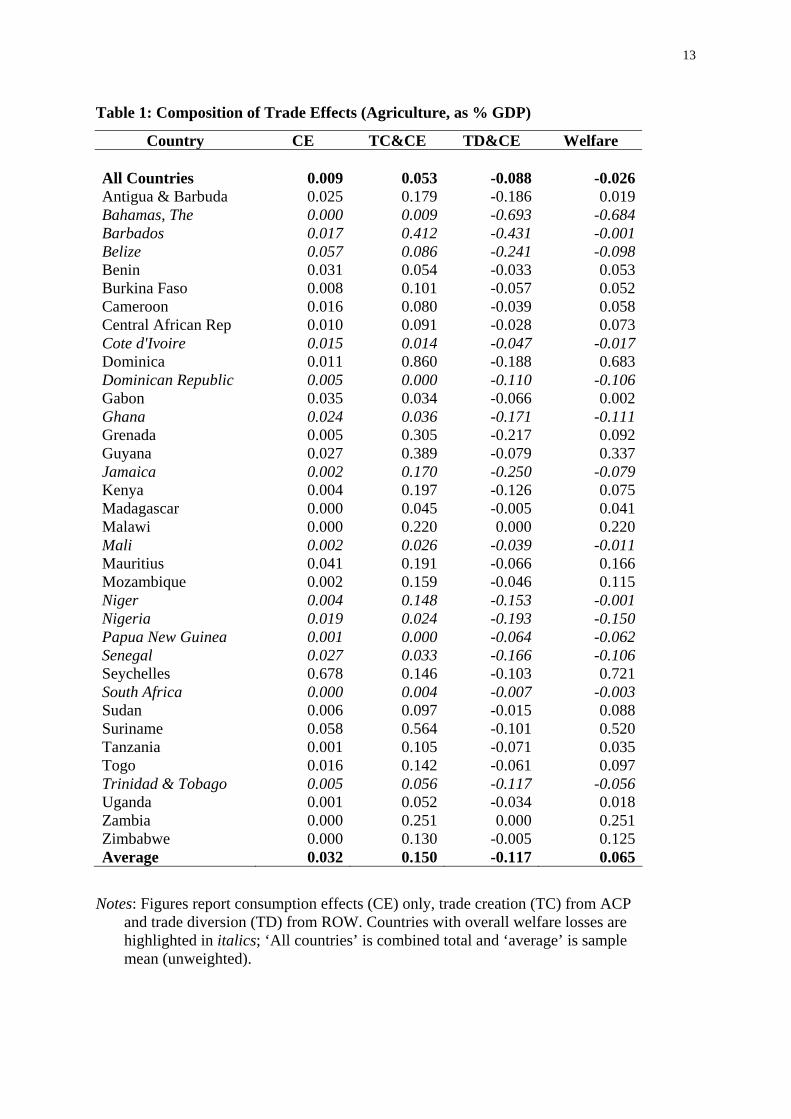
Table 1 summarizes the welfare estimates distinguishing consumption effects (CE), TC&CE
and TD&CE. Clearly, as shown above, the latter is always negative and both of the former are
positive, so the sign of the overall welfare effect depends on the relative magnitude of the latter.
For the sample combined (all countries) the welfare effect is negative but very small, about -
0.03% of GDP; the ACP overall loses. However, taking the unweighted mean for the sample
(average), the welfare effect is positive and larger, about 0.07% of GDP; the average ACP
country gains. While estimates of welfare effect tend to be small relative to GDP, it should be
emphasized that these results relate to agriculture imports only. For the larger non-LDC ACP
countries, effects in manufacturing may be greater (we leave this to future analysis), although
they will remain small relative to GDP. Nevertheless, in respect of agriculture a positive effect
on welfare prevails, although the largest countries experience a welfare loss.
Twenty-two countries, 61% of the sample, are estimated to experience a welfare improvement,
including the majority of LDCs (11 out of 13, or 85%). Half of these have a relatively low
initial share of imports from ROW (40% or less, Appendix Table A1) so the potential for TD is
limited. The welfare effects will depend on what is happening at an individual product level, in
terms of both the ability of the EU to displace suppliers from ACP or ROW and the
responsiveness of imports to a reduction in tariffs (as this determines CE). The gain varies from
0.7% of GDP in Dominica and Seychelles, 0.5% in Surinam and 0.3% in Guyana to around
0.02% of GDP or less in Antigua & Barbuda, Uganda and Gabon.
13
Table 1: Composition of Trade Effects (Agriculture, as % GDP)
Country CE TC&CE TD&CE Welfare All Countries 0.009 0.053 -0.088 -0.026 Antigua & Barbuda 0.025 0.179 -0.186 0.019 Bahamas, The 0.000 0.009 -0.693 -0.684 Barbados 0.017 0.412 -0.431 -0.001 Belize 0.057 0.086 -0.241 -0.098 Benin 0.031 0.054 -0.033 0.053 Burkina Faso 0.008 0.101 -0.057 0.052 Cameroon 0.016 0.080 -0.039 0.058 Central African Rep 0.010 0.091 -0.028 0.073 Cote d'Ivoire 0.015 0.014 -0.047 -0.017 Dominica 0.011 0.860 -0.188 0.683 Dominican Republic 0.005 0.000 -0.110 -0.106 Gabon 0.035 0.034 -0.066 0.002 Ghana 0.024 0.036 -0.171 -0.111 Grenada 0.005 0.305 -0.217 0.092 Guyana 0.027 0.389 -0.079 0.337 Jamaica 0.002 0.170 -0.250 -0.079 Kenya 0.004 0.197 -0.126 0.075 Madagascar 0.000 0.045 -0.005 0.041 Malawi 0.000 0.220 0.000 0.220 Mali 0.002 0.026 -0.039 -0.011 Mauritius 0.041 0.191 -0.066 0.166 Mozambique 0.002 0.159 -0.046 0.115 Niger 0.004 0.148 -0.153 -0.001 Nigeria 0.019 0.024 -0.193 -0.150 Papua New Guinea 0.001 0.000 -0.064 -0.062 Senegal 0.027 0.033 -0.166 -0.106 Seychelles 0.678 0.146 -0.103 0.721 South Africa 0.000 0.004 -0.007 -0.003 Sudan 0.006 0.097 -0.015 0.088 Suriname 0.058 0.564 -0.101 0.520 Tanzania 0.001 0.105 -0.071 0.035 Togo 0.016 0.142 -0.061 0.097 Trinidad & Tobago 0.005 0.056 -0.117 -0.056 Uganda 0.001 0.052 -0.034 0.018 Zambia 0.000 0.251 0.000 0.251 Zimbabwe 0.000 0.130 -0.005 0.125 Average 0.032 0.150 -0.117 0.065
Notes: Figures report consumption effects (CE) only, trade creation (TC) from ACP and trade diversion (TD) from ROW. Countries with overall welfare losses are highlighted in italics; ‘All countries’ is combined total and ‘average’ is sample mean (unweighted).

14
The overall welfare effect is negative for 14 countries (indicated in italics in the table), almost
40% of the sample; six in the Caribbean, seven in Africa and PNG, the only Pacific country
included.5 It is interesting to note that only two of these countries are LDCs, Mali and Niger;
LDCs are far less likely to experience negative welfare effects. A clear majority (86%) of those
experiencing welfare losses are non-LDCs, over half (52%) of the non-LDCs in the sample. In
general, countries experiencing welfare losses sourced over 55% of agriculture imports from
ROW (Appendix Table A1) and were the only countries with such high import shares from
ROW.6 The exceptions are Mali (36% from ROW), Cote d’Ivoire (38%), Nigeria (43%) and
Senegal (52%), the implication being that the EU has a relatively strong capacity to displace
some of these ROW imports and the import responsiveness (elasticities) are relatively low in
those products where the EU is dominant. In sum, the losers are more likely to be non-LDCs
that initially have a relatively high share of agriculture imports from the ROW (note that we
consider welfare impacts excluding revenue effects).
For the ACP sample overall, agriculture imports from the EU increase by 18% of their pre-EPA
level, equivalent to 5% of total agriculture imports; the mean increase is 35% (heavily
influenced by three large outliers) and 6% respectively (Table 3 below). Countries with an
estimated welfare loss experience relatively high percentage increases in EU imports relative to
the initial value (over 40% in four cases and 20-40% in another five, i.e. 9 out of 13); Mali
(4%), South Africa (9%), Cote d’Ivoire and Senegal (12%) are the major exceptions (Table 3).
In contrast, countries with estimated welfare gains exhibit relatively low percentage increases,
below the all country average (18%) in 11 cases (from 22).7 The increase in imports from the
EU as a percentage of total imports shows no clear pattern comparing welfare gainers and
losers. This highlights the fact that it is not the change in total imports that matters, but
structure of trade within the products affected (specifically, the balance between CE and TD).
5 Unfortunately, data availability for the small Pacific islands was very limited. South Africa is included although it only has observer status in the ACP. 6 Cuba and Vanuatu also had very high import shares from ROW and are likely to experience a negative welfare impact (not included in tables 1 and 2 due to missing GDP data). Antigua & Barbuda and Tanzania were the only countries with high ROW import shares (at least 60%) that did not have a negative welfare impact; both had quite low initial EU import shares (less than 15%), suggesting limited capability of the EU to displace ROW imports. 7 Cuba and Vanuatu are omitted from these numbers).

15
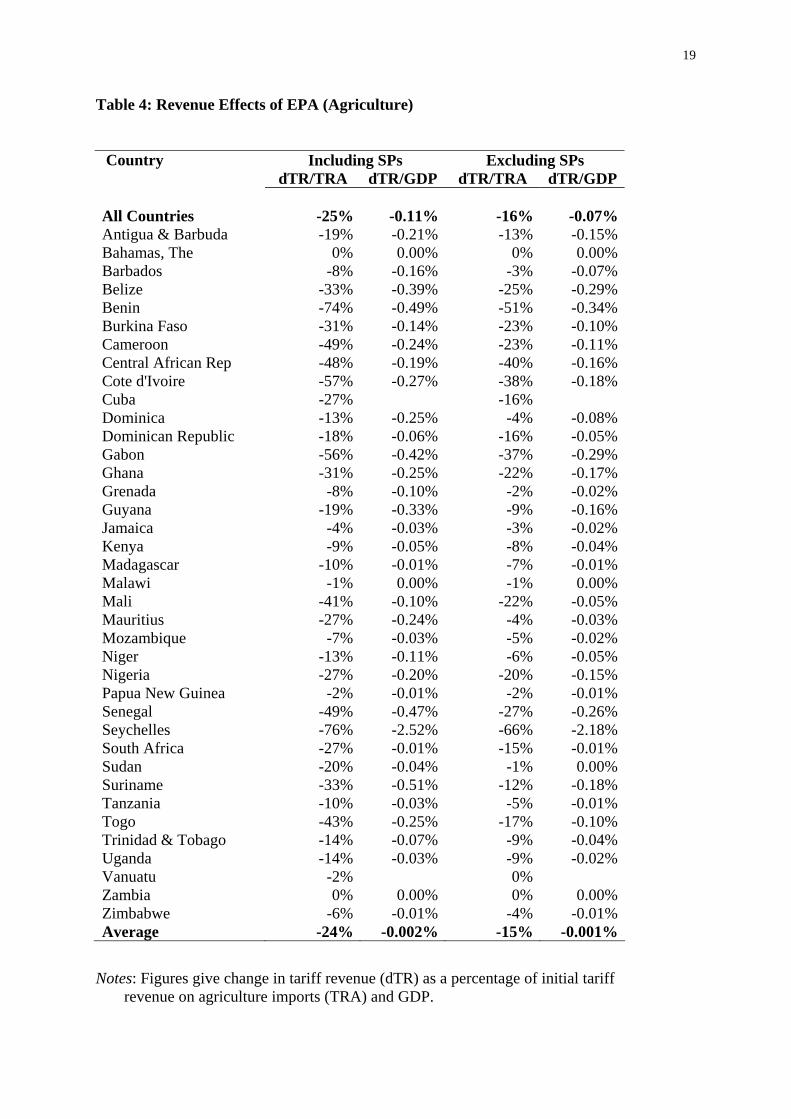
While the welfare effects are most likely to be positive, the revenue impacts are always
negative; on average the revenue loss is equivalent to 25% of tariff revenue from agriculture
imports, although small relative to GDP (Table 4 below). Fourteen countries (37% of the
sample of 38) could lose at least 30% of revenue on agriculture imports, typically equivalent to
at least 0.2% of GDP (but tariff structures and revenue totals vary considerably). At one
extreme is the Seychelles, where the loss of 76% of agriculture tariff revenue is equivalent to
2.5% of GDP; whereas Benin loses a similar proportion of tariff revenue, this is only equivalent
to 0.5% of GDP (still relatively large). For countries estimated to experience a welfare gain,
this is typically more than offset by the revenue loss (relative to GDP). However, there are
important exceptions at the lower end: among LDCs, Mali and Zambia experience no tariff
losses: Mali’s welfare loss is not exacerbated, whereas Zambia’s welfare gain is not offset.
There are other countries that had low or zero tariffs on affected agriculture products, such as
Bahamas, Jamaica, Malawi and Zimbabwe, where revenue losses are zero or negligible.
Zambia is an interesting case: almost all agriculture imports come from the ACP (especially
South Africa) and only 2% from the EU (Appendix table A1). These imports are already tariff
free so there is no revenue loss (Table 4). As the EU has limited capacity to displace these ACP
imports so although imports from the EU almost double this is only equivalent to a 2% increase
in agriculture imports (Table 3); the welfare gain on TC provides the total welfare gain of
0.25% of GDP (Table 1).
Treatment of Sensitive Products
As the requirement is to liberalise ‘substantially all trade’ this allows ACP countries to exempt
sensitive products (SPs) from liberalisation. As discussed above, tariffs can be maintained on
20-30% of products. For convenience, in the preliminary analysis of excluding SPs here we
assume that 20% of agriculture imports can be excluded. There are no clear criteria for which
products will be classed as SPs, and indeed this an issue on which negotiations have made very
little progress. We consider below the appropriate criteria (in welfare terms) to be applied in
future analysis, but here consider two criteria that seem to appeal to policy-makers in ACP
countries. The ACP countries are negotiating as regional groups so they will have to agree a
common list of SPs; our first criterion is to define as SPs any products where other ACP
countries account for a large proportion of imports and the EU is already a competitor.8 As they
8 Although imports from the ACP account for 20-30% of agriculture imports in 16 (42%) of the sample of ACP countries and over 30% in a further five (13%), peaking at 84% for Malawi and 92% for Zambia (Appendix

16
are particularly concerned about revenue losses, the second criterion applied (if the first does
not exclude 20% of imports) is to define as SPs products where tariffs are initially high and
there is little scope for tax substitution. Often, imports of alcoholic beverages face the highest
tariffs; as these can easily be replaced with Excise Duties, and often do not compete directly
with domestic producers, they are not suitable candidates for SP status. In principle one wants
do identify products where there is potential for competitive domestic production (even if this
has not been fully realised). However, we do not have data on domestic production at the
product level, so assume that high tariffs are to protect domestic producers.9 Although short-
term welfare analysis suggests that the consumer gains from tariff reductions will off-set the
producer losses so there is a net welfare gain, it should not be assumed that domestic producers
are necessarily uncompetitive in a longer-term perspective.10
Table A1), this does not apply at each product level. We focus on products where the EU competes with ACP as a supplier, as only in these cases is there scope for TC. 9 A related issue is the possibility or perception that imports are subsidized, where particularly high tariffs are justified to support domestic producers. For example, the EAC Secretariat applies sensitivity status where products face ‘unfair’ competition from subsidized imports, e.g. sugar and wheat from the EU. Thus sugar has a common external tariff of 100% and Milk (various forms) has a CET of 60%, whereas the maximum CET for non-sensitive products is 25%. 10 This can not be addressed within our partial equilibrium framework, and indeed is only partially incorporated in CGE models. This criterion does help to identify SPs so one can then, at a country level, seek information on the potential for domestic production (and the possibility that imports from the EU benefit from subsidies).
17
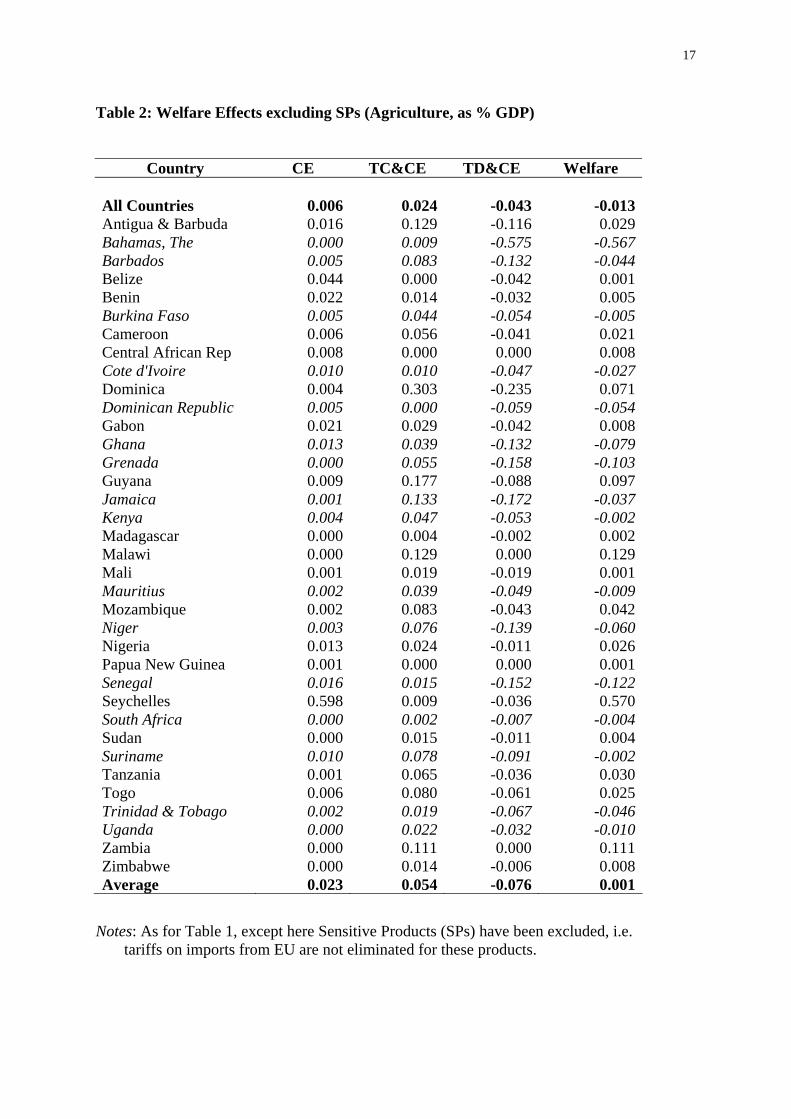
Table 2: Welfare Effects excluding SPs (Agriculture, as % GDP)
Country CE TC&CE TD&CE Welfare All Countries 0.006 0.024 -0.043 -0.013 Antigua & Barbuda 0.016 0.129 -0.116 0.029 Bahamas, The 0.000 0.009 -0.575 -0.567 Barbados 0.005 0.083 -0.132 -0.044 Belize 0.044 0.000 -0.042 0.001 Benin 0.022 0.014 -0.032 0.005 Burkina Faso 0.005 0.044 -0.054 -0.005 Cameroon 0.006 0.056 -0.041 0.021 Central African Rep 0.008 0.000 0.000 0.008 Cote d'Ivoire 0.010 0.010 -0.047 -0.027 Dominica 0.004 0.303 -0.235 0.071 Dominican Republic 0.005 0.000 -0.059 -0.054 Gabon 0.021 0.029 -0.042 0.008 Ghana 0.013 0.039 -0.132 -0.079 Grenada 0.000 0.055 -0.158 -0.103 Guyana 0.009 0.177 -0.088 0.097 Jamaica 0.001 0.133 -0.172 -0.037 Kenya 0.004 0.047 -0.053 -0.002 Madagascar 0.000 0.004 -0.002 0.002 Malawi 0.000 0.129 0.000 0.129 Mali 0.001 0.019 -0.019 0.001 Mauritius 0.002 0.039 -0.049 -0.009 Mozambique 0.002 0.083 -0.043 0.042 Niger 0.003 0.076 -0.139 -0.060 Nigeria 0.013 0.024 -0.011 0.026 Papua New Guinea 0.001 0.000 0.000 0.001 Senegal 0.016 0.015 -0.152 -0.122 Seychelles 0.598 0.009 -0.036 0.570 South Africa 0.000 0.002 -0.007 -0.004 Sudan 0.000 0.015 -0.011 0.004 Suriname 0.010 0.078 -0.091 -0.002 Tanzania 0.001 0.065 -0.036 0.030 Togo 0.006 0.080 -0.061 0.025 Trinidad & Tobago 0.002 0.019 -0.067 -0.046 Uganda 0.000 0.022 -0.032 -0.010 Zambia 0.000 0.111 0.000 0.111 Zimbabwe 0.000 0.014 -0.006 0.008 Average 0.023 0.054 -0.076 0.001
Notes: As for Table 1, except here Sensitive Products (SPs) have been excluded, i.e. tariffs on imports from EU are not eliminated for these products.
18
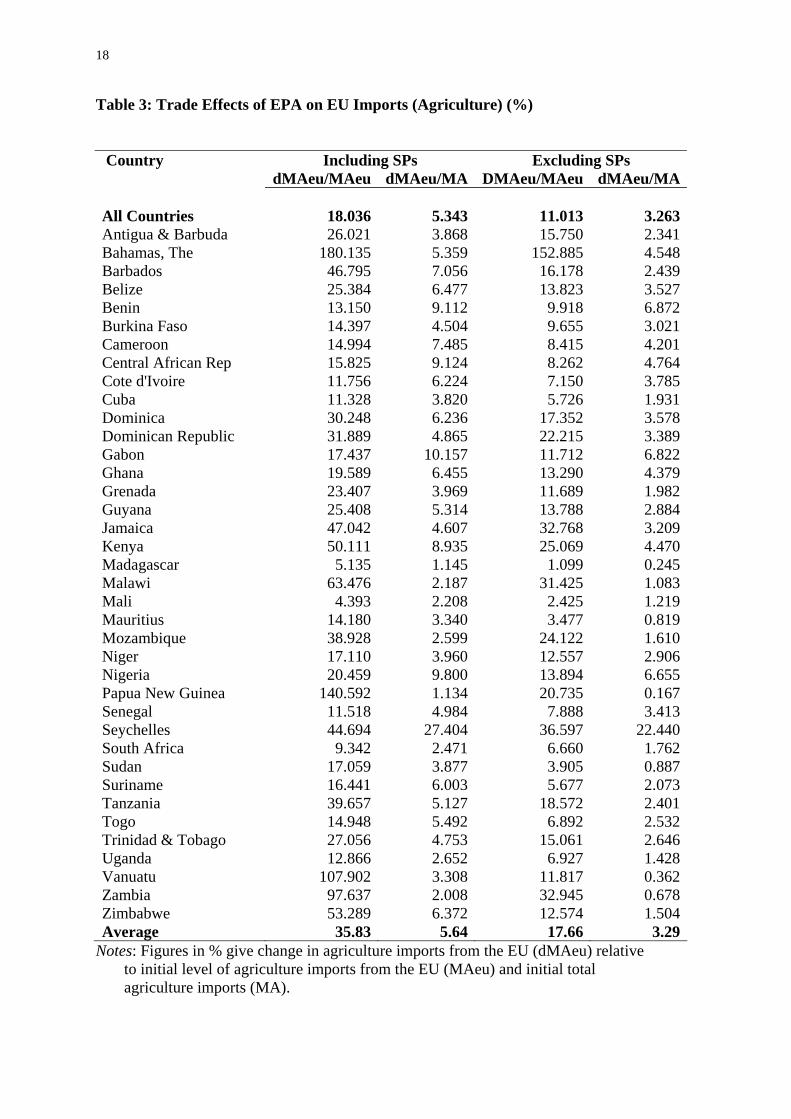
Table 3: Trade Effects of EPA on EU Imports (Agriculture) (%)
Country Including SPs Excluding SPs dMAeu/MAeu dMAeu/MA DMAeu/MAeu dMAeu/MA All Countries 18.036 5.343 11.013 3.263Antigua & Barbuda 26.021 3.868 15.750 2.341Bahamas, The 180.135 5.359 152.885 4.548Barbados 46.795 7.056 16.178 2.439Belize 25.384 6.477 13.823 3.527Benin 13.150 9.112 9.918 6.872Burkina Faso 14.397 4.504 9.655 3.021Cameroon 14.994 7.485 8.415 4.201Central African Rep 15.825 9.124 8.262 4.764Cote d'Ivoire 11.756 6.224 7.150 3.785Cuba 11.328 3.820 5.726 1.931Dominica 30.248 6.236 17.352 3.578Dominican Republic 31.889 4.865 22.215 3.389Gabon 17.437 10.157 11.712 6.822Ghana 19.589 6.455 13.290 4.379Grenada 23.407 3.969 11.689 1.982Guyana 25.408 5.314 13.788 2.884Jamaica 47.042 4.607 32.768 3.209Kenya 50.111 8.935 25.069 4.470Madagascar 5.135 1.145 1.099 0.245Malawi 63.476 2.187 31.425 1.083Mali 4.393 2.208 2.425 1.219Mauritius 14.180 3.340 3.477 0.819Mozambique 38.928 2.599 24.122 1.610Niger 17.110 3.960 12.557 2.906Nigeria 20.459 9.800 13.894 6.655Papua New Guinea 140.592 1.134 20.735 0.167Senegal 11.518 4.984 7.888 3.413Seychelles 44.694 27.404 36.597 22.440South Africa 9.342 2.471 6.660 1.762Sudan 17.059 3.877 3.905 0.887Suriname 16.441 6.003 5.677 2.073Tanzania 39.657 5.127 18.572 2.401Togo 14.948 5.492 6.892 2.532Trinidad & Tobago 27.056 4.753 15.061 2.646Uganda 12.866 2.652 6.927 1.428Vanuatu 107.902 3.308 11.817 0.362Zambia 97.637 2.008 32.945 0.678Zimbabwe 53.289 6.372 12.574 1.504Average 35.83 5.64 17.66 3.29
Notes: Figures in % give change in agriculture imports from the EU (dMAeu) relative to initial level of agriculture imports from the EU (MAeu) and initial total agriculture imports (MA).
19
Table 4: Revenue Effects of EPA (Agriculture)
Country Including SPs Excluding SPs dTR/TRA dTR/GDP dTR/TRA dTR/GDP All Countries -25% -0.11% -16% -0.07% Antigua & Barbuda -19% -0.21% -13% -0.15% Bahamas, The 0% 0.00% 0% 0.00% Barbados -8% -0.16% -3% -0.07% Belize -33% -0.39% -25% -0.29% Benin -74% -0.49% -51% -0.34% Burkina Faso -31% -0.14% -23% -0.10% Cameroon -49% -0.24% -23% -0.11% Central African Rep -48% -0.19% -40% -0.16% Cote d'Ivoire -57% -0.27% -38% -0.18% Cuba -27% -16% Dominica -13% -0.25% -4% -0.08% Dominican Republic -18% -0.06% -16% -0.05% Gabon -56% -0.42% -37% -0.29% Ghana -31% -0.25% -22% -0.17% Grenada -8% -0.10% -2% -0.02% Guyana -19% -0.33% -9% -0.16% Jamaica -4% -0.03% -3% -0.02% Kenya -9% -0.05% -8% -0.04% Madagascar -10% -0.01% -7% -0.01% Malawi -1% 0.00% -1% 0.00% Mali -41% -0.10% -22% -0.05% Mauritius -27% -0.24% -4% -0.03% Mozambique -7% -0.03% -5% -0.02% Niger -13% -0.11% -6% -0.05% Nigeria -27% -0.20% -20% -0.15% Papua New Guinea -2% -0.01% -2% -0.01% Senegal -49% -0.47% -27% -0.26% Seychelles -76% -2.52% -66% -2.18% South Africa -27% -0.01% -15% -0.01% Sudan -20% -0.04% -1% 0.00% Suriname -33% -0.51% -12% -0.18% Tanzania -10% -0.03% -5% -0.01% Togo -43% -0.25% -17% -0.10% Trinidad & Tobago -14% -0.07% -9% -0.04% Uganda -14% -0.03% -9% -0.02% Vanuatu -2% 0% Zambia 0% 0.00% 0% 0.00% Zimbabwe -6% -0.01% -4% -0.01% Average -24% -0.002% -15% -0.001%
Notes: Figures give change in tariff revenue (dTR) as a percentage of initial tariff revenue on agriculture imports (TRA) and GDP.

20
The estimates of the composition of welfare effects when these criteria are applied to exclude
SPs are shown in Table 2. It remains true that the ACP overall loses, although the ‘all
countries’ negative welfare effect is only about -0.01% of GDP. It is also still true that the
average ACP country gains (as do the majority of individual countries, 66%), but the average
welfare gain falls to a negligible 0.001% of GDP. Although the TD&CE loss tends to fall, from
-0.09 to -0.04 of GDP for all countries or from -0.12 to -0.08 on average, this is more than
offset by reductions in welfare gains. The CE gain declines on average from 0.03 to 0.02 (and
for all countries from 0.009 to 0.006), and the TC&CE gain declines more significantly, from
0.15 to 0.05 on average and from 0.05 to 0.02 for all countries. This clearly reflects our
(plausible) choice of SP criterion in excluding products imported from the ACP.
The number of countries estimated to experience a welfare loss increases from 14 to 16 (44%
of sample), although only ten countries had a negative welfare effect in both sets of estimates.
For four countries excluding SPs reversed a negative welfare impact to a positive one: Mali,
Belize, Nigeria and PNG. The composition of the changes is different in each case, but driven
by a lower TD loss. In PNG, the negative TD effect is eliminated, leaving a small positive CE
effect. In Nigeria, although the CE gain falls slightly the TD loss is significantly reduced. In
Belize and Mali all effects are smaller but the TD loss is reduced the most. However, for six
countries excluding SPs resulted in a positive effect becoming negative: Burkina Faso,
Grenada, Kenya, Mauritius, Surinam and Uganda. In all cases this is driven by much lower TC
gains, reflecting the exclusion of ACP imports from tariff reductions. It is important to
emphasize that whilst excluding ACP products from tariff reductions reduces potential gains in
importing countries, from the (regional) ACP perspective this may be more than offset by
producer gains in exporting countries.
Table 3 shows the trade effects of excluding SPs. Unsurprisingly, the percentage increase in
imports from the EU is significantly reduced: for all countries, from 18% (equivalent to a 5%
increase in total agriculture imports) to 11% (3%); on average, from 36% (7% on total) to 18%
(3%). Relative to total agriculture imports, the percentage increase in imports from the EU is
roughly halved, overall and for most individual countries. For some countries the decline is
dramatic (e.g. PNG), although for a few it is quite small in proportional terms (e.g. Benin,
Jamaica).

21
Table 4 confirms that the revenue impact is significantly reduced by excluding SPs, from an
average of about 24% of agricultural tariff revenue to 15%, equivalent to a negligible
proportion of GDP (0.001% on average, although -0.07% overall). Nevertheless, even with SPs
excluded some countries can anticipate large revenue losses: the Seychelles (66% of TRA) and
Benin (51%) are the extreme, but 10 countries still lose 20-50% of agriculture tariff revenue,
and another six lose over 10%. Three countries have zero revenue losses, and another 11 lose
5% or less.
Table 5: Gainers and Losers from Excluding SPs (Agriculture, % GDP)
Country dW dW (SP) Country Dw dW (SP)
Increased Loss (5)
Reduced Gain (14)
Barbados -0.001 -0.044 Benin 0.053 0.005 Cote d'Ivoire -0.017 -0.027 Cameroon 0.058 0.021
Niger -0.001 -0.060Central African Rep 0.073 0.008
Senegal -0.106 -0.122 Dominica 0.683 0.071 South Africa -0.003 -0.004 Guyana 0.337 0.097 Madagascar 0.041 0.002 Gain Reversed (6) Malawi 0.220 0.129 Burkina Faso 0.052 -0.005 Mozambique 0.115 0.042 Grenada 0.092 -0.103 Seychelles 0.721 0.570 Kenya 0.075 -0.002 Sudan 0.088 0.004 Mauritius 0.166 -0.009 Tanzania 0.035 0.030 Suriname 0.520 -0.002 Togo 0.097 0.025 Uganda 0.018 -0.010 Zambia 0.251 0.111 Zimbabwe 0.125 0.008 Loss Reduced (5) Loss Reversed (4) Bahamas, The -0.684 -0.567 Belize -0.098 0.001 Dominican Republic -0.106 -0.054 Mali -0.011 0.001 Ghana -0.111 -0.079 Nigeria -0.150 0.026 Jamaica -0.079 -0.037 Papua New Guinea -0.062 0.001 Trinidad & Tobago -0.056 -0.046 Gain Increased (2) Antigua & Barbuda 0.019 0.029 Gabon 0.002 0.008

22
Table 5 summarizes the effect on welfare estimates of excluding SPs: 69% of countries are
worse-off under our classification of SPs, either because the extent of welfare loss is increased
(5 countries), a gain becomes a welfare loss (6) or the welfare gain is lower (14). Just over 30%
of countries are better-off, either because the welfare loss is reduced (5), a loss becomes a gain
(4) or the welfare gain is greater when SPs are excluded (only two countries). There is no
obvious particular feature that distinguishes the countries gaining by excluding SPs from those
losing, although the gainers tend to have relative low initial shares of imports from the ACP
and only one (Mali) is an LDC. Only Antigua & Barbuda and Jamaica source more that 20% of
imports from the ACP, whereas Bahamas, Belize, Dominican Republic, Nigeria and PNG
imports less than 10% from the ACP. All LDCs except Mali are made worse off by this method
of classifying SPs, although ten (including Mali, 77% of LDCs) nevertheless experience
welfare gains.
Finally, it can be noted that we did conduct some sensitivity analysis by allowing the
elasticities used to vary to give upper and lower bound estimates (see Appendix Table A2).
While the magnitude of trade (import) and CE effects differed, this did not alter the sign or
relative size of overall or country effects. Our results can be considered as indicative of the
likely trade, welfare and revenue effects for agriculture imports.
5. CONCLUSIONS AND PROPOSED EXTENSIONS
Our analysis suggests that ACP countries should not be excessively concerned about the impact
of EPAs: even assuming ‘immediate’ complete elimination of all tariffs on agriculture imports
from the EU, and when excluding up to 20% of imports as sensitive products, over half of ACP
countries are likely to experience welfare gains. However, although most LDCs gain (10 out of
13), most non-LDCs (about 60%) lose.11 As is typical with estimates of welfare impacts, the
overall effect relative to GDP tends to be very small, whether positive or negative. The largest
gains (when SPs are not excluded) are 0.7% of GDP for Dominica and Seychelles, but most
11 As our partial equilibrium method only considers the welfare effect on imports, and hence on countries as importers, we do not allow for the potential loss of ACP regional exporters displaced by competition from the EU in regional markets. As non-LDCs are more likely to be regional exporters, albeit in manufacturing (not considered here) rather than agriculture, our estimates may understate their losses. On the other hand, it is the non-LDCs who stand to gain most from increased trade preferences in access to the EU under an EPA.
23
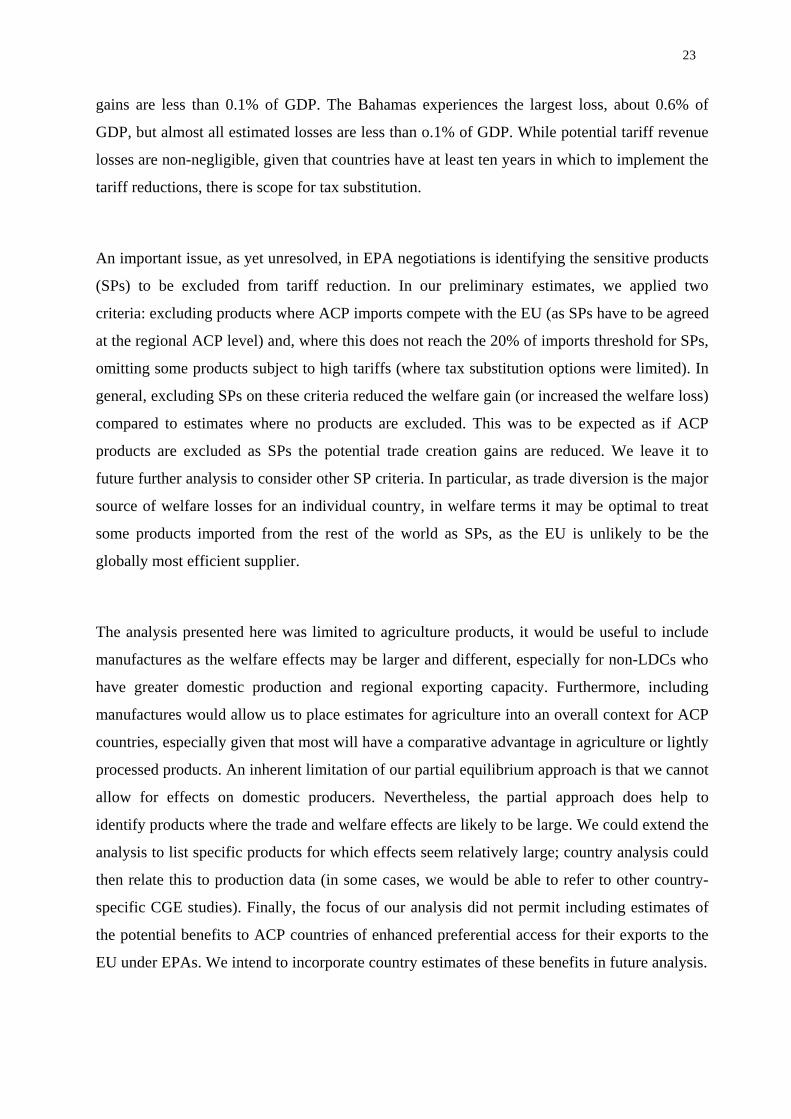
gains are less than 0.1% of GDP. The Bahamas experiences the largest loss, about 0.6% of
GDP, but almost all estimated losses are less than o.1% of GDP. While potential tariff revenue
losses are non-negligible, given that countries have at least ten years in which to implement the
tariff reductions, there is scope for tax substitution.
An important issue, as yet unresolved, in EPA negotiations is identifying the sensitive products
(SPs) to be excluded from tariff reduction. In our preliminary estimates, we applied two
criteria: excluding products where ACP imports compete with the EU (as SPs have to be agreed
at the regional ACP level) and, where this does not reach the 20% of imports threshold for SPs,
omitting some products subject to high tariffs (where tax substitution options were limited). In
general, excluding SPs on these criteria reduced the welfare gain (or increased the welfare loss)
compared to estimates where no products are excluded. This was to be expected as if ACP
products are excluded as SPs the potential trade creation gains are reduced. We leave it to
future further analysis to consider other SP criteria. In particular, as trade diversion is the major
source of welfare losses for an individual country, in welfare terms it may be optimal to treat
some products imported from the rest of the world as SPs, as the EU is unlikely to be the
globally most efficient supplier.
The analysis presented here was limited to agriculture products, it would be useful to include
manufactures as the welfare effects may be larger and different, especially for non-LDCs who
have greater domestic production and regional exporting capacity. Furthermore, including
manufactures would allow us to place estimates for agriculture into an overall context for ACP
countries, especially given that most will have a comparative advantage in agriculture or lightly
processed products. An inherent limitation of our partial equilibrium approach is that we cannot
allow for effects on domestic producers. Nevertheless, the partial approach does help to
identify products where the trade and welfare effects are likely to be large. We could extend the
analysis to list specific products for which effects seem relatively large; country analysis could
then relate this to production data (in some cases, we would be able to refer to other country-
specific CGE studies). Finally, the focus of our analysis did not permit including estimates of
the potential benefits to ACP countries of enhanced preferential access for their exports to the
EU under EPAs. We intend to incorporate country estimates of these benefits in future analysis.

24
REFERENCES
Balassa, B. (1974), ‘Trade creation and trade diversion in the European Common Market: An
appraisal of the evidence’, Manchester School, vol. 42, no. 1: 93-135.
Brenton, P. and T. Ikezuki (2007), ‘The Value of Trade Preferences for Africa’, in R.
Newfarmer (ed), Trade, Doha and Development: A Window on the Issues, Washington,
DC: The World Bank.
Busse, M. and H. Grossman (2007), ‘The Trade and Fiscal Impact of EU/ACP Economic
Partnership Agreements on West African Countries’, Journal of Development Studies, Vol.
43, no. 5, pp. 787–811.
Commission for Africa (2005), Our Common Interest: Report of the Commission for Africa,
London: Commission for Africa.
Frazer, G. and J. van Biesebroeck (2007), ‘Trade Growth Under the African Growth and
Opportunity Act, NBER Working Paper No. W13222.
Lyakurwa, W., A. McKay, N. Ng’eno and W. Kennes (1997), ‘Regional Integration in Sub-
Saharan Africa: A Review of Experiences and Issues’, in A. Oyejide, I. Elbadawi and P.
Collier (eds), Regional Integration and Trade Liberalisation in Sub-Saharan Africa (vol.
1), London: Macmillan, pp. 159-209.
Collier, P. and J. W. Gunning (1995), ‘Trade Policy and Regional Integration: Implications for
the Relations between Europe and Africa’, World Economy, 18 (3): 387-410.
Karingi, S., R. Lang, N. Oulmane, R. Perez, M. Sadni and H. Ben Hammouda (2005),
Economic and Welfare Impacts of the EU-Africa Economic Partnership Agreements,
Addis Ababa: UNECA, available at www.uneca.org/trid.
Langhammer, R. (1992), ‘The developing countries and regionalism’, Journal of Common
Market Studies, vol. 30, no. 2: 211-231.
McKay, A., C. Milner and O. Morrissey (2005), ‘Some Simple Analytics of the Welfare Effects
of EU-ACP Economic Partnership Agreements’, Journal of African Economies, vol. 14,
no. 3: 327-358.
Morrissey, O. (2005), ‘Imports and Implementation: Neglected Aspects of Trade in the Report
of the Commission for Africa’, Journal of Development Studies, 41 (4), 1133-1153.
25
Ozden, C. and E. Reinhardt (2003), ‘The Perversity of Preferences: GSP and Developing
Country Trade Policies 1976-2000’, Policy Research Working Paper No. 2955 (January),
Washington, DC: The World Bank.
Panagariya, A. (1998), ‘Rethinking the New Regionalism’, in J. Nash and W. Takacs (eds),
Trade Policy Reform. Lessons and Implications, Washington, DC: World Bank, pp. 87-
145.
Pearson, M. (2007), ‘Agreeing EPA Rules of Origin: A Strategy Unfolds’, Trade Negotiations
Insights, vol. 6, no. 4 (July-August): 6-8 (www.ictsd.org/tni).
Schiff, M. and L. A. Winters (2003), Regional Integration and Development, Washington DC:
The World Bank.
Stern, R., J. Francis and B. Schumacher (1976), Price Elasticities in International Trade: An
Annotated Bibliography, London: Macmillan.
Stevens, C. (2007), ‘EPAs: Entering the Danger Zone’, Trade Negotiations Insights, vol. 6, no.
4 (July-August): 1-5 (www.ictsd.org/tni).

26
APPENDIX TABLE A1: Agriculture Imports by Source
Country Year ACP EU ROW Antigua and Barbuda 1999 22.95% 14.87% 62.19% Bahamas, The 2001 2.54% 2.98% 94.48% Barbados 2001 25.01% 15.08% 59.91% Belize 2001 7.80% 25.52% 66.68% Benin 2001 7.89% 69.29% 22.81% Burkina Faso 2001 28.43% 31.29% 40.28% Cameroon 2002 12.68% 49.92% 37.40% Central African Republic 2003 22.43% 57.66% 19.92% Cote d'Ivoire 2002 9.12% 52.94% 37.94% Cuba 2001 0.52% 33.72% 65.76% Dominica 2002 40.14% 20.62% 39.25% Dominican Republic 2001 0.27% 15.26% 84.47% Gabon 2000 7.96% 58.25% 33.79% Ghana 2000 12.54% 32.95% 54.51% Grenada 2001 27.38% 16.96% 55.67% Guyana 2001 28.58% 20.92% 50.51% Jamaica 2002 20.59% 9.79% 69.61% Kenya 2002 28.54% 17.83% 53.63% Madagascar 2003 25.03% 22.29% 52.68% Malawi 2001 83.87% 3.44% 12.68% Mali 1998 14.13% 50.25% 35.61% Mauritius 2002 26.25% 23.56% 50.19% Mozambique 2001 40.35% 6.68% 52.98% Niger 2003 20.94% 23.14% 55.92% Nigeria 2000 8.88% 47.90% 43.22% Papua New Guinea 2003 0.84% 0.81% 98.36% Senegal 2002 4.90% 43.27% 51.83% Seychelles 2001 9.20% 61.32% 29.48% South Africa 2001 11.29% 26.46% 62.26% Sudan 1997 23.09% 22.72% 54.18% Suriname 2000 23.19% 36.51% 40.30% Tanzania 2000 25.38% 12.93% 61.70% Togo 2002 21.69% 36.74% 41.57% Trinidad and Tobago 2002 11.14% 17.57% 71.30% Uganda 2002 29.87% 20.62% 49.52% Vanuatu 2000 15.14% 3.07% 81.80% Zambia 2002 92.45% 2.06% 5.49% Zimbabwe 2001 57.03% 11.96% 31.01%
Notes: The countries highlighted in bold are classified as LDCs; Year refers to the year for which data were used.

27
Appendix Table A2: Summary Effects of Excluding SPs, Agriculture (%)
Sensitive Products Included Sensitive Products Excluded All Lower Middle Upper Lower Middle Upper
CE/MA 2.56 2.84 3.12 1.74 1.93 2.12
dM/MAeu 16.23 18.04 19.84 9.91 11.01 12.11
dM/GDP 0.14 0.15 0.17 0.08 0.09 0.10
dTR/TRA -25.36 -25.41 -25.46 -16.32 -16.34 -16.36
dTR/GDP -0.11 -0.11 -0.11 -0.07 -0.07 -0.07
dW/GDP -0.03 -0.03 -0.02 -0.01 -0.01 -0.01
Notes: Figures are in % and give: CE relative to total agriculture imports (MA); change in agriculture imports from the EU (dM) relative to initial level of agriculture imports from the EU (MAeu) and GDP; change in tariff revenue (dTR) as a percentage of initial tariff revenue on agriculture imports (TRA) and GDP; and overall change in welfare (dW) relative to GDP. Lower and upper estimates reduce (increase) elasticities by 10% respectively.