THE IMPACT OF DIVIDEND ANNOUNCEMENT ON STOCK …
18
47 Malaysian Management Journal Vol. 23, December 2019 47-64 How to cite this article: Tanveer, Z., & Jamil, M. (2019). The impact of dividend announcement on stock returns among the ten top companies in Pakistan. Malaysian Management Journal, Vol. 23(December), 47-64. THE IMPACT OF DIVIDEND ANNOUNCEMENT ON STOCK RETURNS AMONG THE TEN TOP COMPANIES IN PAKISTAN ZUBAIR TANVEER* Punjab Economic Research Institute Lahore, Pakistan MUHAMMAD JAMIL School of Economics Quaid-i-Azam University, Islamabad *Corresponding author: [email protected] Abstract The study tested the response of stock prices around the dividend declaration dates in Pakistan stock exchange. It estimated the data of 1110 dividends announced by 91 firms of the highest ten active sectors of Pakistan Stock Exchange. To empirically investigate the relationship between stock returns and dividend announcement, the panel regression was employed by creating dummy variables for 61 days around the dividend declaration dates. Cumulative average abnormal returns and average abnormal returns were also estimated around the events with the help of event study methodology. Outcomes of the empirical analysis revealed strong evidence of market abuse in the term of insider trading and supported the argument of the information content hypothesis and semi- strong form of efficient market. Moreover, the study also found a robust impact of the probable ex-dividend date. The study recommended that it is a responsibility of stock exchange regulatory authorities, whistleblowers, registered companies, and the investors collectively to detect and punish this white-collar financial crime.
Transcript of THE IMPACT OF DIVIDEND ANNOUNCEMENT ON STOCK …
47
Malaysian Management Journal Vol. 23, December 2019 47-64
How to cite this article:
Tanveer, Z., & Jamil, M. (2019). The impact of dividend announcement on stock returns among the ten top companies in Pakistan. Malaysian Management Journal, Vol. 23(December), 47-64.
THE IMPACT OF DIVIDEND ANNOUNCEMENT ON STOCK RETURNS AMONG THE TEN TOP
COMPANIES IN PAKISTAN
ZUBAIR TANVEER*Punjab Economic Research Institute
Lahore, Pakistan
MUHAMMAD JAMILSchool of Economics
Quaid-i-Azam University, Islamabad
*Corresponding author: [email protected]
Abstract
The study tested the response of stock prices around the dividend declaration dates in Pakistan stock exchange. It estimated the data of 1110 dividends announced by 91 firms of the highest ten active sectors of Pakistan Stock Exchange. To empirically investigate the relationship between stock returns and dividend announcement, the panel regression was employed by creating dummy variables for 61 days around the dividend declaration dates. Cumulative average abnormal returns and average abnormal returns were also estimated around the events with the help of event study methodology. Outcomes of the empirical analysis revealed strong evidence of market abuse in the term of insider trading and supported the argument of the information content hypothesis and semi-strong form of efficient market. Moreover, the study also found a robust impact of the probable ex-dividend date. The study recommended that it is a responsibility of stock exchange regulatory authorities, whistleblowers, registered companies, and the investors collectively to detect and punish this white-collar financial crime.

48
Malaysian Management Journal Vol. 23, December 2019 47-64
Keywords: Dividend announcement, dividend irrelevance hypothesis, event study methodology, stock returns.
Received: 26/11/2019 Revised: 5/3/2020 Accepted: 10/3/2020 Published: 16/4/2020
Introduction
Theprivateentitiesaimtomaximisetheirprofitsirrespectiveoftheirmarketstructure. Public limited companies distribute dividend to its shareholders. Dividend is defined as the cost of equity capital to equity shareholders(Mehndiratta & Gupta, 2010). The dividend policy is the disbursement plan made by the board of directors of the corporation to decide the volume and type of payment given to the investors on their shares. Khan (2012) stated that investors are sensitive regarding dividend as it is a source of income for them and a tool to assess the performance of a corporation. Further, the announcement of dividends has different impact on share price of companies ofdifferentsectorswhereininsidertradingalsoinfluencestheshareprices.In this perspective, it would be important to investigate the impact of dividend announcement and inside trading on share prices of top ten sectors of Pakistan Stock Exchange (PSX).
Miller and Modigliani (1961) presented the policy irrelevance hypothesis which states that, in perfect markets and perfect information, it is the investment decision rather than the dividend which exerts an impact on sharevalues.However,Gordon(1963)arguedthatdividendhasasignificantimpact on share prices. Lintner (1956) provided the foundation for the dividend signaling theory which states that the behavior of the managers indicates to investors with a signal of increase in dividend which develops positive perception among the investors about forthcoming prospects of the investment. Similarly, the “information content of dividends” theoryassumes that managers have more information than investors and dividend is a source of reducing asymmetric information among them. Correspondingly, the tax clientele effect (Baker, 2009) explained that as capital gain faces less tax than the ordinary income tax levied on dividend, it is better for a firmtoreducethedividendtoincreasetheoverallvalueofshares.However,thecorporations still announcedividendswhichhasbecomeapuzzleandenigmaforfinancialeconomists.
There are several factors like bonus issue, stocks split, rights issue and dividends which influence share prices directly and indirectly identifiedbyvariousstudies(Ahmed&Javid,2008;Chaudhary,Hashmi&Younis,
49
Malaysian Management Journal Vol. 23, December 2019 47-64
2016;Mahmood, Sheikh&Ghaffari. 2011;Mehndiratta&Gupta, 2010;Mukora,2013;Ngoc&Cuong,2016;Nishat&Irfan,2004;Rajamohan&Muthukamu,2014;Rosario&Chavali,2016).
The first research question of the current study is whether dividendannouncements have a significant impact on the prices of the stocks ofthe top ten active sectors of PSX. The other research query is to check whether insider trading exists on the event of dividend announcement. This investigationwould be valuable in financial economics as itwill providepractical conclusions on the relationships of dividend policy and the performance of top active sectors of PSX.
Although there are many other studies that have been conducted in Pakistan, however, there is no study that has used the panel regression analysis with dummy variables around the dividend announcement dates and event study methodology by taking daily data with such a large sample size of topten active sectors of PSX. Moreover, the study has computed short term, medium term and long term event windows as well as also constructed two estimated windows for the analysis which is clearly a novel contribution in the empirical work of this area.
Literature Review
Some studies such as Aharony and Swary (1980), Asquith and Mullins (1983), Venkatesh (1989) and Mukora (2013) found a direct association between dividends and stock returns. Moreover, the results of Below and Johnson (1996) supported the doctrine of information content hypothesis (ICH) that dividend conveys useful information to the investors. Habibullah and Baharumshah, (1999) and Abdullah, Rashid and Ibrahim (2002) also examinedtheefficientmarkethypothesisandICHinKualaLumpurStockMarket(KLSE).Similarly,Sanda,ShafieandGupta(2002)usedarandomwalk hypothesis to investigate the behaviour of stock prices in KLSE. Saleh (2007) also provided evidence for the insider trading and leakages of information.
Rajamohan and Muthukamu (2014), Majanga (2015), and Sharif, Purohit and Pillai (2015) proved that the dividends had the strongest impact on stock prices. Rosario and Chavali (2016) narrated that the post-event average abnormal returns (AAR) and cumulative average abnormal returns (CAAR)hada significantpattern inOman stockexchange. Jahfer (2016)and Ngoc and Cuong (2016) also provided evidence for dividend signaling
50
Malaysian Management Journal Vol. 23, December 2019 47-64
theory in Vietnam and Colombo Stock Exchange, respectively. Similarly, theoutcomeofSwarnalathaandBabu’s(2017)andOzoandArun’s(2019)studies confirmed the signaling hypothesis as well. However, the resultsof the studies by Uddin and Uddin (2014) and Khurana and Warne (2018) were in favour of the dividend irrelevant hypothesis. Likewise, in the Dhaka StockMarket,Khan(2019)didnotfindtherelationshipbetweendividendannouncements and stock returns.On theotherhand,Kadıoğlu,Telçekenand Öcal (2015) analysed the tax-clientele effect in the Turkish Stock Exchange and stated that dividend announcements negatively related to stock price due to the higher tax rates on cash dividend relative to the capital gain. Nevertheless, Poornima, Morudkar, and Reddy (2019) found positive and negative impacts of dividend announcements on returns of private and public banks respectively with the help of event study methodology and panel regression model.
In the stockmarkets of Pakistan,Nishat and Irfan (2004),Nazir,Nawaz,Anwar and Ahmed (2010), Khan (2012) as well as Chaudhary et al. (2016) examined the behavior of share price volatility around the dividend announcements. Ahmed and Javid (2008) documented that current earnings and past dividends played a key role in smoothing the dividend strategy, and othervariablesliketheconcentrationofinvestors,liquidity,size,leverage,profitabilityandinvestmentprospectshadasignificantimpactondividendplan.TheoutcomeoftheAkbarandBaig(2010)revealedefficiencyinsemi-strong form, as well as Mahmood et al. (2011), documented the prevalence of insider trading in the Karachi Stock Exchange (KSE), Pakistan.
Methodology
There are many techniques available in the literature to estimate the impact of a specific event on stockprices.Authors likeChaudhary et al. (2016),Mahmood et al. (2011), Mehndiratta and Gupta (2010), Mukora (2013), and Rosario and Chavali (2016) applied event study methodology (ESM) to examinetheresponsivenessofastock’svaluerelativetotheevent.Similarly,Naziretal.(2010),Kadıoğluetal.(2015)andSharifetal.(2015)calculatedthe reaction of share prices regarding different market variables using the randomeffectsandfixedeffectsmodels.ThepresentstudyhasusedboththeESM and panel regression analysis. Under the rationality of the market, the ESM is very much appreciated to capture the sensitivity of the share prices because Campbell and MacKinlay (1997) declared that event studies offer an idyllic instrument for investigating the information content of the disclosures and this methodology in extensively used for the empirical analysis.
51
Malaysian Management Journal Vol. 23, December 2019 47-64
Steps of Event Study Methodology
The initial step of the ESM is to identify the event. In our study, we treat the dividend announcement date as an event. After choosing the event, the ESM has the following steps:
Specify the Estimation Window
The estimation window is the time that is chosen before the event date to estimate thecoefficients throughOrdinaryLeastSquares (OLS)and thesecoefficientsarethenusedtocalculatetheexcessorabnormalreturnduringthe event window. Campbell and MacKinlay (1997) and Mahmood et al. (2011) recommended that the estimation window for each event can be 250 days and -21 to -270 days before an event, respectively. Peterson (1989) stated that for studies comprise daily data, the ideal length for the estimation window is from 100 to 300 days. However, Pynnoonen (2005) was in favour of a 120-days estimation window. The present study has used two estimation windows,thefirstisfor100daysandthesecondisfor300daysbeforetheannouncement. The logic behind using these two estimation windows is to estimate the parameters based on the minimum and maximum length1.
Calculating Normal Returns for Stock and Market
The study takes daily data of closing price for the top ten active2 sectors of PSX from 3rd January 2000 to 11th September 2017. The formula to calculate the normal return is given by Equation (1).
(1)
where Rit symbolises the normal return for the firm i during time t, Pit
indicates the closed prices of the company i during time t and Pit -1 represents the lagged value of the stock. For the calculation of market return, KSE-100 index is used as a benchmark using Equation (2).
(2)
where Rmt represents market returns for the period t, Pmt indicates the closing price of the KSE-100 index during time t, and Pmt-1 denotes its lagged value.
Estimating Abnormal Returns
Abnormal Returns (AR) are the deviation of the actual return from its expected or mean value. So, AR for the event windows have also been estimated. The
7
Calculating Normal Returns for Stock and Market
The study takes daily data of closing price for the top ten active2 sectors of PSX from 3rd January
2000 to 11th September 2017. The formula to calculate the normal return is given by equation
(1):
𝑅𝑅𝑖𝑖𝑖𝑖 = 𝑙𝑙𝑙𝑙 ( 𝑃𝑃𝑖𝑖𝑖𝑖𝑃𝑃𝑖𝑖𝑖𝑖−1
) (1)
where 𝑅𝑅𝑖𝑖𝑖𝑖 symbolises the normal return for the firm 𝑖𝑖 during time 𝑡𝑡, 𝑃𝑃𝑖𝑖𝑖𝑖 indicates the closed
prices of the company i during time t and 𝑃𝑃𝑖𝑖𝑖𝑖−1 represents the lagged value of the stock. For the
calculation of market return, KSE-100 index is used as a benchmark using equation (2):
𝑅𝑅𝑚𝑚𝑖𝑖 = 𝑙𝑙𝑙𝑙 ( 𝑃𝑃𝑚𝑚𝑖𝑖𝑃𝑃𝑚𝑚𝑖𝑖−1
) (2)
where 𝑅𝑅𝑚𝑚𝑖𝑖 represents market returns for the period 𝑡𝑡, 𝑃𝑃𝑚𝑚𝑖𝑖 indicates the closing price of the
KSE-100 index during time 𝑡𝑡, and 𝑃𝑃𝑚𝑚𝑖𝑖−1denotes its lagged value.
Estimating Abnormal Returns
Abnormal Returns (AR) are the deviation of the actual return from its expected or mean value.
So, AR for the event windows have also been estimated. The event windows are constructed
around events like the declaration of dividend dates. Peterson (1989) declared that for daily data,
the researchers may use 21 to 121 days as event windows. Rosario and Chavali (2016) created 39
days event window (±19), Chaudhary et al. (2016) made event window for ±7 days (15 days) and
Mahmood et al. (2011) generated an event window for 51 days (-20, +30) to analyse the
behaviour of stock prices. Some studies like Mukora (2013), and Rajamohan and Muthukuma
(2014) created an event window for 61 days (±30).
52
Malaysian Management Journal Vol. 23, December 2019 47-64
event windows are constructed around events like the declaration of dividend dates. Peterson (1989) declared that for daily data, the researchers may use 21 to 121 days as event windows. Rosario and Chavali (2016) created 39 days event window (±19), Chaudhary et al. (2016) made event window for ±7 days (15 days) and Mahmood et al. (2011) generated an event window for 51 days (-20, +30) to analyse the behaviour of stock prices. Some studies like Mukora (2013), and Rajamohan and Muthukuma (2014) created an event window for 61 days (±30).
The present study has constructed 15 (±7), 31 (±15) and 61 days (±30) event windows to investigate the short, medium and long term impact of dividend announcement on stock returns, respectively. Gunasekarage and Power (2006) used three trading days for the short run and 20 trading days in the long run. Similarly, Mehndiratta and Gupta (2010) constructed (±30) days for long-run analysis.
So, to calculate estimated returns, OLS technique on Equation (3) has been applied.
(3)
where Ritmeans normal returns of afirm i during time t and Rmt denotes returns of the KSE-100 index for time t. The parameters and are calculated using the OLS technique. In the given model, the assumption is that the disturbance term is independently and identically distributed having zeromeanandconstantvariance.Theperiodforthisregressionisthelengthof the estimation window. The estimated normal returns are then used to get abnormal returns shown by Equation (4).
(4)
ARit in Equation (4) represents abnormal returns of i stock for time t, and Rit are expected and actual returns respectively. Campbell and MacKinlay (1997) stated that the market model is an efficient model to extract theinfluenceofaneventbecauseiteliminatestheproportionofthevariationinthe stock prices which relates to the variation in the market index. Therefore, the difference of actual normal returns to expected returns is pure, which may help to notice the impact of the event on the share price.
Measuring the Average Abnormal Return
Toclarifywhetherthedividendannouncementhasasignificantimpactonthe stock returns, we must generate cumulative average abnormal returns
8
The present study has constructed 15 (±7), 31 (±15) and 61 days (±30) event windows to
investigate the short, medium and long term impact of dividend announcement on stock returns,
respectively. Gunasekarage and Power (2006) used three trading days for the short run and 20
trading days in the long run. Similarly, Mehndiratta and Gupta (2010) constructed (±30) days for
long-run analysis.
So, to calculate estimated returns, OLS technique on Equation (3) has been applied:
𝑅𝑅𝑖𝑖𝑖𝑖 = 𝛼𝛼𝑖𝑖 + 𝛽𝛽𝑖𝑖𝑅𝑅𝑚𝑚𝑖𝑖 + 𝜀𝜀𝑖𝑖𝑖𝑖 (3)
where 𝑅𝑅𝑖𝑖𝑖𝑖 means normal returns of a firm 𝑖𝑖 during time 𝑡𝑡 and 𝑅𝑅𝑚𝑚𝑖𝑖 denotes returns of the KSE-
100 index for time 𝑡𝑡. The parameters 𝛼𝛼𝑖𝑖 and 𝛽𝛽𝑖𝑖 are calculated using the OLS technique. In the
given model, the assumption is that the disturbance term is independently and identically
distributed having zero mean and constant variance. The period for this regression is the length
of the estimation window. The estimated normal returns (�̂�𝑅𝑖𝑖𝑖𝑖) are then used to get abnormal
returns shown by Equation (4).
𝐴𝐴𝑅𝑅𝑖𝑖𝑖𝑖 = 𝑅𝑅𝑖𝑖𝑖𝑖 − �̂�𝑅𝑖𝑖𝑖𝑖 (4)
𝐴𝐴𝑅𝑅𝑖𝑖𝑖𝑖 in Equation (4) represents abnormal returns of 𝑖𝑖 stock for time 𝑡𝑡, �̂�𝑅𝑖𝑖𝑖𝑖 and 𝑅𝑅𝑖𝑖𝑖𝑖 are expected
and actual returns respectively. Campbell and MacKinlay (1997) stated that the market model is
an efficient model to extract the influence of an event because it eliminates the proportion of the
variation in the stock prices which relates to the variation in the market index. Therefore, the
difference of actual normal returns to expected returns is pure, which may help to notice the
impact of the event on the share price.
Measuring the Average Abnormal Return 8
The present study has constructed 15 (±7), 31 (±15) and 61 days (±30) event windows to
investigate the short, medium and long term impact of dividend announcement on stock returns,
respectively. Gunasekarage and Power (2006) used three trading days for the short run and 20
trading days in the long run. Similarly, Mehndiratta and Gupta (2010) constructed (±30) days for
long-run analysis.
So, to calculate estimated returns, OLS technique on Equation (3) has been applied:
𝑅𝑅𝑖𝑖𝑖𝑖 = 𝛼𝛼𝑖𝑖 + 𝛽𝛽𝑖𝑖𝑅𝑅𝑚𝑚𝑖𝑖 + 𝜀𝜀𝑖𝑖𝑖𝑖 (3)
where 𝑅𝑅𝑖𝑖𝑖𝑖 means normal returns of a firm 𝑖𝑖 during time 𝑡𝑡 and 𝑅𝑅𝑚𝑚𝑖𝑖 denotes returns of the KSE-
100 index for time 𝑡𝑡. The parameters 𝛼𝛼𝑖𝑖 and 𝛽𝛽𝑖𝑖 are calculated using the OLS technique. In the
given model, the assumption is that the disturbance term is independently and identically
distributed having zero mean and constant variance. The period for this regression is the length
of the estimation window. The estimated normal returns (�̂�𝑅𝑖𝑖𝑖𝑖) are then used to get abnormal
returns shown by Equation (4).
𝐴𝐴𝑅𝑅𝑖𝑖𝑖𝑖 = 𝑅𝑅𝑖𝑖𝑖𝑖 − �̂�𝑅𝑖𝑖𝑖𝑖 (4)
𝐴𝐴𝑅𝑅𝑖𝑖𝑖𝑖 in Equation (4) represents abnormal returns of 𝑖𝑖 stock for time 𝑡𝑡, �̂�𝑅𝑖𝑖𝑖𝑖 and 𝑅𝑅𝑖𝑖𝑖𝑖 are expected
and actual returns respectively. Campbell and MacKinlay (1997) stated that the market model is
an efficient model to extract the influence of an event because it eliminates the proportion of the
variation in the stock prices which relates to the variation in the market index. Therefore, the
difference of actual normal returns to expected returns is pure, which may help to notice the
impact of the event on the share price.
Measuring the Average Abnormal Return
8
The present study has constructed 15 (±7), 31 (±15) and 61 days (±30) event windows to
investigate the short, medium and long term impact of dividend announcement on stock returns,
respectively. Gunasekarage and Power (2006) used three trading days for the short run and 20
trading days in the long run. Similarly, Mehndiratta and Gupta (2010) constructed (±30) days for
long-run analysis.
So, to calculate estimated returns, OLS technique on Equation (3) has been applied:
𝑅𝑅𝑖𝑖𝑖𝑖 = 𝛼𝛼𝑖𝑖 + 𝛽𝛽𝑖𝑖𝑅𝑅𝑚𝑚𝑖𝑖 + 𝜀𝜀𝑖𝑖𝑖𝑖 (3)
where 𝑅𝑅𝑖𝑖𝑖𝑖 means normal returns of a firm 𝑖𝑖 during time 𝑡𝑡 and 𝑅𝑅𝑚𝑚𝑖𝑖 denotes returns of the KSE-
100 index for time 𝑡𝑡. The parameters 𝛼𝛼𝑖𝑖 and 𝛽𝛽𝑖𝑖 are calculated using the OLS technique. In the
given model, the assumption is that the disturbance term is independently and identically
distributed having zero mean and constant variance. The period for this regression is the length
of the estimation window. The estimated normal returns (�̂�𝑅𝑖𝑖𝑖𝑖) are then used to get abnormal
returns shown by Equation (4).
𝐴𝐴𝑅𝑅𝑖𝑖𝑖𝑖 = 𝑅𝑅𝑖𝑖𝑖𝑖 − �̂�𝑅𝑖𝑖𝑖𝑖 (4)
𝐴𝐴𝑅𝑅𝑖𝑖𝑖𝑖 in Equation (4) represents abnormal returns of 𝑖𝑖 stock for time 𝑡𝑡, �̂�𝑅𝑖𝑖𝑖𝑖 and 𝑅𝑅𝑖𝑖𝑖𝑖 are expected
and actual returns respectively. Campbell and MacKinlay (1997) stated that the market model is
an efficient model to extract the influence of an event because it eliminates the proportion of the
variation in the stock prices which relates to the variation in the market index. Therefore, the
difference of actual normal returns to expected returns is pure, which may help to notice the
impact of the event on the share price.
Measuring the Average Abnormal Return

53
Malaysian Management Journal Vol. 23, December 2019 47-64
(CAAR) as well as average abnormal returns (AAR). The formula for AAR is given in Equation (5).
(5)
where shows abnormal returns and N is the number of the events. This AAR is generated for event windows, i.e. for 15 days event window (±7 days) where is the event date. Similarly, other event windows consist of 31 days (±15) and 61 days (±30 days).
Measuring Cumulative Average Abnormal Returns
CAAR is calculated for every given event window (15, 31 and 61 days) to analyse the behaviour of returns around the event. The method of computing of CAAR is as follows.
(6)
where N is the time span of event window.
Statistical Tests
The last step of the ESM is to check whether the estimated values of AAR andCAAR are statistically significant or not. For this purpose, theresearchers use different tools like Z-test and t-test. The popular t-statistic wasusedbyBrownandWarner(1980),Kadıoğluet al. (2015), Mahmood, et al. (2011), Mukora (2013), Ngoc and Cuong (2016), Rosario and Chavali (2016), and Uddin and Uddin (2014). The null hypothesis ) is that istherenosignificantchangeoccurringinstockpricesaroundthedividendannouncement date.
The formula for -test is written as:
(7)
Estimatedt-test’svaluewouldbecomparedwith.IfH0 t-value is larger then, is rejected.
Panel Data Analysis
The core advantage of the panel data technique is the investigation of the heterogeneity in cross sections and time units. This analysis has more freedom
9
To clarify whether the dividend announcement has a significant impact on the stock returns, we
must generate cumulative average abnormal returns (CAAR) as well as average abnormal returns
(AAR). The formula for AAR is given in Equation (5):
𝐴𝐴𝐴𝐴𝐴𝐴𝑡𝑡 = 1𝑁𝑁 ∑ 𝐴𝐴𝐴𝐴𝑖𝑖𝑡𝑡𝑁𝑁
𝑖𝑖=1 (5)
where 𝐴𝐴𝐴𝐴𝑖𝑖𝑡𝑡 shows abnormal returns and 𝑁𝑁 is the number of the events. This AAR is generated
for event windows, i.e. for 15 days event window (±7 days) where 𝑡𝑡 = 0 is the event date.
Similarly, other event windows consist of 31 days (±15) and 61 days (±30 days).
Measuring Cumulative Average Abnormal Returns
CAAR is calculated for every given event window (15, 31 and 61 days) to analyse the behaviour
of returns around the event. The method of computing of CAAR is as follows:
𝐶𝐶𝐴𝐴𝐴𝐴𝐴𝐴𝑡𝑡 = ∑ 𝐴𝐴𝐴𝐴𝐴𝐴𝑡𝑡𝑁𝑁𝑡𝑡=1 (6)
where 𝑁𝑁 is the time span of event window.
Statistical Tests
The last step of the ESM is to check whether the estimated values of AAR and CAAR are
statistically significant or not. For this purpose, the researchers use different tools like Z-test and
t-test. The popular t-statistic was used by Brown and Warner (1980), Kadıoğlu et al.
(2015), Mahmood, et al. (2011), Mukora (2013), Ngoc and Cuong (2016), Rosario and Chavali
(2016), and Uddin and Uddin (2014). The null hypothesis (H0) is that is there no significant
change occurring in stock prices around the dividend announcement date.
The formula for -test is written as:
𝑡𝑡 = 𝐴𝐴𝐴𝐴𝐴𝐴𝑡𝑡 𝑜𝑜𝑜𝑜 𝐶𝐶𝐴𝐴𝐴𝐴𝐴𝐴𝑡𝑡𝑆𝑆𝑡𝑡𝑆𝑆𝑆𝑆𝑆𝑆𝑆𝑆𝑜𝑜𝑆𝑆 𝐷𝐷𝐷𝐷𝐷𝐷𝑖𝑖𝑆𝑆𝑡𝑡𝑖𝑖𝑜𝑜𝑆𝑆 (7) 9
To clarify whether the dividend announcement has a significant impact on the stock returns, we
must generate cumulative average abnormal returns (CAAR) as well as average abnormal returns
(AAR). The formula for AAR is given in Equation (5):
𝐴𝐴𝐴𝐴𝐴𝐴𝑡𝑡 = 1𝑁𝑁 ∑ 𝐴𝐴𝐴𝐴𝑖𝑖𝑡𝑡𝑁𝑁
𝑖𝑖=1 (5)
where 𝐴𝐴𝐴𝐴𝑖𝑖𝑡𝑡 shows abnormal returns and 𝑁𝑁 is the number of the events. This AAR is generated
for event windows, i.e. for 15 days event window (±7 days) where 𝑡𝑡 = 0 is the event date.
Similarly, other event windows consist of 31 days (±15) and 61 days (±30 days).
Measuring Cumulative Average Abnormal Returns
CAAR is calculated for every given event window (15, 31 and 61 days) to analyse the behaviour
of returns around the event. The method of computing of CAAR is as follows:
𝐶𝐶𝐴𝐴𝐴𝐴𝐴𝐴𝑡𝑡 = ∑ 𝐴𝐴𝐴𝐴𝐴𝐴𝑡𝑡𝑁𝑁𝑡𝑡=1 (6)
where 𝑁𝑁 is the time span of event window.
Statistical Tests
The last step of the ESM is to check whether the estimated values of AAR and CAAR are
statistically significant or not. For this purpose, the researchers use different tools like Z-test and
t-test. The popular t-statistic was used by Brown and Warner (1980), Kadıoğlu et al.
(2015), Mahmood, et al. (2011), Mukora (2013), Ngoc and Cuong (2016), Rosario and Chavali
(2016), and Uddin and Uddin (2014). The null hypothesis (H0) is that is there no significant
change occurring in stock prices around the dividend announcement date.
The formula for -test is written as:
𝑡𝑡 = 𝐴𝐴𝐴𝐴𝐴𝐴𝑡𝑡 𝑜𝑜𝑜𝑜 𝐶𝐶𝐴𝐴𝐴𝐴𝐴𝐴𝑡𝑡𝑆𝑆𝑡𝑡𝑆𝑆𝑆𝑆𝑆𝑆𝑆𝑆𝑜𝑜𝑆𝑆 𝐷𝐷𝐷𝐷𝐷𝐷𝑖𝑖𝑆𝑆𝑡𝑡𝑖𝑖𝑜𝑜𝑆𝑆 (7)
9
To clarify whether the dividend announcement has a significant impact on the stock returns, we
must generate cumulative average abnormal returns (CAAR) as well as average abnormal returns
(AAR). The formula for AAR is given in Equation (5):
𝐴𝐴𝐴𝐴𝐴𝐴𝑡𝑡 = 1𝑁𝑁 ∑ 𝐴𝐴𝐴𝐴𝑖𝑖𝑡𝑡𝑁𝑁
𝑖𝑖=1 (5)
where 𝐴𝐴𝐴𝐴𝑖𝑖𝑡𝑡 shows abnormal returns and 𝑁𝑁 is the number of the events. This AAR is generated
for event windows, i.e. for 15 days event window (±7 days) where 𝑡𝑡 = 0 is the event date.
Similarly, other event windows consist of 31 days (±15) and 61 days (±30 days).
Measuring Cumulative Average Abnormal Returns
CAAR is calculated for every given event window (15, 31 and 61 days) to analyse the behaviour
of returns around the event. The method of computing of CAAR is as follows:
𝐶𝐶𝐴𝐴𝐴𝐴𝐴𝐴𝑡𝑡 = ∑ 𝐴𝐴𝐴𝐴𝐴𝐴𝑡𝑡𝑁𝑁𝑡𝑡=1 (6)
where 𝑁𝑁 is the time span of event window.
Statistical Tests
The last step of the ESM is to check whether the estimated values of AAR and CAAR are
statistically significant or not. For this purpose, the researchers use different tools like Z-test and
t-test. The popular t-statistic was used by Brown and Warner (1980), Kadıoğlu et al.
(2015), Mahmood, et al. (2011), Mukora (2013), Ngoc and Cuong (2016), Rosario and Chavali
(2016), and Uddin and Uddin (2014). The null hypothesis (H0) is that is there no significant
change occurring in stock prices around the dividend announcement date.
The formula for -test is written as:
𝑡𝑡 = 𝐴𝐴𝐴𝐴𝐴𝐴𝑡𝑡 𝑜𝑜𝑜𝑜 𝐶𝐶𝐴𝐴𝐴𝐴𝐴𝐴𝑡𝑡𝑆𝑆𝑡𝑡𝑆𝑆𝑆𝑆𝑆𝑆𝑆𝑆𝑜𝑜𝑆𝑆 𝐷𝐷𝐷𝐷𝐷𝐷𝑖𝑖𝑆𝑆𝑡𝑡𝑖𝑖𝑜𝑜𝑆𝑆 (7)
54
Malaysian Management Journal Vol. 23, December 2019 47-64
and reliability because of the combined observations of each cross section. The presentstudyusedfixedeffectsandrandomeffectsmodels.Pynnonen(2005)suggested the following models for the event analysis.
(8)
(9)
where Rit is daily returns of stock i during period t, DBA and DAA are dummies for before and after the dividend announcement, respectively. The time variable is usedfortrend,andarecoefficients,andistheerrorterm.
Data and Variables
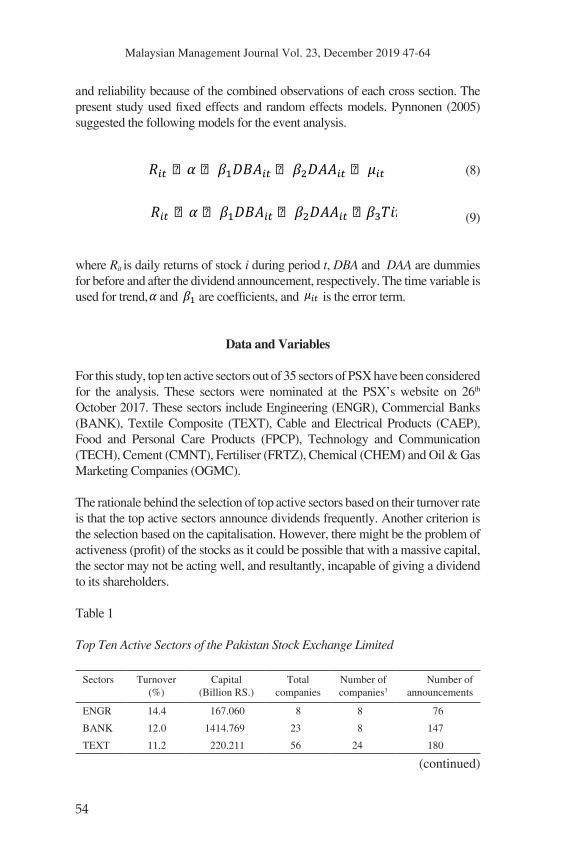
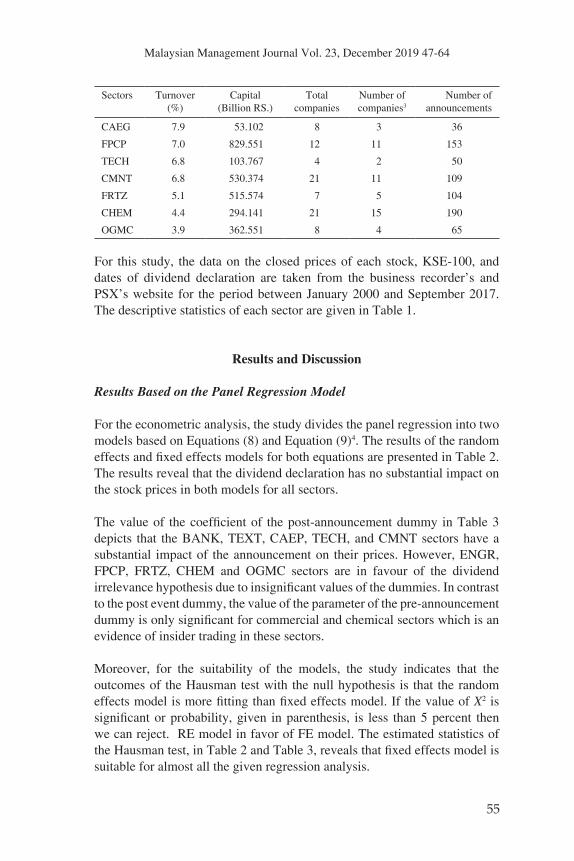
For this study, top ten active sectors out of 35 sectors of PSX have been considered for the analysis. These sectorswere nominated at the PSX’swebsite on 26th October 2017. These sectors include Engineering (ENGR), Commercial Banks (BANK), Textile Composite (TEXT), Cable and Electrical Products (CAEP), Food and Personal Care Products (FPCP), Technology and Communication (TECH), Cement (CMNT), Fertiliser (FRTZ), Chemical (CHEM) and Oil & Gas Marketing Companies (OGMC).
The rationale behind the selection of top active sectors based on their turnover rate is that the top active sectors announce dividends frequently. Another criterion is the selection based on the capitalisation. However, there might be the problem of activeness(profit)ofthestocksasitcouldbepossiblethatwithamassivecapital,the sector may not be acting well, and resultantly, incapable of giving a dividend to its shareholders.
Table 1
Top Ten Active Sectors of the Pakistan Stock Exchange Limited
Sectors Turnover(%)
Capital(Billion RS.)
Total companies
Number of companies3
Number of announcements
ENGR 14.4 167.060 8 8 76
BANK 12.0 1414.769 23 8 147
TEXT 11.2 220.211 56 24 180
(continued)10
Estimated t-test’s value would be compared with|1.96|. If t-value is larger then, H0 is rejected.
Panel Data Analysis
The core advantage of the panel data technique is the investigation of the heterogeneity in cross
sections and time units. This analysis has more freedom and reliability because of the combined
observations of each cross section. The present study used fixed effects and random effects
models. Pynnonen (2005) suggested the following models for the event analysis:
𝑅𝑅𝑖𝑖𝑖𝑖 = 𝛼𝛼 + 𝛽𝛽1𝐷𝐷𝐷𝐷𝐷𝐷𝑖𝑖𝑖𝑖 + 𝛽𝛽2𝐷𝐷𝐷𝐷𝐷𝐷𝑖𝑖𝑖𝑖 + 𝜇𝜇𝑖𝑖𝑖𝑖 (8)
𝑅𝑅𝑖𝑖𝑖𝑖 = 𝛼𝛼 + 𝛽𝛽1𝐷𝐷𝐷𝐷𝐷𝐷𝑖𝑖𝑖𝑖 + 𝛽𝛽2𝐷𝐷𝐷𝐷𝐷𝐷𝑖𝑖𝑖𝑖 + 𝛽𝛽3𝑇𝑇𝑇𝑇𝑇𝑇𝑇𝑇𝑖𝑖𝑖𝑖 + 𝜇𝜇𝑖𝑖𝑖𝑖 (9)
where 𝑅𝑅𝑖𝑖𝑖𝑖 is daily returns of stock 𝑇𝑇 during period 𝑡𝑡, 𝐷𝐷𝐷𝐷𝐷𝐷 and 𝐷𝐷𝐷𝐷𝐷𝐷 are dummies for before and
after the dividend announcement, respectively. The time variable is used for trend, 𝑎𝑎 and 𝛽𝛽𝑖𝑖 are
coefficients, and 𝜇𝜇𝑖𝑖𝑖𝑖 is the error term.
Data and Variables
For this study, top ten active sectors out of 35 sectors of PSX have been considered for the
analysis. These sectors were nominated at the PSX’s website on 26th October 2017. These
sectors include Engineering (ENGR), Commercial Banks (BANK), Textile Composite (TEXT),
Cable and Electrical Products (CAEP), Food and Personal Care Products (FPCP), Technology
and Communication (TECH), Cement (CMNT), Fertiliser (FRTZ), Chemical (CHEM) and Oil &
Gas Marketing Companies (OGMC).
The rationale behind the selection of top active sectors based on their turnover rate is that the top
active sectors announce dividends frequently. Another criterion is the selection based on the
10
Estimated t-test’s value would be compared with|1.96|. If t-value is larger then, H0 is rejected.
Panel Data Analysis
The core advantage of the panel data technique is the investigation of the heterogeneity in cross
sections and time units. This analysis has more freedom and reliability because of the combined
observations of each cross section. The present study used fixed effects and random effects
models. Pynnonen (2005) suggested the following models for the event analysis:
𝑅𝑅𝑖𝑖𝑖𝑖 = 𝛼𝛼 + 𝛽𝛽1𝐷𝐷𝐷𝐷𝐷𝐷𝑖𝑖𝑖𝑖 + 𝛽𝛽2𝐷𝐷𝐷𝐷𝐷𝐷𝑖𝑖𝑖𝑖 + 𝜇𝜇𝑖𝑖𝑖𝑖 (8)
𝑅𝑅𝑖𝑖𝑖𝑖 = 𝛼𝛼 + 𝛽𝛽1𝐷𝐷𝐷𝐷𝐷𝐷𝑖𝑖𝑖𝑖 + 𝛽𝛽2𝐷𝐷𝐷𝐷𝐷𝐷𝑖𝑖𝑖𝑖 + 𝛽𝛽3𝑇𝑇𝑇𝑇𝑇𝑇𝑇𝑇𝑖𝑖𝑖𝑖 + 𝜇𝜇𝑖𝑖𝑖𝑖 (9)
where 𝑅𝑅𝑖𝑖𝑖𝑖 is daily returns of stock 𝑇𝑇 during period 𝑡𝑡, 𝐷𝐷𝐷𝐷𝐷𝐷 and 𝐷𝐷𝐷𝐷𝐷𝐷 are dummies for before and
after the dividend announcement, respectively. The time variable is used for trend, 𝑎𝑎 and 𝛽𝛽𝑖𝑖 are
coefficients, and 𝜇𝜇𝑖𝑖𝑖𝑖 is the error term.
Data and Variables
For this study, top ten active sectors out of 35 sectors of PSX have been considered for the
analysis. These sectors were nominated at the PSX’s website on 26th October 2017. These
sectors include Engineering (ENGR), Commercial Banks (BANK), Textile Composite (TEXT),
Cable and Electrical Products (CAEP), Food and Personal Care Products (FPCP), Technology
and Communication (TECH), Cement (CMNT), Fertiliser (FRTZ), Chemical (CHEM) and Oil &
Gas Marketing Companies (OGMC).
The rationale behind the selection of top active sectors based on their turnover rate is that the top
active sectors announce dividends frequently. Another criterion is the selection based on the 10
Estimated t-test’s value would be compared with|1.96|. If t-value is larger then, H0 is rejected.
Panel Data Analysis
The core advantage of the panel data technique is the investigation of the heterogeneity in cross
sections and time units. This analysis has more freedom and reliability because of the combined
observations of each cross section. The present study used fixed effects and random effects
models. Pynnonen (2005) suggested the following models for the event analysis:
𝑅𝑅𝑖𝑖𝑖𝑖 = 𝛼𝛼 + 𝛽𝛽1𝐷𝐷𝐷𝐷𝐷𝐷𝑖𝑖𝑖𝑖 + 𝛽𝛽2𝐷𝐷𝐷𝐷𝐷𝐷𝑖𝑖𝑖𝑖 + 𝜇𝜇𝑖𝑖𝑖𝑖 (8)
𝑅𝑅𝑖𝑖𝑖𝑖 = 𝛼𝛼 + 𝛽𝛽1𝐷𝐷𝐷𝐷𝐷𝐷𝑖𝑖𝑖𝑖 + 𝛽𝛽2𝐷𝐷𝐷𝐷𝐷𝐷𝑖𝑖𝑖𝑖 + 𝛽𝛽3𝑇𝑇𝑇𝑇𝑇𝑇𝑇𝑇𝑖𝑖𝑖𝑖 + 𝜇𝜇𝑖𝑖𝑖𝑖 (9)
where 𝑅𝑅𝑖𝑖𝑖𝑖 is daily returns of stock 𝑇𝑇 during period 𝑡𝑡, 𝐷𝐷𝐷𝐷𝐷𝐷 and 𝐷𝐷𝐷𝐷𝐷𝐷 are dummies for before and
after the dividend announcement, respectively. The time variable is used for trend, 𝑎𝑎 and 𝛽𝛽𝑖𝑖 are
coefficients, and 𝜇𝜇𝑖𝑖𝑖𝑖 is the error term.
Data and Variables
For this study, top ten active sectors out of 35 sectors of PSX have been considered for the
analysis. These sectors were nominated at the PSX’s website on 26th October 2017. These
sectors include Engineering (ENGR), Commercial Banks (BANK), Textile Composite (TEXT),
Cable and Electrical Products (CAEP), Food and Personal Care Products (FPCP), Technology
and Communication (TECH), Cement (CMNT), Fertiliser (FRTZ), Chemical (CHEM) and Oil &
Gas Marketing Companies (OGMC).
The rationale behind the selection of top active sectors based on their turnover rate is that the top
active sectors announce dividends frequently. Another criterion is the selection based on the
55
Malaysian Management Journal Vol. 23, December 2019 47-64
Sectors Turnover(%)
Capital(Billion RS.)
Total companies
Number of companies3
Number of announcements
CAEG 7.9 53.102 8 3 36
FPCP 7.0 829.551 12 11 153
TECH 6.8 103.767 4 2 50
CMNT 6.8 530.374 21 11 109
FRTZ 5.1 515.574 7 5 104
CHEM 4.4 294.141 21 15 190
OGMC 3.9 362.551 8 4 65
For this study, the data on the closed prices of each stock, KSE-100, and dates of dividend declaration are taken from the business recorder’s andPSX’swebsite for theperiodbetweenJanuary2000andSeptember2017.The descriptive statistics of each sector are given in Table 1.
Results and Discussion
Results Based on the Panel Regression Model
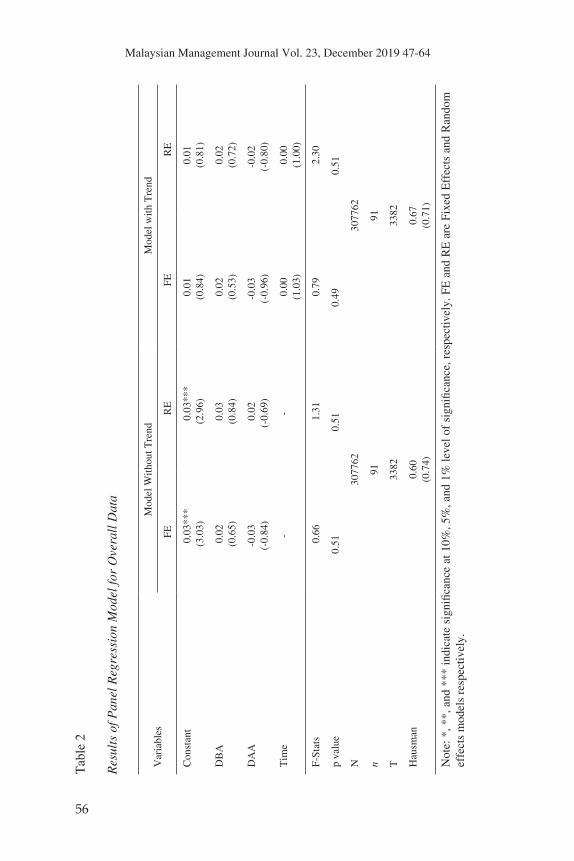
For the econometric analysis, the study divides the panel regression into two models based on Equations (8) and Equation (9)4. The results of the random effectsandfixedeffectsmodelsforbothequationsarepresentedinTable2.The results reveal that the dividend declaration has no substantial impact on the stock prices in both models for all sectors.
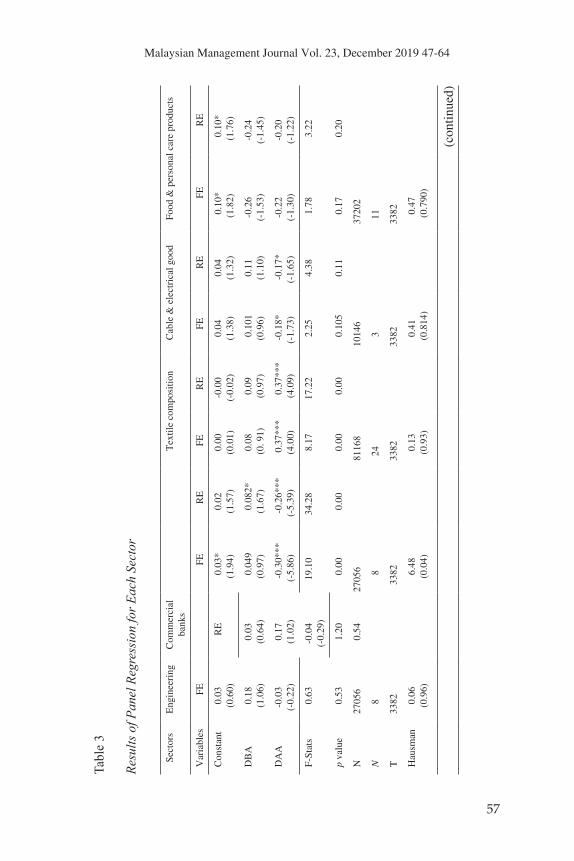
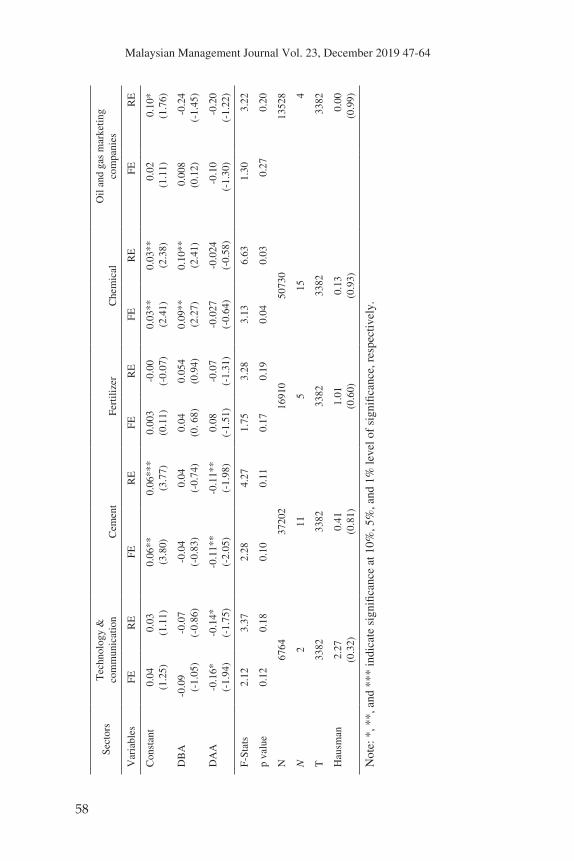
Thevalueof thecoefficientof thepost-announcementdummy inTable3depicts that the BANK, TEXT, CAEP, TECH, and CMNT sectors have a substantial impact of the announcement on their prices. However, ENGR, FPCP, FRTZ, CHEM and OGMC sectors are in favour of the dividend irrelevancehypothesisduetoinsignificantvaluesofthedummies.Incontrastto the post event dummy, the value of the parameter of the pre-announcement dummyisonlysignificantforcommercialandchemicalsectorswhichisanevidence of insider trading in these sectors.
Moreover, for the suitability of the models, the study indicates that the outcomes of the Hausman test with the null hypothesis is that the random effectsmodelismorefittingthanfixedeffectsmodel.IfthevalueofX2 is significantorprobability,given inparenthesis, is less than5percent thenwe can reject. RE model in favor of FE model. The estimated statistics of theHausmantest,inTable2andTable3,revealsthatfixedeffectsmodelissuitable for almost all the given regression analysis.
56
Malaysian Management Journal Vol. 23, December 2019 47-64
Tab
le 2
Res
ults
of P
anel
Reg
ress
ion
Mod
el fo
r O
vera
ll D
ata
Var
iabl
esM
odel
With
out T
rend
Mod
el w
ith T
rend
FER
EFE
RE
Con
stan
t0.
03**
*(3
.03)
0.03
***
(2.9
6)0.
01(0
.84)
0.01
(0.8
1)
DB
A0.
02(0
.65)
0.03
(0.8
4)0.
02(0
.53)
0.02
(0.7
2)
DA
A-0
.03
(-0.
84)
0.02
(-0.
69)
-0.0
3(-
0.96
)-0
.02
(-0.
80)
Tim
e-
-0.
00(1
.03)
0.00
(1.0
0)
F-St
ats
0.66
1.31
0.79
2.30
p va
lue
0.51
0.51
0.49
0.51
N30
7762
3077
62
n91
91
T33
8233
82
Hau
sman
0.60
(0.7
4)0.
67(0
.71)
Note:*,**,and***indicatesignificanceat10%
,5%,and1%levelofsignificance,respectively.FEandREareFixedEffectsandRandom
effe
cts
mod
els
resp
ectiv
ely.
57
Malaysian Management Journal Vol. 23, December 2019 47-64
Tabl
e 3
Resu
lts o
f Pan
el R
egre
ssio
n fo
r Eac
h Se
ctor
Sect
ors
Eng
inee
ring
Com
mer
cial
ba
nks
Tex
tile
com
posi
tion
Cab
le &
ele
ctri
cal g
ood
Food
& p
erso
nal c
are
prod
ucts
Var
iabl
esFE
FER
EFE
RE
FER
EFE
RE
Con
stan
t0.
03(0
.60)
RE
0.03
*(1
.94)
0.02
(1.5
7)0.
00(0
.01)
-0.0
0(-
0.02
)0.
04(1
.38)
0.04
(1.3
2)0.
10*
(1.8
2)0.
10*
(1.7
6)
DB
A0.
18(1
.06)
0.03
(0.6
4)0.
049
(0.9
7)0.
082*
(1.6
7)0.
08(0
. 91)
0.09
(0.9
7)0.
101
(0.9
6)0.
11(1
.10)
-0.2
6(-
1.53
)-0
.24
(-1.
45)
DA
A-0
.03
(-0.
22)
0.17
(1.0
2)-0
.30*
**(-
5.86
)-0
.26*
**(-
5.39
)0.
37**
*(4
.00)
0.37
***
(4.0
9)-0
.18*
(-1.
73)
-0.1
7*(-
1.65
)-0
.22
(-1.
30)
-0.2
0(-
1.22
)
F-St
ats
0.63
-0.0
4(-
0.29
)19
.10
34.2
88.
1717
.22
2.25
4.38
1.78
3.22
p va
lue
0.53
1.20
0.00
0.00
0.00
0.00
0.10
50.
110.
170.
20
N27
056
0.54
2705
681
168
1014
637
202
N8
824
311
T33
8233
8233
8233
8233
82
Hau
sman
0.06
(0.9
6)6.
48(0
.04)
0.13
(0.9
3)0.
41(0
.814
)0.
47(0
.790
)
(con
tinue
d)
58
Malaysian Management Journal Vol. 23, December 2019 47-64
Sect
ors
Tec
hnol
ogy
&
com
mun
icat
ion
Cem
ent
Fertilizer
Che
mic
alO
il an
d ga
s m
arke
ting
com
pani
es
Var
iabl
esFE
RE
FER
EFE
RE
FER
EFE
RE
Con
stan
t0.
04(1
.25)
0.03
(1.1
1)0.
06**
(3.8
0)0.
06**
*(3
.77)
0.00
3(0
.11)
-0.0
0(-
0.07
)0.
03**
(2.4
1)0.
03**
(2.3
8)0.
02(1
.11)
0.10
*(1
.76)
DB
A-0
.09
(-1.
05)
-0.0
7(-
0.86
)-0
.04
(-0.
83)
0.04
(-0.
74)
0.04
(0. 6
8)0.
054
(0.9
4)0.
09**
(2.2
7)0.
10**
(2.4
1)0.
008
(0.1
2)-0
.24
(-1.
45)
DA
A-0
.16*
(-1.
94)
-0.1
4*(-
1.75
)-0
.11*
*(-
2.05
)-0
.11*
*(-
1.98
)0.
08(-
1.51
)-0
.07
(-1.
31)
-0.0
27(-
0.64
)-0
.024
(-0.
58)
-0.1
0(-
1.30
)-0
.20
(-1.
22)
F-St
ats
2.12
3.37
2.28
4.27
1.75
3.28
3.13
6.63
1.30
3.22
p va
lue
0.12
0.18
0.10
0.11
0.17
0.19
0.04
0.03
0.27
0.20
N67
6437
202
1691
050
730
1352
8
N2
115
154
T33
8233
8233
8233
8233
82
Hau
sman
2.27
(0.3
2)0.
41(0
.81)
1.01
(0.6
0)0.
13(0
.93)
0.00
(0.9
9)
Note:*,**,and***indicatesignificanceat10%
,5%,and1%levelofsignificance,respectively.
59
Malaysian Management Journal Vol. 23, December 2019 47-64
Results of Event Study Methodology
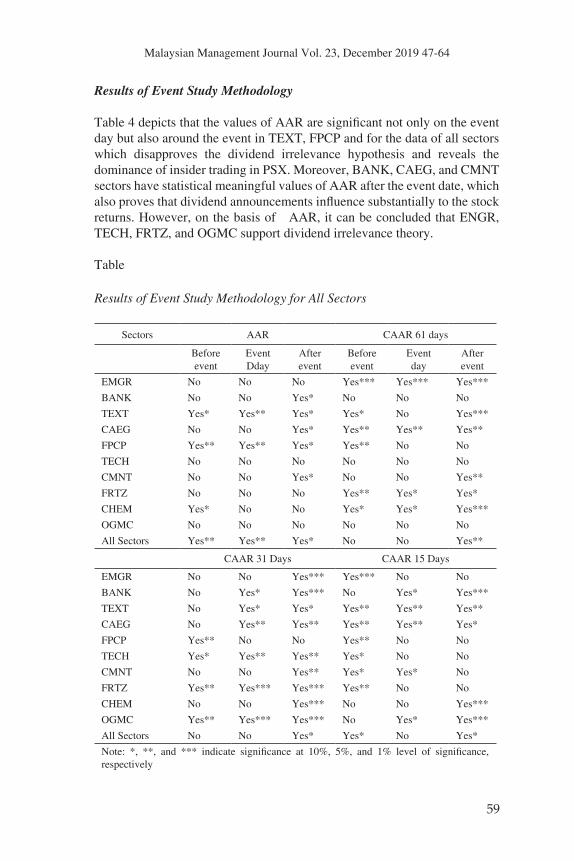
Table4depictsthatthevaluesofAARaresignificantnotonlyontheeventday but also around the event in TEXT, FPCP and for the data of all sectors which disapproves the dividend irrelevance hypothesis and reveals the dominance of insider trading in PSX. Moreover, BANK, CAEG, and CMNT sectors have statistical meaningful values of AAR after the event date, which alsoprovesthatdividendannouncementsinfluencesubstantiallytothestockreturns. However, on the basis of AAR, it can be concluded that ENGR, TECH, FRTZ, and OGMC support dividend irrelevance theory.
Table
Results of Event Study Methodology for All Sectors
Sectors AAR CAAR 61 days
Before event
Event Dday
After event
Before event
Event day
After event
EMGR No No No Yes*** Yes*** Yes***
BANK No No Yes* No No No
TEXT Yes* Yes** Yes* Yes* No Yes***
CAEG No No Yes* Yes** Yes** Yes**
FPCP Yes** Yes** Yes* Yes** No No
TECH No No No No No No
CMNT No No Yes* No No Yes**
FRTZ No No No Yes** Yes* Yes*
CHEM Yes* No No Yes* Yes* Yes***
OGMC No No No No No No
All Sectors Yes** Yes** Yes* No No Yes**
CAAR 31 Days CAAR 15 Days
EMGR No No Yes*** Yes*** No No
BANK No Yes* Yes*** No Yes* Yes***
TEXT No Yes* Yes* Yes** Yes** Yes**
CAEG No Yes** Yes** Yes** Yes** Yes*
FPCP Yes** No No Yes** No No
TECH Yes* Yes** Yes** Yes* No No
CMNT No No Yes** Yes* Yes* No
FRTZ Yes** Yes*** Yes*** Yes** No No
CHEM No No Yes*** No No Yes***
OGMC Yes** Yes*** Yes*** No Yes* Yes***
All Sectors No No Yes* Yes* No Yes*
Note: *, **, and *** indicate significance at 10%, 5%, and 1% level of significance,respectively
60
Malaysian Management Journal Vol. 23, December 2019 47-64
The Short Run and Long Run Analysis of AARs
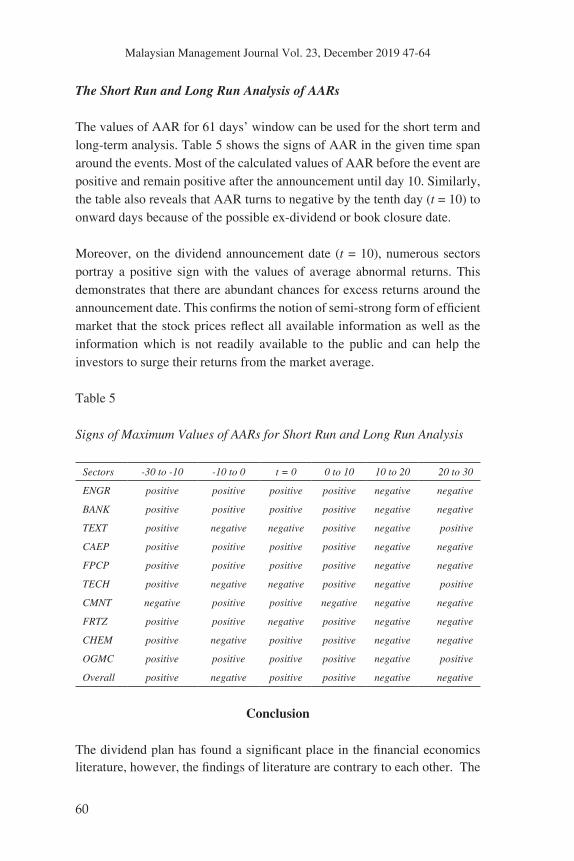
ThevaluesofAARfor61days’windowcanbeusedfortheshorttermandlong-term analysis. Table 5 shows the signs of AAR in the given time span around the events. Most of the calculated values of AAR before the event are positive and remain positive after the announcement until day 10. Similarly, the table also reveals that AAR turns to negative by the tenth day (t = 10) to onward days because of the possible ex-dividend or book closure date.
Moreover, on the dividend announcement date (t = 10), numerous sectors portray a positive sign with the values of average abnormal returns. This demonstrates that there are abundant chances for excess returns around the announcementdate.Thisconfirmsthenotionofsemi-strongformofefficientmarketthatthestockpricesreflectallavailableinformationaswellastheinformation which is not readily available to the public and can help the investors to surge their returns from the market average.
Table 5
Signs of Maximum Values of AARs for Short Run and Long Run Analysis
Sectors -30 to -10 -10 to 0 t = 0 0 to 10 10 to 20 20 to 30
ENGR positive positive positive positive negative negative
BANK positive positive positive positive negative negative
TEXT positive negative negative positive negative positive
CAEP positive positive positive positive negative negative
FPCP positive positive positive positive negative negative
TECH positive negative negative positive negative positive
CMNT negative positive positive negative negative negative
FRTZ positive positive negative positive negative negative
CHEM positive negative positive positive negative negative
OGMC positive positive positive positive negative positive
Overall positive negative positive positive negative negative
Conclusion
Thedividendplanhasfoundasignificantplaceinthefinancialeconomics literature,however,thefindingsofliteraturearecontrarytoeachother.The
61
Malaysian Management Journal Vol. 23, December 2019 47-64
resultsofpanelregressionanalysisrevealthatsomesectorshavesignificant
evidence of the market abuse in term of insider trading and have substantial
relationships between the dividend declaration and stock prices. Similarly,
the positive significant values of AAR, calculated from ESM, before the
eventindicatethenotionofinsidertrade,whereaspositivesignificantvalues
ofAARaftertheeventshowthatthestockmarketisasemi-strongefficient
marketandhasarbitrageopportunitiesforhighprofit.
The results support information content hypothesis that assumes managers
have more information than investors, which causes insider trading in
Pakistan, and the dividend is a source of reducing asymmetric information
among them.Moreover, the significant values of AAR around the event
supportsemi-strongefficienthypothesisasthestockpricesreflectcurrently
available information like dividend announcements and information
leakages.
By generalising the results, it clearly reveals that almost all sectors of PSX
are facing the problem of insider trading. We should eliminate this white-
collarfinancialcrimethatisconsideredrampantinPSX.Investorsareshy
to take part in PSX and lose confidence due to thismarket abuse. It is a
legal obligation of The Securities and Exchange Commission of Pakistan
(SECP) to abolish the market abuse through proper regulations and their
implementation. Section 15 of Securities and Exchange Ordinance 1969,
which deals with this pecuniary misconduct, should be rationalised.
Moreover, to overcome this market abuse, SECP should create efficient
surveillance wing through software with a huge database, provide exclusive
recognising code for every client5, rationalise group accounts of stocks in the
Central Depository System, eliminate off-system trades by stockbrokers and
use the broad information-connection6. Additionally, in the meeting of the
board of directors, when they decide for the dividend payments, they should
announce the dividends on the meeting day rather than on the upcoming
days. In this way, there is no asymmetric information that boosts the insider
trading. Precisely, it is a teamwork of the stock exchange, whistleblowers,
registered companies, and the SECP collectively detecting and punishing
thiswhite-collarfinancialcrime.
62
Malaysian Management Journal Vol. 23, December 2019 47-64
References
Abdullah, N. H., Rashid, R., & Ibrahim, Y. (2002). The effect of dividend announcements on stock returns for companies listed on the main board of the Kuala Lumpur stock exchange. Malaysian Management Journal, 6(1&2), 81-98.
Aharony, J., & Swary, I. (1980). Quarterly dividend and earnings announcementsandstockholders’returns:Anempiricalanalysis.The Journal of Finance, 35(1), 1-12.
Ahmed, H., & Javid, A. Y. (2008). Dynamics and determinants of dividend policy in Pakistan (evidence from Karachi stock exchange non-financial listed firms). Munich Personal RePEc Archive (Paper No. 37342). Retrieved from https://mpra.ub.uni-muenchen.de/37342/
Akbar, M., & Baig, H. H. (2010). Reaction of stock prices to dividend announcements and market efficiency in Pakistan. The Lahore Journal of Economics, 15, 103-125.
Asquith, P., & Mullins, D. W. (1983). The impact of initiating dividend paymentson shareholders’wealth.The Journal of Business, 56(1), 77-96.
Baker, H. K. (2009). Residual dividend policy. In D. M. Smith. Dividends and dividend policy (pp. 115-126). New Jersey: John Wiley & Sons.
Below, S. D., & Johnson, K. H. (1996). An analysis of shareholder reaction to dividend announcements in bull and bear markets. Journal of Financial and Strategic Decisions, 9(3), 15-26.
Brown, S. J., & Warner, J. B. (1980). Measuring security price performance. Journal of Financial Economics, 8(3), 205-258.
Campbell, J., & MacKinlay, A. C. (1997). The econometrics of financial markets. Princeton: University Press.
Chaudhary, G. M., Hashmi S. H., & Younis, A. (2016). Does Dividend announcement generate market signal? Evidence from Pakistan. International Journal of Economics and Financial Issues, 6(1), 65-72.
Gordon,M.J.(1963).Optimalinvestmentandfinancingpolicy.The Journal of Finance, 18(2), 264-272.
Gunasekarage, A., & Power, D. M. (2006). Anomalous evidence in dividend announcement effect. Managerial Finance, 32, 209-226.
Habibullah, M. S., & Baharumshah, A. Z. (1999). Money supply, stock prices andtheefficientmarkethypothesis:ThecaseofMalaysia.Malaysian Management Journal, 3(1), 13-37.
Jahfer, A. (2016). Dividend policy and share price volatility: Evidence from Colombo stock market. International Journal of Managerial and Financial Accounting, 8(2), 97-108.
Kadıoğlu,E.,Telçeken,N.,&Öcal,N.(2105).Marketreactiontodividendannouncement: Evidence from Turkish. International Business Research, 8(9), 83-94.
63
Malaysian Management Journal Vol. 23, December 2019 47-64
Khan, K. I. (2012). Effect of dividends on stock prices-a case of chemical and pharmaceutical Industry of Pakistan. Management, 2(5), 141-148.
Khan, R. (2019). Effect of dividend on stock price in emerging stock market (Unpublished Report). School of Business and Economics, United International University.
Khurana, R., & Warne, D. P. (2018). Stock price adjustments to selected corporate announcements: A study of dividend announcements. Asian Journal of Management, 9(1), 649-659.
Lintner, J. (1956). Distribution of incomes of corporations among dividends, retained earnings, and taxes. The American Economic Review, 46(2), 97-113.
Mahmood, S., Sheikh, M. F., & Ghaffari, A. (2011). Dividend announcements and stock returns: An event study on Karachi stock exchange. Interdisciplinary Journal of Contemporary Research in Business, 3(8), 972-981.
Majanga, B. B. (2015). The dividend effect on stock price-an empirical analysis of Malawi listed companies. Accounting and Finance Research, 4(3), 99-105.
Mehndiratta, N., & Gupta, S. (2010). Impact of dividend announcement on stock prices. International Journal of Information Technology and Knowledge Management. 2(2), 405-410.
Miller, M. H., & Modigliani, F. (1961). Dividend policy, growth, and the valuation of shares. The Journal of Business, 34(4), 411-433.
Mukora, M. Y. W. (2013). The effect of dividend announcement on stock returnsoffirmslistedattheNairobisecuritiesexchange(UnpublishedMBA project), University of Nairobi.
Nazir,M.S.,Nawaz,M.M.,Anwar,W.,&Ahmed,F.(2010).Determinantsof stock price volatility in Karachi stock exchange: The mediating role of corporate dividend policy. International Research Journal of Finance and Economics, 55(55), 100-107.
Ngoc, D. B., & Cuong, N. C. (2016). Dividend announcement and ex-dividend effects on stock return. International Journal of Economics and Finance, 8(7), 207-215.
Nishat, M., & Irfan, C. M. (2004). Dividend policy and stock price volatility in Pakistan. In Pide-19th Annual General Meeting and Conference.
Ozo,F.K.,&Arun,T.G.(2019).Stockmarketreactiontocashdividends:evidence from the Nigerian stock market. Managerial Finance, 45(3), 366-380.
Peterson, P. P. (1989). Event studies: A review of issues and methodology. Quarterly Journal of Business and Economics, 28(3), 36-66.
Poornima, B. G., Morudkar, V., & Reddy, Y. V. (2019). Impact of dividend announcements of banks on stock returns and the determinants of dividend policy. Indian Journal of Finance, 13(5), 7-24.
64
Malaysian Management Journal Vol. 23, December 2019 47-64
Pynnonen, S. (2005). On regression based event study. Acta Wasaensia, 143, 327-354.
Rajamohan, Dr. S., & Muthukamu, M. (2014). Impact of selective corporate events on price movements of stocks of bank nifty index. Indian Journal of Applied Research, 4(4), 317-320.
Rosario, S., & Chavali, K. (2016). Market reaction on dividend announcement in Oman: An event study methodology. International Journal of Economics and Financial Issues, 6(1), 103-108.
Saleh, W. (2007). Investors reaction to dividend announcements: Parametric versus nonparametric approach. Applied Financial Economics Letters, 3, 169-179.
Sanda, A. U., Shafie, A. G., &Gupta, G. S. (1999). Behaviour of stockreturns in the KLSE: A test of the random walk hypothesis. Malaysian Management Journal, 3(1), 71-91.
Sharif, T., Purohit, H., & Pillai, R. (2015). Analysis of factors affecting share prices: The case of Bahrain Stock Exchange. International Journal of Economics and Finance, 7(3), 207-216.
Swarnalatha, C., & Babu, K. S. (2017). Stock price reaction to dividend announcement on select banking stocks. Asian Journal of Research in Social Sciences and Humanities, 7(1), 1043-1058.
Uddin, M. N., & Uddin, M. J. (2014). Dividend announcement of the commercial banks in DSE: Scenario and effect on stock price. International Journal of Ethics in Social Sciences, 2(1), 143-155.
Venkatesh, P. C. (1989). The impact of dividend initiation on the information content of earnings announcements and returns volatility. The Journal of Business, 62(2), 175-197.
Endnotes
1 The results of both estimated windows are identical. So, the study only discusses the outcomes
of 300 days estimated windows.2 Authors selected the top ten active sectors on 26-Oct-2017 from the website Pakistan Stock
Exchange. 3 Only includes companies which announce the dividends in given date.4 The results of panel regression analysis are only presented here for equation (8) because there
isnosignificantdifferencebetweentheresultsofequation(8)andequation(9).5 This system has already been implemented in India.6 This is used in Australia.