Lisa Sandt Director of Planning & Economic Development Lee-Russell Council of Governments (LRCOG)
The Impact of Consumer Heterogeneity and Surrounding Amenities in Determining Traveler
Behavior: A Choice Experiment on Agritourism
Anders van Sandt, Colorado State University, [email protected]
Marco Costanigro, Colorado State University, [email protected]
Dawn Thilmany, Colorado State University, [email protected]
Selected Paper prepared for presentation at the 2017 Agricultural & Applied Economics Association
Annual Meeting, Chicago, Illinois, July 30-August 1
Copyright 2017 by Anders Van Sandt. All rights reserved. Readers may make verbatim copies of this
document for non-commercial purposes by any means, provided that this copyright notice appears on all
such copies.

1
The Impact of Consumer Heterogeneity and Surrounding Amenities in Determining Traveler
Behavior: A Choice Experiment on Agritourism
Based on concerns about rural areas lagging in terms of employment opportunities and
subsequent aging populations, the United States Department of Agriculture (USDA) has put an emphasis
on developing strategies and programs to stimulate rural economic growth, particularly job creation and
entrepreneurship. One of these strategies that is particularly germane to the rural West is diversifying
agricultural economies and farm-based businesses through agritourism. Agritourism is any recreational or
educational activity on a working farm or ranch that consumers pay to participate in, and is linked in the
literature to several community development benefits including; increased employment opportunities,
agricultural businesses that are more resilient to market fluctuations, an economic tool to mitigate and
gain economic benefits from urban sprawl, and spillover benefits to surrounding rural communities from
tourism, an export industry (Nickerson et al. 2001, Philip et al. 2010, Tew and Barbieri 2012, McGehee
and Kim 2004). These potential benefits, and the ability to incorporate an agritourism venture into a
diverse set of agricultural businesses across multiple regions are driving this dynamic sector. The percent
of farms and ranches reporting some agritourism offerings grew in number by over 48% in the last decade
(USDA, 2014).
While agritourism is still a budding industry with potential for further stimulating rural economic
and community development, we are not aware of any research identifying how consumer behavior and
willingness to pay (WTP) varies across space and traveler preferences in the context of agritourism.
Exploring how consumer behavior influences the value placed on an agritourism site’s attributes and its
surrounding amenities will better inform industry stakeholders in assessing the practicality of using
agritourism as a rural development tool by identifying potential markets. We aim to explore how
heterogeneity in consumer preferences is influenced by the consumers’ location of origin, and on the
supply side, how WTP for specific agritourism qualities differs across the location of the agritourism
activity. Using this information, we hope to assist in the identification of potential markets for agritourism
spurring rural development and another financial alternative for farms, ranches and ag-dependent regions.
Many agritourists are multi-destination visitors, implying that trip qualities most likely extend
beyond the agritourism enterprise itself, and may include nearby scenic landscapes and access to other
amenities or recreation opportunities. Travel cost models have attempted to estimate some of the values
consumers place on agritourism sites, but are also sensitive to bias from multi-destination visitors (Carpio
et al. 2008, Hill et al. 2014). As an alternative, choice experiments may be better suited to identify the
value potential visitors place on scenic landscapes and surrounding amenities when planning a trip by
controlling for different combinations of trip attributes. In addition, rather than determining the value

2
agritourists place on existing agritourism establishments, stated preference models have the benefit of
observing demand from a broader spectrum of consumers based on a hypothetical agritourism experience
better enabling the researcher to identify markets that are not yet developed and where there may
currently be excess demand. To our knowledge, no studies of this kind have been conducted to explore
the value visitors place on agritourism site qualities and the impact the surrounding area may have on trip
decisions.
After a brief review of the literature on agritourism and discrete choice modeling, we provide a
theoretical framework using a random utility model as well as a review of the online survey data
generated through a “simulated” travel website interface. Given agritourism differs greatly across space
depending on climate, culture, and proximities to markets, we have no reason to believe consumers’
preferences are homogeneous and therefore adopt a latent class logit model to capture differences in
consumers’ WTP. We expand on this empirical exercise by performing a spatial interpolation of
differences in WTP values across locales not observed in our sample using a geostatistical method called
Empirical Bayesian Kriging (EBK). This two-step approach allows us to not only examine consumer
behavior and WTP for various agritourism site qualities, but also enables us to identify rural communities
with untapped market potential that lie outside our survey sample. Preliminary results show that a
respondent’s exposure to agritourism along with their residential origin’s surrounding natural amenities
and income per capita influence the value consumers place on different agritourism attributes. These
results may be of interest to farm and ranch operators seeking more effective marketing strategies, as well
as economic development and tourism practitioners in assessing the practicality of using agritourism as a
development tool in a particular region of interest.
Literature Review
Increasing global competition in agricultural commodity markets have motivated many farms and
ranches to seek diversification opportunities to stay financially viable (Veeck et al. 2006). As the reader
can probably deduce from the definition presented in the previous section, agritourism can take many
different forms such as wineries, corn mazes, food preparation/preservation classes, hunting, photography
classes, farm dinners, and farm and ranch heritage experiences. It is this generality and the ability to cater
an agritourism enterprise to the farm or ranch’s historical or amenity assets and other strengths that makes
agritourism a promising diversification tool for agricultural operators.
Beyond potential for diversification and supplementing farm level financial returns, agritourism
can serve as a rural development tool (Bagi and Reeder, 2012). Not only does agritourism create

3
employment opportunities for the farm’s family or community members through direct employment in
the operation, but it also has the potential to stimulate surrounding rural economies through spillover
benefits that arise from the export-like tourism spending bringing dollars into the region. It is this aspect
of agritourism as an entrepreneurial activity creating long term growth and employment opportunities that
makes it a particularly attractive rural development tool when compared to other farm and ranch
diversification strategies (Bagi and Reeder, 2012). Despite data showing that the portion of farms with
agritourism operations grew over 42% between the 2007 and 2012 USDA Censuses of Agriculture, there
are still only 1.5% of all US farms and ranches involved in agritourism offerings, and many of these
operations are clustered in specific regions of the United States (Bagi and Reeder (b), 2012). While
previous studies have explored agritourists’ WTP using revealed preference models (Carpio et al, 2008;
Hill et al, 20014), motivations to adopt (see citations in introduction), and spatial hot spots of agritourism
incidence (Van Sandt and Thilmany, 2017), this study is intended to explore areas for potential
agritourism industry growth while also accounting for consumer and location heterogeneity.
Discrete choice experiments have been applied for decades to elicit consumers’ willingness to
pay and study their choice making behavior using a random utility framework developed by McFadden,
1974. Within the tourism literature, choice experiments have been used frequently to examine and
forecast consumers’ behavior given destination amenities, prices, and other qualities specific to the
research topic. Morley (1994) examines the effect that price changes in transportation, hotel tariffs, and
exchange rates have on tourists from Kuala Lumpur to eight different international cities. Morley (1994)
find that changes in transportation prices have the largest effect on consumers’ choice to travel perhaps
implying that travel distances and the potential for multi-destination trips may be significant drivers of
consumers’ choice to visit an agritourism site. In another study by Juutinen et al. (2011), management
policies in Finnish national parks are analyzed, and they find consumers experienced welfare gains from
greater biodiversity and less manmade structures on the trails. These studies provide some context of how
to approach the US agritourism sector, but a more targeted look at issues of key interest to the sector are
warranted. For example, if these international travelers place value on scenic qualities for ecotourism
then we may also be able to infer and hypothesize that, for US agritourism, more remote areas with more
rustic lodging and outdoor activities could elicit a higher WTP for some subsets of consumers.
Methodology
Survey Data

4
This study uses survey data collected in April of 2015 through Taylor Nelson Sofres’ (TNS), an
online survey company, using their pre-recruited panels. The sample contains a total of 1,501 respondents
from all over the United States. Of these 1,501 respondents from across the US, 1,001 visited an
agritourism site in the western U.S. during the previous twelve months (with 5% incidence in the broader
sample), while the other 500 did not participate in an agritourism activity but had traveled out of the state
in the past twelve months (with 50% incidence in the broader sample). The choice to administer the
survey online through a research company is appropriate for two reasons. First, internet survey companies
that offer incentives to a pre-recruited sample tend to have higher response rates, and second, a greater
sense of authenticity may be developed if the individuals, who select a tourism destination through a
simulated travel website called Trip Guru, actually make their decisions online in front of a computer.
The survey instrument was designed to be used for multiple projects, hence the split sample. The
project and this survey were sponsored by a USDA Agriculture Food Research Initiative grant titled
“Place-Based Innovation: An Integrated Look at Agritourism in the Western US” #2014-68006-21824.
The survey contained questions regarding travel behavior, hobbies and interests, experience with
agriculture, and questions pertinent to travel cost models. The choice experiment questions occurred at the
end of the survey and consisted of two different experiments (a day trip and a “ranch stay”) that were
randomly and evenly divided in each subsample (regional and national). Using a stated choice software,
Ngene, we adopted a sequential orthogonal design for the choice experiment. Each choice experiment was
divided into four randomly assigned blocks with nine choice situations in each block and two alternatives
per choice situation. The entire survey was estimated to take approximately 15 minutes to complete. As
the reader can deduce, the sample is somewhat Western biased given 66% of the sample visited an
agritourism site in the Western U.S. so results should be interpreted with this framing in mind.
The attributes included in the sets differed depending on which alternative the individual was
assigned to and each attribute took different levels across choice situations. Varying attributes for the
ranch stay, defined as a five night package for two people, were price, estimated travel cost from home,
lodging options, a “star-rating” from previous travelers’ online reviews, activities included in the package,
attributes of the surrounding area, and distance to a national park. The day trip travel listing was for one
individual and included the following attributes: price, distance from home, rating from online reviews,
and activities included in the package. In both alternatives the price attribute levels were less uniformly
distributed at the endpoints and were the only attribute that was not completely uniformly distributed.
Theory and Empirical Model

5
A random utility framework was adopted to model the travelers’ behavior in choosing one
agritourism site over another. Under the assumption that individuals are utility maximizing agents, an
individual � will select agritourism alternative � over � alternatives only if alternative � offers them the
most utility relative to alternative �.
��� > ���
Given any choice situation, the researcher only observes information on the alternatives’ attributes ���
and some information about the individual themselves ��, resulting in an observed portion of the
individual’s utility function ���(���, ��), and an unobserved portion ���. The probability an individual
chooses alternative � over � alternatives, denoted ���, then becomes:
��� = ����(��� > ���)
��� = ����(��� + ��� > ��� + ���)
��� = ����(��� − ��� > ��� − ���)
Where the probability that an individual chooses � is the probability that the difference between the
observed portions of utility is greater than the difference between the unobserved components. The
cumulative probability is the integral over the density of the unobserved portion of utility, �(��):
��� = � ����� − ��� < ��� − ��� ∀� ≠ ���(��) ���
�
If we assume the errors are independent from irrelevant alternatives (iia) and that the unobserved
component of the respondent’s utility function is Gumbel distributed then Train 2007 shows that a logit
choice probability can be obtained from this cumulative distribution:
��� =exp (�����)
∑ exp (�����)�
where the probability of individual � choosing alternative � is a function of � independent variables
observed by the researcher with preference parameters � to be estimated.
While limited dependent empirical models such as the multinomial logit are popular due to their
ease of interpretation and closed form, the strong assumption of the individuals’ errors being iia, has led
to some researchers choosing more flexible forms such as the mixed-logit that allows the researcher to
specify continuous joint distributions for the unobserved errors (Train, 2007).
(1)
(2)
(3)
(4)
6
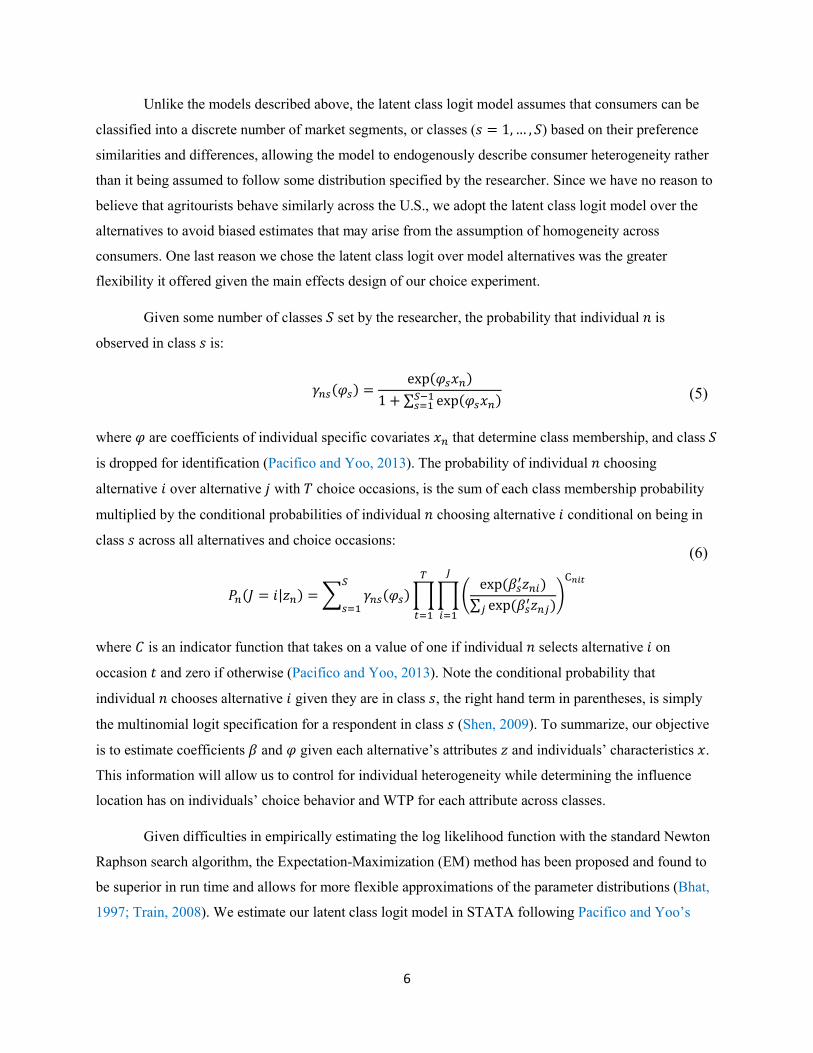
Unlike the models described above, the latent class logit model assumes that consumers can be
classified into a discrete number of market segments, or classes (� = 1, … , �) based on their preference
similarities and differences, allowing the model to endogenously describe consumer heterogeneity rather
than it being assumed to follow some distribution specified by the researcher. Since we have no reason to
believe that agritourists behave similarly across the U.S., we adopt the latent class logit model over the
alternatives to avoid biased estimates that may arise from the assumption of homogeneity across
consumers. One last reason we chose the latent class logit over model alternatives was the greater
flexibility it offered given the main effects design of our choice experiment.
Given some number of classes � set by the researcher, the probability that individual � is
observed in class � is:
���(��) =exp(����)
1 + ∑ exp(����)������
where � are coefficients of individual specific covariates �� that determine class membership, and class �
is dropped for identification (Pacifico and Yoo, 2013). The probability of individual � choosing
alternative � over alternative � with � choice occasions, is the sum of each class membership probability
multiplied by the conditional probabilities of individual � choosing alternative � conditional on being in
class � across all alternatives and choice occasions:
��(� = �|��) = � ���(��) � � �exp (��
����)
∑ exp (������)�
�
�����
���
�
���
�
���
where � is an indicator function that takes on a value of one if individual � selects alternative � on
occasion � and zero if otherwise (Pacifico and Yoo, 2013). Note the conditional probability that
individual � chooses alternative � given they are in class �, the right hand term in parentheses, is simply
the multinomial logit specification for a respondent in class � (Shen, 2009). To summarize, our objective
is to estimate coefficients � and � given each alternative’s attributes � and individuals’ characteristics �.
This information will allow us to control for individual heterogeneity while determining the influence
location has on individuals’ choice behavior and WTP for each attribute across classes.
Given difficulties in empirically estimating the log likelihood function with the standard Newton
Raphson search algorithm, the Expectation-Maximization (EM) method has been proposed and found to
be superior in run time and allows for more flexible approximations of the parameter distributions (Bhat,
1997; Train, 2008). We estimate our latent class logit model in STATA following Pacifico and Yoo’s
(5)
(6)

7
(2013) command lclogit that makes use of the EM method, and then use STATA’s gllamm to estimate the
standard errors of the parameters.
Several previous studies perform various tests to determine the number of latent classes that
captures the bulk of consumer heterogeneity without overfitting the model. While studies such as Nylund
et al. (2007) find bootstrapping methods to be superior in determining class enumeration, the Bayesian
Information Criterion (BIC) seems to be more commonly used (or at least traditionally used) due to its
comparable results and relative simplicity. We chose to use the BIC option in determining class
enumeration, selecting the model with the smallest BIC.
Latent class models have been used extensively in the literature to calculate WTP values across
market segments (see Hidrue et al, 2011; Hensher and Greene, 2010; Wen and Lai, 2010; and others), but
few studies have taken advantage of the latent class model’s preference heterogeneity across individuals
to examine preference heterogeneity across space. One study that follows methods similar to our own is
Brouwer et al. (2010) where the authors model preference heterogeneity for water quality throughout a
river basin in southern Spain. The authors include each respondent’s residence of origin as a covariate in
determining class membership to examine preference heterogeneity across space and find that economic
welfare measures change across space depending on environmental conditions and socioeconomic
demographics where they reside (Brouwer et al, 2010). Similar to this study we include a set of five
covariates to determine class membership, all of which are measures based on the respondent’s county of
origin. The hypothesis here is that an individual’s choices are partly driven by their daily environment.
For example, a respondent from the Rocky Mountains may have different recreation preferences than
someone from the Northern Plains states due to their revealed preference to live in a region where natural
amenities are readily available. The explanatory variables we included to determine class membership, ��
in equation 5, were agritourism revenue, per capita income, minutes to a population center of at least
50,000 people, the USDA’s natural amenities index, and the respondent’s age which was compared to the
county’s median age during the spatial interpolation process. Since these measures are available for most
counties, we are able to estimate each county’s WTP by first estimating each county’s class membership
probability and weighting the WTP estimates within classes to capture the heterogeneity of preferences
within the county. Essentially, we are using the respondents to determine market segments and then plug
in the counties’ characteristics to estimate the WTP for an average consumer in each county where data is
available. This method allows us to identify areas where WTP for an activity may be significantly high,
but no agritourism sector currently exists.
Spatial Interpolation

8
In order to complete our map of how agritourism WTP varies by area and activity, we adopt a
geostatistical method called Empirical Bayesian Kriging that exploits the spatial autocorrelation between
estimates to interpolate values in between points. One issue with using counties to determine spatial
autocorrelation is the fact that counties are larger in average size in the western US. To address this
potential modelling issue, we use each county’s population centroid as the point of information, and rely
on the kriging to interpolate the values in-between points. While there are other methods for interpolating
values based on spatial autocorrelation, such as inverse distance weighting and splining, EBK includes
additional information on the spatial arrangement of points and uses an iterative process to determine the
nature of the spatial distribution of points rather than just the distance between points.
The major difference between kriging and other methods of spatial interpolation is the use of the
data’s semivariogram, a function of variance between two point’s z-scores and distance between points, to
capture changes in spatial autocorrelation as distance increases rather than assuming a constant lag.
Anselin and Gallo (2006) compare several spatial interpolation techniques to model air quality’s effect on
housing prices in Southern California and find kriging provides the best model fit and interpretation.
While Campbell et al. (2007) take a very similar approach to ours, estimating a mixed logit and kriging to
predict WTP for rural landscape improvements in the Republic of Ireland, we differ in our treatment of
preference heterogeneity. While Campbell et al. (2007) use a mixed logit, we capture consumer
heterogeneity using a latent class logit model using origin specific information to determine the
differences in WTP across space. Further, we also use the county level information to determine the
weighted average WTP of an area rather than the individual respondents’ WTP. Given the geographical
scope of our study, the contiguous US, and our project’s objectives, we believe our methods of basing an
area’s WTP on aggregate county data rather than the characteristics of a single respondent to be more
appropriate.
Empirical Results
Using the BIC we determined that four latent classes captured the majority of consumer
heterogeneity. The model converged after 67 iterations using the EM method and had an average max
posterior probability of 88%, indicating that our model was reasonably successful in modeling the
heterogeneity of consumers’ preferences. As a reminder, when we discuss the significance and sign of the
class membership coefficients in the following paragraphs, these interpretations are relative differences
when compared to the reference group, Class 4. The latent class model estimates can be found in table 1.

9
Given the WTP estimates and class membership coefficients that were statistically significant at
the 10% level (or greater), we labeled the four classes: Comfort Tourists (24.7%), Adventurers (33.8%),
Road Trippers (20.7%), and Urbanites (20.8%). Class 4, the Urbanites, were the reference group for
identifying class membership coefficients. Comfort tourists likely came from counties with relatively high
incomes per capita, are relatively price sensitive, and prefer more upscale lodging options like the ranch
house option ($185.77). The Adventurers had a strong preference for tent lodging ($1,316.33) and
horseback riding ($1,136.17), and likely came from counties with relatively high agritourism activity, a
high income per capita, high natural amenities, and as individuals, are relatively younger. The Road
Trippers tended to be older and from areas with fewer natural amenities. The Road Trippers preferred
more upscale lodging options (cabin: $3,695.72), historical excursions ($513.93, a close proximity a
small town ($1,826.90), and close proximities to National Parks (-$496.20 per 30 min.). Finally, the
Urbanites were relatively price sensitive and had a strong preference for urban amenities ($2,624.39),
quality lodging (cabin: $185.51), and historical excursions ($1,449.97) instead of horseback riding.
Surprisingly, the travel time (in minutes) to an urban area, a city with a population of at least
50,000 did not significantly influence how a consumer was categorized into a class for this study. While
this variable may still have an effect on some consumers’ preferences, it does not appear that it had
explanatory power in parsing out consumer preference heterogeneity in this sample. Both the Road
Trippers and the Urbanites had comparably strong preferences for ranch stay agritourism sites that were
also nearby urban or small town amenities, but these characteristics were insignificant for the Comfort
Tourists and Adventurers. This may be a signal to producers located near urban areas and who are
interested in agritourism diversification, that they may be more successful in offering agritourism
activities in line with the Road Trippers’ and Urbanites’ preferences. Put another way, producers in more
rural areas surrounded by a higher incidence of these two urban-centered classes may want to consider
other diversification strategies.
As hypothesized, the natural amenities index had an inverse relationship with classes preferring
more upscale lodging options and outdoor activities, thereby indicating that a respondent’s surrounding
environment can impact their recreation preferences. The Adventurers were from relatively more natural
amenity rich areas and valued camping and horseback riding. In contrast, the Road Trippers who were
from areas with fewer natural amenities, had comparatively stronger preferences for more upscale lodging
and historical excursions. Surprisingly the Adventurers did not have a significant preference for being
close to National Park entrances but the Road Trippers and Urbanites did value this attribute of
agritourism sites. This may indicate that while the Adventurers prefer outdoor lodging and activities, they
are more often primary purpose travelers than the Road Trippers and Urbanites who would rather make
10
agritourism one stop on a multi-destination trip that includes venues such as National Parks. Since we did
not include a neither option in the choice experiment design, this may also indicate that the Road Trippers
and Urbanites see ranch stays as a substitute good to other outdoor attractions like National Parks. Not
surprisingly, these findings provide evidence that producers in natural amenity rich areas may have more
success with agritourism models that integrate outdoor activities, especially if they are near National Park
entrances where they have the opportunity to attract the travelers who are similar to the Road Trippers
and Urbanites identified in this study.
It appears that coming from counties with higher incomes per capita had less of an effect on
consumers’ price sensitivity when compared to the relative amount of agritourism activity in the
respondent’s home county. Both the Comfort Tourists and Adventurers came from relatively wealthy
areas, but the Comfort Tourists were much more price sensitive than the Adventurers who had relatively
high WTP values. However, the Adventurers and Road Trippers who are both from counties more
agritourism activity were relatively less price sensitive than the Comfort Tourists and Urbanites, and both
of those groups had less agritourism activity around their residence of origin. This may be an indication
that consumers who are less familiar with agritourism are not willing to pay as much for ranch stays than
consumers who are more familiar with these activities. Producers should interpret this result carefully. A
dearth of agritourism activity in a county may be correlated with lower WTP values for agritourism
activities, but the classes that were more likely from these areas still had higher WTP values for some
specific activities that producers can still take advantage of. These results are somewhat echoed in Van
Sandt and Thilmany (b) (2017) where the authors find evidence of agglomeration economies in the U.S.
agritourism industry resulting from information sharing or decreased marginal travel costs for multi-
destination agritourists.
The Adventurers, who are younger and assumedly more tech savvy, put the highest value on an
additional star rating from the simulated travel site. Yet, Road Trippers, who are decidedly older than the
Adventurers, also placed a relatively high value on better online ratings. Due to the fact that both of these
classes are surrounded by relatively high levels of agritourism activity, these respondents may be more
familiar with agritourism and seeking well-reviewed agritourism experiences to complement what is
available to them in their home region. While consumers who are more familiar with agritourism appear
to be more discriminating of the value of an online star rating, producers should be aware the Comfort
Tourists and Urbanites also value higher ratings, underlining the somewhat obvious importance of
providing an enjoyable experience for visitors so that their reviews and online reputation can be one way
to differentiate their operation.
Spatial Interpolation

11
Given the significance and magnitude of some of the class membership covariates, it seems that
one’s location of origin has a significant impact on consumers’ choice behavior. However, there still does
not seem to be a clear narrative on how agritourism preferences vary across space, or where potential and
untapped agritourism markets may exist. To expand on this we use Empirical Bayesian Kriging (EBK) to
interpolate the values across space given county attributes. EBK allows the researcher to relax
assumptions about some of the semivariogram features, such as the nugget, sill, and lag, by using an
iterative process to find the best fit of the semivariogram that can then be used to better explain the spatial
relationships between known points. Rather than mapping the predicted WTP values, we map the percent
difference from the class weighted mean WTP for each county population centroid and each agritourism
attribute.
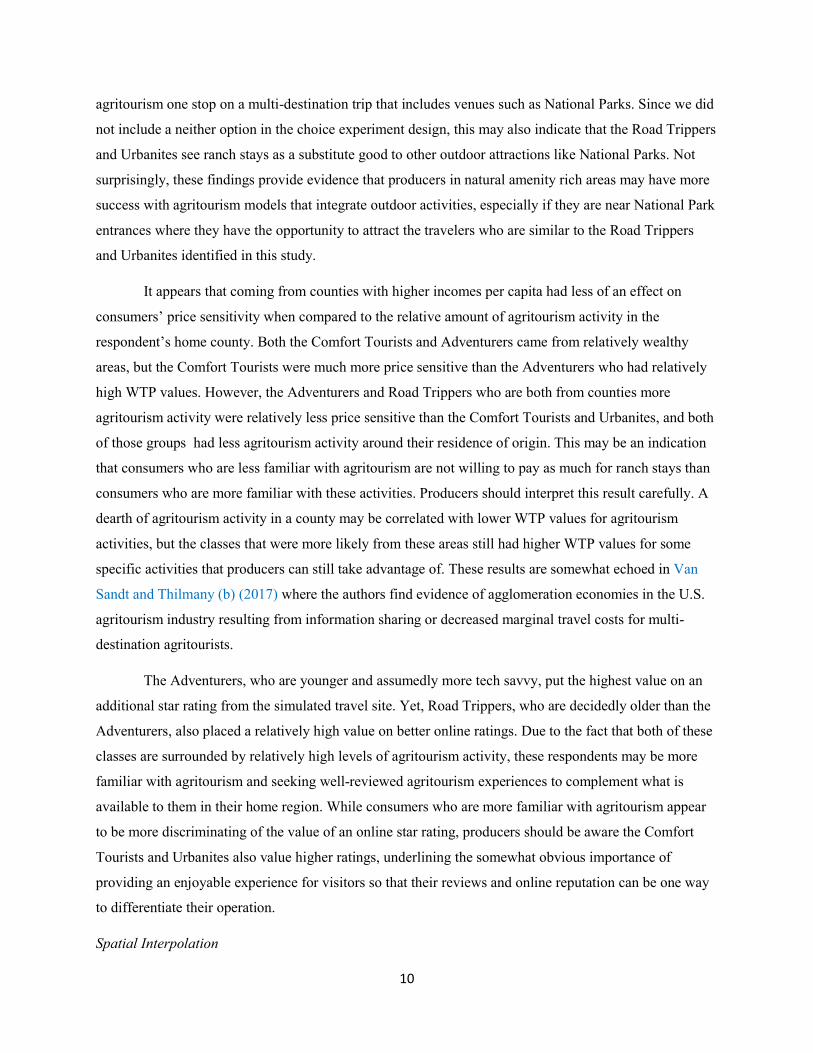
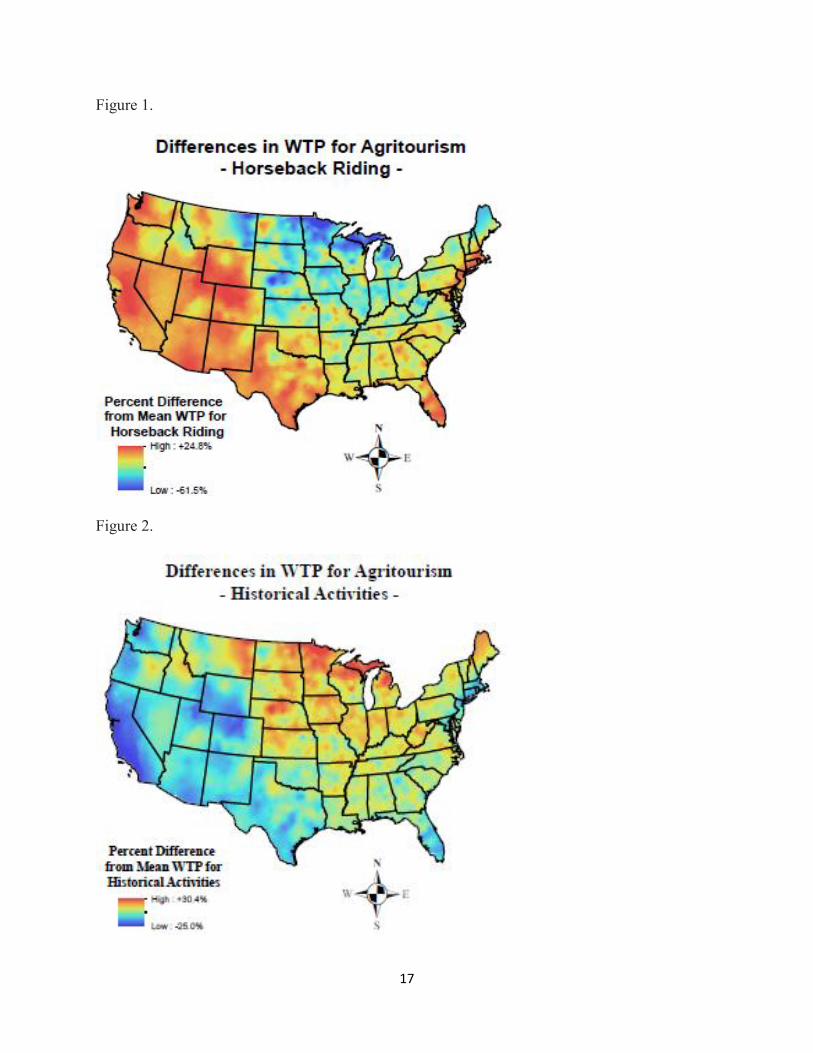
Figures 1 through 7 show maps of spatially distributed differences in WTP estimates for specific
attributes weighted across a county’s predicted class membership shares. Predicted class membership
shares were calculated using the class membership variables and county level data to calculate the log
odds and eventually the class shares of consumers in that county. WTP values were then weighted by
these class shares in an attempt to model the average traveler’s preference in that county. Once again, to
enhance the spatial interpolation method’s validity, we used each county’s population centroid as the
point of information.
At first glance, it appears that the activities and lodging maps are practically mirror images of
each other. This should not be surprising since they essentially represent opposite experiences for those
attributes. For example, horseback riding is much more popular in the West, Florida, and on the North
East coast. These first two regions immediately make sense since both of these areas have a long heritage
surrounding cowboy and horse culture, and relative to the Midwest, all of these regions have more natural
amenities presumably enhancing participants’ utility derived from outdoor activities. One spot of interest
is the Sonoma and Napa wine region in central California where the relative WTP for horseback riding is
notably less than on the rest of the Pacific coast. However, this area also has a relatively low WTP for
historical activities. This result is most likely due to the region’s agritourism being heavily centered on
wine experiences, meaning that an operator considering outdoor or historical activities in this region may
not be as successful than if they were to offer an activity that is a complement to wine-centered
agritourism (such as food courses). In contrast, it appears the Southern U.S. states have preference for
both horseback and historical agritourism activities.
The WTP spatial distributions for ranch stay agritourism experiences near urban amenities and
national park entrances shown in figures 3 and 4 tell a more complex narrative highlighting why visuals
showing spatial patterns are important in exploring potential markets. The reason we compare these two

12
maps to one another is the notion that National Parks tend to be located in more rural areas giving us an
idea of consumer preferences for ranch stay agritourism experiences. It seems across the entire contiguous
U.S., there are large cities whose citizens have a preference for agritourism experiences close to national
parks such as San Francisco, Los Angeles, Austin, Boston, New York City, and to some extent pockets
around Minneapolis and Chicago, but the first two of these cities also value urban amenities while the
others do not. Similarly, residents of some rural areas prefer agritourism experiences close to National
Parks, including NW Nevada, SW Wyoming, NW Colorado, and some areas in Arizona and New
Mexico. However, many rural areas in the Midwest have distinctly opposite preferences, and instead,
prefer city amenities over proximities to National Parks. A few other areas of interest in figures 3 and 4
include: 1) wine country in Central CA where close proximity to a National Park entrance and urban
amenities are both important; 2) other wine areas like the Finger Lakes region in NY that do not seem to
value urban amenities or proximity to national parks; and 3) consumers near National Parks in the West
seem to place a relatively high value on participating in agritourism experiences near National Park
entrances highlighting their preferences for locating near areas with significant natural assets.
Essentially, the spatial distributions seem to show some consumers prefer the familiarity of their
residence of origin while other pockets of consumers prefer more unique surrounding areas compared to
their own. This may mean that while rural does not clearly explain consumer choice behavior
heterogeneity in determining market segments (classes), the success of a ranch stay agritourism enterprise
may still be contingent on the rurality of an area depending on what region the farm or ranch is located in.
Conclusion
Many agricultural producers and economic development practitioners in rural areas are exploring
opportunities to diversify farm- and ranch-based businesses and keep rural economies viable. Clearly
these motivations to diversify an agricultural business and rural economy must have a strong grounding in
where a farm or ranch is located and what they produce. Agritourism is a particularly attractive
diversification strategy because activities can vary widely and take advantage of farms or ranches’ assets,
location and other strengths such as unique crops and livestock or proximity to markets. In addition
agritourism has been identified as an underutilized strategy for rural development by the USDA.
Given the important differentiation potential an agritourism enterprise can leverage based on their
location, this study explores how a consumers’ place of origin affected their choice behavior and used this
information to identify spatial patterns in consumer preferences and potential agritourism markets. Using
a choice experiment with varying qualities for a ranch stay agritourism experience and a random utility

13
framework, we estimated consumers’ WTP for said qualities while capturing preference heterogeneity
using a latent class logit model. We established four classes that captured the bulk of the respondent
heterogeneity and labeled these classes as Comfort Tourists, Adventurers, Road Trippers, and Urbanites.
As indicated by the class names, particularly large differences in preferences existed related to a traveler’s
urban surroundings and interest in outdoor activities. More so than the per capita income of the
respondent’s origin, existing agritourism activity had a large impact on the respondent’s price sensitivity,
implying that those familiar with agritourism are more likely willing to pay more for agritourism than
someone who has had less exposure to the industry and its offerings.
Taking the information gleaned from the latent class analysis, we utilized the class membership
covariates to determine the class shares for each county and used these to weight the WTP estimates for
various attributes in the choice experiment. These points of information were then used in an Empirical
Bayesian Kriging analysis where the spatial relationships between points were used to interpolate relative
differences in WTP values across the contiguous U.S. The spatial patterns of WTP differences most
notably showed a stronger preference for outdoor activities and more rustic lodging options in the
Western U.S., Florida, and on the NE coast. While urbanization of the respondent’s origin did not
significantly parse out differences in choice behavior, the spatial patterns show regions that strongly
prefer, or did not prefer, urban amenities and the distance to a National Park entrance. Considering
distances traveled can be interpreted as a cost to consumers, it is reasonable to believe that for many
agritourism establishments the preferences of consumers in nearby areas play a greater role in the success
of the enterprises than those same preferences averaged across the country.
By accounting for consumer heterogeneity, estimating WTP for certain “ranch stay” agritourism
qualities for counties with available data, and creating maps from interpolated WTP differences across the
U.S., we have identified interesting relationships and spatial patterns between respondents’ location of
origin and their choice behavior, as well as providing a tool for future agritourism sector development.
One caveat of this work is the fact that the survey instrument was designed for several other objectives
within an umbrella projects which required our sample to be weighted toward Western and agritourist
samples, and thus, not entirely representative of the population. We recommend a few areas for future
research. First, future studies should continue to explore the heterogeneity and relationships between the
characteristics of one’s surrounding area of origin and their choice behaviors, particularly the differences
between rural and urban choice behavior. Secondly, as mentioned agritourism is an extremely
heterogeneous industry with many unique experiences and we have only explored a small subset of
agritourism qualities. Finally, this research only considers one sector of the broader recreation market and
future studies should explore the how consumer heterogeneity across space may differ for other markets

14
of importance. As this is a working paper, we will continue to address the noted caveats and explore the
areas for future research.
References
Anselin, L., & Le Gallo, J. (2006). Interpolation of air quality measures in hedonic house price
models: spatial aspects. Spatial Economic Analysis, 1(1), 31-52.
Bagi, F., & Reeder, R. (2012). Farm activities associated with rural development initiatives.
Bagi, F. S., & Reeder, R. J. (b) (2012). Factors affecting farmer participation in
agritourism. Agricultural and Resource Economics Review, 41(2), 189.
Bhat, C. R. (1997). An endogenous segmentation mode choice model with an application to
intercity travel. Transportation science, 31(1), 34-48.
Brouwer, R., Martin-Ortega, J., & Berbel, J. (2010). Spatial preference heterogeneity: a choice
experiment. Land Economics, 86(3), 552-568.
Campbell, D. (2007). Willingness to Pay for Rural Landscape Improvements: Combining Mixed
Logit and Random‐Effects Models. Journal of agricultural economics, 58(3), 467-483.
Carpio, C., Wohlgenant, M., and Boonsaeng, T. (2008), ‘The demand for agritourism in the
United States’, Journal of Agricultural and Resource Economics, Vol 33, No 2, pp 254–
269.
Che, D., Veeck, A., & Veeck, G. (2005). Sustaining production and strengthening the
agritourism product: Linkages among Michigan agritourism destinations. Agriculture and
Human values, 22(2), 225-234.
Hensher, D. A., & Greene, W. H. (2010). Non-attendance and dual processing of common-
metric attributes in choice analysis: a latent class specification. Empirical
economics, 39(2), 413-426.
Hidrue, M. K., Parsons, G. R., Kempton, W., & Gardner, M. P. (2011). Willingness to pay for
electric vehicles and their attributes. Resource and Energy Economics, 33(3), 686-705.

15
Hill, R., Loomis, J., Thilmany, D., & Sullins, M. (2014). Economic values of agritourism to
visitors: a multi-destination hurdle travel cost model of demand. Tourism
Economics, 20(5), 1047-1065.
Juutinen, A., Mitani, Y., Mäntymaa, E., Shoji, Y., Siikamäki, P., & Svento, R. (2011).
Combining ecological and recreational aspects in national park management: A choice
experiment application. Ecological economics, 70(6), 1231-1239.
McFadden, D. (1974). The measurement of urban travel demand. Journal of public
economics, 3(4), 303-328.
McGehee, N. G., & Kim, K. (2004). Motivation for agri-tourism entrepreneurship. Journal of
travel research, 43(2), 161-170.
Nickerson, N. P., Black, R. J., & McCool, S. F. (2001). Agritourism: Motivations behind
farm/ranch business diversification. Journal of Travel research, 40(1), 19-26.
Nylund, K. L., Asparouhov, T., & Muthén, B. O. (2007). Deciding on the number of classes in
latent class analysis and growth mixture modeling: A Monte Carlo simulation
study. Structural equation modeling, 14(4), 535-569.
Pacifico, D., & Yoo, H. (2013). lclogit: a Stata command for fitting latent-class conditional logit
models via the expectation-maximization algorithm. Stata journal., 13(3), 625-639.
Shen, J. (2009). Latent class model or mixed logit model? A comparison by transport mode
choice data. Applied Economics, 41(22), 2915-2924.
Tew, C., & Barbieri, C. (2012). The perceived benefits of agritourism: The provider’s
perspective. Tourism Management, 33(1), 215-224.
Train, K. E. (2008). EM algorithms for nonparametric estimation of mixing
distributions. Journal of Choice Modelling, 1(1), 40-69.
United States Department of Agriculture. (2014). Ag census: desktop data query tool [Data file].
Retrieved from: http://www.agcensus.usda.gov/Publications/2012/
Van Sandt, A., & Thilmany, D. (2017). A Spatial Analysis of Agritourism in the U.S.: What’s
Driving Clusters of Enterprises? A Working Paper.
Van Sandt, A., & Thilmany, D. (b) (2017). Place Based Factors and the Success of Farm Level
Agritourism: A Spatial Interaction Model of Agritourism in the U.S. A Working Paper.

16
Veeck, G., Che, D., & Veeck, A. (2006). America's Changing Farmscape: A Study of
Agricultural Tourism in Michigan*. The Professional Geographer, 58(3), 235-248.
Wen, C. H., & Lai, S. C. (2010). Latent class models of international air carrier
choice. Transportation Research Part E: Logistics and Transportation Review, 46(2),
211-221.
17
Figure 1.
Figure 2.

18
Figure 3.
Figure 4.

19
Figure 5.
Figure 6.

20
Table 1. Latent Class Logit Class 1 Class 2 Class 3 Class 4
Class shares 24.7% 33.8% 20.7% 20.8%
Variables Comfort Tourists Adventurers Road Trippers Urbanites
�� ���� �� ���� �� ���� �� ����
Price -0.0028*** - -0.0002*** - -0.0007*** - -0.0029*** -
Rating 0.2527* $ 89.34 0.2290* $ 1,254.58 0.3060*** $ 454.08 0.6704*** $ 231.97
Lod
ging
Tent -0.1103 $ -39.00 0.2402 $ 1,316.33 -2.1001*** $ -3,116.31 -7.2454*** $ -2,507.16
Ranch House 0.5254*** $ 185.77 0.0999 $ 547.51 1.9278*** $ 2,860.73 -2.4342*** $ -842.31
Cabin 0.1593 $ 56.31 0.1019 $ 558.42 2.4905*** $ 3,695.72 0.5361 $ 185.51
Bed and Breakfast - - - - - - - -
Act
. Historical Excursion 0.6282 $ 222.11 -0.1012 $ -554.53 0.3463** $ 513.93 4.1903*** $ 1,449.97
Horseback 0.4287 $ 151.58 0.2074* $ 1,136.17 0.3134 $ 465.07 -7.9613*** $ -2,754.86
Sur
r. A
rea
City -0.3617 $ -127.91 0.0220 $ 120.78 0.5845*** $ 867.40 7.5842*** $ 2.62
Quaint Town 0.1401 $ 49.53 -0.1069 $ -585.91 1.2311*** $ 1,826.90 0.1170 $ 0.04
Remote - - - - - - - -
Distance to Nat. Park -0.0462 $ -16.33 0.0126 $ 68.96 -0.3344*** $ -496.20 -1.5887*** $ -0.55
Cla
ss M
embe
rshi
p
Cov
aria
tes
Agritourism Revenue 0.2146 0.2970** 0.2681* -
Ln(income/capita) 0.6411*** 1.0627*** 0.2245 -
Age 0.0036 -0.0286*** 0.0361*** -
Natural Amenities
Scale -0.0397 0.0740* -0.1365*** -

21
Minutes to Urban Area 0.0041 0.0026 -0.0015 -
Constant -2.5733*** -3.0390*** -2.3065*** -
*** P-value<1% Observations: 751
** P-value<5% Average Max Posterior Probability: 0.8809
* P-value<10%