
The Impact of Commercially Treated Oil and Gas Produced ...
46
The Impact of Commercially Treated Oil and Gas Produced Water Discharges on Bromide Concentrations and Modeled Brominated Trihalomethane Disinfection Byproducts at two Downstream Municipal Drinking Water Plants in the Upper Allegheny River, Pennsylvania, USA Matthew S. Landis, * Ali S. Kamal § , Kasey D. Kovalcik, Carry Croghan, Gary A. Norris US EPA, Office of Research and Development, Research Triangle Park, NC 27709 Amy Bergdale US EPA Region 3, Office of Monitoring and Assessment, Wheeling, WV 26003 * Corresponding author phone: (919) 541-4841; [email protected] § Now at EPA Office of Air Quality Planning and Standards, Research Triangle Park, NC 27709 Abstract In 2010, a dramatic increase in the levels of total trihalomethane (THM) and the relative proportion of brominated species was observed in finished water at several Pennsylvania water utilities (PDW) using the Allegheny River as their raw water supply. An increase in bromide (Br - ) concentrations in the Allegheny River was implicated to be the cause of the elevated water disinfection byproducts. This study focused on quantifying the contribution of Br - from a commercial wastewater treatment facility (CWTF) that solely treats wastes from oil and gas producers and discharges into the upper reaches of the Allegheny River, and impacts on two downstream PDWs. In 2012, automated daily integrated samples were collected on the Allegheny River at six sites during three seasonal two-week sampling campaigns to characterize Br - concentrations and river dispersion characteristics during periods of high and low river discharge. The CWTF discharges resulted in significant increases in Br - compared to upstream baseline values in PDW raw drinking water intakes during periods of low river discharge. During high river discharge, the assimilative dilution capacity of the river resulted in lower absolute halide concentrations, but significant elevations Br - concentrations were still observed at the nearest downstream PDW intake over baseline river levels. On days with active CWTF effluent discharge the magnitude of bromide impact increased by 39 ppb (53%) and 7 ppb (22%) for low and high river discharge campaigns, respectively. Despite a declining trend in Allegheny River Br - (2009-2014), significant impacts from CWTF and coal-fired power plant discharges to Br - concentrations during the low river discharge regime at downstream PDW intakes was observed, resulting in small modeled increases in total THM (3%), and estimated positive shifts (41-47%)
Transcript of The Impact of Commercially Treated Oil and Gas Produced ...

The Impact of Commercially Treated Oil and Gas Produced Water Discharges on Bromide Concentrations and Modeled Brominated Trihalomethane Disinfection Byproducts at two
Downstream Municipal Drinking Water Plants in the Upper Allegheny River, Pennsylvania, USA
Matthew S. Landis,* Ali S. Kamal§, Kasey D. Kovalcik, Carry Croghan, Gary A. Norris
US EPA, Office of Research and Development, Research Triangle Park, NC 27709
Amy Bergdale US EPA Region 3, Office of Monitoring and Assessment, Wheeling, WV 26003
*Corresponding author phone: (919) 541-4841; [email protected]
§Now at EPA Office of Air Quality Planning and Standards, Research Triangle Park, NC 27709
Abstract
In 2010, a dramatic increase in the levels of total trihalomethane (THM) and the relative
proportion of brominated species was observed in finished water at several Pennsylvania water
utilities (PDW) using the Allegheny River as their raw water supply. An increase in bromide (Br-
) concentrations in the Allegheny River was implicated to be the cause of the elevated water
disinfection byproducts. This study focused on quantifying the contribution of Br- from a
commercial wastewater treatment facility (CWTF) that solely treats wastes from oil and gas
producers and discharges into the upper reaches of the Allegheny River, and impacts on two
downstream PDWs. In 2012, automated daily integrated samples were collected on the
Allegheny River at six sites during three seasonal two-week sampling campaigns to characterize
Br- concentrations and river dispersion characteristics during periods of high and low river
discharge. The CWTF discharges resulted in significant increases in Br- compared to upstream
baseline values in PDW raw drinking water intakes during periods of low river discharge. During
high river discharge, the assimilative dilution capacity of the river resulted in lower absolute
halide concentrations, but significant elevations Br- concentrations were still observed at the
nearest downstream PDW intake over baseline river levels. On days with active CWTF effluent
discharge the magnitude of bromide impact increased by 39 ppb (53%) and 7 ppb (22%) for low
and high river discharge campaigns, respectively. Despite a declining trend in Allegheny River
Br- (2009-2014), significant impacts from CWTF and coal-fired power plant discharges to Br-
concentrations during the low river discharge regime at downstream PDW intakes was observed,
resulting in small modeled increases in total THM (3%), and estimated positive shifts (41-47%)

to more toxic brominated THM analogs. The lack of available coincident measurements of
THM, precursors, and physical parameters limited the interpretation of historical trends.
Keywords: Specific Conductivity, Source Attribution.

Introduction
Elevated bromide (Br-) levels in source water can lead to the formation of higher levels of
brominated disinfection byproducts (DBP) in finished drinking water; currently, conventional
drinking water treatment processes do not effectively remove Br- from source water (States et al.,
2013). In 2010 the Pittsburgh Water and Sewer Authority (PWSA) observed significantly
increased concentrations of total trihalomethanes (THM; a group of regulated DBPs) in their
water distribution system that were near the regulatory limit of 80 ppb (U.S. EPA, 1998), and
found the proportion of brominated THM species to be substantially higher than normal (States
et al., 2013). Six additional drinking water companies relying on the Allegheny River as their
source of raw water had their finished water tested and elevated levels of total and brominated
THM concentrations were also found, suggesting that the concentration and chemical makeup of
the THMs were changing in response to increased Br- concentrations in the river source water
(States et al., 2013). Brominated DBPs are of particular concern to public health authorities
since they are more carcinogenic, cytotoxic, and genotoxic than their chlorinated DBP analogs
(WHO, 2000; Plewa et al., 2002; Richardson et al., 2007), from consumption, inhalation during
showering, and dermal exposure (Cantor et al., 2010; Font-Ribera et al., 2010; Kogevinas et al.,
2010; Richardson et al., 2010). Discharges of treated oil and gas well produced wastewater and
commercial coal-fired power plants have been implicated as the primary sources of excess Br- in
both the Allegheny and Monongahela rivers in Western Pennsylvania (States et al., 2013;
Warner et al., 2013; Wilson and VanBriesen, 2013). Naturally occurring brine in the
hydrocarbon rich formations in the Appalachian Plateau in Western Pennsylvania leads to
elevated Br- and chloride (Cl-) concentrations in the oil and gas produced wastewater (Dresel and
Rose, 2010; Haluszczak et al., 2013). These elevated levels of Br- and Cl- being discharged into
the Allegheny River have raised concerns of many Western Pennsylvania water suppliers over
their ability to comply with the U.S. Environmental Protection Agency (EPA) Stage 2
Disinfectant/Disinfection Byproduct Rule (2006) amending the sampling and quarterly DBP
calculation methodologies with compliance beginning in 2012 for the largest systems.
The large national increase in exploration, drilling, and production of oil and gas from non-
conventional shale resources has generated large volumes of additional wastewater that
ultimately needs to be reused/recycled or disposed (Kargbo et al., 2010; Gregory et al., 2011;
Vidic et al., 2013). Most oil and gas well wastewater is disposed through deep well injection in

many parts of the U.S. (Gregory et al., 2011). However, in Pennsylvania, there is currently a
limited capacity for deep well injection with only eight EPA approved Class IID brine disposal
wells, and the development of the Marcellus Shale has increased the total wastewater generated
in the region by ~570% since 2004 (Lutz et al., 2013). The majority of oil and gas well
wastewater that is not reused is either trucked out of state for deep brine disposal well injection
or disposed of using alternative methods (Veil, 2010; Wilson and VanBriesen, 2013).
In Pennsylvania, the first Marcellus Shale gas well was drilled in 2004 (PA DCNR, 2014).
Through March 9, 2012 the Pennsylvania Department of Conservation and Natural Resources
issued 11,772 permits for non-conventional wells in the Marcellus Shale, of which 1,456 well
completion reports were received (PA DCNR, 2014). Overall, the number of gas producing
wells increased in Pennsylvania from 46,654 in 2005 to 55,136 in 2012 (U.S. EIA, 2014).
Historically, Pennsylvania has allowed oil and gas produced wastewater to be discharged into
publicly owned sewage treatment works (POTWs) where it was diluted, or treated by
commercial wastewater treatment facilities (CWTF) that solely treat wastes from oil and gas
producers with subsequent discharge to surface waters (Veil, 2010; Lutz et al., 2013). Most
CWTFs are designed to chemically precipitate, flocculate, and filter solids; but are not designed
nor successful in removing dissolved monovalent halides like Br- and Cl- (Ferrar et al., 2013;
Warner et al., 2013). In 2011 the Pennsylvania Department of Environmental Protection
(PADEP) issued a letter to oil and gas producers requesting that they voluntarily discontinue
using POTWs and CWTFs to dispose of Marcellus formation wastewaters (PA DEP, 2011),
which accounted for 79% of gas-related wastewater in Pennsylvania that year (Vidic et al.,
2013). All indications suggest that the producers have complied and diverted Marcellus derived
wastewater to other reuse or disposal options (Wilson and VanBriesen, 2013). However, other
non-Marcellus Devonian unit oil and gas wastewaters continue to be sent to both POTWs and
CWTFs that ultimately discharge to surface waters (Vengosh et al., 2014; U.S. EPA 2015). The
concentrations of Br- and Cl- in the upper Devonian well brines have been reported to be as high
or higher than the Marcellus wastewater (Dresel and Rose, 2010; Warner et al., 2013).
The Allegheny River is a vital natural resource to residents of Western Pennsylvania. Among its
provisioning services are accepting waste discharge and supplying drinking water. There is a
delicate balance between these services, especially during low river discharge periods when the

river’s assimilative capacity to dilute contaminant concentrations down to safe levels is
diminished (Ferrar et al., 2013). The Allegheny watershed is vulnerable to impairment due to
current discharges from POTWs, CWTFs, coal-fired power plants, iron and steel production,
manufacturing, urban runoff, roadway deicing materials, ongoing coal mining activities, legacy
mine discharges, and acid rain (Schofield 1982; PA DEP 2002; Wilson and VanBriesen, 2013).
The water quality at the intakes for public drinking water systems (PDW) is degraded by these
upstream discharge sources, and concern over this balance is heightened due to perceived
impacts from increased oil and gas drilling activities (States et al., 2013). Many of the sources of
impairment to river water quality have distinctive chemical characteristics, discharge at different
spatial locations, and are variable in time (U.S. EPA 2015). To manage these valuable watershed
services, investigative tools and strategies that exploit these unique discharge properties are
needed that track and quantitatively apportion discharge source impacts on surface water quality.
This study’s goals were to (i) establish an approach whereby the impact of a surface water
discharge from a single CWTF in the upper reaches of the Allegheny river on the raw water
halide concentrations at the nearest downstream PDW could be quantitatively evaluated, and (ii)
to estimate the impact of CWTF discharges on total THM concentrations and the relative
abundance of brominated DBPs in finished drinking water at two PDWs on the Allegheny River
using empirical EPA models.
Methods
Study Design
In 2012, U.S. EPA conducted three seasonal two-week sampling campaigns: spring (April 30-
May 14), summer (July 5-19), and fall (September 19-October 4) on the upper Allegheny River
in Pennsylvania. Samples were simultaneously collected from an upstream location (S01-
Upstream), a CWTF discharge (S02-CWTF), two downstream locations (S03-Downstream1 &
S04-Downstream2), and two downstream PDW raw water intakes (S05-PDW1 & S06-PDW2;
Figure 1) using automated samplers. The CWTF was accepting, treating, and discharging non-
Marcellus Appalachian Plateau Devonian strata oil and gas produced wastewater during all
sampling campaigns. The upstream sampling location was to establish “baseline” conditions
into the study domain, and the multiple downstream sampling locations were to evaluate
transport and dispersion of inorganic species discharged by the CWTF to the closest downstream

PDW. The Allegheny River km of each site and their relative distance from the CWTF
discharge is presented in Appendix A.1. The first sampler downstream of the CWTF discharge
was located ~12 km downstream to allow for adequate initial mixing of the effluent and river
water. The second downstream sampler was located between the first downstream sampling
location and the closest PDW intake, and was located ~15 km downstream of an 85 megawatt
bituminous waste coal-fired power plant discharge. The second PDW plant was included to
investigate the general trend of increasing Br- concentrations in the Allegheny as it traverses
from the upper into the lower reaches of river.
Allegheny River
The Allegheny River drains a catchment area of approximately 30,300 km2 in the Pennsylvania
and New York region of the northwestern Appalachian Plateau (PA Fish and Boat Commission,
2011). Most reaches of the upper Allegheny flow over locally-derived river sediment overlying
thick layers of glacial outwash (sand and gravel). The Allegheny headwaters flow into the
Allegheny Reservoir and leaves via the Kinzua Dam. Approximately 203 km of the Allegheny
River downstream of the Kinzua Dam, including the entire upper Allegheny study domain (S01-
Upstream to S05-PDW1), remains free-flowing; and is confined within a narrow, severely
meandering valley with precipitous side slopes (PA FBC, 2011).
Further downstream, the Allegheny is impounded and regulated by the U.S. Army Corp of
Engineers (USACE). The USACE manages the water level of the Allegheny in the study
domain by controlling water discharge volumes from the Kinzua, Tionesta, Union City, and
Woodcock reservoirs (USACE, 2014). This active management provides for flood control,
water quality management, and downstream navigation requirements. The water levels in the
upper reaches of the Allegheny River below the Kinzua Dam have historically been (i) highest in
the late fall and winter during reservoir drawdown in preparation for snow melt and spring
precipitation, resulting in a relatively high assimilative capacity from source discharges, and (ii)
lowest in the summer resulting in elevated concentrations of contaminants (USGS, 1993; USGS,
2013). Due to the resulting annual bimodal nature of Allegheny River water discharge rates, our
data analysis is categorized into “high” (≥ 8500 m3 min-1) and “low” discharge (<8500 m3 min-1)
regimes (USGS, 1993).

Sample Collection
Teledyne Isco (Lincoln, NE) Model 6712 computer-controlled automatic sequential water
samplers were utilized to simultaneously collect daily 800 ml composite river, CWTF, and PDW
samples along the Allegheny River study domain. Acid-cleaned (Landis and Keeler, 1997)
polypropylene bottles and Teflon sampling line were used to minimize contamination from the
sampler. The samplers were programmed to collect 400 ml twice a day at 09:00 and 12:00 EST,
after automatically rinsing the sampling line three times. The river sampler inlets were
positioned as far away as possible from vegetation and eddy currents near the river banks, and
~15 cm off the river bed. Isco sampler inlet distance from the river banks ranged from 3.1-4.1 m
during the high river discharge campaign, and 4.6-15.3 m during the low river discharge
campaigns. Isco sampler inlet depths from the surface ranged from 46-71 cm during the high
river discharge campaign, and 15-66 cm during the low river discharge campaigns. Sample
bottles were retrieved every 2-4 days. Grab samples were also collected from the POTW and
coal-fired power plant (CFPP) in the study domain using acid-cleaned polypropylene dippers and
poured into sample bottles. Ultra-clean handling methods for sample deployment and collection
were employed to avoid contamination of the collected samples (Landis et al., 2002). All
collected samples were packed in ice and shipped overnight to the laboratory.
Conductivity
Onset (Cape Cod, MA) HOBO Model U24-01 in-river sondes were deployed to measure water
temperature and electrical conductivity at each of the Isco sampling sites at 5 min intervals. A
YSI (Yellow Springs, OH) Model 556 multi-parameter instrument was utilized to collect
traceable temperature compensated specific conductivity (SC) readings to scale each Onset in-
river sonde using manufacturer provided HOBOware® Conductivity Assistant software
(Appendix A.2). The YSI instrument was calibrated each morning using YSI-3161 1000 μS cm-1
standard solution, checked again each night, and checked weekly using YSI-3165 100000 μS cm-
1 standard solution. Daily calibration check precision (n=42) was 98 ± 2% (mean ± standard
deviation), and the weekly high range linearity check precision (n=9) was 95 ± 4%. A collocated
Onset in-river sonde was deployed at S03-Downstream1 and the collocated precision (n=16685)
was 98 ± 3%.
Specific conductivity of Isco samples was determined in an EPA Class 100 clean room using a

Mettler Toledo (Columbus, OH) Model S47-K meter equipped with an InLab®731 probe. A two
point calibration curve was generated each day using certified Mettler Toledo 1413 μS cm-1 and
12.88 mS cm-1 conductivity standards. Accuracy checks were conducted using a Ricca Chemical
(Arlington, TX) 1, 50, 100, and 200 mS cm-1 certified secondary standards to ensure linearity.
Replicate analysis was performed on a minimum of 10% of samples and the observed precision
(n=54) was 99 ± 1%, and collocated sample precision (n=123) was 98 ± 5%. The mean of the
two five-min Onset in-river conductivity data points corresponding to the two daily Isco
sampling times were compared to the Isco sample conductivity and the relative precision was
found to be 93 ± 10% (Appendix B.1).
Major Anions
Anions were quantified using a Dionex (Sunnyvale, CA) Model ICS-2000 ion chromatography
instrument following an optimized U.S. EPA Method 300.1 (US EPA, 1997) technique as
described below. Each sample was injected twice to evaluate analytical precision. Anion
separations were performed with a 200 µL sample loop injection onto a Dionex IonPac© AG18
(4x50mm guard) and AS18 (4x250mm analytical) ion-exchange column, utilizing an isocratic
potassium hydroxide eluent method. The analytical columns used met performance criteria
specified in U.S. EPA Method 300.0 (1993). The ICS-2000 instrument was externally calibrated
using a six point curve generated from a mixed Dionex seven anion standard (#057590). Initial
calibration verification was performed with secondary source standards (High Purity Standards,
Charleston, SC) and NIST (Gaithersburg, MD) Standard Reference Materials for Cl- (#3182) and
Br- (#3184). Calibration stabilities were verified daily by mid-level continuing calibration
verification samples. Linear calibration curve statistics were verified with minimum acceptance
criteria of a coefficient of determination (r2) > 0.999. In order to increase the linear dynamic
range, two analytes (sulfate (SO42-), Br-) were processed with a quadratic regression, utilizing
seven calibration points with minimum acceptance criteria of r2 > 0.99. Prior to injection, all
field samples were filtered using Millipore (Billerica, MA) IC-Millex syringe filters (25mm,
0.45µm PTFE). Each chromatogram was visually verified for peak shape, retention and
identification. CWTF samples were all diluted 1000x with ASTM Type I ultra-pure water (18.2
MΩ⋅cm) prior to analysis. Replicate analysis was performed on ~10% of all samples and the
resulting analytical precision ranged from 99 ± 2% (Br-) to 100 ± 1% (Cl-, SO42-). Collocated
samples were collected and analyzed for ~30% of all observations and the resulting precision
ranged from 96 ± 10% (SO42-) to 99 ± 2% (Cl-). A summary of all analyte specific instrument
detection limits, method detection limits, and analytical/collocated precision are presented in
Appendix A.3.
USGS River Gage Data
River water discharge volumes for the sampling domain were obtained from the U.S. Geological
Survey (USGS). Hourly discharge data is available from October 1, 2007 through 2014 (USGS,
2015) for gage station #03025500 (Franklin, PA) located 1.5 km upstream of site S01-Upstream
on the Allegheny River, and gage station #03031500 (Parker, PA) located 11 km downstream of
S05-PDW1. The Parker gage station is located 1.8 km downstream of the Clarion River
confluence. The water discharge contribution from the Clarion River as measured by gage
#03030500 (Piney, PA) was subtracted from the gage value downstream of S05-PDW1 to
estimate river discharge closure within the upper Allegheny River sampling domain (Appendix
B.2).
Categorization of CWTF Discharge Impacted Samples
The non-continuous operation schedule of the CWTF resulted in periods with and without
discharge. High time resolution (5 min) in-river sonde conductivity data from each of the
sampling sites clearly elucidated defined CWTF conductivity discharge plume tracer events as
they were transported and hydrologically dispersed downstream through the upper Allegheny
River sampling domain. Transit time analysis was performed independently between the
CWTF-P45 (45 m downstream of the discharge pipe) and each downstream site, similar to
conducting a dye or tracer study in the river (Smart and Laidlaw, 1977; Kunkel and Radke,
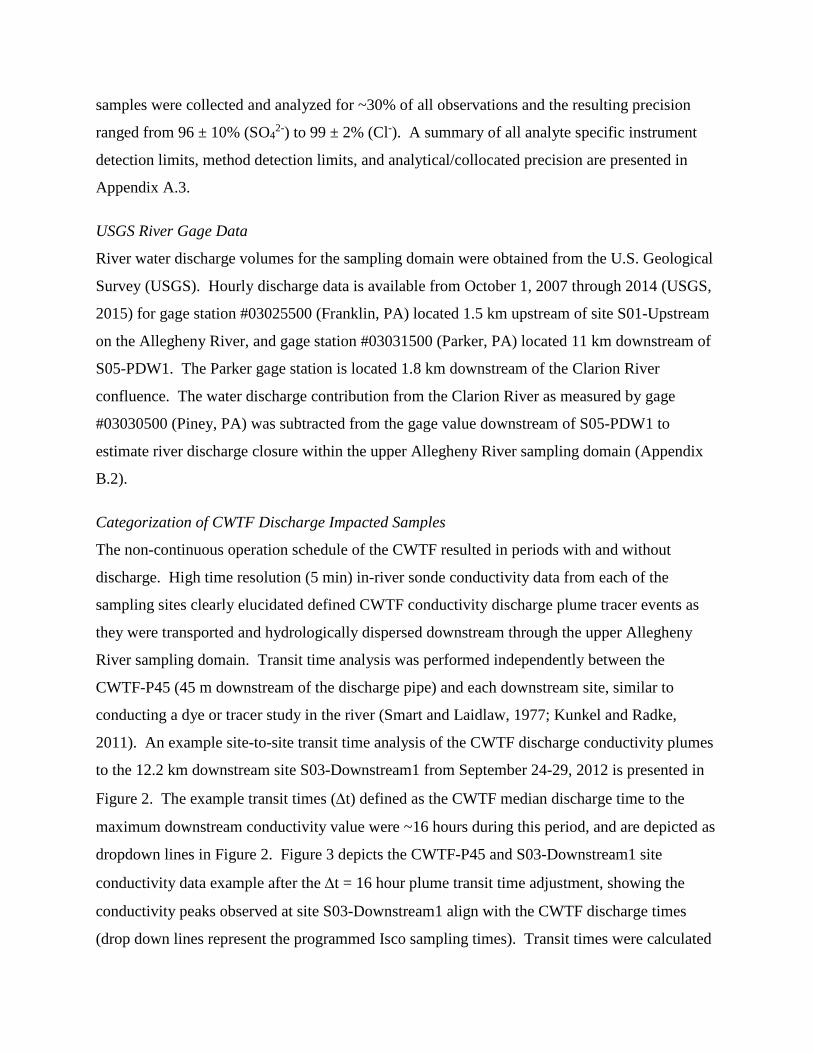
2011). An example site-to-site transit time analysis of the CWTF discharge conductivity plumes
to the 12.2 km downstream site S03-Downstream1 from September 24-29, 2012 is presented in
Figure 2. The example transit times (∆t) defined as the CWTF median discharge time to the
maximum downstream conductivity value were ~16 hours during this period, and are depicted as
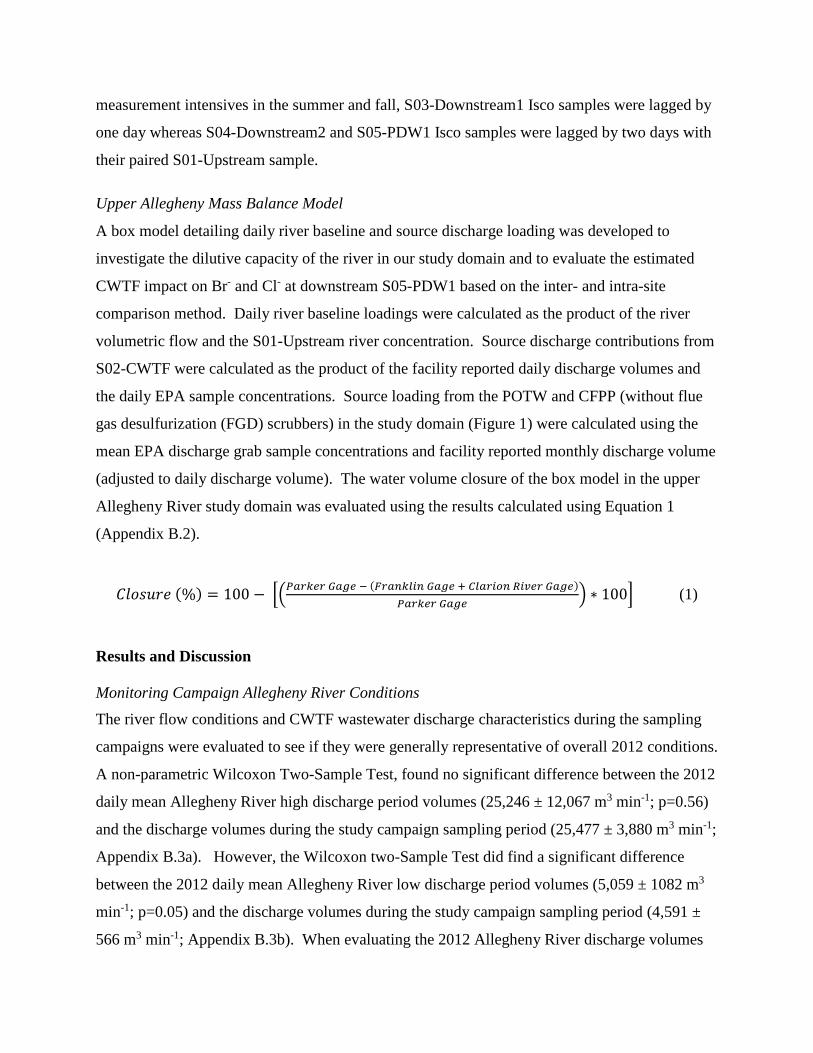
dropdown lines in Figure 2. Figure 3 depicts the CWTF-P45 and S03-Downstream1 site
conductivity data example after the ∆t = 16 hour plume transit time adjustment, showing the
conductivity peaks observed at site S03-Downstream1 align with the CWTF discharge times
(drop down lines represent the programmed Isco sampling times). Transit times were calculated

independently for each sampling site during each seasonal sampling period.
Based on these empirically derived plume transit times to each of the downstream sites and the
duration of the CWTF discharge, all Isco samples were categorized as “discharge impacted” if
one or both of the sample collection times (9:00 and 12:00 EST) fell within the conductivity
plume impact time for each site. Based on the transit time analysis Isco samples from the
example time period: September 24-28 and September 29 were categorized as “impacted” and
“non-impacted”, respectively. Each Isco sample and its associated time corrected in-river sonde
conductivity data was visually evaluated to ensure accurate categorization. S06-PDW2 site was
too far down stream to track the CWTF discharge conductivity plumes and was therefore not
included in the intra-site analysis.
Disinfection Byproduct Empirical Modeling
Empirical modeling of DBP formation in PDW was conducted to estimate the impact of
additional Br- contributed by CWTF discharges on total THM and brominated analogs at two
downstream intakes. The EPA empirical models employed (U.S. EPA, 1998; Solarik et al.,
2000) are statistically-based and were developed by EPA for predicting DBP formation during
water treatment disinfection using chlorine and ozone. Each model was formulated through
multiple step-wise regression analysis and takes the form of a multiple regression equation.
While the predictive empirical models may not accurately predict the complex conditions at any
particular PDW (Brown et al., 2011) they are considered to generally descriptive and useful for
the evaluation of water treatment facilities and human risk assessment (Sadiq and Rodriguez,
2004; Chowdhury et al., 2009). Different versions of the model were evaluated based on their
ability to predict the reported THM concentrations at PDW1 and PDW2 during our sampling
periods. Model input parameters are presented in Appendix Table A.4. Due to the use of
prechlorination, the raw water version of the THM prediction model provided the best predictive
results for both PDW1 and PDW2, and was utilized for all subsequent analysis. Based on
median raw water Br-, temperature, and pH measurements made during this study and PADEP
organic carbon measurements available for 2012-Quarter 2 (Q2) and 2012-Q3 at a location ~28
km upstream of PDW1 (PADEP, 2014; ), the model predicted 2012-Q2 (high river discharge
regime) total THM to be 50 ppb versus an actual reported concentration of 68, and the model
predicted 2012-Q3 (low river discharge regime) THM to be 107 ppb versus an actual reported

concentration of 110 ppb.
EPA’s empirical raw water DBP model was also run for PDW2 using the median raw water Br-,
temperature, and pH measurements made during this study and PADEP organic carbon
measurements available for 2012-Q2 and 2012-Q3 at a location ~25 km upstream (PA DEP,
2014). The model predicted 2012-Q2 (high river discharge regime) THM to be 47 ppb versus an
actual reported THM concentration of 53, and the model predicted 2012-Q3 (low river discharge
regime) THM to be 99 ppb versus an actual reported THM concentration of 101 ppb. Based on
the reasonable results of the raw water model, it was used to estimate the impact of the Br-
concentrations attributed to CWTF discharges on PDW THM concentrations.
Statistical Analysis
Data processing and all statistical analyses were performed using SAS v.9.4 (SAS Institute,
Cary, NC). Parametric statistics used in this analysis include: a t-test for independent samples,
and one-way analysis of variance (ANOVA). The assumptions of the parametric procedures
were examined using residual plots, skewness and kurtosis coefficients, Shapiro-Wilk test, and
the Brown-Forsythe test. If assumptions of the parametric procedures were violated, then the
Wilcoxon and Kruskal-Wallis non-parametric procedures were used, respectively. Analytical
and collocated precision were calculated as 1-(absolute percent difference) for replicate and
collocated sample analysis, respectively. In order to determine which combination of major
anions best predicts conductivity, the results, which were first obtained using stepwise regression
glmselect procedure, were verified using the general linear model sums of squares and Spearman
correlation matrix. One-sided tests and a level of significance of α=0.05 was used for all
statistical procedures unless otherwise stated.
To determine if the CWTF discharge significantly increased halide concentrations at downstream
sampling sites, the downstream Isco samples were evaluated by both intra- and paired inter-site
statistical hypothesis tests. The downstream inter-site “discharge impacted” Isco samples were
paired with their associated transit time corrected S01-Upstream sample. During the spring high
river discharge measurement intensive, S03-Downstream1 Isco samples paired with S01-
Upstream Isco samples on the same day while S01-Upstream Isco samples paired with S04-
Downstream2 and S05-PDW1 Isco samples on the following day. During low river discharge
measurement intensives in the summer and fall, S03-Downstream1 Isco samples were lagged by
one day whereas S04-Downstream2 and S05-PDW1 Isco samples were lagged by two days with
their paired S01-Upstream sample.
Upper Allegheny Mass Balance Model
A box model detailing daily river baseline and source discharge loading was developed to
investigate the dilutive capacity of the river in our study domain and to evaluate the estimated
CWTF impact on Br- and Cl- at downstream S05-PDW1 based on the inter- and intra-site
comparison method. Daily river baseline loadings were calculated as the product of the river
volumetric flow and the S01-Upstream river concentration. Source discharge contributions from
S02-CWTF were calculated as the product of the facility reported daily discharge volumes and
the daily EPA sample concentrations. Source loading from the POTW and CFPP (without flue
gas desulfurization (FGD) scrubbers) in the study domain (Figure 1) were calculated using the
mean EPA discharge grab sample concentrations and facility reported monthly discharge volume
(adjusted to daily discharge volume). The water volume closure of the box model in the upper
Allegheny River study domain was evaluated using the results calculated using Equation 1
(Appendix B.2).
𝐶𝐶𝐶𝐶𝐶𝐶𝐶𝐶𝐶𝐶𝐶𝐶𝐶𝐶 (%) = 100 − 𝑃𝑃𝑃𝑃𝑃𝑃𝑃𝑃𝑃𝑃𝑃𝑃 𝐺𝐺𝑃𝑃𝐺𝐺𝑃𝑃 − (𝐹𝐹𝑃𝑃𝑃𝑃𝐹𝐹𝑃𝑃𝐹𝐹𝐹𝐹𝐹𝐹 𝐺𝐺𝑃𝑃𝐺𝐺𝑃𝑃 + 𝐶𝐶𝐹𝐹𝑃𝑃𝑃𝑃𝐹𝐹𝐶𝐶𝐹𝐹 𝑅𝑅𝐹𝐹𝑅𝑅𝑃𝑃𝑃𝑃 𝐺𝐺𝑃𝑃𝐺𝐺𝑃𝑃)𝑃𝑃𝑃𝑃𝑃𝑃𝑃𝑃𝑃𝑃𝑃𝑃 𝐺𝐺𝑃𝑃𝐺𝐺𝑃𝑃
∗ 100 (1)
Results and Discussion
Monitoring Campaign Allegheny River Conditions
The river flow conditions and CWTF wastewater discharge characteristics during the sampling
campaigns were evaluated to see if they were generally representative of overall 2012 conditions.
A non-parametric Wilcoxon Two-Sample Test, found no significant difference between the 2012
daily mean Allegheny River high discharge period volumes (25,246 ± 12,067 m3 min-1; p=0.56)
and the discharge volumes during the study campaign sampling period (25,477 ± 3,880 m3 min-1;
Appendix B.3a). However, the Wilcoxon two-Sample Test did find a significant difference
between the 2012 daily mean Allegheny River low discharge period volumes (5,059 ± 1082 m3
min-1; p=0.05) and the discharge volumes during the study campaign sampling period (4,591 ±
566 m3 min-1; Appendix B.3b). When evaluating the 2012 Allegheny River discharge volumes

to the available daily historical records (2007-2014), we found the 2012 high river discharge
period volumes to be consistent with the average values (25,266 ± 11,575 m3 min-1; p=0.56;
Appendix B.3a) but the low discharge rates were found to be significantly lower than the
historical average (4,977 ± 1,025 m3 min-1; p<0.001; Appendix B.3b) due to a summer drought.
The median CWTF treated wastewater discharge volumes from April 2 - October 31, 2012
(n=157) was 333,976 liters per operation day with a range of 8,210 - 750,269 liters. The median
CWTF discharge volume during the monitoring campaigns was (n=38) 245,696 liters per
operation day with a range of 9,017 - 676,075 which was not significantly different from the
overall period (Wilcoxon Two-Sample Test p=0.06). The facility indicated its discharge
volumes were a function of customer demand for brine treatment services and facility
operational conditions.
Upper Allegheny River Observations
The overall study conductivity and halide results are generally consistent with previous
observations (States et al., 2013), which demonstrate that background levels in the upper
Allegheny River are relatively low and significantly increase downstream. When the high and
low river discharge regimes are examined independently (Table 1), the assimilative dilution
capacity of the river during periods of high discharge is evident for halide species and results in
significantly (p<0.001) lower conductivity, Br-, and Cl- at each of the sites (S01-Upstream
through S05-PDW1). The median domain baseline conductivity (126 µS cm-1), Br- (25 ppb), and
Cl- (13.1 ppm) at S01-Upstream during the spring high river discharge campaign were lower
than the corresponding medians of 174 µS cm-1, 72 ppb and 21.0 ppm during the combined
summer/fall low river discharge campaigns. The median S05-PDW1 conductivity (158 µS cm-
1), Br- (38 ppb) and Cl- (17.0 ppm) during the high river discharge campaign increased to 202 µS
cm-1, 85 ppb and 23.5 ppm, respectively, during the low river discharge campaigns. While the
overall halide concentrations were lower during the high discharge spring campaign, the S05-
PDW1 site downstream of the CWTF discharge in our study domain was significantly higher
than S01-Upstream baseline site for conductivity, Br-, and Cl-.
Lower Allegheny River Observations
While not in the upper Allegheny River study domain, comparing the results observed at S06-

PDW2 ~100 km further downstream from S01-PDW1 is informative to evaluate the integrative
impact of additional downstream sources in the watershed on another public drinking water
resource (U.S. EPA, 2015; Appendix B.4a-c). Significant increases in conductivity, Br-, Cl-, and
SO42- were observed between S05-PDW1 and S06-PDW2 during the low river discharge
campaigns, and significant increases in conductivity, and SO42- were observed during the high
river discharge campaign (Table 1; Appendix B.4a-d). On an integrated basis during the high
river discharge campaign, there was a 154% increase in SO42- (11.3 to 28.7 ppm), a 16% increase
in conductivity (157 to 182 µs cm-1), a 3% decrease in Br (36 to 35 ppb), and an 8% decrease in
Cl- (17.3 to 15.9 ppm) from S05-PDW1 to S06-PDW2. During the low discharge campaigns
there were significant increases (Table 1; Appendix B.4a-d) in all contaminant concentrations at
S06-PDW2 relative to S05-PDW1 including a 754% increase in SO42- (9.6 to 82.0 ppm), a 83%
increase in conductivity (204 to 374 µs cm-1), a 63% increase in Br- (87 to 142 ppb), and a 29%
increase in Cl- (23.6 to 30.4 ppm). A stepwise multi-linear regression analysis found that
conductivity at S01-Upstream and S06-PDW2 were best predicted by Cl- and SO42-
(R2 = 0.965),
while conductivity at S03-Downstream1, S04-Downstream2, and S05-PDW1 were best
predicted by Cl- and Br- (R2 = 0.862). This finding indicates that in the upper reaches of the
Allegheny River (S03-Downstream1 to S05-PDW1) downstream of the CWTF discharge
conductivity is halide dominated, whereas in the lower reaches of the Allegheny River (S06-
PWD2) it reverts back to a more SO42- dominated system.
The distance, tributary inflow (Appendix B.2), and additional anthropogenic discharge sources
downstream of S05-PDW1 preclude identification of the source types contributing to the
elevated concentrations at S06-PDW2 within the context of this work. One indication that coal-
related sources are substantially impacting halide concentrations at S06-PDW2 is the large
increase in SO42- (Table 1) in combination with a downward shift in the Cl-/Br- ratio in relation to
the upper Allegheny River study domain (Appendix B.5). During the low river discharge
campaigns the median Cl-/Br- drops from 278 (S05-PDW1) in the upper Allegheny River study
domain to 217 (S06-PDW2) suggesting an impact from a characteristically lower Cl-/Br- source
such as upper Pennsylvanian Conemaugh and Monongahela formation bituminous coals that are
mined regionally (Seere and Lee, 2009; U.S. EPA, 2015).

Impact of CWTF on S05-PDW1 Raw Water
The operation schedule of the CWTF during the study campaigns, nominally 06:00-13:00 EST
Monday through Friday, allowed us to investigate downstream river conditions both in the
presence and absence of treated oil and gas wastewater discharge. During both the high and low
river discharge campaigns, the automated samplers captured a sufficient number of CWTF
discharge impacted and non-impacted categorized samples at the S03-Downstream1, S04-
Downstream2 river sites, and S05-PDW1 intake for inter- and intra-site statistical analyses. A
summary of the high and low river discharge regimes CWTF impacted and non-impacted
categorized data and inter-site paired Kruskal-Wallis one-sided test results are presented in
Tables 2 and 3, respectively.
Evaluating the impact of the S02-CWTF discharge on downstream sites can be characterized on
an inter-site basis by evaluating the S01-Upstream conductivity and anion species means versus
the downstream site means for those species that were found to have no significant sources in the
study domain other than the CWTF discharge. In this case we define no other significant source
impacting the PDW intake as a condition whereby (i) the non-discharge impacted categorized
samples at S05-PDW1 and their paired S01-Upstream site samples are not significantly different
during both high (Table 2) and low (Table 3) river discharge conditions and (ii) no significant
contribution from the POTW and CFPP discharge grab samples, only Br- meets this criterion.
During both the high (Table 2) and low (Table 3) river discharge sampling periods the observed
Br- concentrations at S03-Downstream1, S04-Downstream2, and S05-PDW1 raw drinking water
intake were not significantly different than the paired S01-Upstream Br- concentrations during
non-discharge impacted days, but were significantly higher during CWTF discharge impacted
days. These relationships for the Allegheny River low discharge regime are clearly depicted in
Figure 4a where the stable Br- concentrations throughout the study domain during non-CWTF
discharge days are contrasted with the clearly observable downstream enhancement during
discharge days, which was initially highest at the S03-Downstream1 site with decreasing
concentrations as a result of dilution and hydraulic dispersion downstream to S05-PDW1. This
inter-site analysis takes into account the periods of CWTF discharge only and provides a
quantitative overall estimate of Br- enhancement through the study domain. The magnitude of
the integrated Br- enhancement during low river discharge from the CWTF on downstream sites
was 109% (81 ppb) at S03-Downstream1, 45% (33 ppb) at S04-Downstream2, and 51% (38 ppb)
at S05-PDW1. During high river discharge the integrated Br- enhancement on downstream sites
was 50% (14 ppb) at S03-Downstream1, 31% (8 ppb) at S04-Downstream2, and 50% (13 ppb) at
S05-PDW1. At first glance the lower relative impact of the CWTF effluent discharge on
observed Br- concentrations at the S03-Downstream1 site during the high river discharge period
seemed to suggest that the Allegheny River’s assimilative capacity was adequate to dilute CWTF
related contaminants down to lower relative levels within the 12 km distance between the
discharge and the site. However, when we evaluated the Isco sampling times categorized as
CWTF impacted versus the associated in river sonde conductivity plume impact time (e.g.,
Appendix B.5), it was observed that the automated sampler did not capture the main discharge
plume which was still clearly evident and not fully mixed. The systematic mismatch of Isco
sampling and CWTF discharge plume impact times encountered at site S03-Downstream1 during
the high discharge sampling campaign biased the relative impact down in relation to both the
impact observed at the site during the low river discharge campaigns and the S04-Downstream2
and S05-PDW1 sites during the high river discharge campaign. While Cl- presented a similar
overall response as Br- (Figure 4b) demonstrating a clear impact from CWTF effluent, the S05-
PDW1 site high river discharge sampling period Cl- concentration was significantly higher
(p=0.016) than S01-Upsteam during non-discharge days (Table 2); suggesting another
contributing source(s) (e.g., CFPP discharge) and precluding its inclusion in the inter-site
analysis.
The impact of CWTF effluent discharge on downstream sites within the study domain was also
evaluated using CWTF discharge categorized intra-site analysis, whereby the CWTF impacted
and non-impacted sample subsets at each site were statistically compared (Table 4; Figures 4a-c).
Both downstream river sites (S03-Downstream1, S04-Downstream2) and S05-PDW1 were found
to have significantly higher conductivity, Br-, and Cl- during both high and low river discharge
conditions when being impacted by the CWTF effluent discharge plume. The discharge
categorized data from the high and low discharge regime campaigns used for intra-site analysis
are presented in Table 4 and are depicted in Figures 4a-c. The S01-Upstream conductivity data
174 ± 13 μS cm-1 has a relatively tight range compared to the CWTF downstream sites and the
distribution is not significantly different than normal (Shapiro-Wilk; p=0.166; Figure 4c). The
magnitude of the mean conductivity impact from the CWTF on downstream sites during low
river discharge, determined by evaluating all the impacted versus non-impacted categorized

samples, was an increase of 15% (28 µS cm-1) at S03-Downstream1, 12% (23 µS cm-1) at S04-
Downstream2, and 12% (23 µS cm-1) at S05-PDW1. The CWTF discharge categorized Cl- data
from the low discharge regime campaigns are depicted in Figure 4b. Using the same analytical
approach described above, the magnitude of the Cl- impact from the CWTF discharge on
downstream sites was an increase of 40% (8.4 ppm) at S03-Downstream1, 21% (4.5 ppm) at
S04-Downstream2, and 19% (4.3 ppm) at S05-PDW1. The CWTF discharge categorized Br-
data from the low discharge regime campaigns are depicted in Figure 4a. The magnitude of the
Br- impact during the low discharge regime was an increase of 105% (79 ppb) at S03-
Downstream1, 55% (39 ppb) at S04-Downstream2, and 53% (39 ppb) at S05-PDW1. In
contrast, the S01-Upstream baseline and non-impacted downstream Br- mean concentrations
were indistinguishable (74 ± 2 ppb), which is a strong indication that non-impacted samples were
properly categorized and that there were no other significant sources of Br- in the study domain
(Figure 4a).
During the high river discharge sampling regime the overall observed concentrations and the
magnitude of CWTF impact were lower at all downstream sites due to the river’s increased
dilution capacity. The CWTF effluent discharge enhancement for (i) conductivity was an
increase of 7% (9 µS cm-1) at S03-Downstream1, 6% (8 µS cm-1) at S04-Downstream2, and 2%
(3 µS cm-1) at S05-PDW1, (ii) Cl- was an increase of 20% (2.7 ppm) at S03-Downstream1, 11%
(1.5 ppm) at S04-Downstream2, and 5% (0.9 ppm) at S05-PDW1, and (iii) Br- was an increase of
75% (18 ppb) at S03-Downstream1, 31% (8 ppb) at S04-Downstream2, and 22% (7 ppb) at S05-
PDW1.
Cl-/Br- Ratio
Halide ratios (e.g., Cl-/Br-) are used in hydrogeological studies to elucidate water migration
because the species primarily occur as dissolved monovalent ions that typically are conserved
during movement through environmental compartments (Davis et al., 1998; Freeman 2007;
Alcala and Custodio, 2008). Formation water from Devonian oil- and gas-bearing units such as
the Marcellus are enriched in Br- resulting in characteristically lower Cl-/Br- ratios (Ferrar et al.,
2013; Warner et al., 2013). The Cl-/Br- ratio of the S02-CWTF discharge was significantly
different (Kruskal-Wallis p<0.0001) during the high (n=13; 110.6 ± 6.2) and low (n=23; 90.4 ±
2.4) discharge regime sampling campaigns. The Cl-/Br- ratio of data presented by Warner et al.,

(2013; and references within) was 127.2 from a similar CWTF discharge in Western
Pennsylvania treating a combination of Marcellus and conventional Devonian produced
wastewater (2010-2012), 107.8 from raw upper Devonian produced water, 93.4 from raw
Marcellus produced water, and 108.5 from raw Lower Devonian produced water. The discharge
categorized Cl-/Br- ratio data from the low discharge regime campaigns indicate higher values
were observed during non-impact conditions compared to impacted conditions (Figure 5).
Similar to the Br- results, good agreement between the low discharge regime S01-Upstream
(316.0 ± 80.3) and non-impact categorized downstream Cl-/Br- ratios is an indication of no
additional significant sources of Br- enriched discharge into the study domain. A significant
reduction (p=0.023) of the Cl-/Br- ratio is observed at the S03-Downstream1 site when being
impacted by the CWTF discharge (205.9 ± 38.9) and then increases as the halides are diluted by
the more Cl- dominated baseline river flow (316.0 ± 80.3) down to sites S04-Downstream2
(246.2 ± 33.6) and S05-PDW1 (243.7 ± 35.5; Figure 5). Within the upper Allegheny study
domain (S01-Upstream to S05-PDW1) elevated total Br- and low Cl-/Br- sample ratios appear to
be a good indicator of CWTF discharge downstream impact.
In the context of S06-PDW2 and other locations in the lower reaches of Allegheny River
watershed, interpretation of Cl-/Br- ratios becomes more difficult as the number of sources
discharging into the river and its tributaries dramatically increase (e.g., public/commercial
wastewater treatment facilities, discharges from coal mines, coal bed methane (CBM), CFPP).
The mean Cl-/Br- ratio observed at S06-PDW2 during the high river discharge regime (460 ± 71)
was significantly higher (p<0.0001) than the Cl-/Br- ratio during the low river discharge regime
(216 ± 17), suggesting that the elevated halides measured during the low river discharge
campaign were the result of discharges of wastewaters containing characteristically lower Cl-/Br-
ratios into the river. Coal mined in the region from the upper Pennsylvanian Conemaugh and
Monongahela formation bituminous coals (e.g., Pittsburgh #8; Kosanke, 1984) have been found
to contain high concentrations of Br- (13.4 ppm) and a low Cl-/Br- ratio of 72.6 (Seere and Lee,
2009). In addition, contemporaneously collected samples of wastewater discharges from other
anthropogenic activities exploiting the same coal formations and discharging into the Allegheny
River or its tributaries between sites S05-PDW1 and S06-PDW2 also contain Cl-/Br- ratios
substantially lower that the upper Allegheny baseline S01-Upstream values (316.0 ± 80.3)
including: coal ash (40.7), treated FGD (68.4), CBM (129.9), treated AMD (158.1), AMD seeps

(172.6), and active coal mine runoff (183.0; EPA 2015).
The timeline of increasing PDW THM concentrations along the Allegheny River and its
perceived correlation to expanding exploitation of the Marcellus shale in western Pennsylvania
for gas and oil production reported by States et al. (2013), was also concurrent with the regional
trend of installing air pollution control systems in CFPPs. The development of the EPA 2005
Clean Air Interstate Rule, the 2011 Cross-State Air Pollution Rule, and the 2011 Mercury and
Air Toxics Standards have led to the wide spread retrofitting of the US CFPP fleet with FGD
scrubbers. Scrubber installations reached 64% of CFPPs by the end of 2012 (US Energy
Information Administration). Among other pollutants such as SO2 and divalent mercury species
(e.g., HgCl2, HgBr2), scrubbers also efficiently remove halides from the stack gas that originates
naturally in the combusted coal. Once FGD scrubbers remove components from the stack
exhaust (e.g., halides and sulfur dioxide), CFPPs typically discharge treated scrubber wastewater
as well as storm water runoff from coal and residual ash piles enriched in halides and sulfate to
surface waters in western Pennsylvania (U.S. EPA 2015).
Upper Allegheny Mass Balance Model
The water volume closure of the box model in the upper Allegheny study domain was evaluated
using the results calculated using Equation 1, and the daily mean volume closure was found to be
88 ± 11%. The model on average underestimated the volume of water in the system because of
inflows from three ungaged tributaries (Turkey Run, Sandy Creek, Scrubgrass Creek) into the
Allegheny River between sites S01-Upstream and S05-PDW1 (Appendix B.2) were not included
in the model. Water volume closure during the high river discharge regime (95 ± 12) was on
average better than during the low river discharge regime (84 ± 8).
During the low discharge campaigns, the river baseline flow contributed an average of 448 kg of
Br- and 133,970 kg of Cl- into the model domain on CWTF discharge days. The daily mean
source contribution from S02-CWTF was 202 kg Br- and 18,208 kg Cl-, the contribution from
the POTW was 0.0 k g Br- and 1,332 Cl-, and the contribution from the CFPP was 0.1 kg Br-; and
196 kg Cl-. Assuming homogeneous steady state conditions with no additional source terms, the
box model predicts the S02-CWTF discharge would contribute an average of 44 ± 22% of the Br-
and 14 ± 7% of the Cl- into the upper Allegheny River sampling domain (Figure 6a). The box

model results agree well with the 53% Br- (39 ppb) and 19% Cl- (4.3 ppm) contributions from
the intra-site analysis, and the 51% Br- (38 ppb) and 26% Cl- (5.4 ppm) contributions from the
inter-site analysis at S05-PDW1 (Table 5). The daily box model average estimated total Br-
mass (649 kg day-1) contribution into the upper Allegheny River domain was within 8% of the
S05-PDW1 measurement based Br- mass estimate (703 kg day-1), indicating the observed impact
at PDW1 during low river discharge could be explained through the contributions of the three
known discharge sources into the river within the uncertainty of the water volume closure.
During the high river discharge measurement campaign, the Allegheny River water volume was
five times greater than during the low river discharge measurement campaigns. While the high
discharge campaign halide concentrations were lower, the river baseline discharge contributed
more than double the halide mass (mean of 973 kg of Br- and 490,853 kg of Cl-) into the model
domain per CWTF discharge day than was observed during the low river discharge periods. The
daily mean source contributions from S02-CWTF was 159 kg Br- and 17,323 kg Cl- (Figure 6b).
The daily mean source contributions from the POTW and CFPP were 0.0 and 0.1 kg Br-; and
1,534 and 147 kg Cl-, respectively. During the high discharge regime the box model predicts the
S02-CWTF discharge would contribute 16 ± 6% of the Br- and 4 ± 1% of the Cl- into the river
domain. While the box model results agree relatively well with the 22% Br- (7 ppb) and 5% Cl-
(0.9 ppm) contributions from the intra-site analysis (Table 5), overall it under predicts the total
average daily loading in the river versus the S05-PDW1 measurement based estimates (Figure
6b). The generally higher CWTF impact estimated by the inter- and intra-site analyses was
expected as the Isco sampling times were coincident with the CWTF effluent conductivity
impacts measured at S05-PDW1 by the in-river sonde, whereas the box model assumes a
homogeneous well mixed system. The observed CWTF effluent discharge impacts at S05-
PDW1 suggests the impacts of the elevated halide concentrations on the raw water plant intake
could be partially mitigated by conditional pumping based on near-field upstream conductivity
measurements.
Implications of CWTF Discharges on PDW THM Concentrations
As reported by States et al. (2013) the PWSA and other water utility operators relying on the
Allegheny as their raw water source observed significantly increased total THM concentrations
and substantially higher than normal relative abundances in brominated analogs in 2010, and

hypothesized that these observations were a result of increased Br- concentrations in their river
source water. A time series analysis of Allegheny River Br- concentration was not possible then
as routine Br- measurements by PADEP were not initiated until late 2009 (USEPA, 2014). If Br-
is present in PDW raw water it can be oxidized during the chlorination process to form HOBr,
which can react with natural organic matter to form a plethora of intermediate brominated
disinfection byproducts (Zhai and Zhang, 2011). It has been reported that HOBr is a more
efficient substitution agent than HOCl (Symons et al., 1993; Cowman and Singer, 1996), and that
HOBr is up to twenty times more reactive than HOCl in the formation of THM and haloacetic
acids (Uyak and Toroz, 2007). A current time series of quarterly THM concentrations in
finished drinking water and the annual rolling averages are presented in Figure 7a for site S05-
PDW1 using all available data contained in the PADEP Drinking Water Reporting System
(PADEP, 2014). An upward trend in the annual rolling average of THMs in finished drinking
water, and an underlying seasonal variation are observed. A linear regression analysis was
completed for quarterly THM rolling concentrations from 2010-Q1 through 2014-Q4 (Figure 7b)
and a significant (p<0.0001; r2=0.864) increasing trend of ~6 ppb per year was found. At this
rate, S05-PDW1 will exceed the EPA THM standard of 80 ppb by 2016. The Q3 THM
concentrations for 2010 through 2014 are significantly higher than the other quarters (p=0.011)
reported during this period. The likely contributing factors to elevated Q3 THM concentrations
are significantly higher Br- (p=0.015) and organic carbon (p<0.0001) concentrations during the
low river discharge regimes, as well as the higher water temperatures in the summer (Appendix
A.2).
EPA’s empirical raw water DBP treatment model was used to estimate the impact of the CWTF
discharge on S05-PDW1 THM formation by comparing discharge impacted and non-discharge
impacted intra-site analysis scenarios during the low (2012-Q3) discharge regime when the
highest THM concentrations are reported (Figure 7a). The mean low river discharge non-impact
categorized Br- concentration from S05-PDW1 (73 ppb; Table 4) and CWTF impacted
categorized (112 ppb; Table 4) samples were used to parameterize successive model runs. The
predicted total THM concentration for the non-impacted baseline river condition was 105 ppb,
and the predicted CWTF discharge impacted river condition yielded an estimated total THM
value of 109 ppb (3% increase). While the additional Br- in the S05-PDW1 raw water intake
attributed to the CWTF enhancement discharge was not estimated to substantially contribute to

the overall total THM, the model predicted an overall decrease in chlorinated THM analogs and
a large 41% increase in the more toxic brominated THM analogs. The model estimated a 37%
increase in bromodichloromethane (19.0 to 26.0 µg L-1), a 113% increase in bromoform (0.2 to
0.4 µg L-1), and a 117% increase in dibromochloromethane (4.0 to 8.7 µg L-1).
Since S06-PDW2 samples could not be categorized as impacted and non-impacted by S02-
CWTF due to the dissipation of the conductivity plume and additional downstream sources, the
relative impact of aggregate CWTF discharges were based on a comprehensive multivariate
positive matrix factorization (PMF) statistical receptor modeling analysis reported by U.S. EPA
based on measurements made during this same study period at S06-PDW2 and nine other
sampling sites located on the Allegheny River and its tributaries (U.S. EPA 2015). During the
low river discharge regime, U.S. EPA (2015) attributed 37% and 59% of Br- at S06-PDW2 to
CWTF discharges and coal-fired power plants equipped with flue gas desulfurization scrubbers,
respectively. EPA’s empirical raw water DBP treatment model was used to estimate the impact
of the total aggregate of CWTF discharges on S06-PDW2 THM formation by comparing mean
observed Br- concentration to the mean Br- concentrations minus the estimated aggregate CWTF
contributions during the low (2012-Q3) discharge regime. The mean low river discharge Br-
concentration from S06-PDW2 (142 ppb; Table 1) and the Br- concentration with the estimated
37% CWTF contribution removed (89 ppb) were used to parameterize successive model runs. A
predicted total THM contribution at S06-PDW2 from CWTF attributed Br- was 3 ppb, with a
47% increase in brominated THM analogs. The model estimated a 41% increase in
bromodichloromethane (18.2 to 25.7 µg L-1), a 128% increase in bromoform (0.3 to 0.7 µg L-1),
and a 133% increase in dibromochloromethane (5.0 to 11.5 µg L-1).
The empirical THM modeling results corroborate the States et al. (2013) and Parker et al., (2014)
conclusion that increased Br- concentrations in the Allegheny River attributable to CWTF
wastewater discharges water can substantially shift PDW total THM from chlorinated to more
toxic brominated analogs. However, the empirical THM modeling does not support the
contention that Br- attributed to CWTF discharges affects the overall trend of increasing THM
concentrations (Figure 7b). From 2010 to 2014, PADEP data shows a significantly (p=0.0045)
decreasing Br- trend in the upper reaches of the Allegheny River in the vicinity of S05-PDW1
(Figure 7c) during the concurrent increasing trend in total THM (Figure 7b). The significantly

decreasing Br- trend (p=0.005; Appendix B.7) is also observed in the lower reaches of the
Allegheny River in the vicinity of S06-PDW2 during the concurrent (p=0.003) increasing trend
in total THM from 2010 to 2013 (Appendix B.6). A sensitivity analysis of the THM formation
model parameterized for both S05-PDW1 and S06-PDW2 suggests the increasing trend is more
likely due to variability in the Allegheny River dissolved organic carbon (DOC) concentrations.
Unfortunately, the majority of the available Allegheny River data reports primarily total organic
carbon (TOC) rather than DOC concentrations which are more relevant to THM formation (U.S.
EPA, 1998; Solarik et al., 2000). While there are no significant trends observed in the PADEP
reported Allegheny River quarterly averaged TOC data in either the upper (p=0.18; Figure 7c) or
lower (p=0.15; Appendix B.7) Allegheny River during the time period with available THM data,
we did find significantly increasing trends in TOC in the monthly PDW plant reported raw water
intake data at both S05-PDW1 and S06-PDW2 (p<0.0001; Figure 8) data from 2003 - 2015.
TOC at S05-PDW1 and S06-PDW2 showed virtually identical increasing trends (slopes,
intercepts, and coefficients of determination) of 2.4 µg L-1 per year over the 13 year period.
Conclusions
As a result of Marcellus formation wastewater being diverted to other reuse and disposal options
(PADEP, 2014), there has been a drastic reduction in the volume of oil and gas wastewater
being discharged into the upper Allegheny River and a corresponding decreasing trend in
observed Br- surface water concentrations 2009-2014 (Figure 7c; Figure Appendix B.7). But
despite the declining Allegheny River Br- concentration, a significant impact of ongoing CWTFs
operations to observed Br- concentrations during the high (2012 Q2) and low (2012 Q3) river
discharge sampling campaigns were observed at downstream PDW intakes in both the upper and
lower reaches of the river. On days with active CWTF effluent discharge the magnitude of Br-
enhancement at S05-PDW1 increased by an average of 39 ppb (53%) and 7 ppb (22%) for high
and low river discharge campaigns, respectively. The CWTF attributed Br- resulted in small
modeled increase in total THM (3%), but a substantial positive shift from chlorinated to more
toxic brominated THM analogs at both S05-PDW1 (41%) and S06-PDW2 (47%). The empirical
THM modeling results corroborate the States et al. (2013) and Parker et al., (2014) conclusion
that increased Br- concentrations in the Allegheny River attributable to CWTF wastewater
discharges water can substantially shift PDW total THM from chlorinated to more toxic
brominated analogs. However, the empirical THM modeling does not support the contention
that Br- attributed to CWTF discharges affects the overall trend of increasing THM
concentrations.
Suggestions for Future THM Monitoring/Modeling
While various sources of surface water and PDW analytical results are available in the public
domain (EPA STORET, PADEP DWRS), the fragmented nature both spatially and temporally
between open river and PDW sample collection as well as the lack of coincident THM, DOC,
water temperature, and pH data prevent a process level understanding behind the underlying
mechanisms for THM formation and the causality of the observed historical trends. Due to the
multivariate nature of DBP formation, the integration and coordination of the PDW and surface
water monitoring programs (e.g., sampling locations, time, analytes, parameters) is necessary to
provide a basis for evaluating/modeling THM production mechanisms, underlying system
dynamics, and understanding observed trends. For example the PADEP DWRS database
contains 141 raw intake and plant water TOC and 40 THM concentrations for the S05-PDW1
facility (January 6, 2004 through August 11, 2015) but only 15 of the THM concentrations have
matching TOC data and there are no matching DOC data. Likewise the PADEP DWRS database
contains 148 raw intake and plant water TOC and 58 THM concentrations for the S06-PDW2
facility (April 17, 2003 through August 20, 2015) but only 13 of the THM concentrations have
matching TOC data and there are no matching DOC data. In addition, there are no water
temperature or pH data in the PADEP DWRS database for these facilities. All future studies
should directly link THM empirical modeling input water measurement needs (water
temperature, pH, DOC, Br-), PDW operation conditions (chlorine target, contact time), with
actual resulting THM measurements.
Acknowledgements: The EPA through its Office of Research and Development funded and
conducted this research. The views expressed in this paper are those of the authors and do not
necessarily reflect the views or policies of EPA. It has been subjected to Agency review and
approved for publication. Mention of trade names or commercial products do not constitute an
endorsement or recommendation for use. We thank Ram Vedantham, Sania Tong-Argao, and
Clay Nelson (EPA ORD) for their assistance with data Quality Assurance; Todd Krantz and
Chris Impellitteri (EPA ORD), Angela McFadden, Louis Reynolds, Kelly Krock (EPA Region

3), Sam Garvey and Mike Wheeler (Alion) for their logistical assistance; and the CWTF and
PDW operators for voluntary access to their facilities.

List of Figures 1
Figure 1. Plot of Allegheny River sampling domain depicting the locations of sampling sites and 2 major source discharges. River distances downstream from S02-CWTF discharge are 3 noted in parentheses. 4
Figure 2. Plot depicting concurrent Onset in-river sonde high resolution (5 min) specific 5 conductivity observations demonstrating CWTF discharge plume transit time from site 6 S02-CWTF (sonde located 45 m downstream from discharge pipe; CWTF-P45) to site 7 S03-Downstream1 (black trace). Drop lines denote the median discharge time (S02-8 CWTF) and conductivity peak from each plume impact event (S03-Downstream1), 9 respectively. The difference between the drop lines represents the plume transit time. 10
Figure 3. Plot depicting transit time corrected Onset in-river sonde high resolution (5 min) 11 specific conductivity observations at CWTF-P45 and S03-Downstream1 during low 12 discharge regime demonstrating how Isco samples were categorized as CWTF 13 “discharge impacted” (Monday-Friday) and “non-impacted” (Saturday). Drop down 14 lines denote Isco sampling times (09:00 and 12:00 EST). 15
Figure 4. Comparison of Allegheny River low discharge regime S01-Upstream site paired 16 sample baseline subtracted (a) bromide, (b) chloride, (c) specific conductivity, and (d) 17 sulfate by site location and CWTF discharge impacted versus non-impacted time 18 periods. Dashed line indicates paired S01-Upstream “baseline” sample corrected unity 19 reference value. 20
Figure 5. Comparison of Allegheny River low discharge regime Cl-/Br- ratio by site location and 21 CWTF discharge impacted versus non-impacted categorized samples. Dashed line 22 indicates median “baseline” value at S01-Upstream site. S02-CWTF Cl-/Br- ratio for 23 the low discharge regime was 90.4 ± 2.4 (mean ± standard deviation). 24
Figure 6. Box model results for high (a) and low (b) flow regimes in the upper Allegheny River 25 study domain (Baseline includes mass from S01-Upstream, POTW, and CFPP). 26
Figure 7. Time series plots of S05-PDW1 quarterly mean (a) 2004 – 2014 rolling annual mean 27 THM concentration in finished drinking water in relation to the 80 ppb EPA standard, 28 (b) 2010 – 2014 significantly increasing THM concentration in finished drinking water 29 trend of ~ 6 ppb year-1, (c) 2010 – 2014 trends of bromide and total organic carbon 30 (trend is not significant at α = 0.05). The box delineates the two quarters during the 31 2012 EPA field sampling campaigns. 32
Figure 8. Time series plots of S05-PDW1 and S06-PDW2 monthly raw water TOC 33 concentrations with virtually identical significantly (p<0.0001) increasing trends from 34 2003 – 2015. 35
36

Figure 1. 37
38
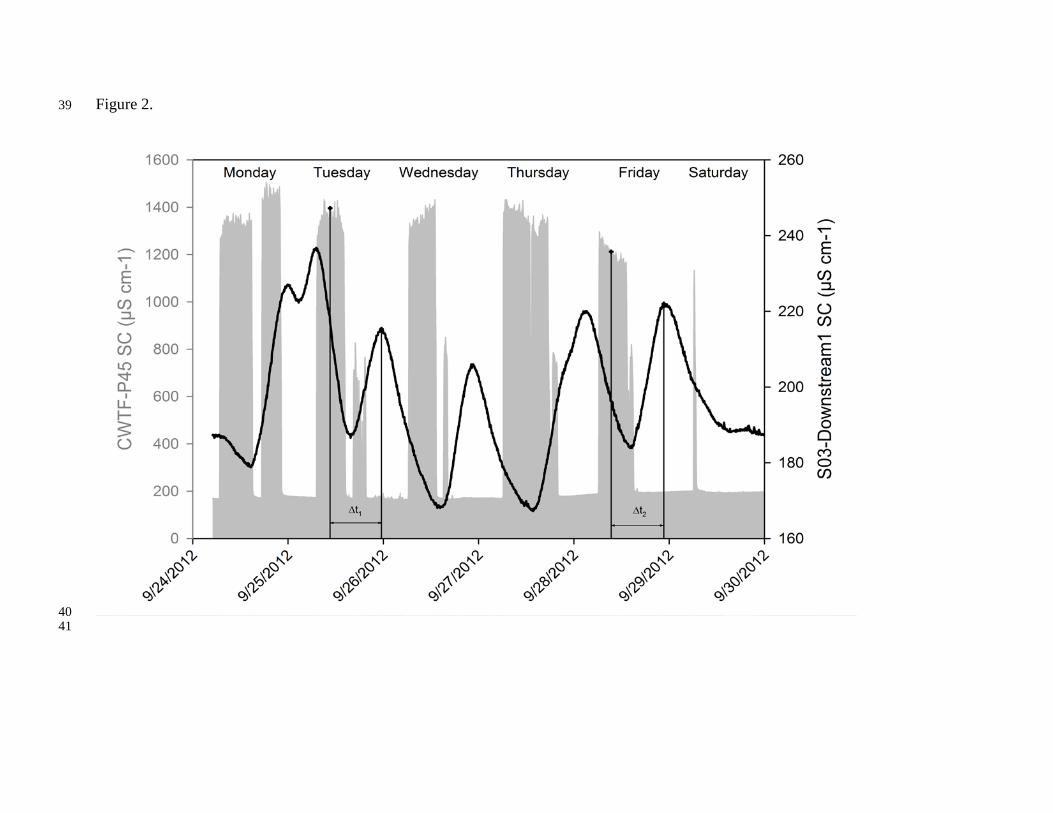
Figure 2. 39
40 41
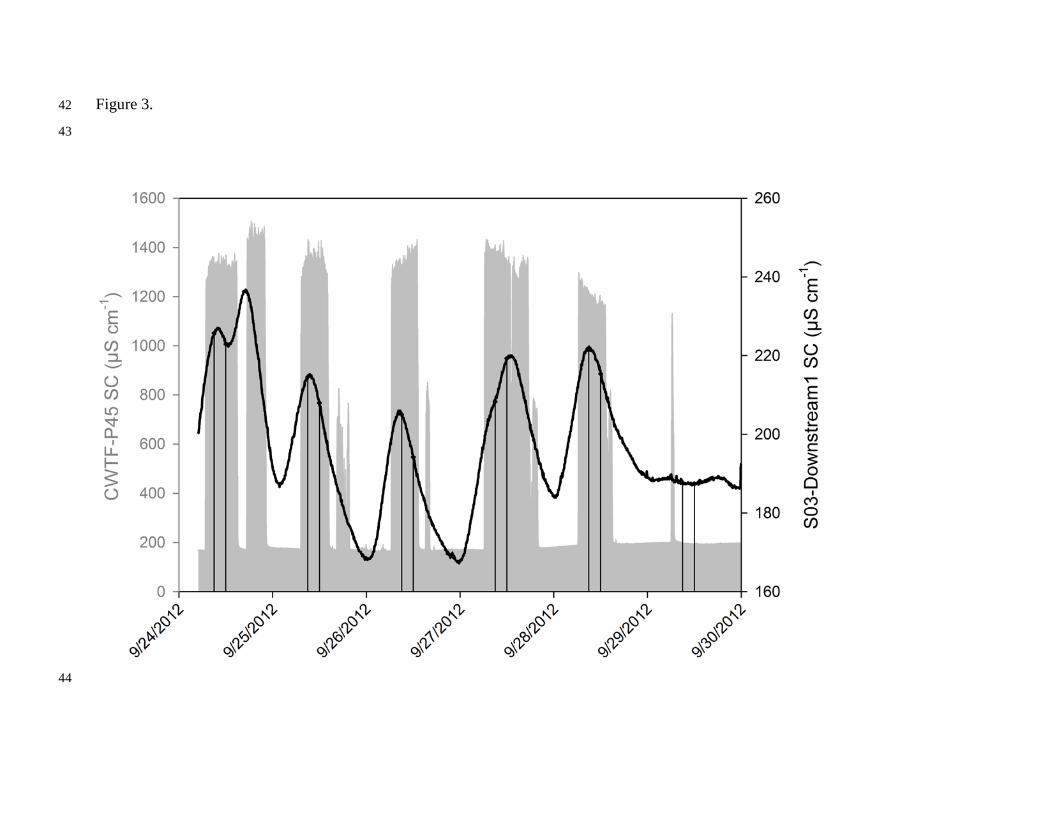
Figure 3. 42
43
44

Figure 4. 45
46

Figure 5. 47
48
S01 - Upstream S03 - Downstream 1~12 km
S04 - Downstream 2~44 km
S05 - PDW 1~52 km
ImpactedNon-impacted
Chl
orid
e/B
rom
ide
Rat
io
100
200
300
400
500
ImpactedNon-impacted ImpactedNon-impacted
S06 - PDW 2~150 km
49
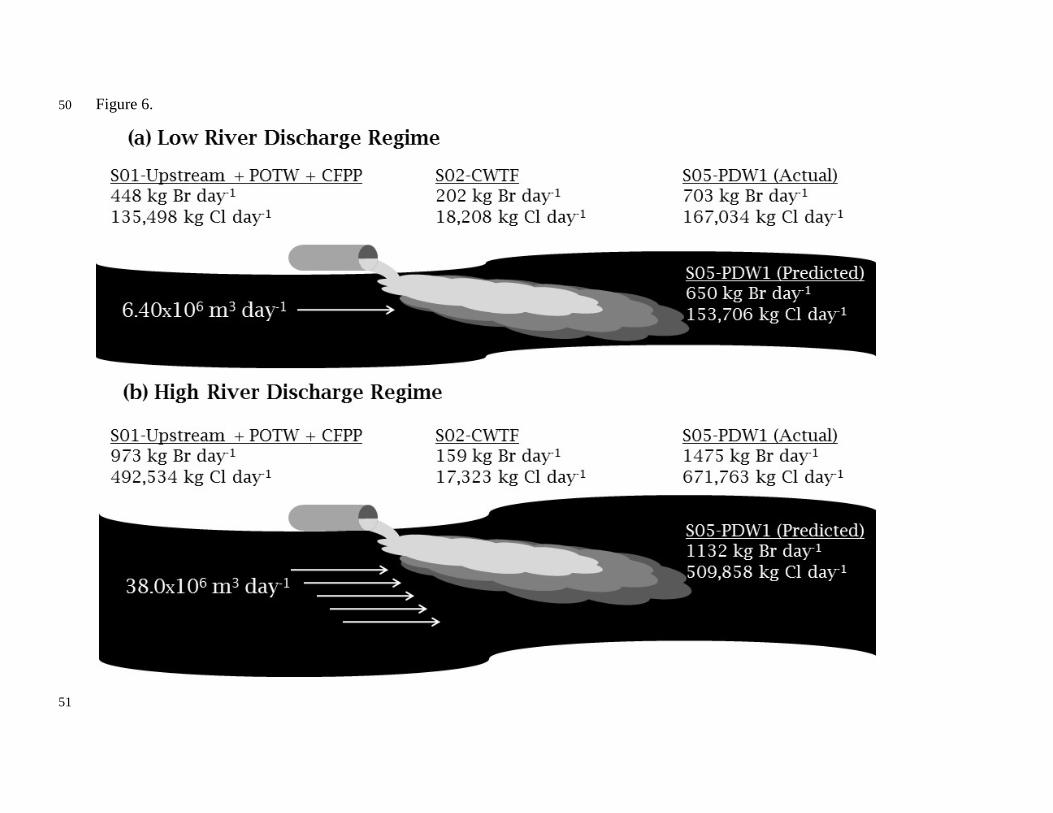
Figure 6. 50
51

Figure 7a. 52 53
2004
_Q1
2004
_Q2
2004
_Q3
2004
_Q4
2005
_Q1
2005
_Q2
2005
_Q3
2005
_Q4
2006
_Q1
2006
_Q2
2006
_Q3
2006
_Q4
2007
_Q1
2007
_Q2
2007
_Q3
2007
_Q4
2008
_Q1
2008
_Q2
2008
_Q3
2008
_Q4
2009
_Q1
2009
_Q2
2009
_Q3
2009
_Q4
2010
_Q1
2010
_Q2
2010
_Q3
2010
_Q4
2011
_Q1
2011
_Q2
2011
_Q3
2011
_Q4
2012
_Q1
2012
_Q2
2012
_Q3
2012
_Q4
2013
_Q1
2013
_Q2
2013
_Q3
2013
_Q4
2014
_Q1
2014
_Q2
2014
_Q3
2014
_Q4
Tota
l Trih
alom
etha
ne (p
pm)
0.00
0.02
0.04
0.06
0.08
0.10
0.12
0.14
0.16
0.18
Quarterly Average80ppb StarndardRolling Average
(a)
54 55
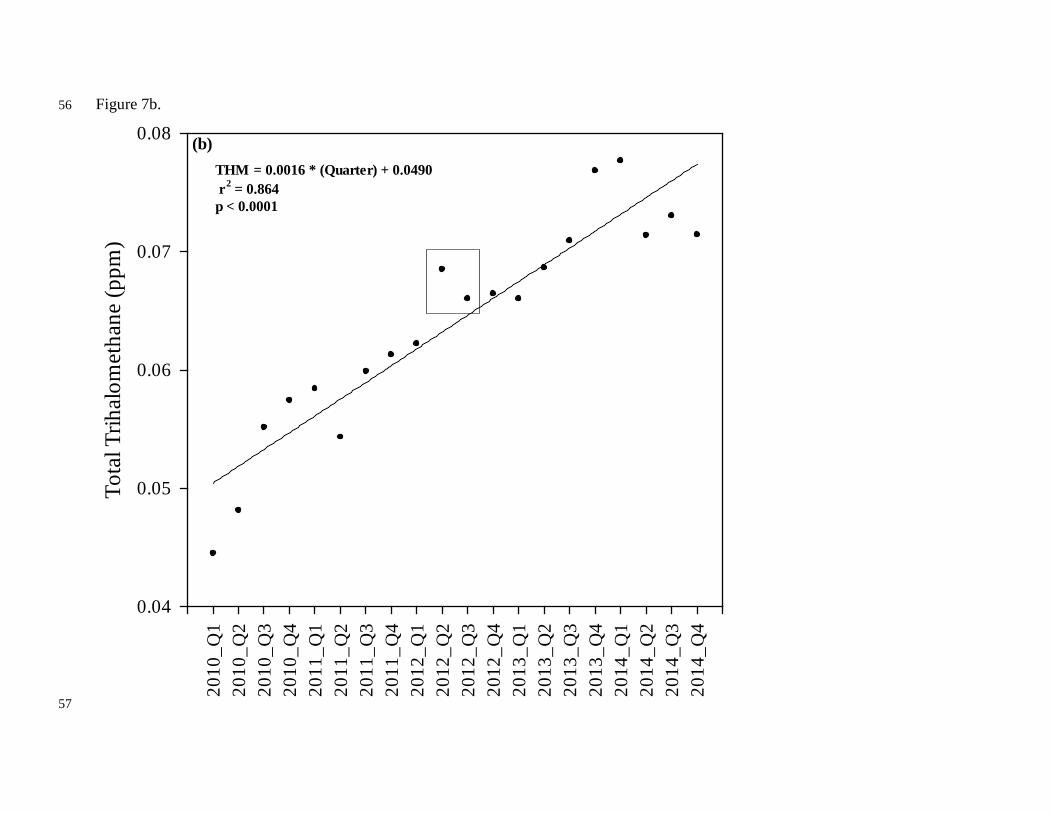
Figure 7b. 56
2010
_Q1
2010
_Q2
2010
_Q3
2010
_Q4
2011
_Q1
2011
_Q2
2011
_Q3
2011
_Q4
2012
_Q1
2012
_Q2
2012
_Q3
2012
_Q4
2013
_Q1
2013
_Q2
2013
_Q3
2013
_Q4
2014
_Q1
2014
_Q2
2014
_Q3
2014
_Q4
Tota
l Trih
alom
etha
ne (p
pm)
0.04
0.05
0.06
0.07
0.08
THM = 0.0016 * (Quarter) + 0.0490 r
2 = 0.864p < 0.0001
(b)
57

Figure 7c. 58
2009
Q4
2010
Q1
2010
Q2
2010
Q3
2010
Q4
2011
Q1
2011
Q2
2011
Q3
2011
Q4
2012
Q1
2012
Q2
2012
Q3
2012
Q4
2013
Q1
2013
Q2
2013
Q3
2013
Q4
2014
Q1
2014
Q2
2014
Q3
2014
Q4
Brom
ide
(ppb
)
0
50
100
150
200
250
300
TOC
(ppm
)
0.0
1.0
2.0
3.0
4.0
Bromide TOC
(c)Br- = -7.727 * (Quarter) + 165.3r2 = 0.474p = 0.0045
59

Figure 8. 60
2003
2004
2005
2006
2007
2008
2009
2010
2011
2012
2013
2014
2015
Tota
l Org
anic
Car
bon
(mg
L-1)
0
1
2
3 S05-PDW1S06-PDW2S05-PDW1 TrendS06-PDW2 Trend
S05-PDW1 TOC = 0.0002 * (Month) - 6.943r2 = 0.131p < 0.0001
S06-PDW2 TOC = 0.0002 * (Month) - 6.076r2 = 0.139p < 0.0001
61

Table 1. Summary of Allegheny River High (April 30 - May 14, 2012) and Low (July 5-19 & September 19-October 4, 2012) 62 Discharge Isco Sample Results (Kruskal Wallis Tests Indicate all Low Discharge Concentrations are Higher at all Sampling 63 Sites p < 0.0001). 64
65
66 67
S01-Upstream S03-Downstream1 S04-Downstream2 S05-PDW1 S06- PDW2
High Low High Low High Low High Low High Low
Spec. Cond. (µS cm-1)
n 15 31 14 31 13 30 15 26 15 28
Median 126 174 131 187 142 198 158 202 186 360 Mean 126 174 132 193 142 200 157 204 182 374
Range 116-143 150-194 112-154 154-262 127-157 168-243 144-171 177-250 152-215 271-608
Bromide (ppb)
n 15 31 13 30 13 30 12 26 15 28
Median 25 72 28 88 32 78 38 85 35 132 Mean 26 72 34 101 31 85 36 87 35 142
Range 22-36 33-117 19-56 37-277 20-36 38-154 27-41 39-166 26-44 103-202
Chloride (ppm)
n 15 31 14 31 13 30 15 26 15 28
Median 13.1 21.0 13.8 22.5 14.0 22.5 17.0 23.5 15.9 29.6 Mean 13.5 20.8 14.7 23.8 14.3 23.3 17.3 23.6 15.9 30.4
Range 12.4-16.2 16.2-25.8 12.3-19.2 16.6-41.3 12.8-16.6 17.3-31.3 15.6-18.7 17.6-32 13.1-21.9 24.5-37.3
Sulfate (ppm)
n 15 31 14 31 13 30 15 26 15 28
Median 10.3 7.5 11.9 8.3 11.6 8.9 11.1 9.5 27.0 83.2 Mean 10.7 7.5 11.3 8.4 11.5 9.0 11.3 9.6 28.7 82.0
Range 9.7-13.5 6.8-8.6 3.7-12.8 7.8-9.7 10.2-12.8 8-11.7 10.3-13.1 8.5-10.8 23.3-39.9 47.6-128.8

Table 2. Summary of Spring (April 30 - May 14, 2012) CWTF Discharge Categorized Paired Isco Sample Results for Inter-site 68 Analysis, and Kruskal Wallis Non-parametric Hypothesis Test Results (bold are significant). 69
70
CWTF Non-impacted CWTF Impacted CWTF Non-impacted CWTF Impacted CWTF Non-impacted CWTF Non-impacted
S01-Upstream
S03-Downstream1
S01-Upstream
S03-Downstream1
S01-Upstream
S04-Downstream2
S01-Upstream
S04-Downstream2
S01-Upstream
S05- PDW1
S01-Upstream
S05- PDW1
Spec. Cond.
(µS cm-1)
Paired n 7 7 6 7 7 7
Median 127 130 123 132 125 137 127 148 123 158 127 161
Mean 124 128 128 137 126 137 127 145 125 156 127 159
Range 116-131 112-137 116-143 122-154 118-138 127-151 116-143 130-157 118-138 144-166 116-143 148-171
p-Value 0.109 0.016 0.031 0.016 0.016 0.016
Bromide (ppb)
Paired n 6 7 6 7 4 7
Median 24 24 26 41 25 27 25 34 27 34 25 39
Mean 25 24 28 42 27 26 26 34 28 34 26 39
Range 22-30 19-28 24-36 26-56 22-36 20-32 23-32 32-36 23-36 28-39 23-32 36-41
p-Value 0.281 0.016 0.844 0.016 0.250 0.016
Chloride (ppm)
Paired n 7 7 6 7 7 7
Median 13.3 13.3 13 15.0 13.1 13.1 13.6 15.1 13 16.4 13.6 18
Mean 13.1 13.3 13.9 16.0 13.5 13.5 13.7 15.0 13.4 16.8 13.7 17.7
Range 12.6-13.6 12.3-13.9 12.4-16.2 13.6-19.2 12.4-16.2 12.8-15.8 12.6-16 13.2-16.6 12.4-16.2 15.6-18.4 12.6-16 16.8-18.7
p-Value 0.469 0.016 1.000 0.016 0.016 0.016
Sulfate (ppm)
Paired n 7 7 6 7 7 7
Median 10.1 11.9 10.3 11.9 10.9 11.5 9.9 11.6 10.6 11.1 9.9 11
Mean 10.5 10.7 10.4 11.9 11 11.7 10.5 11.4 10.9 11.3 10.5 11.3
Range 9.8-12.3 3.7-12.8 9.7-12.3 11.1-12.4 9.8-12.3 11.1-12.8 9.8-13.5 10.2-12 9.8-12.3 10.5-13.1 9.8-13.5 10.3-12.7
p-Value 0.375 0.031 0.313 0.156 0.813 0.109
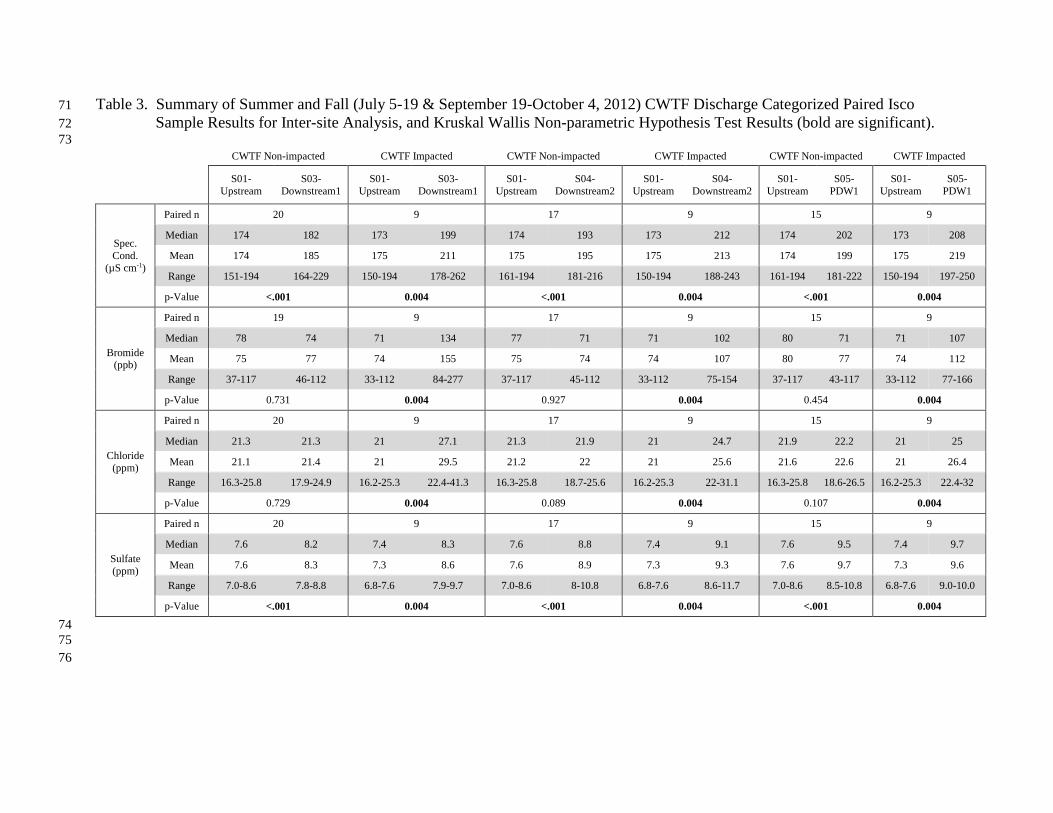
Table 3. Summary of Summer and Fall (July 5-19 & September 19-October 4, 2012) CWTF Discharge Categorized Paired Isco 71 Sample Results for Inter-site Analysis, and Kruskal Wallis Non-parametric Hypothesis Test Results (bold are significant). 72
73 CWTF Non-impacted CWTF Impacted CWTF Non-impacted CWTF Impacted CWTF Non-impacted CWTF Impacted
S01-Upstream
S03-Downstream1
S01-Upstream
S03-Downstream1
S01-Upstream
S04-Downstream2
S01-Upstream
S04-Downstream2
S01-Upstream
S05- PDW1
S01-Upstream
S05- PDW1
Spec. Cond.
(µS cm-1)
Paired n 20 9 17 9 15 9
Median 174 182 173 199 174 193 173 212 174 202 173 208
Mean 174 185 175 211 175 195 175 213 174 199 175 219
Range 151-194 164-229 150-194 178-262 161-194 181-216 150-194 188-243 161-194 181-222 150-194 197-250
p-Value <.001 0.004 <.001 0.004 <.001 0.004
Bromide (ppb)
Paired n 19 9 17 9 15 9
Median 78 74 71 134 77 71 71 102 80 71 71 107
Mean 75 77 74 155 75 74 74 107 80 77 74 112
Range 37-117 46-112 33-112 84-277 37-117 45-112 33-112 75-154 37-117 43-117 33-112 77-166
p-Value 0.731 0.004 0.927 0.004 0.454 0.004
Chloride (ppm)
Paired n 20 9 17 9 15 9
Median 21.3 21.3 21 27.1 21.3 21.9 21 24.7 21.9 22.2 21 25
Mean 21.1 21.4 21 29.5 21.2 22 21 25.6 21.6 22.6 21 26.4
Range 16.3-25.8 17.9-24.9 16.2-25.3 22.4-41.3 16.3-25.8 18.7-25.6 16.2-25.3 22-31.1 16.3-25.8 18.6-26.5 16.2-25.3 22.4-32
p-Value 0.729 0.004 0.089 0.004 0.107 0.004
Sulfate (ppm)
Paired n 20 9 17 9 15 9
Median 7.6 8.2 7.4 8.3 7.6 8.8 7.4 9.1 7.6 9.5 7.4 9.7
Mean 7.6 8.3 7.3 8.6 7.6 8.9 7.3 9.3 7.6 9.7 7.3 9.6
Range 7.0-8.6 7.8-8.8 6.8-7.6 7.9-9.7 7.0-8.6 8-10.8 6.8-7.6 8.6-11.7 7.0-8.6 8.5-10.8 6.8-7.6 9.0-10.0
p-Value <.001 0.004 <.001 0.004 <.001 0.004
74 75 76

Table 4. Summary of all Isco Sample Analysis at Downstream Sites S03-Downstream1 to S05-PDW1 Categorized as either CWTF 77 Discharge or Non-Discharge Impacted, and Intra-site Analysis Results for those Species found to be Significantly Higher 78 when being Impacted by the CWTF Discharge. 79
80 81
High River Discharge
Low River Discharge
Species Site CWTF
Non-impacted CWTF
Impacted One-Sided t Approx.
CWTF Contribution
CWTF Non-impacted
CWTF Impacted
One-Sided t Approx.
CWTF Contribution
S03-Downstream1 Total n 7 7
0.19 21 10 <0.01
Mean ± SD 128 ± 8 137 ± 12 184 ± 16 212 ± 28 28 (15%)
Spec. Cond. S04-Downstream2 Total n 6 7
0.12 19 11 <0.01
(µS cm-1) Mean ± SD 137 ± 9 145 ± 10 192 ± 12 215 ± 20 23 (12%)
S05-PDW1 Total n 8 7
0.17 17 9 0.01
Mean ± SD 156 ± 7 159 ± 9 196 ± 13 219 ± 23 23 (12%)
S03-Downstream1 Total n 6 7
0.01 20 10
<0.01
Mean ± SD 24 ± 4 42 ± 11 18 (75%) 75 ± 20 154 ± 64 79 (105%)
Bromide S04-Downstream2 Total n 6 7
<0.01 19 11 <0.01
(ppb) Mean ± SD 26 ± 6 34 ± 1 8 (31%) 71 ± 20 110 ± 30 39 (55%)
S05-PDW1 Total n 5 7
0.05 17 9 <0.01
Mean ± SD 32 ± 5 39 ± 2 7 (22%) 73 ± 23 112 ± 32 39 (53%)
S03-Downstream1 Total n 7 7
0.02 21 10 <0.01
Mean ± SD 13.3 ± 0.6 16.0 ± 2.4 2.7 (20%) 21.1 ± 2.4 29.5 ± 6.1 8.4 (40%)
Chloride S04-Downstream2 Total n 6 7
0.03 19 11 <0.01
(ppm) Mean ± SD 13.5 ± 1.2 15.0 ± 1.2 1.5 (11%) 21.6 ± 2.3 26.1 ± 3.4 4.5 (21%)
S05-PDW1 Total n 8 7
0.04 17 9 <0.01
Mean ± SD 16.8 ± 1.0 17.7 ± 0.7 0.9 (5%) 22.1 ± 2.6 26.4 ± 3.5 4.3 (19%)
S03-Downstream1 Total n 7 7
0.48 21 10
0.15
Mean ± SD 10.7 ± 3.2 11.9 ± 0.5 8.3 ± 0.4 8.6 ± 0.6
Sulfate S04-Downstream2 Total n 6 7
0.36 19 11
0.11
(ppm) Mean ± SD 11.7 ± 0.6 11.4 ± 0.6 8.9 ± 0.6 9.2 ± 0.9
S05-PDW1 Total n 8 7
0.33 17 9
0.39
Mean ± SD 11.3 ± 0.9 11.3 ± 1.0 9.7 ± 0.7 9.6 ± 0.4
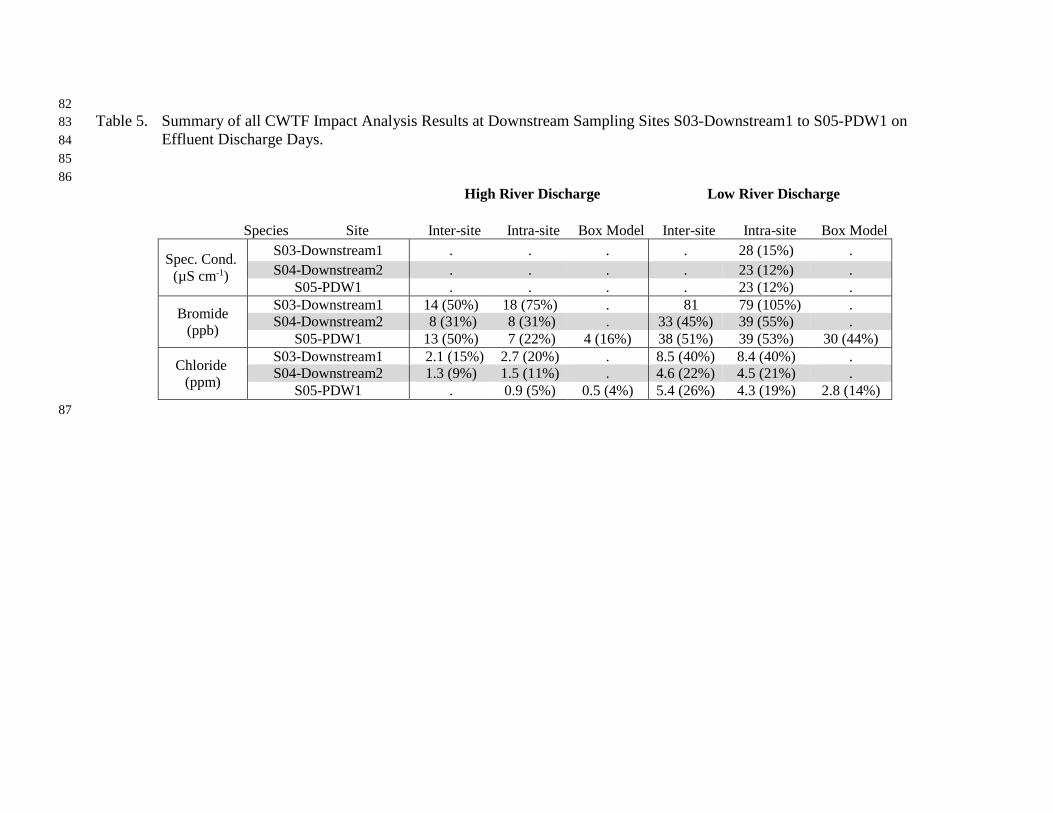
82 Table 5. Summary of all CWTF Impact Analysis Results at Downstream Sampling Sites S03-Downstream1 to S05-PDW1 on 83
Effluent Discharge Days. 84 85 86
High River Discharge
Low River Discharge
Species Site Inter-site Intra-site Box Model Inter-site Intra-site Box Model
Spec. Cond. (µS cm-1)
S03-Downstream1 . . . . 28 (15%) . S04-Downstream2 . . . . 23 (12%) .
S05-PDW1 . . . . 23 (12%) .
Bromide (ppb)
S03-Downstream1 14 (50%) 18 (75%) . 81
79 (105%) . S04-Downstream2 8 (31%) 8 (31%) . 33 (45%) 39 (55%) .
S05-PDW1 13 (50%) 7 (22%) 4 (16%) 38 (51%) 39 (53%) 30 (44%)
Chloride (ppm)
S03-Downstream1 2.1 (15%) 2.7 (20%) . 8.5 (40%) 8.4 (40%) . S04-Downstream2 1.3 (9%) 1.5 (11%) . 4.6 (22%) 4.5 (21%) .
S05-PDW1 . 0.9 (5%) 0.5 (4%) 5.4 (26%) 4.3 (19%) 2.8 (14%) 87

Alcala, F. J.; Custodio, E. Using the Cl/Br ratio as a tracer to identify the origin of salinity in 88 aquifers in Spain and Portugal. Journal of Hydrology, 2008, 359, 189-207. 89
Brown, D.; Bridgeman, J.; West, J.R. Predicting chlorine decay and THM formation in water 90 supply systems. Environ Sci Biotechnol, 2011, 10, 79-99. 91
Cantor, K.P.; Villanueva, C.M.; Silverman, D.T.; Figueroa, J.D.; Real, F.X.; Garcia-Closas, M. 92 Polymorphisms in GSTT1, GSTZ1, and CYP2E1, disinfection by-products, and risk of 93 bladder cancer in Spain. Environ Health Perspect, 2010, 118, 1545-1550. 94
Chowdhury, S.; Champagne, P.; McLellan, P.J. Models for predicting disinfection byproduct 95 (DBP) formation in drinking waters: A chronological review. Science of the Total 96 Environment, 2009, 407, 4189-4206. 97
Cowman, G.A.; Singer, P.C. Effect of bromide ion on halo acetic acid speciation resulting from 98 chlorination and chloramination of aquatic humic substances. Environ. Sci. Technol. 1996, 99 30, 16-24. 100
Davis, S N.; Whittemore, D. O.; Fabryka-Martin, J. Uses of chloride/bromide ratios in studies of 101 potable water. Groundwater, 1998, 36, 338-350. 102
Dresel, P.; Rose, A. Chemistry and Origin of Oil and Gas Well Brines in Western Pennsylvania: 103 Pennsylvania Geological Survey; Pennsylvania Department of Conservation and Natural 104 Resources, 2010. 105
Ferrar, K. J.; Michanowicz, D. R.; Christen, C. L.; Mulcahy, N.; Malone, S. L.; Sharma, R. K. 106 Assessment of effluent contaminants from three facilities discharging Marcellus Shale 107 wastewater to surface waters in Pennsylvania. Environ. Sci. Technol. 2013, 47, 3472-3481. 108
Font-Ribera, L.; Kogevinas, M; Zock, J-P.; Gomez, F.P.; Barreiro, E.; Nieuwenhuijsen, N.J. 109 Short-term changes in respiratory biomarkers after swimming in a chlorinated pool. 110 Environ Health Perspect, 2010, 118, 1538-1544. 111
Freeman, J. T. The use of bromide and chloride mass ratios to differentiate salt-dissolution and 112 formation brines in shallow groundwater of the Western Canadian Sedimentary Basin. 113 Hydrogeology Journal, 2007, 15, 1377-1385. 114
Gregory, K. B.; Vidic, R. D.; Dzombak, D. A. Water Management challenges associated with the 115 production of shale gas by hydraulic fracturing. Elements, 2011, 7, 181-186. 116
Haluszczak, L. O.; Rose, A. W.; Kump, L. R. Geochemical evaluation of flowback brine from 117 Marcellus gas wells in Pennsylvania, USA. Appl. Geochem. 2013, 28, 55-61. 118
Hopke, P. K., An introduction to receptor modeling. Chemometr. Intell. Lab. 1991, 10, (1), 21-119 43. 120
Kargbo, D. M.; Wilhelm, R. G.; Campbell, D. J. Natural gas plays in the Marcellus Shale: 121 challenges and potential opportunities. Environ. Sci. Technol. 2010, 44, 5679-5684. 122
Kogevinas, M.; Villanueva, C.M., Font-Ribera, L.; Liviac, D.; Bustamante, M.; Espinoza, F. 123 Genotoxic effects in swimmers exposed to disinfection by-products in indoor swimming 124 pools. Environ Health Perspect, 2010, 118, 1531-1537. 125
Kosanke, R. M. Palynology of Selected Coal Beds in the Proposed Pennsylvanian System 126 Stratotype in West Virginia, Unites States Geological Survey, Professional Paper 1318, 127

1984, Washington, D.C. http://pubs.usgs.gov/pp/1455/report.pdf. Last accessed March 10, 128 2014. 129
Kunkel, U.; Radke, M. Reactive tracer test to evaluate the fate of pharmaceuticals in rivers. 130 Environ. Sci. Technol. 2011, 45, 6296-6302. 131
Landis, M. S.; Keeler, G. J. Critical evaluation of a modified automatic wet-only precipitation 132 collector for mercury and trace element determinations. Environ. Sci. Technol. 1997, 31, 133 2610-2615. 134
Landis, M. S.; Vette, A. F.; Keeler G. J. Atmospheric mercury in the Lake Michigan basin: 135 influence of the Chicago/Gary urban area. Environ. Sci. Technol. 2002, 36, 4508-4517. 136
Lutz, B. D.; Lewis, A. N.; Doyle, M. W. Generation, transport, and disposal of wastewater 137 associated with Marcellus Shale gas development. Water Resources Research, 2013, 49, 138 647-656. 139
McTigue, N.E.; Cornwell, D.A.; Graf, K.; Brown, R. Occurrence and consequences of increased 140 bromide in drinking water sources. Journal of the American Water Works Association 2014, 141 106(11), E492-E508. 142
Parker, K.M.; Zeng, T.; Harkness, J.; Vengosh, A.; Mitch, W.A. Enhanced formation of 143 disinfection byproducts in shale gas wastewater-impacted drinking water supplies. Environ. 144 Sci. Technol. 2014, 48, 11161-11169. 145
Pennsylvania Department of Conservation and Natural Resources, 146 http://www.dcnr.state.pa.us/topogeo/econresource/oilandgas/marcellus/index.htm. Last 147 accessed October 14, 2015. 148
Pennsylvania Department of Environmental Protection Drinking Water Reporting System 149 (DWRS). http://www.drinkingwater.state.pa.us/dwrs/HTM/Welcome.html. Last accessed 150 October 14, 2015. 151
Pennsylvania Department of Environmental Protection. 2002 Pennsylvania Water Quality 152 Assessment 305(b) Report, Harrisburg, PA, 2002. 153
Pennsylvania Department of Environmental Protection, 154 http://www.portal.state.pa.us/portal/server.pt/community/newsroom/14287?id=17071&typei155 d=1. Last accessed October 14, 2015. 156
Pennsylvania Fish and Boat Commission. 2011. Three Rivers Management Plan – A Strategy 157 for Managing Fisheries Resources of the Allegheny, Monongahela, and Ohio Rivers. 158 http://www.fish.state.pa.us/water/rivers/threerivers/ThreeRiversMgmtPlan.pdf. Last 159 accessed October 14, 2015. 160
Pennsylvania Geological Survey, http://www.pairis.state.pa.us. Last accessed October 14, 2015. 161
Plewa, M. J.; Kargalioglu, Y.; Vankerk, D.; Minear, R. A.; Wagner, E. D. Mammalian cell 162 cytotoxicity and genotoxicity analysis of drinking water disinfection by-products. Environ. 163 Mol. Mutagen. 2002, 40 (2), 134−142. 164
Richardson, S.D.; Plewa, M.J.; Wagner, E.D.; Schoeny, R.; DeMarini, D.M. Occurrence, 165 genotoxicity, and carcinogenicity of regulated and emerging disinfection by-products in 166 drinking water: A review and roadmap for research. Mutation Research, 2007, 636, 178-167 242. 168
Richardson, S.D.; DeMarini, D.M.; Kogevinas, M.; Fernandez, P; Marco, E.; Lourencetti, C. 169 What’s in the pool? A comprehensive identification of disinfection by-products and 170 assessment of mutagenicity of chlorinated and brominated swimming pool water. Environ 171 Health Perspect, 2010, 118, 1523-1530. 172
Sadiq, R.; Rodriguez, M.J. Disinfection by-products (DBPs) in drinking water and predictive 173 models for their occurrence: a review. Science of the Total Environment, 2004, 321, 21-46. 174
Schofield, C. L., Historical fisheries changes in the United States related to decreases in surface 175 water pH. In Acid Rain/Fisheries; Johnson, R. E., Ed.; American Fisheries Society, 176 Northeastern Division: Bethesda, MD, 1982; pp 57−67. 177
Seere, S. D.; Lee, C. W. Evaluation of the Impact of Chlorine on Mercury Oxidation in a Pilot-178 Scale Coal Combustor – the Effect of Coal Blending, United States Environmental 179 Protection Agency, Office of Research and Development, EPA/600/R-09/021, 2009, 180 Washington, D.C. http://nepis.epa.gov/Adobe/PDF/P10077UW.pdf. Last accessed March 181 10, 2014. 182
Smart, P.L.; Laidlaw, I.M.S. An evaluation of some fluorescent dyes for water tracing. Water 183 Resources Research, 1977, 13, 15-33. 184
Solarik, G.; Summers, R.S.; Sohn, J.; Swanson, W.J.; Chowdhury, Z.K.; Amy, G.L. Extensions 185 and Verification of the Water Treatment Plant Model for Disinfection By-Product 186 Formation. Natural Organic Matter and Disinfection By-Products, American Chemical 187 Society. 2000, 761, 47-66. 188
States, S.; Cyprych, G.; Stoner, M.; Wydra, F.; Kuchta, J.; Monnell, J.; Casson, L. Marcellus 189 Shale drilling and brominated THMs in Pittsburgh, Pa., drinking water. Journal of the 190 American Water Works Association 2013, 105(8), E432-E448. 191
Symons, J.M.; Krasner, S.W.; Simms, L.A.; Sclimenti, M. Measurement of THM and precursor 192 concentrations revisited: The effect of bromide ion. J. Am. Water Works Assoc. 1993, 85, 193 51-62. 194
U. S. Army Corps of Engineers. 195 http://www.lrp.usace.army.mil/Missions/WaterManagement.aspx. Last accessed March 10, 196 2014. 197
U. S. Energy Information Administration, FGD Scrubber Installations, 198 http://www.eia.gov/todayinenergy/detail.cfm?id=15611. Last accessed October 14, 2015. 199
U. S. Energy Information Administration, Natural Gas Wells in Pennsylvania, 200 http://www.eia.gov/dnav/ng/hist/na1170_spa_8a.htm. Last accessed October 14, 2015. 201
U.S. Environmental Protection Agency. Sources Contributing Inorganic Species to Drinking 202 Water Intakes during Low Flow Conditions on the Allegheny River in Western 203 Pennsylvania. Office of Research and Development, EPA/600/R-14/430, May 2015, 204 Washington, D.C. 205
U.S. Environmental Protection Agency Storage and Retrieval (STORET) Data Warehouse 206 repository for water quality, biological, and physical data. http://www.epa.gov/storet/. Last 207 accessed October 14, 2015. 208
U.S. Environmental Protection Agency. Empirically based models for predicting chlorination 209
and ozonation by-products: Trihalomethanes, haloacetic acids, chloral hydrate and bromate. 210 Office of Water Report 815-R-98-005, 1998. 211
U.S. Environmental Protection Agency. Clean Air Act Amendments of 1990. (104 Stat. 2468, 212 P.L. 101-549). 213
U.S. Environmental Protection Agency, Office of Research and Development, Method 300.1 214 Determination of Inorganic Anions in Drinking Water by Ion Chromatography, 1997. 215 http://water.epa.gov/scitech/drinkingwater/labcert/upload/met300.pdf. Last accessed 216 October 14, 2015. 217
U.S. Environmental Protection Agency. National Primary Drinking Water Regulations: 218 Disinfectants and Disinfection Byproducts; Final Rule. Fed. Regist. 1998, 63, 69390-69476. 219
U.S. Environmental Protection Agency. National Primary Drinking Water Regulations: Stage 2 220 Disinfectants and Disinfection Byproducts; Final Rule. Fed. Regist. 2006, 71, 388-493. 221
U.S. Environmental Protection Agency, EPA Positive Matrix Factorization Software and User 222 Guide. http://www.epa.gov/heasd/research/pmf.html, 2014. 223
U.S. Geological Survey, 1993. National Water Summary 1990-1991: Hydrologic Events and 224 Stream Water Quality, p81-83. http://pubs.usgs.gov/wsp/2400/report.pdf. . Last accessed 225 October 14, 2015. 226
U.S. Geological Survey, 2013, Water-resources data for the United States, Water Year 2012: 227 U.S. Geological Survey Water-Data Report WDR-US-2012, site 03025500, 228 http://wdr.water.usgs.gov/wy2012/pdfs/03025500.2012.pdf. Last accessed October 14, 229 2015. 230
U.S. Geological Survey National Water Information System. 231 http://nwis.waterdata.usgs.gov/usa/nwis/uv/?cb_00065=on&cb_00060=on&cb_00010=on&232 cb_00095=on&cb_00400=on&cb_00300=on&format=gif_default&begin_date=2012-04-233 23&end_date=2012-05-10&site_no=03025500. Last accessed October 14, 2015. 234
Uyak, V.; Toroz, I. Investigation of bromide ion effects on disinfection by-products formation 235 and speciation in an Istanbul water supply. J. Hazard. Mater, 2007, 149, 445-451. 236
Veil J. Water Management Technologies Used by Marcellus Shale Gas Producers; prepared for 237 U.S. Department of Energy Office of Fossil Fuel Energy, National Energy Technology 238 Laboratory, July 2010. 239 https://fracfocus.org/sites/default/files/publications/water_management_in_the_marcellus.pd240 f. Last accessed October 14, 2015. 241
Vengosh, A.; Jackson, R.B.; Warner, N.; Darrah, T.H.; Kondash A. A critical review of the risks 242 to water resources from unconventional shale gas development and hydraulic fracturing in 243 the United States. Environmental Science and Technology, 2014, 48, 8334-8348. 244
Vidic, R. D.; Brantley, S.L.; Vandenbossche, J. M.; Yoxtheimer, D.; Abad, J. D. Impact of shale 245 gas development on regional water quality. Science, 2013, 340, 1235009. 246
Warner, N. R.; Christie, C. A.; Jackson, R. B.; Vengosh, A. Impacts of shale gas wastewater 247 disposal on water quality in western Pennsylvania. Environ. Sci. Technol. 2013, 47, 11849-248 11857. 249
Wilson, J. M.; VanBriesen, J. M. Oil and gas produced water management and surface drinking 250 water sources in Pennsylvania. Environmental Practice, 2012, 14, 288-300. 251
Wilson, J. M.; VanBriesen, J. M. Source water changes and energy extraction activities in the 252 Monongahela river, 2009-2012. Environ. Sci. Technol. 2013, 47, 12575-12582. 253
World Health Organization. Disinfectants and Disinfectant Byproducts, Environmental Health 254 Criteria 216. International Programme on Chemical Safety, Geneva, 2000. 255
Zhai, H.; Zhang, X. Formation and decomposition of new and unknown polar brominated 256 disinfection byproducts during chlorination. Environ. Sci. Technol. 2011, 45, 2194-2201. 257


