The impact of combined assimilation of altimeters … impact of combined assimilation of altimeters...
27
The impact of combined assimilation of altimeters data and wave spectra from S-1A and 1B in the operational model MFWAM Lotfi Aouf and Alice Dalphinet Météo-France, Département Marine et Oceanographie (DirOP/MAR) 1st International Workshop on Waves, Storm Surge and Coastal Hazards, 10-15 September, Liverpool
Transcript of The impact of combined assimilation of altimeters … impact of combined assimilation of altimeters...
The impact of combined assimilation of altimeters data and wave spectra from S-1A and 1B in the
operational model MFWAM
Lotfi Aouf and Alice Dalphinet Météo-France,
Département Marine et Oceanographie (DirOP/MAR)
1st International Workshop on Waves, Storm Surge and Coastal Hazards, 10-15 September, Liverpool

OUTLINE
1- Motivation 2- The system and satllite data 3- Results and validation with independent data
– Story of bias – Re-localization
4- Storm cases 5- Conclusions
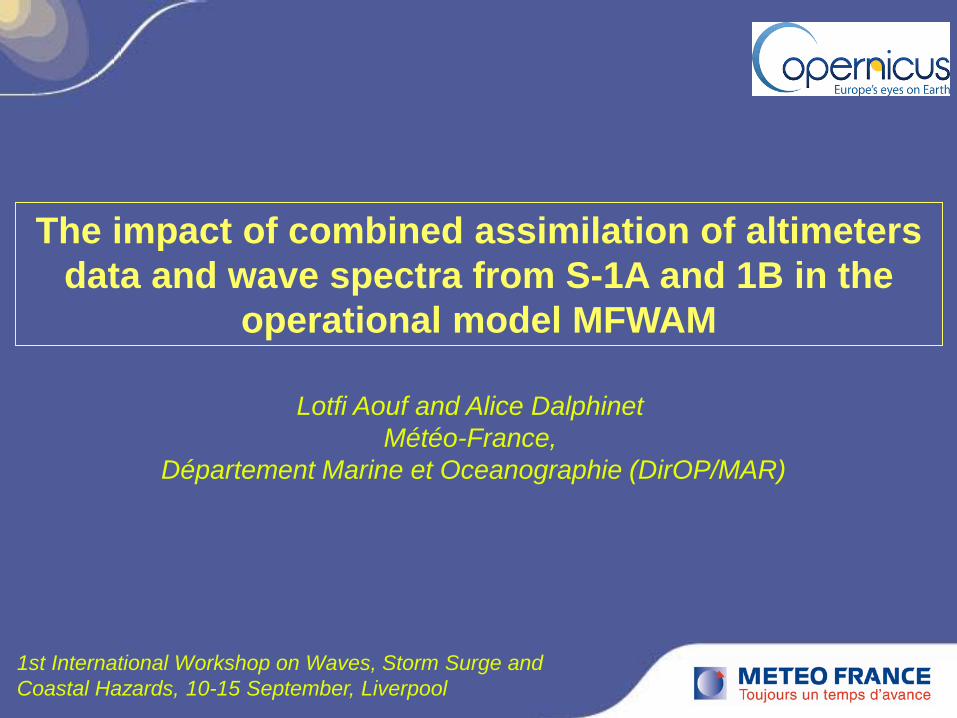
Highest level ov waves submersion warning (Violet) For Hurricane IRMA
12 meters of waves near Saint Martin from the coastal model forecast

MOTIVATION
Improving the wave forecast and in particular directional properties in the operational MFWAM at global and regional scale : reliable wave submersion warning (VVS) Preparing the assimilation of satellite data in the frame of CMEMS-Global (design V4 : end of 2017) : Sentinel-1 and Sentinel-3 copernicus missions Assessing the impact of using altimeters and SAR wave spectra (S-1A & 1B) and evaluating the impact of SAR mode altimetry from S-3A

Global wave model MFWAM (0.2°) forced by ECMWF winds. MFWAM is based on IFS-38R2 code with the source terms developed in Ardhuin et al (2010) and setting from Mywave project. In operations assimilation 6 hours: Jason-2 (safe-mode) SARAL since 10 December 2013 Cryosat-2 since 23 April 2014 Jason-3 since October 2016
The global wave forecasting MFWAM
SWH 26 June 2017 at 12;00UTC
SI of SWH (%)
JCOMM Intercomparison With buoys April 2017

Spectral resolution of 60 frequencies and 72 directions : QC implemented
Daily coverage altimeters wave data and SAR wave spectra from S-1A and 1B
S1A and S1B daily orbit tracks
couverture journalière en données altimétriques (Jason-2 & 3, Cryosat-2, Saral et S-3A)
~5000 SAR spectra Daily

Assimilation of altimeters OI on SWH
Correction of the wave Spectrum (mostly wind sea)
Assimilation of spectra (S-1A, S-1B) partitionning
OI on mean parameters Analysed spectra
Model MFWAM first-guess
Model MFWAM Analysis
Description of combined assimilation system
QC stable for operations SAR spectra
Altimeters

Assimilation experiments
The model MFWAM with grid size of 0.5° and the wave spectrum in 24 directions and 30 frequencies (starting 0.035Hz). The model MFWAM is driven by 6-hourly 3-day forecast ECMWF winds). Focus on two seasons : Sep-Oct-Nov-Dec 2016
May-June-Jul 2017 Performed runs : - runs with combined assimilation Altimeters + SAR spectra from S-1A and S-1B - run with S3A altimeters and SAR spectra from S-1A and S-1B - Baseline run without assimilation The validation of results has been performed with alimeters wave heights (not assimilated) and buoys.
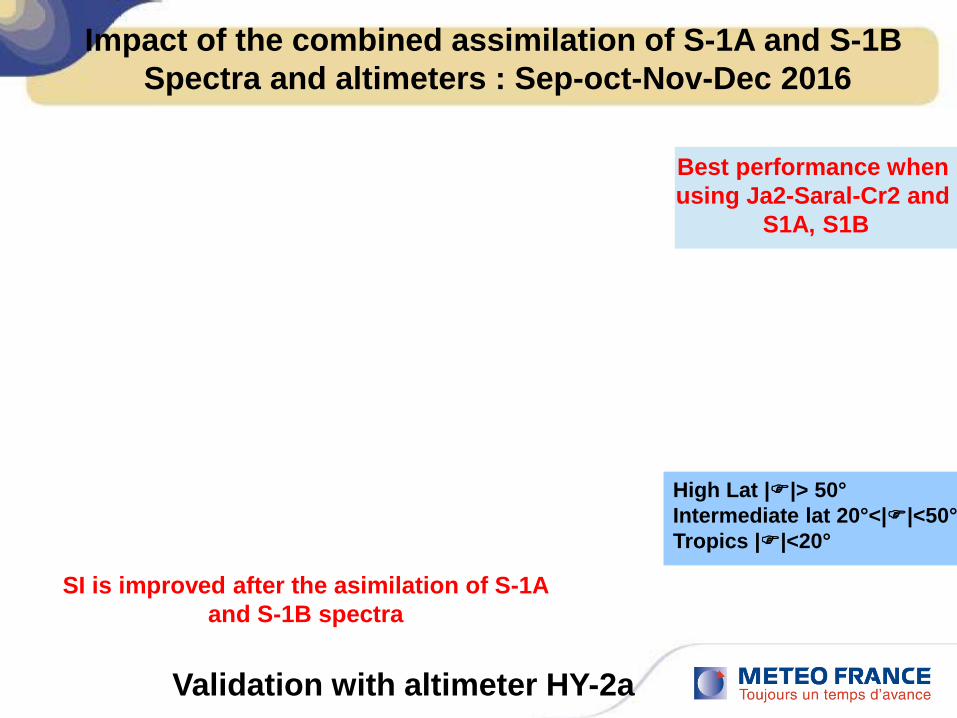
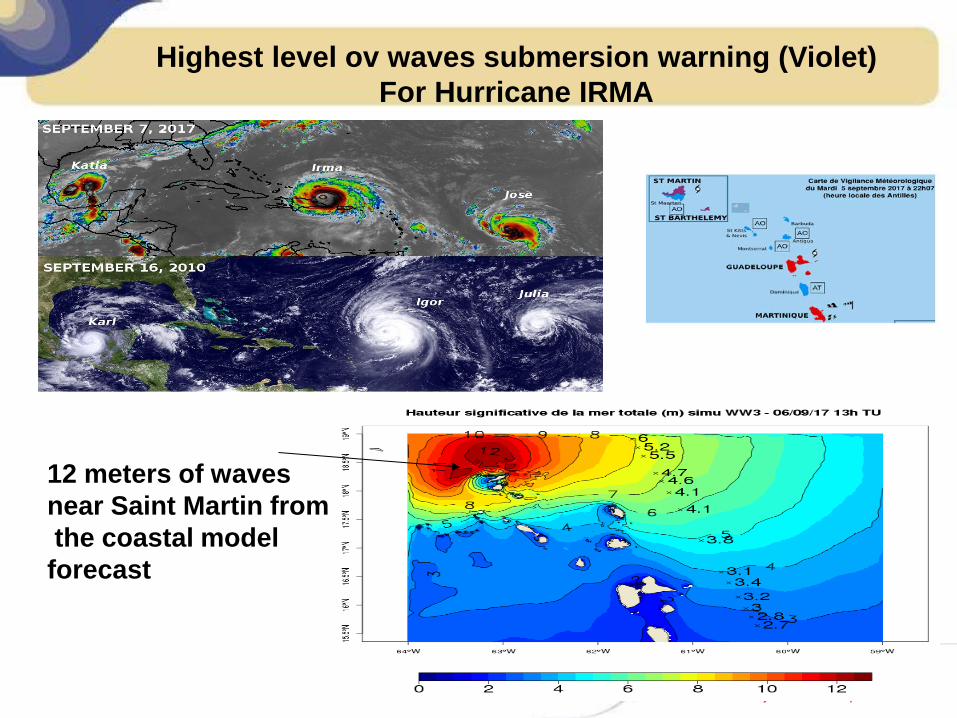
Validation with altimeter HY-2a
High Lat ||> 50° Intermediate lat 20°<||<50° Tropics ||<20°
Best performance when using Ja2-Saral-Cr2 and
S1A, S1B
Impact of the combined assimilation of S-1A and S-1B Spectra and altimeters : Sep-oct-Nov-Dec 2016
SI is improved after the asimilation of S-1A and S-1B spectra
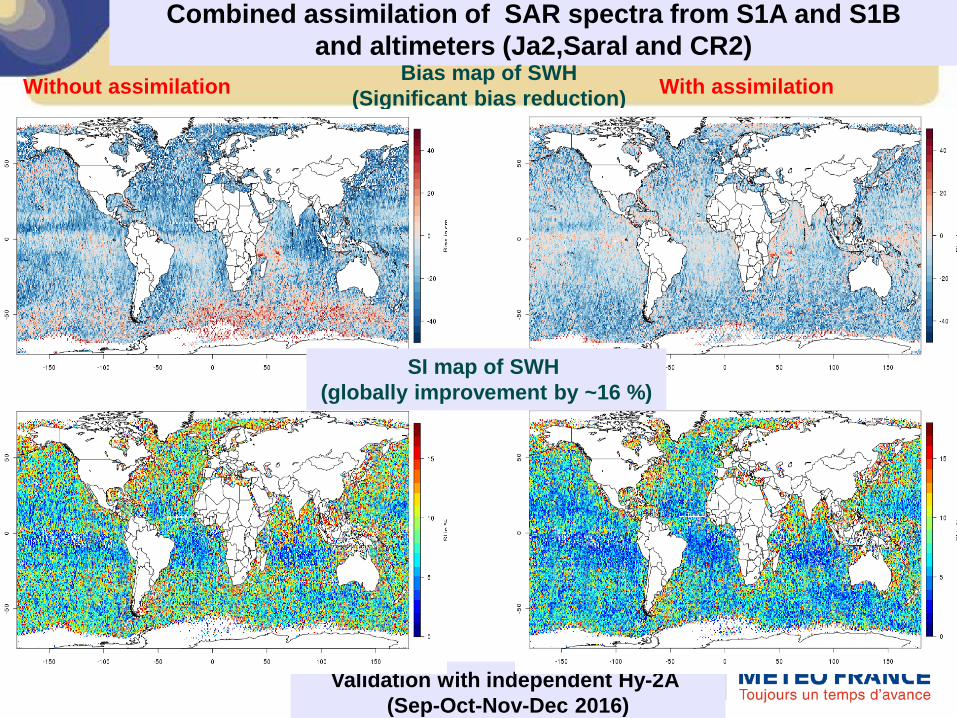
Combined assimilation of SAR spectra from S1A and S1B and altimeters (Ja2,Saral and CR2)
Without assimilation With assimilation Bias map of SWH (Significant bias reduction)
Validation with independent Hy-2A (Sep-Oct-Nov-Dec 2016)
SI map of SWH (globally improvement by ~16 %)
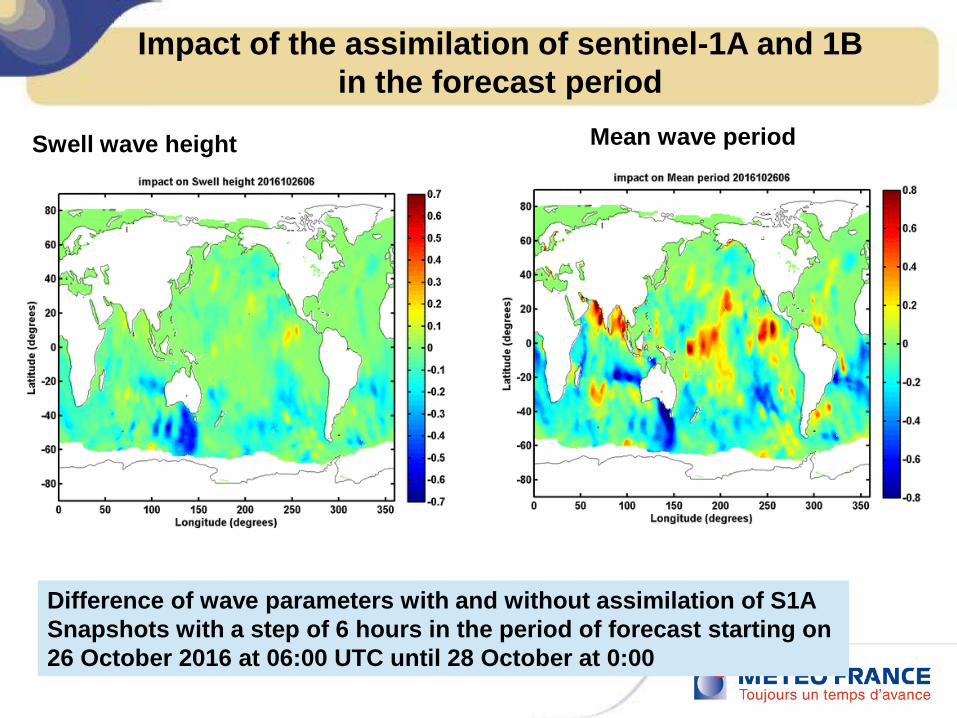
Impact of the assimilation of sentinel-1A and 1B in the forecast period
Difference of wave parameters with and without assimilation of S1A Snapshots with a step of 6 hours in the period of forecast starting on 26 October 2016 at 06:00 UTC until 28 October at 0:00
Swell wave height Mean wave period
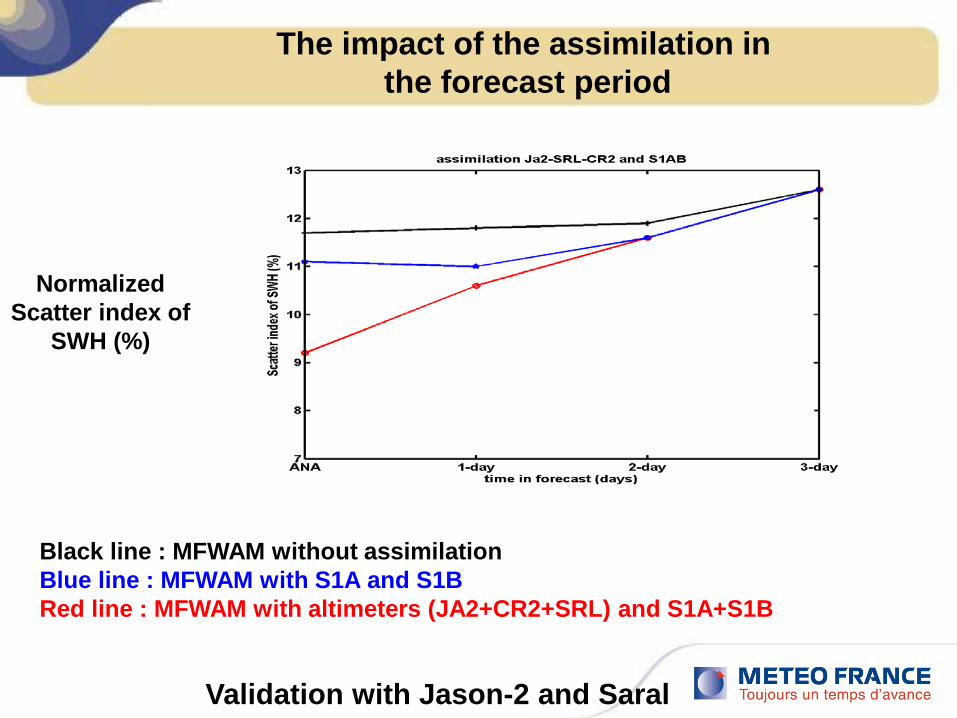
The impact of the assimilation in the forecast period
Validation with Jason-2 and Saral
Normalized Scatter index of
SWH (%)
Black line : MFWAM without assimilation Blue line : MFWAM with S1A and S1B Red line : MFWAM with altimeters (JA2+CR2+SRL) and S1A+S1B

Impact of increasing number of altimeters and SAR spectra on Sig. Wave Height
High Lat ||> 50° Intermediate lat 20°<||<50° Tropics ||<20°
Period of May-June-July 2017
EXP-A Ja-2 Ja-3 SRL CR2 S3A
S1A S1B
EXP-B Ja-2 Ja-3 SRL CR2 S3A
S1A S1B
EXP-C Ja-2 Ja-3 SRL CR2 S3A
S1A S1B
EXP-D No assimilation
The best performance on SWH when using 4 altimeters with SAR spectra (SI <10%):
Experiments description:
At least 1 altimeter is kept for the validation

Bias maps of SWH (The story) the assimilation of S3A and S1A and S1B spectra
MFWAM+S3+S1A+S1B
without assimilation
Period of May-Jun-Jul 2016 Validation with JA3 and
Saral
Sentinel-3A increases the bias of SWH after the combined assimilation. Bias induced possibly by swell effect on the retrieva of SAR altimetry
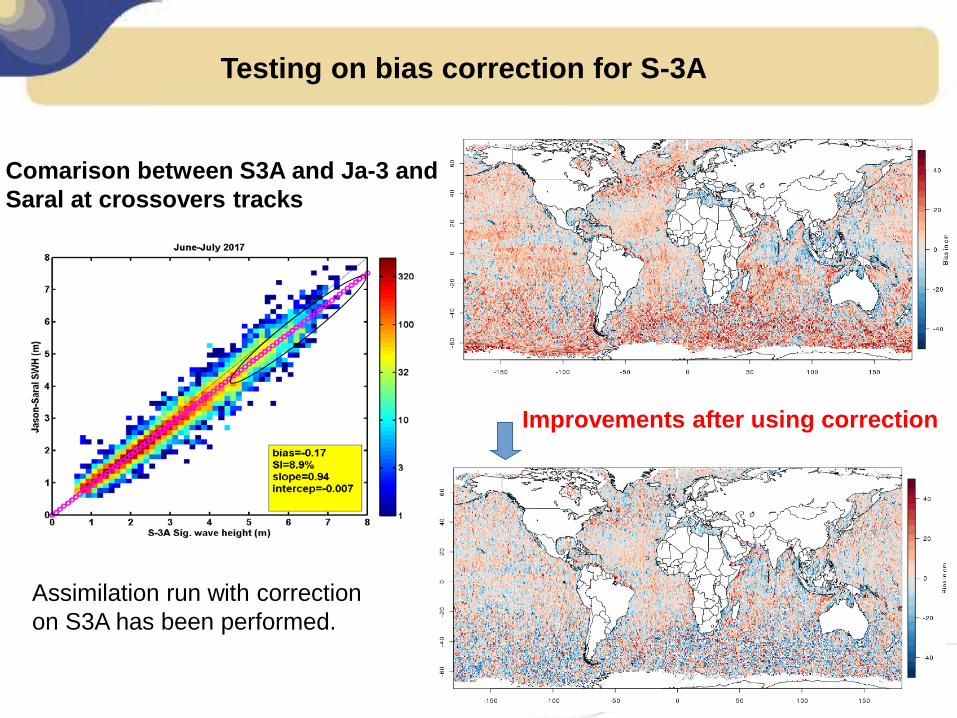
Testing on bias correction for S-3A
Comarison between S3A and Ja-3 and Saral at crossovers tracks
Assimilation run with correction on S3A has been performed.
Improvements after using correction

Comparison with buoys : thanks to NDBC and J. Bidlot for buoys data archive
Validation of SWH for the period : Sep-Oct-Nov-Dec 2016
CAT1 : Tp > 6 sec CAT2 : Tp > 8 sec CAT3 : Tp > 10 sec CAT4 : Tp > 12 sec
SI is improved for all wave Systems. CAT4 is improved Thanks to SAR spectra

Comparison with buoys : Peak period
Validation of Peak period Tp
CAT1 : Tp > 6 sec CAT2 : Tp > 8 sec CAT3 : Tp > 10 sec CAT4 : Tp > 12 sec
Period of Sep-Oct-Nov- Dec 2016
SI is well reduced and the Improvement is enhanced for CAT4 thanks to S1A and 1B

Comparison with buoys : May-June-Jul 2017 Winter in the southern ocean
Validation of Peak period Tp on Pacific buoys
CAT1 : Tp > 6 sec CAT2 : Tp > 8 sec CAT3 : Tp > 10 sec CAT4 : Tp > 12 sec
Significant improvement of SI in particular for long swell (CAT4) Dominant system

The use of re-localization technique for global 0.2°
Altimeter track
super-obs
Decreasing the grid resolution of the wave model induces less impact for grid points at 0.5°. The re-localization uses the altimeter observed points to get super-obs at 0.5°, and then will be considered as Input for the assimilation. The advantage is increasing the number of data and allow a more efficient Assimilation. Test run for June 2017 has been tested with operational MFWAM of grid resolution of 0.2°.

The impact of re-localization technique
Difference of SWH with and without re-localization 23 June 2017 at 0:00 23 June 2017 at 06:00
Validation with Saral
Better SI when using the re-localization technique (roughly improved by 5%)

Max=115.1 Tp=13.1sec
Max=129.6 Tp=13.3sec
Max=172.2 Tp=16.1sec
Max=101.5 Tp=16.1sec
Storm in southern ocean on 23 June 2017 : Warning for swell at La Réunion
Sentinel-1A and 1B tracking the long swell generated by the storm Off shore of South-Africa (Peak Energy=172.2 and Peak eriod of 16 sec)
Snapshots from CMEMS-GLO 23 to 24 June By step of 6h
S1 in the peak of the storm

Impact of combined assimilation in regional MFWAM (10 km) for La Reunion : swell warning in 23 June 2017
Difference of swell height with and without combined assimilation 23/06/2017 at 0:00 24/06/2017 at 18:00
Comparison with saral during the storm
The combined assimilation Improves the scatter index of SWH by 14 % during the storm
Saral

Maximum wind from the atmospheric system ARPEGE : 130 km/h (gulf of biscay 3 feb. 2017)
Storm cases Kurt and Leiv in early february 2017
Time series of SWH from MFWAM-ARP-OPER
SWH from MFWAM-ARP-01 on 04/02 at 06:00 Winds from ARPEGE system

S3A watching storms Kurt and leiv (February 2017)
6-hourly difference of SWH with and without Assimilation of S3A from 01/02/17 at 18:00 to 04/02/17 at 0:00 (UTC)
Validation at buoy biscay
The black line : with S3A Blue line : operational MFWAM Red line : biscay buoy

Impact of the combined assimilation (Altimeters+S-1A and S-1B) on Stokes drift
5 November 2016 at 12:00 UTC
The maximum impact can reach ~30 % of the initial component
U-Stokes V-Stokes

The combined assimilation has been successfully evaluated for long period and It will be used in operations (CMEMS-GLO V4) when S1A and 1B get through the GTS system. The use of S3A data shows significant improvement on scatter, however a strong bias has been identified possibly because of swell effect on the retrieval (work is ongoing for the CALVAL team) Re-localisation technique shows good skill to enhance the impact of the assimilation (SI globally of 8%) Using both altimeters and SAR spectra works efficiently to reduce uncertainties during storm cases. CFOSAT mission : Launch next June 2018 (wave spectra,SWH and winds from scatterometer
Conclusions