The Impact of Classroom Behaviors and Student Attention on ...
69
Syracuse University Syracuse University SURFACE SURFACE Theses - ALL January 2017 The Impact of Classroom Behaviors and Student Attention on The Impact of Classroom Behaviors and Student Attention on Written Expression Written Expression Narmene Hamsho Syracuse University Follow this and additional works at: https://surface.syr.edu/thesis Part of the Social and Behavioral Sciences Commons Recommended Citation Recommended Citation Hamsho, Narmene, "The Impact of Classroom Behaviors and Student Attention on Written Expression" (2017). Theses - ALL. 145. https://surface.syr.edu/thesis/145 This Thesis is brought to you for free and open access by SURFACE. It has been accepted for inclusion in Theses - ALL by an authorized administrator of SURFACE. For more information, please contact [email protected].
Transcript of The Impact of Classroom Behaviors and Student Attention on ...

Syracuse University Syracuse University
SURFACE SURFACE
Theses - ALL
January 2017
The Impact of Classroom Behaviors and Student Attention on The Impact of Classroom Behaviors and Student Attention on
Written Expression Written Expression
Narmene Hamsho Syracuse University
Follow this and additional works at: https://surface.syr.edu/thesis
Part of the Social and Behavioral Sciences Commons
Recommended Citation Recommended Citation Hamsho, Narmene, "The Impact of Classroom Behaviors and Student Attention on Written Expression" (2017). Theses - ALL. 145. https://surface.syr.edu/thesis/145
This Thesis is brought to you for free and open access by SURFACE. It has been accepted for inclusion in Theses - ALL by an authorized administrator of SURFACE. For more information, please contact [email protected].

Abstract
This study sought to examine classroom behaviors and attention as predictors of writing
performance among third-grade students receiving a Tier 1 performance feedback intervention.
Information about the classroom behavior of 80 third grade students (39 males, 41 females) was
collected before intervention began through use of two teacher report measures: the Academic
Performance Rating Scale (APRS; DuPaul, Rapport, & Perriello, 1991) and the inattention factor
on the Strengths and Weaknesses of ADHD Symptoms and Normal Behavior Rating Scale
(SWAN; Swanson et al., 2006). Results indicated that the APRS and SWAN were significant
predictors of writing fluency in the combined sample of participants. When examining gender
differences between these predictors, the APRS and SWAN were identified to be significant
predictors for writing fluency among female students. No behavioral predictors were found to be
significantly associated with any of the writing measures for male students, and no behavioral
predictors were found to be significantly associated with writing productivity for any of the
participants. Results from this study offer some guidance regarding the underlying factors that
contribute to writing performance within the context of academic interventions.
Keywords: written expression, classroom behaviors, attention, performance feedback

THE IMPACT OF CLASSROOM BEHAVIORS AND STUDENT ATTENTION ON
WRITTEN EXPRESSION
by
Narmene Hamsho
B.A., SUNY University at Buffalo, 2014
THESIS
Submitted in partial fulfillment of the requirements for the degree of Master of Science in Psychology.
Syracuse University May 2017
Copyright © Narmene Hamsho 2017
All Rights Reserved

iv
TABLE OF CONTENTS
PAGE
INTRODUCTION…………………………………………………………………………. 1
Theoretical Conceptualization of Writing…………………………………………. 2
Elementary-Aged Student’s Writing Development…………………………………. 3
Behavioral Predictors of Academic Performance…………………………………... 5
Multi-Tiered Model of Academic Support…………………………………………. 15
Purpose of the Present Study………………………………………………………… 16
METHOD………………………………………………………………………………….. 18
Participants and Setting…………………………………………………………… 18
Experimenters……………………………………………………………………... 20
Materials…………………………………………………………………………… 21
Curriculum-Based Measurement in Written Expression……………………. 21
Academic Performance Rating Scale………………………………………. 22
Strengths and Weaknesses of ADHD Symptom and Normal Behavior
Rating Scale…………………………………………………………………
22
Procedures……………………………………………………………..................... 23
Assessment of Behavioral Predictors……………………………………… 24
Tier 1 Performance Feedback Intervention………………………………….. 24
Dependent Measures………………………………………………………………. 25
Experimental Design………………………………………………………………. 25
Procedural Integrity………………………………………………………………... 26
Interscorer Agreement……………………………………………………………... 26

v
RESULTS………………………………………………………………………………….. 27
Preliminary Analysis………………………………………………………………… 27
Data Input and Consistency Checks………………………………………… 27
Data Inspection…………………………………………………………..….. 27
Descriptive and Inferential Statistics……………………………………...… 28
Overview of Data Analysis…………………………………………………………. 30
Behavioral Predictors of Writing Performance While Controlling for Baseline……. 30
Behavioral Predictors for Females………………………………………..…. 31
Behavioral Predictors for Males…………………………………...………… 32
Academic Behaviors and Attention as Predictors of Written Expression…………… 33
Behavioral Predictors for Females…………………………………………… 34
Behavioral Predictors for Males………...…………………………………… 34
Impact of Gender Across Rating Measures and Writing Outcomes………..……….. 34
Gender as a Moderator Between Writing Outcomes and APRS…………..… 35
Gender as a Moderator Between Writing Outcomes and SWAN…………… 35
DISCUSSION……………………………………….…………………………………….. 35
Academic Behaviors as Predictors of Written Expression…………..……………… 36
Gender Differences……………………………….………………..………… 37
Attention as a Predictor of Written Expression ……………………………………... 39
Gender Differences……………………………….……………..…………… 40
Limitations…………………………………………………………...……………… 41
Directions for Future Research……………………………………………………… 42
Conclusions……………………………………………………….…………………. 44

vi
TABLES…………………………………………………………………………….……... 46
FIGURES………………………………………………………………………………...... 49
APPENDICES…………………………………………………………………………….. 50
REFERENCES…………………………………………………………….……………… 56
VITA……………………………………………………………………………………..... 62

1
The Impact of Classroom Behaviors and Student Attention on Written Expression
Writing is an essential tool that individuals are often required to use to navigate through
daily living. Not only are these skills important in achieving success within the school setting,
they are also vital to effective functioning throughout life. Many contexts, such as school, the
workplace, and even the community require writing skills. For example, writing is required for
communicating through text messages, e-mails, writing checks, and even filling out forms at a
doctor’s office. Therefore, it is important for individuals to develop a mastery of the skills
associated with writing at an early age, so that these skills can be generalized across settings.
As students are learning to develop their writing skills, two distinct functions or goals of
writing are emphasized. The first goal of writing is for students to demonstrate their knowledge
to their teacher through homework assignments and exams. In addition, the second goal of
writing is to function as a useful tool that can be used for students to increase their understanding
of concepts they have learned in class (National Commission on Writing, 2003). For example, in
a study performed by Quitadamo and Kurtz (2007), undergraduate students in a general
education biology course who were assigned weekly writing components during lab meetings
significantly improved their critical thinking skills when compared to students who were not
assigned weekly writing components, but were assessed based on quizzes.
Deficits displayed in writing at an early age may hold negative long-term consequences
for students. For example, more than 50% of adults who achieved basic or below literacy skills
subsequently dropped out of school (National Center for Education Statistics [NCES], 2005).
This is great cause for concern when considering that more than 70% of eighth- and twelfth-
grade students are performing at or below basic level in writing (NCES, 2012). As students
move into early adulthood, they may be unable to meet the rigorous demands of higher education

2
(National Commission on Writing, 2004). In addition, these individuals may have trouble
seeking employment because writing has been described as a skill required for all jobs within
service industries, financing, insurance companies, and even within real estate agencies (National
Commission on Writing, 2004). As a result, the importance of students developing mastery in
the processes involved in writing is a necessity in order to ensure educational opportunities as
well as enhance daily living, leisure, and employment opportunities.
Theoretical Conceptualization of Writing
According to Flower and Hayes (1981), there are three basic processes involved in
writing: planning, translating, and reviewing. In the planning process, writers create, develop,
and organize their ideas, which they anticipate using while writing. The writers then engage in
the process of translating, where the information produced during the process of planning is then
transcribed into written language. After ideas are converted into orthographic symbols, the
writers then enter the process of reviewing. During the review process, the author evaluates and
revises their written work.
The processes described above are proposed to be important components utilized by
writers. However, Abbott and Berninger (1993) argued that planning and reviewing are difficult
processes for beginning writers to engage in. Thus, they proposed that the Flower and Hayes
(1981) model was more appropriate for describing the writing processes utilized by adult writers
who have mastered the skills associated with writing. Abbott and Berninger (1993) focused
upon the differences in developmental skill among children of varying ages and abilities (e.g.,
students with learning disabilities in comparison to typically developing students) that impact the
writing process. This theoretical approach proposed that neurodevelopmental constraints (e.g.,
finger movement, visual-motor integration, memory retrieval of alphabet letters), linguistic

3
constraints (the process and production of words, sentences, paragraphs, etc.), and cognitive
constraints (e.g., planning and revising) are present at all developmental stages of the writing
process but that the weight of each constraint differs across each stage (Berninger, Mizkokawa,
& Bragg, 1991). For instance, during the primary grades, neurodevelopmental constraints are
more influential in writing. In contrast, linguistic constraints are more influential during the
intermediate grade. Finally, cognitive constraints are more influential during junior-high school.
Because the writing process of young students is heavily impacted by
neurodevelopmental constraints, Abbott and Berninger (1993) argued the importance of
developing these lower-level processes (e.g., memorizing letter representation, memory retrieval
of these representations, and motor production of these representations) in emerging writers.
Once these lower-level processes are automatized, cognitive resources are freed for writers to
engage in planning and reviewing. Planning and reviewing are cognitive constraints that both
require higher-level processes (e.g., using strategies when planning and evaluating and revising
written work). Thus, before an emerging writer can successfully engage in these higher-level
processes, the lower-level processes must first be automatized. Therefore, Abbott and Berninger
(1993) proposed a model where translation, instead of planning and reviewing, was identified as
a significant contributor in the writing process for developing writers.
Elementary-Aged Student’s Writing Development
The theoretical conceptualization of writing as proposed by Flower and Hayes (1981) and
Abbott and Berninger (1993) suggests that the writing process for elementary-aged students can
be broken down into two stages: higher-level and lower-level processes. Students between the
grade levels of kindergarten and second grade are utilizing lower-level processes in their writing
development, which is characterized by establishing proficiency in motor production of written

4
text. Within this stage students begin to integrate their orthographic and motor skills, which then
allow them to develop automaticity in handwriting. Memory for the visual patterns associated
with letters shapes, words, and groups of words are then coded and rehearsed. Eventually
students are able to immediately retrieve information related to these patterns allowing them to
transcribe this information into orthographic symbols. The importance of orthographic skills
relates to the findings in a previous study where it was found that mechanical skills of writing
was a significant predictor for the length and quality of a students’ writing within grades 1
through 6 (Graham, Berninger, Abbott, Abbott, & Whitaker, 1997). Thus, achieving proficiency
in transcription is important for students to transition from using lower-level to higher-level
processes. As students’ writing abilities progress they begin to automatize the motor skills
involved with the production of written language (neurodevelopmental constraints) and focus on
generating sentences (linguistic constraints). Once these processes are automatized, students can
fully engage in planning and revising their written work (cognitive constraints).
Previous research has identified a strong association between attention and performance
on tasks measuring writing skills (Kent et al., 2013). These results suggest that attention is an
important part of written expression that can allow students to progress from the lower- to
higher-level processes. Progression through the stages requires sufficient opportunities to
respond, however, if student are easily distracted, they may not be able to remain on-task when
completing their writing assignments. As such, attention is an important factor that might
contribute to elementary students’ writing difficulties. Therefore, future research should
investigate the impact attention has on students’ improvement of their writing skills within the
context of a performance feedback intervention.

5
Behavioral Predictors of Academic Performance
In addition to the multiple processes described above, there are other factors, like student
behavior, that can contribute to the writing process and academic performance as a whole. A
few studies from a considerable literature base of research further examining this topic are
highlighted below. The first three studies represent seminal work that utilizes direct observation
techniques to examine the relation between student behavior and performance across several
academic areas. Newer subsequent studies utilizing teacher-report measures to examine the
relation between student behaviors and writing performance are also described.
In an initial correlational study, Lahaderne (1968) investigated whether classroom
attentiveness in 125 sixth-grade students enrolled in four general education classrooms was
associated with their academic achievement. Data regarding student attention was gathered
through use of a modified version of the Jackson-Hudgins Observation Schedule (Jackson &
Hudgins, 1965) of direct observation that focused on measuring student attention and inattention.
Attention was defined as attending to the area specified by the teacher (e.g., attending to the
activity or paying attention to teacher instruction). Inattentiveness was defined as not attending
to a teacher-specified area (e.g., horseplay, working on an activity different from the one
prescribed by the teacher, and/or doodling). Student academic achievement was measured by
administering the Stanford Achievement Test (SAT) and the Scott-Foresman Basic Reading
Test. Observers were not blind to students’ levels of academic achievement. Although data
were collected over the course of 37 hours of observation for approximately three consecutive
months, no specification was provided regarding the data collection procedures for individual
students (e.g., length of observation per student, timing of observation, observation sampling

6
technique). Interobserver agreement was only collected during the training of observers and
ranged from 83% to 100%.
Data were analyzed separately for males and females. Results indicated a statistically
significant and positive relations between student attention and their performance on all
achievement measures for males (range, r = .46 to .53) and females (range, r = .37 to .49). In
addition, a negative and statistically significant relation between student inattention and their
performance on all achievement measures for males (range, r = -.42 to -.52) and females (range,
r = -.38 to -.53). These results suggest that students who demonstrated higher rates of attention
during class obtained higher achievement scores, suggesting that classroom behaviors are clearly
influential. An inverse relation was also found to be true, wherein the students who
demonstrated higher rates of inattention obtained lower achievement scores. The results also
demonstrated a slightly higher correlation between attentiveness and inattentiveness with most
measures of academic achievement for males when compared to the correlations between
attentiveness and inattentiveness with measures of academic achievement for females.
Lahaderne’s research (1968) was one of the first studies to separate males and females in
order to examine gender differences regarding attention and achievement. The findings from this
study suggested that attention and inattention are important factors that contribute to students’
academic achievement. Despite these strengths, the lack of information provided (e.g., type of
sampling procedure, length of observation per student, and interobserver agreement) limits the
internal validity of the study.
Expanding upon the work of Lahaderne (1968), Samuels and Turnure (1974) investigated
the relation between classroom attentiveness and reading achievement among first-grade
students. The authors argued the importance of assessing younger students in examination of

7
this topic in order to limit the impact of prior educational experiences, such as years of school
successes or failures. In this study, classroom behaviors were assessed with 88 first-grade
students enrolled in four general education classrooms. Similar to Lahaderne (1968), data
concerning student attention (e.g., orienting eyes to work or teacher and/or working on activity
assigned by teacher) was collected using direct observation techniques. In addition, direct
observation was used to collect information about inattention, which was defined as behaviors
not pertaining to the task (e.g., not following directions, closing eyes, etc.). Interobserver
reliability (89%) was assessed only during training.
During the observations, a 6 sec interval recording method was used to collect
observational data on each student, in which each student was observed for 4 sec, with 2 sec
allotted for the observer to record the student’s behavior. Although the authors described the
observational recording method, the type of sampling procedure (i.e., whole or partial interval)
was not specified. Approximately 15 observation sessions each lasting one-hour occurred over
the course of a single month. Attention scores were calculated and divided into four quartiles,
where the first quartile represented students with the lowest attention score and the fourth
quartile represented students with the highest attention scores. Reading achievement was
determined by administering the Dolch (1956) list of basic sight words and was operationalized
as the number of correct responses. Observers were not blind to individual student achievement.
Results of this study were similar to those reported by Lahaderne (1968) and suggested a
positive relation between attention and performance on the reading word recognition task such
that students who were ranked at the fourth quartile (i.e., attention scores 88% or greater)
demonstrated more correct responses when compared to students who were ranked at the first
quartile (i.e., attention scores 68% or less) of the time. In addition, a statistically significant

8
difference was found between the mean attention scores and students’ gender, such that females
attained a higher mean attention score when compared to males, suggesting a moderated relation
between differences in scores found in reading achievement between males and females. In
addition, a correlational analysis between attention and word recognition resulted in a value (r =
.44) similar to the correlation reported by Lahaderne (1968). However, a correlational analysis
between attention and reading achievement was not computed for each gender.
This was one of the first studies that attempted to examine behavioral predictors of
academic performance by dividing attention into different levels based on percentage of
attentiveness. Findings suggested that attention is a contributing factor to both high and low
reading achievement and results demonstrated a correlation similar to the reports of Lahaderne
(1968). However, the use of mean scores on the word recognition measure used to determine
reading achievement makes it difficult to interpret and to compare these findings to other
measures of achievement. In addition, the lack of information provided regarding interobserver
agreement and type of sampling procedures limits the internal validity of this study.
In a third study, Cobb (1972) examined the association between several classroom
behaviors on students’ academic achievement in reading and mathematics. A total of 103 fourth-
grade students enrolled in five general education classrooms across two elementary schools
participated in the study. Observers, blind to the achievement level of individual students,
collected information on each student for nine consecutive days. Observers used a coding
system that recorded 8 classroom behaviors. Similar to studies by Lahaderne (1968) and
Samuels and Turnure (1974), attention was coded if a student engaged in one of the following
behaviors: (a) looking at teacher, (b) looking at another student who is talking to the class, or (c)
writing down an answer. Inattention was operationalized into three different categories: (a) not

9
attending to assignment; (b) looking around; and (c) out-of-chair. Additional classroom
behaviors were coded in this study and included: (a) talk-to-peer-positive (e.g., about academic
work); (b) volunteers (e.g., raises hand to answer teacher's question); (c) compliance; and (d)
self-stimulation (e.g., student is not paying attention to assignment because they are scratching
self, rubbing material of clothing between two fingers, etc.). The type of sampling procedure by
which data was collected was not provided. Interobserver reliability was assessed at two
separate time points (training reliability = 85%; classroom observation reliability = 88%).
Academic achievement was assessed through administration of the Arithmetic, Spelling, and
Reading subtests of the Stanford Achievement Test.
Behavioral data and scores on the two achievement measures were analyzed using
stepwise regression. The findings from this study suggested that different classroom behaviors
were identified as significant predictors for students’ academic achievement in different content
areas. For example, of all the observed classroom behaviors, attention (M r = .44) was found to
be the single best predictor of arithmetic achievement. Conversely, in the area of reading and
spelling, talk-to-peer-positively (r= .42) and out-of-chair were (r = -.25) were found to be the
best predictors of reading and spelling achievement.
This was one of the first studies to define classroom behaviors into more discrete
behaviors. However, by breaking down the general response class of classroom behaviors into
several behaviors, the ability to predict achievement was likely weakened. For example,
defining inattention to include out-of-chair, looking around, and not attending might provide a
stronger correlation when combined than when separated. Furthermore, the independent
variables were entered together and the program selected the variable that provided the greatest
contribution. Therefore, variances of other predictors were not partialed out of the analyses and
10
it is possible that other variables within the regression analysis that were not controlled for could
have impacted the results. In addition, the results from the previous two studies mentioned
above (Lahaderne, 1968; Samuels & Turnure, 1974) indicate that gender differences exist
between behavioral predictors and academic achievement. This study did not examine any
differences between males and females. In addition, a lack of information regarding the type of
observational sampling procedure used limits the internal validity of this study.
The three aforementioned studies reflect the seminal work examining behavioral
predictors of students’ academic achievement. However, these studies share several
methodological limitations. First, of the three studies mentioned above, only one study (Cobb,
1972) collected and reported interobserver reliability data. Second, classroom observations
methods (e.g., sampling techniques, duration of intervals, student sampling techniques) were not
specified in any of these studies. As a result, the weaknesses associated with internal validity of
the aforementioned studies significantly limits the conclusions that can be drawn from their
results regarding the relationship between classroom behavior and academic achievement.
More recent research has started to focus on this area. Two recent studies from a
considerable research base spanning more than 40 years examining this topic are highlighted in
this discussion. The first includes a longitudinal study examining the relation between
kindergarten component skills (e.g., transcription skills, oral language, reading skills, and
attention) and first-grade writing quality and fluency (Kent, Wanzek, Petscher, Otaiba, & Kim,
2013). Within this study, a cohort of 265 kindergarten students across 10 schools and 31
classrooms participated in a longitudinal examination of their emerging academic skill
development across a one-year period. When students were in kindergarten they were assessed
in the following areas using multiple measures: transcription (e.g., accuracy and fluency in

11
writing individual letters), oral language (e.g., expressive vocabulary), reading skills (e.g., letter
and word reading and decoding), and attention. In contrast to the previously mentioned studies,
which used behavioral observations to measure attention, Kent et al. (2013) assessed attention
through teacher report of the Strengths and Weaknesses of ADHD-symptoms and Normal
Behavior Rating Scale (SWAN; Swanson et al., 2006) where students were rated by teachers in
comparison to their peers on 30 items with a 7-point Likert scale for each item. In addition,
writing skills were assessed. When students were in kindergarten, writing samples in response to
prompts were scored for the number of words, sentences, and ideas (ideas required a predicate
and a subject) through the use of a previously developed coding scheme (Puranik, Lombardino,
& Altmann, 2007). When students entered first-grade, narrative text in response to a story
prompt (McMaster, Du, & Petursdorrir, 2009) was evaluated for organization of text structure
(e.g., is there a clear beginning, middle, and end?), sentence fluency (e.g., sentences are
grammatically correct), word choice (e.g., use of specific words), and correct word sequence
(e.g., two correctly spelled words that are adjacent to each other and make sense within the
context of the sentence). In contrast to two of the previously mentioned studies (Lahaderne,
1968; Samuels & Turnure, 1974), this study did not control for gender.
Structural equation modeling was utilized to examine kindergarten component skills that
predict kindergarten and first grade writing quality and fluency. After controlling for oral
language, transcription, and reading skills, the results of this study indicated a statistically
significant relation between students’ attention skills and kindergarten composition fluency. In
addition, attention in kindergarten showed a statistically significant relationship to first grade
compositional fluency and quality. Results indicated that a model including attention (Δx2 =
73.5, df = 4, p < .001) demonstrated a significantly better fit than a model that only included
12
transcription skills, oral language, and reading skills. These findings suggest that attention is an
important contributor to students’ early written composition skills.
This study was unique in that it examined teachers’ perceptions of student attention in
relation to other literacy and language skills in the early school years. Unlike the previously
reviewed studies (Cobb, 1972; Lahaderne, 1968; Samuels & Turnure, 1974), this study examined
longitudinal effects of attention on students’ writing skills. Results demonstrated that attention is
an important predictor of students’ written composition skills. However, unlike two of the
previously reviewed studies (Lahaderne, 1968; Samuels & Turnure, 1974), this study did not
take into account the influence gender plays on the relation between attention and written
expression skills. This is an important demographic variable to consider because results from
previous studies (Lahaderne, 1968; Samuels & Turnure, 1974) indicate gender differences
between behavioral predictors and academic achievement. Another consideration presented in
this study was the use of relying upon teacher report of students’ attention as opposed to utilizing
direct assessments of attention using behavioral observations. Although the teacher rating scale
used in this study appears to capture students’ regulation of attention, it was developed for use
within the context of clinical assessments of attention. As such, it is narrow in focus and does
not to account for classroom factors, such as performance demands in relation to completing
work accurately that may impact students’ academic productivity and ultimately their writing
performance. A comprehensive assessment of attention using additional measures that are
sensitive to factors associated with students’ attention in the classroom would strengthen our
understanding of the relation between students’ attention and the development of their writing
skills. In addition, this rating scale does not provide norms based on gender and age.
13
Another recent study examined language and cognitive predictors of written composition
skills among 494 second- and third-grade students (Kim, Al Otaiba, Wanzek, & Gatlin, 2014).
Students across 10 schools in 76 classrooms participated in this cross-sectional study. Several
measures were administered to evaluate the following skills: oral language, reading, spelling,
letter writing automaticity, story copying, attention, and rapid automatized naming. Similar to
the work by Kent et al. (2013) attention was measured using the SWAN (Swanson et al., 2006).
However, only the first nine items of the SWAN were used to measure attentiveness because
previous research has shown through factor analysis that these items were related to behaviors
important in sustaining attention to tasks (Saez, Folsom, Al Otaiba, & Schatschneider, 2011).
The authors reasoned that the other items assessed constructs that they were not directly related
to attention (i.e., hyperactivity, aggression). In addition, unlike Kent et al. (2013), this study
accounted for gender differences among students. Students’ written expression skills were
examined using three writing measures (i.e., narrative, experimental, expository), which were
evaluated using three writing outcomes: quality (i.e., the development and organization of
presented ideas were evaluated on a 7-point rating scale), productivity (i.e., total number of
words written and total number of ideas), and fluency outcomes (i.e., correct writing sequences).
This study used confirmatory factor analysis to test three models for each of the writing
outcomes described above. The first model examined the relationship of language and cognitive
skills with writing outcomes, the second model examined the relation between gender and
writing outcomes, and the third model examined the relation between gender and writing
outcomes after controlling for language and cognitive skills. The results of this study suggested
that although the first model demonstrated that attention was a statistically significant predictor
of students' writing quality and fluency outcomes, and the second model indicated that gender
14
was a significant predictor for all three writing outcomes, the results of the third model revealed
that attention was a significant predictor for writing fluency, but not a significant predictor of
writing productivity and writing quality. Thus, once gender was accounted for in model 3,
attention was no longer a statistically significant predictor for writing quality (as was originally
seen in model 1).
This study was unique in that it comprehensively evaluated writing in relation to
attention. In comparison with the previously reviewed studies that used behavioral observations
to record attention (Lahaderne, 1968; Samuels & Turnure, 1974), the present study instead used
teacher-rating scales. Gender differences in regards to behavioral predictors of academic
performance were also demonstrated. However, this study more specifically examined and
found gender differences related to each of the identified dimensions of writing. In comparison
to Kent et al. (2013), both studies found attention to be significantly related to writing fluency
and quality. However, this relation differed when gender was taken into account. Although the
models tested and the analytic approaches differed, a potential factor that may have accounted
for some of the differences in findings between this study and Kent et al.’s (2013) findings is that
this study only used the first nine items of the SWAN to assess students’ attention, whereas all
18 items of the SWAN were used to assess students’ attention and hyperactivity/impulsivity in
the Kim et al. (2014) study. By relying upon an even narrower assessment of students’ attention,
the impact of additional classroom behaviors that may influence their written expression skills,
such as performance demands in relation to completing work accurately, remains unknown. In
addition, the sensitivity of this measure to gender and age remains unknown, as the norms for
these factors were not evaluated. Further, given that schools are moving towards providing
multi-tiered models (e.g., response to intervention) of academic support for students in relation to

15
their academic skill development, it is important for future research to examine the relation
between students’ behavioral predictors and academic performance from a more dynamic
perspective.
Multi-Tiered Model of Academic Support
The multi-tiered model of academic support is based on the public health model whereby
a three-stage prevention model provides educators with a different way to consider how to
support their student’s learning. The introduction of federal acts (Individuals with Disabilities
Education Act [IDEA], 2004; No Child Left Behind Act [NCLB], 2002) emphasizing prevention
efforts sparked a change in educational practices that highlighted the importance of continual
data collection to examine students’ academic achievement in relation to instructional supports in
the classroom (Nantais, Martin, & Barnes, 2014). As part of these changes, multi-tiered systems
of academic support are used to prevent academic achievement difficulties, and focus on
implementing evidence-based interventions in the classroom to increase students’ academic
performance.
The majority of multi-tiered models of academic support feature three tiers (Walker, &
Shinn, 2010). The first tier consists of providing evidence-based instruction to all students in the
general education classroom. Tier 1 interventions are high quality, scientifically based, and
universal. It is effective instruction that can be delivered to students within a classroom or can
be delivered school-wide. For those students who do not benefit from this level of support, a
second tier of intervention is provided that consists of evidence-based interventions that are
conducted in small group formats. The final tier consists of intensive interventions directed at
individual students who have demonstrated chronic academic and behavioral problems that were
unable to be resolved in the first two tiers. Although multi-tiered models of support have been

16
thoroughly discussed within the literature, it does not consider the influences of behavior as a
way to explain academic intervention failure.
It is important to understand the impact of behavior on a student’s response to academic
intervention. As described in the previously reviewed studies (Cobb, 1972; Kent et al., 2013;
Kim et al., 2014; Lahaderne, 1968; Samuels & Turnure, 1974), behavioral predictors can impact
assessments of student learning over time. Thus, student behavior might help to explain why a
student is not responding to an academic intervention. As such it might be beneficial to modify
intervention to target student behavior in order to indirectly improve academic performance. The
findings from these studies emphasize the importance of examining the role of behavioral
predictors within the context of a multi-tiered model of academic support. To date, no studies
have explicitly examined this.
Purpose of the Present Study
Given the importance of writing skills throughout life, it is unfortunate that not all
students will achieve acceptable performance in this domain (National Center for Education
Statistics, 2012). The findings from all the studies previously reviewed (Cobb, 1972; Lahaderne,
1968; Samuels & Turnure, 1974) suggest that there is an association between behavioral
predictors and students’ academic performance. More specifically, a few studies have identified
a relation between attention and writing performance (Kent et al., 2013; Kim et al., 2014).
Beyond these findings, no research to date has investigated behavioral predictors of writing in
elementary-aged students that are specific to the classroom environment. In addition, no studies
to date have examined student’s writing performance in relation to behavioral predictors within
the context of an intervention targeting student’s writing performance.
The main aim of this study was to identify the impact of classroom behaviors (defined as
student performance outcomes, behaviors contributing to classroom success, and the inhibition

17
of impulses) and attention (as defined as on-task behavior) on written expression performance of
male and female students within the context of a Tier 1 class-wide writing intervention (e.g.,
performance feedback). To address the study aims, the following research questions were posed:
(1) What behavioral predictors (attentive and/or academic behaviors) are associated with each
writing productivity and fluency outcome measure after receiving a Tier 1 performance feedback
intervention?, (2) Are there differences in these predictors for male and female students?, and (3)
is gender a moderator across rating measures and writing outcomes?
Previous studies have not assessed the relation between classroom behaviors and written
expression. However, because the rating scales used to assess classroom behaviors (Academic
Performance Rating Scales, APRS; DuPaul, Rapport, & Perriello, 1991) directly addresses
behaviors related to student writing, it was hypothesized that this teacher rating scale would be
significantly related to the writing outcome measures of all students, regardless of gender. In
addition, it was hypothesized that this relation would continue to hold significance even when
the statistical model examined male and female students separately. Because the results from
Kim et al., (2014) found differences in the writing performance between male and female
students (i.e., female students tended to outperform their same-aged male peers on writing
measures), it was hypothesized that the relation between classroom behaviors and writing
performance may be moderated by gender.
In regards to attentive behaviors, it was hypothesized that the rating scale measuring
these behaviors (Strengths and Weaknesses of ADHD Symptoms and Normal Behavior Rating
Scales, SWAN; Swanson et al., 2006) would be significantly related to written expression for all
participants regardless of gender. Because this measure directly assesses attention, this
hypothesis was based on the results from Kent et al., (2013) and Kim et al., (2014). In addition,

18
it was hypothesized that this measure would be significantly related to the writing outcome
measures even when examining male and female students separately. Furthermore, given the
results from Kim et al., (2014) it was hypothesized that gender would moderate the relation
between written expression and attentive behaviors.
Method
Participants and Setting
Approval from the Institutional Review Board and from the participating school district
was attained before commencement of the study. In addition, parent consent, student assent, and
teacher consent was obtained. After attaining necessary approval, third-grade students in general
education classrooms were screened for eligibility prior to the start of the study. Students who
fit the eligibility criteria did: (a) not have any serious motor deficits (e.g., neurological
conditions) that may impact their writing performance; (b) not have serious cognitive
impairments (e.g., intellectual disability, traumatic brain injury, autism with accompanying
intellectual impairment) which can impact the student’s writing performance; (c) not have any
significant hearing or vision impairments; (d) speak and be able to write English at a proficient
level (as determined by the general education teacher); and (e) demonstrate minimum
proficiency by scoring above the first percentile for Total Words Written on an AIMSweb
Written Expression Measure at the winter benchmark. The eligibility criteria were examined for
each student by reviewing information gathered from student records and/or teacher interviews.
Those students who were determined through this screening to be ineligible for participation in
this study completed alternative instructional activities assigned by their teachers during data
collection.

19
A total of 108 third grade students were recruited for this study. Of these students, six
moved and four students did not receive parental consent to participate in the study. Of the 98
remaining students, teachers identified 8 students within their classrooms who were English
Language Learners and were experiencing significant difficulties with oral and written
expression in English. These identified students were excluded from the present study. Teachers
also identified six students within their classrooms who had a disability with an IEP and as a
result have poor written expression skills. These identified students were excluded from this
study. Of the remaining 84 students, the teachers failed to submit measures for two of the
students. Finally, two students were not included in this study because they did not demonstrate
a minimum proficiency level on the AIMSweb Written Expression Measure during the screening
assessment. Therefore, a sample of 80 third-grade students was used for this study and received
a Tier 1 performance feedback intervention (see Figure 1).
The mean age of the participants was 8.4 years old. The participants were sampled
across four different general education classrooms. Of the 80 third-grade students who
participated in this study, 51% (n = 41) identified as female and 49% (n = 39) identified as
males. The majority of participants (50%) identified as White, with a smaller percentage
identified as Black or African American (30%), two or more races (12.5%), Hispanic or Latino
(9%), Asian or Native Hawaiian/Other Pacific Islander (5%), and American Indian or Alaska
Native (2.5%; see Table 1). In addition, 7 of the 80 participants were eligible for special
education services (see Table 1), however none of the participants had a Section 504 plan.
The study was conducted in an urban elementary school located in a moderately-sized
city in the northeast. According to the most recent New York State School Report Card (2013-
14), 642 kindergarten through eighth-grade students were enrolled in this school. Most of the

20
students (86%) were eligible for free or reduced-priced lunch. The majority of students enrolled
in this school were identified as White (66%), with a smaller percentage identified as Black or
African American (51%), Hispanic or Latino (12%), Asian or Native Hawaiian/Other Pacific
Islander (8%), two or more races (8%), and American Indian or Alaska Native (2%).
Data collection sessions were approximately 30 min in duration and occurred during the
students’ general education classes.
Experimenters
Doctoral students in school psychology and advanced undergraduates served as research
assistants. Prior to the start of data collection, all research assistants were required to complete
formal training in research ethics. This online training program (e.g., Collaborative Institute
Training Initiative) emphasized the protection and ethical treatment of human research
participants. Documentation of successful completion from this training program in the
following courses was obtained from all research assistants: Social and Behavioral Focus and
Responsible Conduct of Research.
Research assistants also received training in the following areas: (a) administration and
scoring of dependent measures, (b) conducting procedural integrity observations, and (c)
entering data. Research assistants were provided with a procedural script to be used during the
administration of dependent measures and procedural integrity observations. In addition, a
manual that explains the scoring procedures for the dependent measure was given to the research
assistants. After the research assistants finished training, they practiced scoring writing probes
and received immediate feedback. Before beginning data collection, research assistants
demonstrated 100% proficiency in administering and scoring dependent measures and
conducting procedural integrity observations.

21
Materials
During intervention, the primary outcome measure that was utilized to evaluate
participants’ writing fluency were Curriculum-Based Measurement in Written Expression
(CBM-WE) probes taken from a technical report by McMaster, Wayman, Deno, and Yeo (2010).
In addition, teachers were asked to complete the Academic Performance Rating Scale (APRS;
DuPaul, Rapport, & Perriello, 1991) and the Strengths and Weaknesses of ADHD-symptoms and
Normal behavior scale (SWAN; Swanson et al., 2006) for each student.
Curriculum-Based Measurement in Written Expression. To measure students writing
fluency, Curriculum-Based Measurement in Written Expression (CBM-WE) probes were
utilized. This measure required students to create a written response to a brief story starter (e.g.,
“One day my mom surprised me and brought home a…”). In addition, the written expression
probe collected during the session at which the sample average demonstrated a 50% increase in
correct writing sequences from their baseline written expression score was used as the outcome
measures for the purposes of this study. Student written responses were scored for fluency (e.g.,
accuracy and rate) and productivity. Writing fluency was measured by correct writing sequences
(CWS), which has been defined as “two adjacent, correctly spelled words that are acceptable
within the context of the phrase to a native speaker of the English language” (Videen et al.,
1982). Writing productivity was measured by total number of ideas (TNI), which determines
writing samples that elaborate upon the topic by providing detail. TNI is defined as a sentence
that incorporates a predicate and an argument.
The psychometric properties of the writing probes were demonstrated to have strong
alternate-form reliability (r = .73 to .90) and low to moderate criterion validity (range, r = .29 to
.63; McMaster, Wayman, Deno, Espin, & Yeo, 2010). In addition, moderate alternate-slope

22
reliability coefficients (r = .45) were obtained among second- and third- grades students
(McMaster et al., 2010).
Academic Performance Rating Scale. The Academic Performance Rating Scale
(APRS; DuPaul, Rapport, & Perriello, 1991; see Appendix A) is a teacher questionnaire
developed to assess a student’s academic performance and behavioral conduct within the school
setting. The measure contains 22 items that are rated on a 5-point Likert-type scale, where lower
values reflect areas of weakness and higher values reflect areas of strength. Seven items on the
measure (items 1, 3, 4, 5, 10, 11, and 15) are reverse-scored. A higher total score on the measure
suggests greater skills. Separate norms for this measure are provided for males versus females.
The sum of the total score for the APRS was utilized in the analyses of the current study.
An exploratory factor analysis was conducted on the APRS and resulted in the following
three domains: Academic Success (7 items), Impulse Control (3 items), and/or Academic
Productivity (12 items; DuPaul et al., 1991). The scale has high internal consistency for the
Total score (α = .95), Academic Success factor (α = .94), and Academic Productivity factor (α =
.94). However, the Impulse Control factor demonstrated a slightly lower level of internal
consistency (α = .72). The criterion validity of the APRS was variable when compared to the
following measures: The ADHD Rating Scale, teacher report (DuPaul, 1991; r = -.72), direct
observations of on-task behavior (r = .29), percentage of assignments completed accurately (r =
.53), and the Comprehensive Test of Basic Skills, a norm-referenced achievement tests (r = .53).
Strengths and Weaknesses of ADHD Symptoms and Normal Behavior Rating
Scales. The average score of the first nine items assessing attention on the Strengths and
Weaknesses of ADHD Symptoms and Normal Behavior Rating Scale (SWAN; Swanson et al.,
2006) was utilized in this study to assess attention (See Appendix B). Therefore, although the

23
SWAN is an 18-item diagnostic scale based on the ADHD criteria listed in the DSM-IV, the
current study utilized this scale as a proxy for attention and not as a measure for ADHD. Unlike
other rating scales that focus on the severity of the student’s ADHD symptomology, each item on
the SWAN is phrased in a neutral way that allows the teacher to compare the student’s behavior
to that of his or her peers. Each item is scored on a 7-point scale where a score of -3 reflects “far
above ” average behavior, a score of 0 reflects “average” behavior, and a score of 3 reflects “far
below” average behavior.
A factor analysis conducted by the authors revealed that the SWAN items load on two
factors: Inattentiveness (items 1 though 9) and Hyperactivity/Impulsivity (items 10 through 18).
Additional studies of the psychometric properties of the scale indicate strong internal consistency
(α = .88; Arnett et al., 2011). In addition, evidence for convergent validity was obtained when
the Hyperactivity/Inattentiveness subscale of a parent rating scale (Strengths and Difficulties
Questionnaire; Goodman & Scott, 1999) was correlated with the SWAN (r = .54, p < .01; Lakes,
Swanson, & Riggs, 2011). Further, a strong relationship (Cramer’s V = .53) between a parent
report questionnaire of behavior (Disruptive Behavior Rating Scale; DuPaul et al., 1998) and the
SWAN was obtained (Arnett et al., 2011).
Procedures
This study was conducted from late January to early March of 2016 (see Figure 1).
Students participating in this study were part of a larger randomized controlled trial examining
the effectiveness of a performance feedback intervention for improving students’ written
expression skills. For the purposes of this study, data from those students assigned to the
performance feedback intervention was used.

24
Assessment of behavioral predictors. Each teacher was given five packets per week.
Each packet included one APRS and one SWAN for one student in their class. Thus, behavioral
information on five students in each classroom was collected each week. This information was
collected prior to the start of the intervention.
Tier 1 performance feedback intervention. The session was 30 min in duration and
conducted in the students’ classroom. Previous randomized control trial research has
demonstrated the effectiveness of an individualized performance feedback intervention in
improving the writing fluency of students within a general education classroom (Hier & Eckert,
2014). The results from these research studies demonstrate that this intervention, which is
targeted at improving student’s writing fluency skills, is effective when implemented as a Tier 1
performance feedback intervention.
The Tier 1 performance feedback intervention was a classwide intervention where verbal
instructions were provided to all students at the group level. These instructions explained to the
students how they could interpret the written feedback they received. Although this was a class-
wide intervention, the written feedback was individualized within each packet. Students were
provided with a both visual and oral feedback concerning their text production (see Appendix C).
The visual feedback included a box that contained the total number of words the student wrote
during the previous session as well as an arrow that points upwards, points downwards, or has an
equal sign to indicate whether the child wrote more, less, or the same amount of words relative to
the week prior. The research assistant orally read from a procedural script to the entire class and
explained that by counting all the words written by each student the research assistant was able
to compute the total number of words written. The research assistant stated, “The box in the
middle of the page [The research assistant should point to the box] tells you how many words
25
you wrote last week. Next to the box you will see an arrow. If the arrow is pointing down
towards the floor, then that means you wrote fewer words since the last time I worked with you.
If you have an equal sign instead of an arrow, then that means you wrote the same number of
words as you did the last time I worked with you. Every week when we work with you, we are
going to tell you how you are doing with your writing.”
Dependent Measures
Student writing samples obtained from the completion of CBM-WE probes were scored
for correct writing sequences. This scoring procedure has been found to be an accurate measure
of fluency for assessing students’ growth over time (Hubbard, 1996). This measure was
calculated by following the scoring procedures outlined by Shapiro (2004), in order to evaluate
the accuracy (e.g., punctuation, capitalization, spelling, and syntax) and fluency of the writing
sample. For correct writing sequences scoring procedures see Appendix D.
Student writing samples was also scored for total number of ideas (Puranik, Lombardino,
& Altmann, 2007, 2008). Total number of ideas was defined as a proposition that includes a
predicate and an argument. For example, “I went upstairs and took a bath” was counted as two
ideas because “going upstairs” is considered the first idea and “taking a bath” is the second idea.
Ideas that are repeated are only counted once. This metric will provide information regarding a
student’s writing productivity. For total number of ideas scoring procedures see Appendix E.
Experimental Design
This study used regression analyses to examine the association between student academic
and attentive behavior with writing fluency and productivity within a Tier 1 performance
feedback intervention model. An a priori power analysis using the software GPower (Erdfelder,
Faul, & Buchner, 1996) was conducted. A medium recommended effect size (f 2 = .15; Cohen,

26
1988) was used for this assessment. The alpha level that will be used for this analysis is p < .05.
Results from this analysis indicated that 55 participants in total were required. A total of 80
third-grade students (39 males and 41 females) participated in this study. Analyses that included
the entire sample in order to examine this association exceeded requirements set by the power
analysis. Analyses examining male and female students separately did not meet the requirements
set by the power analysis.
Procedural Integrity
To assess procedural integrity, the primary experimenter followed a procedural script and
manually checked off every individual step completed. A secondary experimenter followed
along with the procedural script and manually checked off all the steps they observed the
primary experimenter complete. Agreements between the primary and secondary researcher
were tallied up to calculate agreement. In order to measure procedural integrity, the total number
of agreements was divided by the sum of agreements and disagreements. The mean procedural
integrity was 100%.
Interscorer Agreement
After all data was collected, 40% of the CBM-WE probes were randomly selected and
rescored for CWS and TNI. Interscorer agreement was calculated by dividing the number of
agreements by the sum of agreements and disagreements. The mean percentage of interscorer
agreement for CWS was 97.8% (range, 91% to 100%). In order to account for chance
agreements, kappa coefficients for CWS were calculated (M = .92, range, 0.65 to 1.00). The
mean percentage of interscorer agreement for TNI was 99% (range, 89% to 100%). Kappa
coefficients for TNI revealed a mean of 0.97 (range, 0.68 to 1.00). For instances of

27
disagreement, an advanced graduate student determined the scoring that closely followed the
procedures outlined in the manual. This corrected scoring was then used in the analysis.
Results
Preliminary Analysis
Data input and consistency checks. The primary researcher was responsible for
entering raw data into a spreadsheet in Microsoft Excel. In order to ensure the accuracy of data
entry, a double data entry technique was utilized. Data were then transferred from Excel to SPSS
23 (SPSS Inc., 2015). Within SPSS, descriptive statistics were computed and revealed no
missing data.
Data inspection. All data were inspected for violations of assumptions of normality.
Normality was assessed through examination of the Shapiro-Wilk test, calculation of skewness
and kurtosis, and examination of graphs. Data were considered normal if the values of skewness
and kurtosis fell within the range of +1 to -1. In addition, case-wise diagnostics was used to
inspect outliers. From these analyses one participant’s scores on writing fluency (as measured
by correct writing sequences) was identified to be an outlier. However, removal of this student’s
scores was not elected because the scores appeared to be representative of the true distribution of
scores associated with the two measures. In addition, removal of this outlier did not did not
significantly impact the results. Homogeneity of variance was assessed using scatterplots of
standardized residuals and determined that variance around the fit line remained consistent. To
examine linearity and multicollinearity, Pearson correlations and scatterplots were used. Results
indicated that APRS total sum and the average inattention score on the SWAN demonstrated a
statistically significant correlation for both females (r = -.775, p < .001) and males (r = -.790, p <

28
.001) students (see Table 2). Thus due to multicollinearity, APRS total and the inattention factor
from the SWAN were separated in further analyses.
Descriptive and inferential statistics. The writing outcome utilized was collected at the
point during which the sample average demonstrated a 50% increase in correct writing
sequences. Individual differences in the changes between baseline scores and outcome scores
was analyzed and indicated a range between a 100% decrease in performance to a 2,400%
increase in correct writing sequences. Of the 80 participants, 58 (72.5%) demonstrated an
increase in their correct writing sequences from baseline to the time at which outcome data was
collected.
Descriptive statistics for predictors and dependent variables were analyzed to determine
whether differences exist between male and female students (see Table 3). On the Curriculum-
Based Measurement in Written Expression probe, female students achieved higher mean scores
on measures assessing writing fluency (M = 30.22, SD = 14.67) in comparison to their male
peers (M = 23.23, SD = 10.46); t (72) = 2.46, p = .016). Similarly, on the Curriculum-Based
Measurement in Written Expression probe, female student achieved higher mean scores on
measures assessing writing productivity (M = 5.37, SD = 2.44) in comparison to their male peers
(M = 3.77, SD = 2.29); t (78) = 3.01, p = .004.
No statistically significant differences between genders in the mean classroom behavior
score measured by the APRS was found to exist, t (78) = 1.05, p = .296. In contrast to the
APRS, statistically significant differences between genders in the mean attention scores
(measured by the first nine items on the SWAN) were found such that males achieved
significantly higher scores (indicating below average performance; M = .350, SD = 1.08) in
comparison to females (M = -.241, SD = 1.02); t (77) = -2.50, p = .014.

29
The relation between each of these four measures was examined and Pearson correlation
coefficients are reported in Table 2. As discussed above, scores on the APRS for males (r = -
.790, p < .001) and females (r = -.775, p < .001) were significantly correlated with SWAN
scores. APRS scores were also significantly correlated with writing fluency (r = .461, p = .002)
for females but not males (r = 0.179, p = .275). In contrast, APRS scores were not significantly
correlated with writing productivity for females (r = .229, p = .15) or males (r = .018, p = .915).
The SWAN scores were significantly correlated with writing fluency for female students (r = -
.315, p = .045) but not for male students (r = -.103, p = .532). For both males and females,
SWAN scores were weakly correlated with writing productivity (females: r = -.179, p = .262;
males: r = -.030, p = .856). Writing fluency for both females (r = .773, p < .001) and males (r =
.684, p < .001) was significantly and highly correlated with writing productivity.
In order to determine if the results produced meaningful effects despite the limited
sample size for analyses examining male and female students separately, Cohen’s f2 (Cohen,
1977) was calculated. An analysis of the relation between writing fluency and the APRS
revealed a medium effect size (f2 = .269, 95% CI = .001, .731) for females and a small effect
size (f2 = .033, 95% CI = -.066, .155) for males. An analysis of the relation between writing
productivity and the APRS revealed a small effect size (f2 = .055, 95% confidence interval = -
.068 to .216) for females and a null effect (f2 < .001, 95% CI = -.001, .001) for males. An
analysis of the relation between writing fluency and the SWAN revealed a small effect size (f2 =
.099, 95% CI = -.064, .331) for females and a null effect (f2 = .011, 95% CI = -.064, .102) for
males. Finally, an analysis of the relation between writing productivity and the SWAN revealed
a small effect (f2 = .033, 95% CI = -.092,.199) for females and a null effect (f2 = .001, 95% CI = -
.023,.026) for males.

30
Overview of Data Analysis
Due to multicollinearity between the average inattention score on the SWAN and the
APRS summed total score, separate regression analyses were conducted for each predictor. In
addition, in order to examine whether there were differences between predictors for each gender,
separate regression analyses were conducted. Thus, two linear regression analyses for each
writing outcome (writing fluency and writing productivity) were conducted separately for each
gender. Through this analysis, student behaviors significantly related to each writing outcome
were examined. Because there was a wide range of individual percentage change between pre-
and post-intervention scores, hierarchical regressions were initially conducted, where baseline
scores on the associated writing measures (e.g., fluency and productivity) were controlled for in
the analyses. However, it was predicted that entering the baseline writing measure into the
model might have taken away variance from the other predictors. Therefore, a follow-up
analysis using simple linear regression was conducted.
Finally, the previous literature (Kim et al., 2014; Samuels & Turnure, 1974) has
suggested gender to be a moderator between student behavior and academic performance. As
such, an interaction term was created, and the following analyses were conducted: gender by
attentive behavior (SWAN) and gender by academic behavior (APRS). Within the moderator
analysis, two predictors (e.g., gender and total score on either the SWAN or APRS) were entered
into the first step of the multiple regression model and the interaction term was entered into the
second step of the model.
Behavioral Predictors of Writing Performance While Controlling for Baseline
In an analysis that did not account for gender, baseline writing performance was
controlled for and behavioral predictors were examined in relation to students’ writing

31
performance outcomes following the Tier 1 performance feedback intervention. Results from
step two of this analysis indicated that the model including APRS was statistically significant for
post intervention writing fluency (correct writing sequences), R2 = .393, F(2,77) = 24.92, p ≤ .001.
Baseline writing fluency was identified as a significant predictor of post intervention writing
fluency (β = .554, t = 5.72, p ≤ .001), however the APRS was not (β = .146, t = 1.50, p = .136).
Similar to writing fluency, results indicated that a model including the APRS was statistically
significant for post intervention writing productivity (total number of ideas), R2 = .106, F(2,77) =
4.56, p = .013. In addition, baseline writing productivity was identified as a significant predictor
of post intervention writing productivity (β = .292, t = 2.61, p = .011), however the APRS was
not (β = .083, t = .744, p = .459).
Similar to the results stated above, results indicated that a model including the SWAN
was statistically significant for post intervention writing fluency, R2 = .387, F(2,77) = 24.26, p ≤
.001. Baseline writing fluency was identified as a significant predictor of post intervention
writing fluency (β = .580, t = 6.225, p ≤ .001), however the SWAN was not (β = -.112, t = -1.19,
p = .235). Similar to writing productivity, results indicated that a model including the SWAN
was statistically significant for post intervention writing productivity, R2 = .117, F(2,77) = 5.10, p
= .008. In addition, baseline writing productivity was identified as a significant predictor of post
intervention writing productivity (β = .292, t = 2.68, p = .009), however the APRS was not (β = -
.135, t = -1.23, p = .220).
Behavioral Predictors for Females. To examine whether behavioral predictors of
student writing performance after receipt of the intervention differed due to gender, the above
analyses were examined between female and male students. Results indicated that for female
students, a model including the APRS was statistically significant for post intervention writing

32
fluency, R2 = .533, F(2,38) = 21.72, p ≤ .001. However, baseline writing fluency alone was a
significant predictor of post intervention writing fluency (β = .618, t = 5.11, p ≤ .001). The
APRS was not determined to be significant (β = .216, t = 1.78, p = .082). A similar pattern of
results indicated that a model including the APRS was statistically significant for post
intervention writing productivity, R2 = .206, F(2,38) = 4.94, p =.012. Baseline writing productivity
alone was a significant predictor of post intervention writing productivity (β = .417, t = 2.71, p =
.010). The APRS was not determined to be significant (β = .088, t = .570, p = .572).
In regards to attention, a model including the SWAN was statistically significant for post
intervention writing fluency, R2 = .520, F(2,38) = 20.59, p ≤ .001. Baseline writing fluency was a
significant predictor of post intervention writing fluency (β = .666, t = 5.77, p ≤ .001), however
the SWAN was not (β = -.165, t = -1.42, p = .161). Similarly, a model including the SWAN was
statistically significant for post intervention writing productivity, R2 = .211, F(2,38) = 5.07, p =
.011. Baseline writing productivity was a significant predictor of post intervention writing
productivity (β = .429, t = 2.93, p = .006), however the SWAN was not (β = -.107, t = -.735, p =
.467).
Behavioral Predictors for Males. In contrast to their female peers, results indicated that
for male students a model including APRS was not statistically significant for writing fluency, R2
= .093, F(2,36) = 1.84, p = .173. In addition, neither baseline writing fluency (β = .267, t = 1.55, p
= .130) nor the APRS (β = .077, t = .447, p = .658) were determined to be significant predictors.
A similar pattern of results indicated that a model including the APRS was not statistically
significant for post intervention writing productivity, R2 ≤ .001, F(2,36) = .009, p = .991. Neither
baseline writing productivity (β = -.014, t = -.081, p = .936) nor the APRS (β = .020, t = .116, p =
.908) were determined to be significant predictors.
33
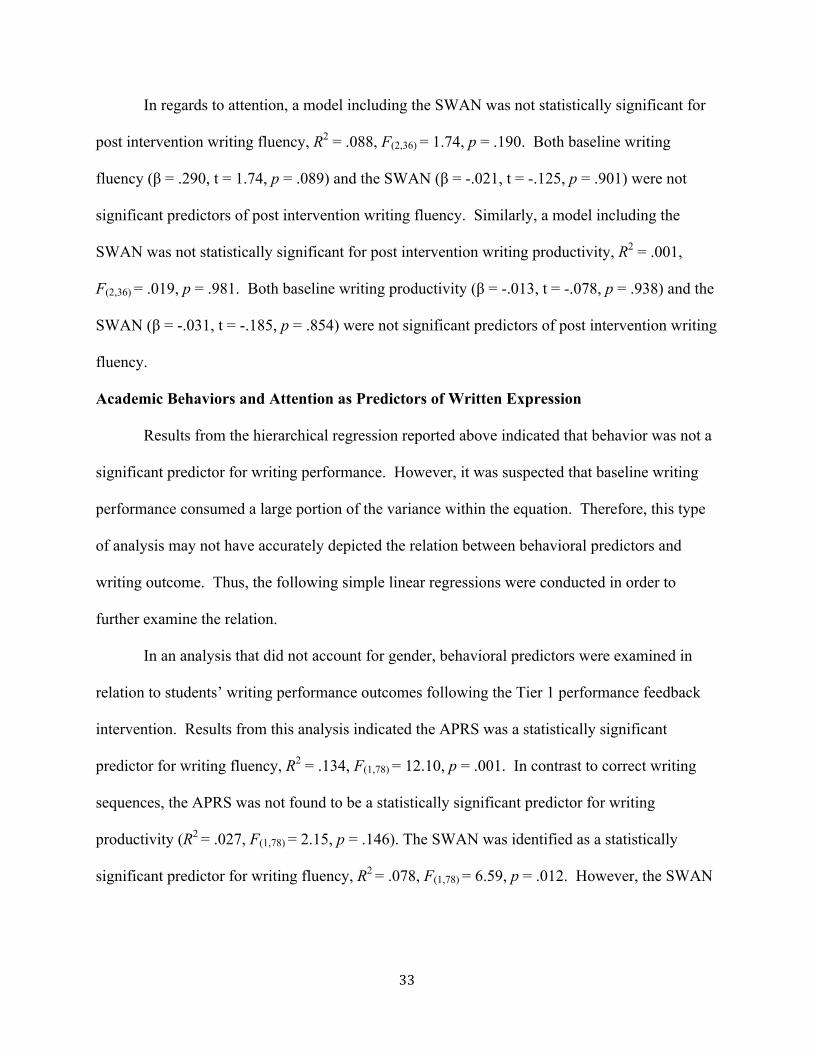
In regards to attention, a model including the SWAN was not statistically significant for
post intervention writing fluency, R2 = .088, F(2,36) = 1.74, p = .190. Both baseline writing
fluency (β = .290, t = 1.74, p = .089) and the SWAN (β = -.021, t = -.125, p = .901) were not
significant predictors of post intervention writing fluency. Similarly, a model including the
SWAN was not statistically significant for post intervention writing productivity, R2 = .001,
F(2,36) = .019, p = .981. Both baseline writing productivity (β = -.013, t = -.078, p = .938) and the
SWAN (β = -.031, t = -.185, p = .854) were not significant predictors of post intervention writing
fluency.
Academic Behaviors and Attention as Predictors of Written Expression
Results from the hierarchical regression reported above indicated that behavior was not a
significant predictor for writing performance. However, it was suspected that baseline writing
performance consumed a large portion of the variance within the equation. Therefore, this type
of analysis may not have accurately depicted the relation between behavioral predictors and
writing outcome. Thus, the following simple linear regressions were conducted in order to
further examine the relation.
In an analysis that did not account for gender, behavioral predictors were examined in
relation to students’ writing performance outcomes following the Tier 1 performance feedback
intervention. Results from this analysis indicated the APRS was a statistically significant
predictor for writing fluency, R2 = .134, F(1,78) = 12.10, p = .001. In contrast to correct writing
sequences, the APRS was not found to be a statistically significant predictor for writing
productivity (R2 = .027, F(1,78) = 2.15, p = .146). The SWAN was identified as a statistically
significant predictor for writing fluency, R2 = .078, F(1,78) = 6.59, p = .012. However, the SWAN
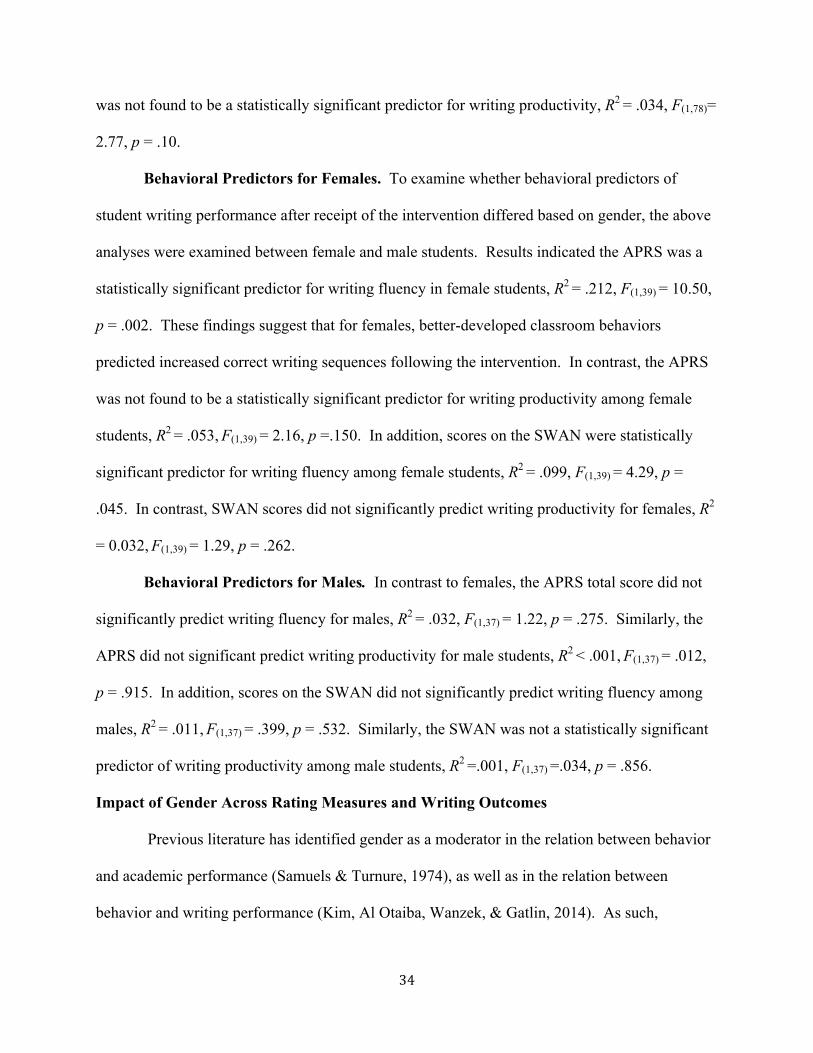
34
was not found to be a statistically significant predictor for writing productivity, R2 = .034, F(1,78)=
2.77, p = .10.
Behavioral Predictors for Females. To examine whether behavioral predictors of
student writing performance after receipt of the intervention differed based on gender, the above
analyses were examined between female and male students. Results indicated the APRS was a
statistically significant predictor for writing fluency in female students, R2 = .212, F(1,39) = 10.50,
p = .002. These findings suggest that for females, better-developed classroom behaviors
predicted increased correct writing sequences following the intervention. In contrast, the APRS
was not found to be a statistically significant predictor for writing productivity among female
students, R2 = .053, F(1,39) = 2.16, p =.150. In addition, scores on the SWAN were statistically
significant predictor for writing fluency among female students, R2 = .099, F(1,39) = 4.29, p =
.045. In contrast, SWAN scores did not significantly predict writing productivity for females, R2
= 0.032, F(1,39) = 1.29, p = .262.
Behavioral Predictors for Males. In contrast to females, the APRS total score did not
significantly predict writing fluency for males, R2 = .032, F(1,37) = 1.22, p = .275. Similarly, the
APRS did not significant predict writing productivity for male students, R2 < .001, F(1,37) = .012,
p = .915. In addition, scores on the SWAN did not significantly predict writing fluency among
males, R2 = .011, F(1,37) = .399, p = .532. Similarly, the SWAN was not a statistically significant
predictor of writing productivity among male students, R2 =.001, F(1,37) =.034, p = .856.
Impact of Gender Across Rating Measures and Writing Outcomes
Previous literature has identified gender as a moderator in the relation between behavior
and academic performance (Samuels & Turnure, 1974), as well as in the relation between
behavior and writing performance (Kim, Al Otaiba, Wanzek, & Gatlin, 2014). As such,
35
additional analyses were conducted to examine gender as a moderator in the relation between
students’ writing fluency and writing productivity with each behavior rating measure (APRS and
SWAN).
Gender as a moderator between writing outcomes and APRS. Results indicated that
an interaction term between gender and the APRS did not account for a significant proportion of
the variance in writing fluency, ΔR2 = .029, ΔF(1, 76) = 2.78, p = .099. Similarly, results indicated
that an interaction term between gender and the APRS did not account for a significant
proportion of the variance in writing productivity, ΔR2 = .010, ΔF(1, 76) =.843, p = .361,
Gender as a moderator between writing outcomes and SWAN. Results indicated that
an interaction term between gender and the SWAN did not account for a significant proportion
of the variance in writing fluency, ΔR2 =.019, ΔF(1, 76) = 1.64, p = .204. Similarly, results
indicated that an interaction term between gender and the SWAN did not account for a
significant proportion of the variance in writing productivity, ΔR2 = .004, ΔF(1, 76) =.362, p =
.549.
Discussion
The majority of our nation’s students are underperforming in regards to written
expression (National Center for Education Statistics, 2012). This highlights the need for
evidence-based interventions to improve this skill. However, not all students respond positively
to Tier 1 interventions and require more individualized interventions. Therefore, the primary
aim of this study was to understand behavioral factors that contribute to writing performance
within the context of a Tier 1 performance feedback intervention. Given the existing literature
that established a relation between behavioral factors (e.g., attention) and academic performance
(Cobb, 1972; Lahaderne, 1968; Samuels & Turnure, 1974; Kent et al., 2013; Kim et al., 2014),

36
the present study examined behavior as a contributor to writing fluency and productivity within
the context of a Tier-1 class-wide performance feedback intervention. This study was unique
from the previous literature in three distinct ways. First, it examined academic behaviors (i.e.,
APRS; academic productivity, academic success, impulsive control) as predictors for writing
outcomes. Second, it examined gender differences in academic and attentive behaviors as
predictors of written expression. Third, it examined predictors of written expression within the
context of a Tier 1 performance feedback intervention.
Academic Behaviors as Predictors of Written Expression
This study examined the relation between students’ academic behaviors displayed in the
classroom and their writing performance. Results from hierarchical regression controlling for
baseline writing performance did not yield significant results. Although these findings suggest
that classroom behaviors are not an important contributor to the writing process, it is suspected
that baseline writing performance consumed a large portion of the variance from the regression.
Therefore, follow-up analyses were conducted and results from these analyses supported the
hypothesis that academic behaviors, assessed via the APRS, would contribute to students’
written expression skills. More specifically, results indicated that regardless of gender, academic
behavior was an important predictor of students’ writing fluency. This finding suggests that
students’ classroom performance outcomes, the behaviors they use to achieve these outcomes,
and their ability to inhibit their impulses are important contributors to their writing performance.
Furthermore, this result suggests that, in general, students with better-developed academic
behaviors (i.e., higher scores on the APRS) will achieve higher writing fluency within the
context of a performance feedback intervention.

37
In contrast to writing fluency, academic behaviors were not shown to predict student
performance on measures of writing productivity. Although Kim et al. (2014) did not explicitly
measure academic behaviors, results from their study suggested that there are very few variables
(language, cognitive, and behavioral) that were identified to be significantly related to writing
productivity. Therefore results from Kim et al. (2014) and the current study suggest that factors
contributing to writing productivity still need to be identified. One possible explanation may be
attributed to the scoring procedures used. Writing fluency utilized a method that was able to
attain a greater amount of variance in comparison to the methods utilized within the scoring of
writing productivity. As such, the differences between students within each of these domains
was much more apparent.
Gender differences. A statistically significant difference in academic behavior (as
measured through the APRS) between male and female students was not found to exist within
this current study. This is consistent with normative data collected from the APRS, which
identified a statistically significant gender difference in academic behavior beginning at grade 5
and above (DuPaul, Rapport, & Perriello, 1991). In regards to writing performance, the current
study found that male students demonstrated lower scores on all measures of writing (fluency
and productivity) in comparison to their female peers. This finding is consistent with the
literature, which suggests that gender differences exist across several measures of writing, such
that females tend to outperform their same-aged male peers (Fearrington et al., 2013).
Previous research has attempted to explain this pattern of results through the examination
of gender differences in factors that contribute to the writing process. Berninger and Fuller
(1992) suggested that the reason female students perform better on measures of written
expression in comparison to their male peers may be due in part to gender differences in
38
orthographic-motor integration skills. Research has indicated that in comparison to male
students, female students demonstrate an advanced skill in their ability to retrieve letter
representation from memory and transcribe that information into written text (Berninger &
Fuller, 1992). As such, female students may have automatized this process resulting in their
ability to produce a larger quantity of text for this current study in comparison to their male
peers. In line with Abbott and Berninger’s (1993) theory, neurodevelopmental constraints may
be more prevalent in the writing process for male students, resulting in poor overall text
production. Gender differences in orthographic-motor integration skills may also provide
another possible explanation for the findings from this current study that suggest APRS is a
significant predictor for writing fluency in female students but not male students. It is possible
that for male students, neurodevelopmental constraints are a stronger predictor of writing
performance for male students receiving a tier 1 performance feedback intervention than
academic behaviors.
A second possible explanation as to why APRS was a significant predictor for writing
fluency in female students but not male students may also relate to the level of functioning of
male students recruited in this study. The male sample demonstrated significant differences in
writing fluency as well as academic behaviors when compared to normative data. In contrast,
the female sample recruited in this study demonstrated significant differences from the normative
sample for academic behaviors alone. These differences may help to explain this pattern of
results such that although female students within this sample demonstrated suppressed classroom
behavior scores, they appear to be related to their normative level performance on measures
assessing writing fluency. For the male students, both academic behaviors and writing fluency
were areas of struggle for this sample and no relation between the two existed.
39
In addition, another explanation for these results may relate to the differences between
the groups (male and female) in the amount of variance that was apparent in scores on the
writing fluency measure as well as the APRS. Female students obtained a wider range of scores
on these measures in comparison to their male peers. As such, a significant relation among these
variables may have been easier to detect in the female sample as compared to the male students.
A final possible explanation as to why the APRS was a significant predictor for writing
fluency in the combined sample and females alone but not for male students may be due to
power. A calculation of effect size revealed low power and found small effects with regard to
the model that only included male participants. In comparison, this analysis revealed a higher
level of power and found moderate effects with regard to the model that only included female
participants. Thus, it is possible that this relation between the APRS and writing fluency for
males would have a stronger level of significance if given more statistical power.
Attention as a Predictor of Written Expression
Previous literature has identified attention as an important contributor to student
academic performance (Cobb, 1972; Lahaderne, 1968; Samuels & Turnure, 1974) and written
expression (Kent et al., 2013; Kim, Al Otaiba, Wanzek, & Gatlin, 2014). Results from
hierarchical regression controlling for baseline writing performance did not yield significant
results. Although these findings contrast previous literature and suggest that attention is not an
important contributor to the writing process, it is suspected that baseline writing performance
consumed a large portion of the variance from the regression. Therefore, follow-up analyses
were conducted and results findings from this analysis align well with the previous literature as a
relation between attention (as measured by the SWAN) and writing fluency for all students,
regardless of gender, was shown to exist. This result suggests that students with a greater ability

40
greater ability to maintain attention (i.e., higher scores on the SWAN) will achieve higher
writing fluency scores.
In contrast to writing fluency, the SWAN was not shown to be a significant predictor of
writing productivity. These results are similar to Kim et al. (2014), who did not find a significant
relation between attention and writing productivity even after controlling for language and
cognitive skills. Therefore results from the current study and Kim et al. (2014) suggest that
attention is not a significant contributor to writing productivity. However, it is important to note
that this finding may be due to the limited variance within this writing outcome measure.
Gender differences. Similar to Kim et al., (2014), results from this current study
revealed that male students demonstrated higher scores on the SWAN, indicating below average
performance in comparison to their same-aged female peers. In other words, male students
appeared to struggle in their ability to maintain attention relative to their female peers. In
addition to revealing a significant difference between the genders, the SWAN scores were
significantly correlated with correct writing sequences for female students but not for male
students. As such, the SWAN scores were found to be significant predictors of correct writing
sequences in female students but not for male students.
This finding is partially supported by the results from Kim et al., (2014) as they noted
that attention continued to remain a significant predictor of writing fluency even after gender was
accounted for. However, for the male students in the current study attention was not found to
significantly predict writing fluency. It is possible that this pattern of results may be explained
by the insufficient sample size for male students. Therefore, the relation between the SWAN and
writing fluency for males may have demonstrated a stronger level of significance if it were given
more statistical power. It is also possible that another predictor might better explain the writing
41
fluency outcome for male students. Given the significant differences that existed between male
and female students initial writing productivity and fluency scores, it is possible that
neurodevelopmental constraints (e.g., motor control) instead of behavior may weigh more
heavily on the writing process for male students in comparison to their female peers.
Limitations
Due to the correlational nature of this study, it is important to note that some of the
methodological aspects utilized may limit the confidence in the reliability of the results. One
such important limitation of this study is related to errors associated with the rating scales
utilized in this study (APRS and SWAN). For example, because of the subjective nature
inherent to rating scales, it is possible that these measures were susceptible errors like the halo
effect (i.e., ratings reflect impression rather than actual performance) and/or error of central
tendency (i.e., scores tending to hover in the middle of the Likert scale and do not accurately
reflect student behavior). As such, the results of the current study should be interpreted
cautiously.
Another aspect of this study that may limit the generalizability of the findings relate to
the population that was sampled. The primary aim of this study was to examine the relation
between student behavior and writing performance among elementary-aged students. This study
was conducted primarily on third-grade students enrolled in an urban school. Comparison
between the variables collected within this study with normative data revealed significant
differences in regards to behavior and writing performance, wherein the sample’s performance
was low for writing performance and high for behavioral impairment. As a result, the
generalizability of the results is restricted to samples with similar demographics.
42
Directions for Future Research
A large amount of the nation’s students are struggling in regards to writing performance
(National Center for Education Statistics, 2012). The primary goal of this study was to
understand the underlying factors that contribute to writing performance in order to bolster the
effectiveness of writing interventions. This study attempted to examine variables above and
beyond the constraints proposed by Abbott and Berninger (1993) in order to identify other
factors that are important in the writing process.
Results of the current study indicated that although academic behaviors and attention was
predictive of writing fluency within the context of a Tier 1 performance feedback intervention
for all students, a model including male students alone did not yield significant results. Future
studies should first examine other variables that predict writing performance outside of the
context of intervention in order to better understand the initial predictors that contribute to
writing performance for both male and female students. For instance, previous research
(Berninger & Fuller, 1992) suggests that ortho-graphic motor skills are important contributors to
the writing process. In addition, Abbott and Berninger (1993) suggested that this
neurodevelopmental constraint is important in the writing process for young writers. They also
emphasize the impact linguistic constraints hold on the writing process for young writers.
Therefore it is possible that these other variables (e.g., the motor production of written text
and/or word retrieval) carry a greater weight for male students in the writing process as
compared to academic and attentive behaviors. Once these initial predictors have been
identified, future research should identify whether these predictors contribute to student writing
performance within the context of a Tier 1 performance feedback intervention.

43
Results from this current study indicated that academic behaviors and attention contribute
to writing fluency for female students. Furthermore, there was a significant difference in the
academic behaviors of female students in the current sample and female students in a normative
sample. In order to better understand the relation between academic behaviors and writing
fluency for female students, future studies should examine the effectiveness of behavioral
interventions targeting classroom behaviors at improving writing fluency for female students
who demonstrate suppressed academic behaviors. Furthermore, to better understand the
generalizability of these results, future studies should examine the effectiveness of behavioral
interventions targeting classroom behaviors at improving writing fluency for female students
who demonstrate normative level performance for academic behaviors.
On the same note, in order to examine the generalizability of the findings of the current
study, this study should be replicated with a different population of third-grade students (e.g.,
students from a school that is determined as high socioeconomic status, students with significant
writing impairments, etc.). In addition, given the sample size of the current study and concerns
regarding power when analyzing the data separately based on student gender, it is recommended
that future research repeat the current study with a larger sample size in order to better
understand how power significantly impacted the findings of this current study. In addition, the
current study should be repeated with behavioral observations instead of rating scales in order to
determine the validity and reliability of teacher report measures on the findings of this study.
Finally, few studies have examined the longitudinal impact of childhood behavior on
future writing performance. Kent et al., (2013) examined the relation between attention and
written expression in a sample of students when they were in kindergarten and later when they
were in first grade. However, information regarding how student behavior early in a student’s

44
elementary school years will impact their writing performance throughout their academic career
is currently unavailable.
Conclusions
Writing is an important skill utilized across many different academic areas (National
Commission on Writing, 2003). Furthermore, young students who fail to master writing skills
may face negative long-term consequences (NCES, 2005). Given its importance, writing is an
important area to target with interventions for beginning writers. Thus, it is important for
researchers and practitioners to develop a comprehensive understanding of factors that predict
writing performance within the context of a writing intervention.
Currently, no previous research studies examining behavioral predictors of writing
performance explicitly examined this relation within the context of a Tier 1 evidence based
performance feedback intervention for writing. Even more generally, few studies targeting this
relation have explicitly examined student gender within this relation (Kim et al., 2014). The
current study sought to extend upon the previous literature that has examined this relation by not
only examining academic behaviors in addition to attention but also by identifying gender
differences in the relation between behavior and writing performance within the context of a Tier
1 performance feedback intervention. In relation to the study aims, academic behaviors and
attention were identified to be important predictors of writing fluency for female students but
neither behavioral measures were shown to be important predictors for writing productivity in
female students. In regards to male students, neither of the behavioral measures were identified
as significant predictors for male writing fluency or productivity. However, results indicated that
academic behaviors and attention were important predictors of writing fluency for all students,
regardless of gender. Thus, the results from this study highlight the importance of addressing
student attention and classroom behaviors as a possible reason why some students might fail to

45
some students might fail to respond to academic interventions. These results offer some
guidance on the underlying factors that may contribute to the effectiveness of written expression
interventions. Future research studies should continue to examine other possible predictors of
writing within the context of Tier 1 performance feedback interventions.

46
Table 1
Student Demographic Information (N=79)
M / % (SD) / n Age 8.04 (.5)
Gender
Female 51.2% 41
Male 48.8% 39
Race
American Indian or Alaska Native 2.5% (2)
Asian or Native Hawaiian/Other Pacific Islander 5% (4)
Black or African American 30% (24)
White 50% (40)
Two or More Races 12.5% (10)
Ethnicity
Hispanic or Latino 8.8% (7)
Not Hispanic or Latino 91.3% (73)

47
Table 2
Summary of Intercorrelations for APRS, SWAN, CWS, and TNI Scores as a Function of Gender
Females (n = 40)
Measure 1 2 3 4
1 Academic Performance Rating Scale total -
2 The Strengths and Weaknesses of ADHD Symptoms and Normal Behavior Rating Scales total
-0.651*** -
3 Correct Writing Sequences 0.461** -0.296 -
4 Total Number of Ideas 0.229 -0.174 0.773** -
*p< .05. **p< .01. ***p<.001
Males (n = 39)
Measure 1 2 3 4
1 Academic Performance Rating Scale total -
2 The Strengths and Weaknesses of ADHD Symptoms and Normal Behavior Rating Scales total
-0.725*** -
3 Correct Writing Sequences 0.179 -0.096 -
4 Total Number of Ideas 0.018 -0.058 0.684** -
*p< .05. **p< .01.

48
Table 3
Students’ Average Scores on Measures of Writing Performance and Behavioral Assessments
Females Males
M (SD) M (SD) t p
Correct Writing Sequences 30.22 (14.67) 23.23 (10.46) 2.46 .016
Total Number of Ideas 5.37 (2.44) 3.77 (2.29) 3.01 .004
Academic Performance Rating Scale 48 (8.38) 46.10 (7.70) 1.05 .296
The Strengths and Weaknesses of ADHD Symptoms and Normal Behavior Rating Scales
-6.34 (17.86) 2.74 (20.06) -2.13 .036

49
Figure 1
Study Procedures
December• Eligibilitycriteriaassessed
January
• Teacherreportmeasurescollected
February
• Tier1performancefeedbackinterventionbegins
March
• Dependentwritingmeasurescollected

50
A
ppendix A
Modified A
cademic Perform
ance Rating Scale - for M
ale Student
Directions: A
ttached are 2 rating scales for 2 students in your classroom. Each scale should only take 2-3 m
inutes to complete.
When you com
plete the rating scales, please estimate the student’s perform
ance over the PAST W
EEK. For each item
, please circle one choice only.
Teacher: _____________________________ Student’s N
ame: _____________________________________________ Spring 2016
C
lassroom B
ehaviors H
ow frequently does he take m
ore time to com
plete work than his classm
ates? N
ever R
arely Som
etimes
Often
Very O
ften H
ow often is he able to pay attention w
ithout you prompting him
? N
ever R
arely Som
etimes
Often
Very O
ften H
ow often does he begin w
ritten work prior to understanding the directions?
Never
Rarely
Sometim
es O
ften V
ery Often
How
often does he appear to be staring excessively or “spaced out”? N
ever R
arely Som
etimes
Often
Very O
ften H
ow often does he appear w
ithdrawn or lack an em
otional response in a social situation?
Never
Rarely
Sometim
es O
ften V
ery Often
Following Instructions
How
frequently does he accurately follow your instructions during large-group
instruction? N
ever R
arely Som
etimes
Often
Very O
ften
How
frequently does he accurately follow your instructions during sm
all-group instruction?
Never
Rarely
Sometim
es O
ften V
ery Often
Learning
How
consistent has the quality of his academic w
ork been over the past week?
Consistently
Poor M
ore Poor Than
Successful
Variable
More
Successful Than Poor
Consistently
Successful
How
quickly does he learn new m
aterial (i.e., pick up novel concepts)? V
ery Slowly
Slowly
Average
Quickly
Very
Quickly
How
frequently does he require your assistance to accurately complete academ
ic w
ork? N
ever R
arely Som
etimes
Often
Very O
ften
How
frequently does he have difficulty recalling material from
a previous day’s lesson?
Never
Rarely
Sometim
es O
ften V
ery Often

51
Literacy Skills
What is the quality or neatness of his handw
riting? Poor
Fair A
verage A
bove A
verage Excellent
What is the quality of his reading skills?
Poor Fair
Average
Above
Average
Excellent
What is the quality of his w
riting skills? Poor
Fair A
verage A
bove A
verage Excellent
How
often does he complete w
ritten work in a careless or hasty fashion?
Never
Rarely
Sometim
es O
ften V
ery Often
Mathem
atics and Language A
rts Estim
ate his accuracy of completed w
ritten math w
ork: M
ostly Incorrect
More
Incorrect Than
Correct
Variable
More
Correct Than
Incorrect
Mostly
Correct
Estimate his accuracy of com
pleted written language arts w
ork: M
ostly Incorrect
More
Incorrect Than
correct
Variable
More
Correct Than
Incorrect
Mostly
Correct
Estimate the percentage of w
ritten math w
ork completed relative to his
classmates, regardless of accuracy:
0-49%
50-69%
70-79%
80-89%
90-100%
Estimate the percentage of w
ritten language arts work com
pleted relative to his classm
ates, regardless of accuracy: 0-49%
50-69%
70-79%
80-89%
90-100%

52
52
Appendix B
Strengths and Weaknesses of ADHD Symptoms and Normal Behavior Rating Scales (SWAN)
Teacher: ______________________ Name: ________________________________Spring 2016

53
53
Last week, you wrote this many words:
Appendix C
Individualized Performance Feedback
44

54
54
Appendix D Curriculum-Based Measurement Scoring Criteria for Correct Writing Sequences (CWS)
When scoring correct writing sequences, the examiner goes beyond the confines of the isolated word to consider units of writing and their relation to one another. Using this approach, the examiner starts at the beginning of the writing sample and looks at each successive pair of writing units (writing sequence). Words are considered separate writing units, as are essential marks of punctuation. To receive credit, writing sequences must be correctly spelled, and be grammatically correct. Each sequence should be examined in isolation and credit should be given when the sequence is correct (e.g., “seen the”) or marked incorrect when the sequence is not correct (e.g., “could seen”). In effect, the student’s writing is judged according to the standards of informal standard American English. A caret (^) is used to mark the presence of a correct writing sequence.
An illustration of selected scoring rules for correct writing sequences is provided below:
Becausetheperiodisconsideredessentialpunctuation,itisjoinedwiththewords beforeandafterittoSincethefirstword ^It^was^dark^.^Nobody^ make2correctwriting
iscorrectitismarked sequences. asacorrectwriting couldXseen^the^trees^of
sequence. ^theXforrestX.
Grammaticalorsyntacticalerrorsarenotcounted.
Misspelledwordsarenotcounted.
Rules: 1. Correctly spelled words make up a correct writing sequence. Reversed letters are
acceptable, so long as they do not lead to misspellings 2. Necessary end marks of punctuation (periods, question marks, and exclamation points)
are included in correct writing sequences 3. Syntactically correct words (i.e., correct word order or structure in sentence) make up a
correct writing sequence 4. Semantically correct words (i.e., grammatically correct) make up a correct writing
sequence: 5. If correct and capitalized, the initial word of a writing sample is counted as a correct
writing sequence: 6. Titles are included in the correct writing sequence count, but not the words “The End”: 7. Numbers are counted within correct writing sequences

55
Appendix E Curriculum-Based Measurement Scoring Criteria for Total Number of Ideas (TNI) The examiner counts and records the total number of ideas written during the 3-minute writing probe. Total number of ideas yields an estimate of writing quality and productivity– that is, how many ideas can the student include within their written text – without examining the accuracy of spelling, punctuation, and other writing conventions. An idea is defined as a sentence that includes a predicate and an argument. A predicate is a verb and an argument completes the meaning of a verb
For example: I went to the park Went = verb To the park = completes the meaning of the verb Rules/Considerations: a) Misspelled words (e.g., You goes two park wid your bro) are counted.
a. If the mispelled verb becomes a different correctly spelled word, TNI is not counted.
i. E.g., I wash b) Grammatically incorrect sentences
1. Ideas not ending in a punctuation (e.g., run-on sentences) are counted: E.g., I went to the movies and Ryan bought a coke and the movie was terrible and my mom drove me home and I played on the computer = 5TNI
c) When a form of "to be” (e.g., would, was, were) precedes another verb and follows an argument it would be counted as 1 TNI. For example: I was going to the park.
d) If one sentence has two verbs (e.g., I drank and ate the food) 1 TNI are recorded e) If a sentence has two arguments (e.g., I made touch downs and kick offs) 1 TNI is
recorded f) If student rewrites the story starter, TNI will not be scored g) If student does not finish writing the argument, TNI is not scored
a. E.g., I teleported and ended up at the h) When verbs are in the argument, count only ideas that can stand alone
a. E.g., I tried not to get caught = 1 TNI because I tried not to get does not make sense. Also, I tried not to caught does not make sense.
b. E.g., He said I am coming for you = 2 TNI because He said I am = 1 and Coming for you = 1.
i) HIGHLIGHT each idea
56
References
Abbott, R. D., & Berninger, V. W. (1993). Structural equation modeling of relationships among
developmental skills and writing skills in primary- and intermediate-grade writers.
Journal of Educational Psychology, 85, 478–508. doi:10.1037/0022-0663.85.3.478
Arnett, A. B., Pennington, B. F., Friend, A., Willcutt, E. G., Byrne, B., Samuelsson, S., & Olson,
R. K. (2011). The SWAN captures variance at the negative and positive ends of the
ADHD symptom dimension. Journal of Attention Disorders, 17, 152–162.
doi:10.1177/1087054711427399
Berninger, V. W., & Fuller, F. (1992). Gender differences in orthographic, verbal, and
compositional fluency: Implications for assessing writing disabilities in primary grade
children. Journal of School Psychology, 30, 363–382. http://doi.org/10.1016/0022-
4405(92)90004-O
Berninger, V. W., Mizkokawa, D. T., & Bragg, R. (1991). Theory-based diagnosis and
remediation of writing disabilities. Journal of School Psychology, 29, 57-79.
Cobb, J. A. (1972). Relationship of discrete classroom behaviors to fourth-grade academic
achievement. Journal of Educational Psychology, 63, 74-80.
Cohen, J. (1988). Statistical power analysis for the behavioral sciences. New York, New York,
Lawrence Erlbaum Associates.
Dolch, E. W. (1956). School research in reading. Elementary English, 33, 76-80.
DuPaul, G. J. (1991). Parent and teacher ratings of ADHD symptoms: Psychometric properties in
a community-based sample. Journal of Clinical Child Psychology, 20, 245–253.
doi:10.1207/s15374424jccp2003_3
DuPaul, G. J., Anastopoulos, A. D., Power, T. J., Reid, R., Ikeda, M. J., & McGoey, K. E.
(1998). Parent ratings of attention deficit/hyperactivity disorder symptoms: Factor

57
structure and normative data. Journal of Psychopathology and Behavioral Assessment,
20, 83–102. doi:10.1023/a:1023087410712
DuPaul, G. J., Rapport, M. D., & Perriello, L. M. (1991). Teacher ratings of academic skills: The
development of the Academic Performance Rating Scale. School Psychology Review, 20,
284-300.
Erdfelder, E., Faul, F., & Buchner, A. (1996). GPOWER: A general power analysis program.
Behavior Research Methods, Instruments, & Computers, 28, 1–11.
doi:10.3758/bf03203630
Fearrington, J. Y., Parker, P. D., Kidder-Ashley, P., Gagnon, S. G., McCane-Bowling, S., &
Sorrell, C. A. (2013). Gender differences in written expression curriculum-based
measurement in third- through eighth-grade students. Psychology in the Schools, 51, 85–
96. doi:10.1002/pits.21733
Flower, L., & Hayes, J. R. (1981). A cognitive process theory of writing. College Composition
and Communication, 32, 365-387. doi:10.2307/356600
Goodman, R., & Scott, S. (1999). Comparing the Strengths and Difficulties Questionnaire and
the Child Behavior Checklist: Is small beautiful? Journal of Abnormal Child Psychology,
27, 17-24. doi:10.1023/a:1022658222914
Graham, S., Berninger, V. W., Abbott, R. D., Abbott, S. P., & Whitaker, D. (1997). Role of
mechanics in composing of elementary school students: A new methodological approach.
Journal of Educational Psychology, 89, 170–182. doi:10.1037/0022-0663.89.1.170
Hier, B. O., & Eckert, T. L. (2014). Evaluating elementary-aged students’ abilities to generalize
and maintain fluency gains of a performance feedback writing intervention. School
Psychology Quarterly, 29, 488–502. doi:10.1037/spq0000040

58
Hubbard, D.D. (1996). Technical adequacy of formative monitoring systems: A comparison of
three curriculum-based indices of written expression. Unpublished manuscript,
University of Oregon, Eugene, Oregon.
Individuals With Disabilities Education Act, 20 U.S.C. § 1400 (2004).
Jackson, P. W., & Hudgins, B. (1965). Observation schedule for recording pupil attention.
Unpublished instrument, University of Oregon, Eugene.
Kent, S., Wanzek, J., Petscher, Y., Al Otaiba, S., & Kim, Y.-S. (2013). Writing fluency and
quality in kindergarten and first grade: the role of attention, reading, transcription, and
oral language. Reading and Writing, 27, 1163–1188. doi:10.1007/s11145-013-9480-1
Kim, Y.-S., Al Otaiba, S., Wanzek, J., & Gatlin, B. (2014). Toward an understanding of
dimensions, predictors, and the gender gap in written composition. Journal of
Educational Psychology, 107, 79–95. doi:10.1037/a0037210
Lakes, K. D., Swanson, J. M., & Riggs, M. (2011). The reliability and validity of the English and
Spanish Strengths and Weaknesses of ADHD and Normal Behavior Rating Scales in a
preschool sample: Continuum measures of hyperactivity and inattention. Journal of
Attention Disorders, 16, 510–516. doi:10.1177/1087054711413550
Lahaderne, H. M. (1968). Attitudinal and intellectual correlates of attention: A study of four
sixth-grade classrooms. Journal of Educational Psychology, 59, 320-324.
McMaster, K. L., Wayman, M. M., Deno, S. L., Espin, C. A., & Yeo, S. (2010). Examining
technical features of progress monitoring measures across grade levels in writing.
Research Institute on Progress Monitoring, 38, 1-34.

59
McMaster, K. L., Xiaoqing Du, & Petursdottir, A.-L. (2009). Technical features of curriculum-
based measures for beginning writers. Journal of Learning Disabilities, 42, 41–60.
doi:10.1177/0022219408326212
Nantais, M., Martin, K., & Barnes, A. (2014). Best practices in facilitating professional
development of school personnel in delivering multitiered services (pp. 71-82). In P.
Harrison & A. Thomas (Eds.), Best Practices in School Psychology: Systems-Level
Services. Bethesda, MD: National Association of School Psychologists.
National Center for Education Statistics. (2005). A first look at the literacy of America’s adults in
the 21st century. Washington, DC: U.S. Government Printing Office. Retrieved July 31,
2006, from http://nces.ed.gov/pubsearch/pubinfo.asp?pubid=2006470
National Center for Education Statistics. (2012). The Nation’s Report Card: Writing 2011
(NCES 2012-470). Washington, D.C.: Institute of Education Sciences, U.S. Department
of Education,
National Commission on Writing. (2003). The neglected “R.” Berkeley, C.A.: College Entrance
Examination Board.
National Commission on Writing. (2004). Writing: a ticket to work or a ticket out. Berkeley,
C.A.: College Entrance Examination Board.
No Child Left Behind Act of 2001, Pub. L. No. 107-110, § 115, Stat. 1425 (2002).
Puranik, C. S., Lombardino, L. J., & Altmann, L. J. (2007). Writing through retellings:
An exploratory study of language-impaired and dyslexic populations. Reading and
Writing, 20, 251–272. doi:10.1007/s11145-006-9030-1

60
Puranik, C. S., Lombardino, L., & Altmann, L. (2008). Assessing the microstructure of written
language using a retelling paradigm. American Journal of Speech Language
Pathology, 17, 107–120. doi:10.1044/1058-0360(2008/012)
Quitadamo, I. J., & Kurtz, M. J. (2007). Learning to improve: Using writing to increase critical
thinking performance in general education biology. Cell Biology Education, 6, 140–154.
doi:10.1187/cbe.06-11-0203
Samuels, S. J., & Turnure, J. E. (1974). Attention and reading achievement in first-grade boys
and girls. Journal of Educational Psychology, 66, 29–32. doi:10.1037/h0035812
Saez, L., Folsom, J. S., Al Otaiba, S., & Schatschneider, C. (2011). Relations among student
attention behaviors, teacher practices, and beginning word reading skill. Journal of
Learning Disabilities, 45, 418–432. doi:10.1177/0022219411431243
Shapiro, E.S. (2004). Academic skill problems: Direct assessment and intervention. New York:
Guilford.
SPSS Inc. (2015). SPSS Base 23.0 for Windows User’s Guide. Chicago, IL: SPSS Inc.
Swanson, J., Schuck, S., Mann, M., Carlson, C., Hartman, K., Sergeant, J., & McCleary, R.
(2006). Categorical and dimensional definitions and evaluations of symptoms of ADHD:
The SNAP and SWAN Rating Scales. University of California, Irvine. Retrieved from
http://www.adhd.net/SNAP_SWAN.pdf
Videen, J., Deno, S., & Marston, D. (1982). Correct word sequences: A valid indicator of
proficiency in written expression (Rep. No. 84). Minneapolis, MN: Minnesota University,
Minneapolis Institute for Research on Learning Disabilities.
Walker, H. M., & Shinn, M. R. (2010) Systemic, evidence-based approaches for promoting
positive student outcomes within a multitier framework: moving from efficacy to

61
effectiveness (pp. 1-26). In M. R. Shinn & H. M. Walker (Eds.). Interventions for
achievement and behavior problems in a three-tier model including RTI. Bethesda, MD:
National Association of School Psychologists.

62
Narmene Hamsho
Vita
Contact: 430 Huntington Hall Syracuse, NY 13244
Education: Syracuse University 2014 - current Department of Psychology, School Psychology Ph.D. Program
University at Buffalo, SUNY 2010-2014 Department of Psychology, B.A.