The Impact of Business Environment Reforms on New Firm...
50
The Impact of Business Environment Reforms on New Firm Registration Leora Klapper and Inessa Love * December, 2011 Abstract: This paper uses panel data on the number of new firm registrations in 91 countries to study how the ease of registering a business and the magnitude of registration reforms affect new firm registrations. We find that the costs, days and procedures required to start a business are important predictors of the number of new firm registrations. However, we find that small reforms, in general less than a 40 percent reduction in procedures or 50 to 60 percent reduction in costs and days, do not have a significant effect on new registrations. We also find important synergies in multiple reforms of two or more business environment indicators. Finally, we show that countries with relatively weaker business environments prior to reforms require relatively larger reforms in order to impact the number of newly registered firms. JEL Classification: G18, G38, L51, M13 Key Words: Entrepreneurship, Economic Development, Business Environment, Reforms * Klapper and Love are in the Finance and Private Sector Development Team in the Development Research Group at the World Bank. We thank the Ewing Marion Kauffman Foundation and the World Bank Group for financial support. This paper was prepared with outstanding assistance from Douglas Randall. Thanks to Mary Hallward- Driemer, David McKenzie, Andrei Mikhneiv and an anonymous referee for helpful comments. This paper‟s findings, interpretations, and conclusions are entirely those of the authors and do not necessarily represent the views of the World Bank, their Executive Directors or the countries they represent. Corresponding author: Inessa Love, E- mail: [email protected] Address: 1818 H St. NW, Washington, DC, 20035, Phone: 1-202-458-0590, Fax: 1- 202-522-1155.
Transcript of The Impact of Business Environment Reforms on New Firm...

The Impact of Business Environment Reforms on New Firm Registration
Leora Klapper and Inessa Love*
December, 2011
Abstract: This paper uses panel data on the number of new firm registrations in 91 countries to
study how the ease of registering a business and the magnitude of registration reforms affect new
firm registrations. We find that the costs, days and procedures required to start a business are
important predictors of the number of new firm registrations. However, we find that small
reforms, in general less than a 40 percent reduction in procedures or 50 to 60 percent reduction in
costs and days, do not have a significant effect on new registrations. We also find important
synergies in multiple reforms of two or more business environment indicators. Finally, we show
that countries with relatively weaker business environments prior to reforms require relatively
larger reforms in order to impact the number of newly registered firms.
JEL Classification: G18, G38, L51, M13
Key Words: Entrepreneurship, Economic Development, Business Environment, Reforms
* Klapper and Love are in the Finance and Private Sector Development Team in the Development Research Group
at the World Bank. We thank the Ewing Marion Kauffman Foundation and the World Bank Group for financial
support. This paper was prepared with outstanding assistance from Douglas Randall. Thanks to Mary Hallward-
Driemer, David McKenzie, Andrei Mikhneiv and an anonymous referee for helpful comments. This paper‟s
findings, interpretations, and conclusions are entirely those of the authors and do not necessarily represent the views
of the World Bank, their Executive Directors or the countries they represent. Corresponding author: Inessa Love, E-
mail: [email protected] Address: 1818 H St. NW, Washington, DC, 20035, Phone: 1-202-458-0590, Fax: 1-
202-522-1155.
1
1. Introduction
Entrepreneurship is essential for the continued dynamism of the modern market economy
and a higher entry rate of new businesses can foster competition and innovation (Klapper, et al.,
2006; Ciccone and Papaioannou, 2007; Aghion, et al., 2009). To promote private sector growth,
many countries have focused on simplifying the registration process, seeking to reduce the costs,
days and/or procedures required to formally register a business.
A methodology for measuring the effectiveness of the regulatory framework for firm
registration was developed by Djankov, La Porta, Lopez-de-Silanes, and Shleifer (2002). Since
2003, the World Bank‟s annual Doing Business report has used this methodology to quantify the
registration process in over 170 countries in its “Ease of Starting a Business” section.1 An
outstanding question, however, is whether, and to what degree, there exists an economically
meaningful relationship between the costs, days and procedures to start a business and the actual
number of new firms that register each year. Given the widespread recognition of the importance
of business environment reforms2, it is surprising that there is little research, and no cross-
country panel analyses, on the real effect of these regulatory reforms. Our paper aims to address
this gap in the literature by examining the impact of institutional reforms on the number of new
firms registered.
Understanding the regulatory environment that promotes entrepreneurship is necessary to
successfully identify appropriate policies to foster entrepreneurship in local economies. In this
paper we empirically investigate the relationship between the regulatory ease of registering a
business and actual new business registrations. Next, we explore the magnitude of reform in
1 Reports are available on-line at: www.doingbusiness.org.
2 For instance, a 2008 report of the Multilateral Donor Committee for Enterprise Development states, “Reforming
the business environment is a priority for development agencies and governments because of the significant
influence the business environment has on the development of the private sector and therefore on economic growth
and the generation of livelihoods and jobs.” (DCED, 2002, p.3)
2
entry regulation required for a significant impact on new firm registration. A priori, it is not clear
what magnitude of reduction in costs (or other parameters such as days or procedures) is
necessary to cause a significant impact on firm registration. In other words, what exactly
constitutes a reform? Is a 20 percent reduction in the costs of registration sufficient or is a 50
percent reduction necessary to encourage a significant number of firms to register? We further
examine the effect of simultaneous and sequential reforms across measures of entry regulation.
Finally, we examine how the impact of reform depends on the level of regulation prior to the
reform.
We use a new dataset that is uniquely suited for this purpose: a cross-country, time-series
panel dataset on the number of newly registered limited liability firms. We supplement this
dataset with information from Doing Business reports on the cost, days and number of
procedures required for the registration of new companies. Importantly, both datasets focus
comparably on only limited liability firms.
Our results show that the costs, days and procedures required for business registration are
important predictors of new firm registration over time. However, on average, small reforms - in
general less than 40 percent for procedures and 50 to 60 percent for costs and days - do not have
a significant effect on new firm registration. In addition, reforms in multiple indicators (e.g. the
cost and number of procedures required to register a business) have a larger impact on business
registration and simultaneous reforms have a larger impact than sequential reforms. Furthermore,
we find that a country‟s initial conditions matter: Countries that start out with relatively higher
initial costs need larger reforms to result in a significant increase in number of new registered
firms.

3
We offer a simple model to motivate our empirical strategy. The model demonstrates
how some reforms could be classified as small or large depending on the relative magnitude of
the costs and benefits of registration. Our results imply that in countries with high initial
registration costs, the benefits of registration are significantly below the costs of registration,
likely because of limited access to finance or rigid labor markets. This is consistent with Djankov
et al. (2002) who show that high registration costs do not serve public interest, but only benefit
politicians and bureaucrats.
The results in our paper suggest non-trivial economic magnitudes on the number of
newly registered businesses. For example, we find that across OECD countries in our sample, on
average, a reduction of 50 percent or more in the number of procedures, days or costs leads to an
average increase in the number of new registrations of 14, 19 and 30 percent, respectively. These
results are remarkably consistent with previous studies of registration reforms in two different
OECD countries. A reform in Mexico that decreased the number of procedures by about 60
percent resulted in a 5 percent increase in the total number of firms, which translates to a 24
percent increase in new registrations in the municipality of Guadalajara (Bruhn, 2008). A reform
in Portugal that reduced costs and days by 50 percent or more resulted in an increase in firm
startups of about 17 percent, mostly among “marginal” firms that would have been most deterred
by burdensome regulations, such as small firms in low-tech sectors (Branstetter, et al., 2010).
We also use a dataset of newly registered businesses (including non-LLC‟s) for OECD
countries to show that our results are robust to an alternative sample. In addition, we find that in
this sample, registration reforms have the largest effect on small, service-sector firms, consistent
with Branstetter, et al. (2010).

4
Our analysis is motivated by earlier studies that find that new firms are the ones most
likely to grow (Lingelbach, et al., 2005; Johnson, et al., 2000) and to create new jobs (Audretsch,
et al., 2006; McMillan and Woodruff. 2002). For example, studies using longitudinal data sets on
the evolution of firm formation document that economic growth in both Canada and the U.S. is
driven by new formal business entry rather than by the growth of existing firms (Brander, et al.,
1998; Haltiwanger, 2009).
Earlier studies also show that entrepreneurship can foster competition and economic
growth (Barseghyan, 2008; Klapper, et al., 2006; Djankov, et al., 2006; Black and Strahan, 2002;
Hause and Du Rietz, 1984) and a reduction in informality (Antunes and Cavalcanti, 2009; Dabia-
Norris, et al., 2008). Previous cross-country studies have found that new firm creation is
significantly related to country-level indicators of economic development and growth, the quality
of the legal and regulatory environment, ease of access to finance, and prevalence of informality
(Klapper, et al., 2010; Ardagna and Lusardi, 2010).
Our paper is most closely related to the literature showing that costly entry regulations
may impede the setting up of businesses and stand in the way of economic growth (De Soto,
1990; Djankov et al., 2002,Klapper, et al., 2006; Kaplan, et al., 2006; Bruhn, 2011). For
example, a study of entry regulations across 34 European countries shows that onerous entry
regulations are related to lower firm entry, specifically in industries with higher average entry
rates (Klapper, et al., 2006).
Some studies, however, have cast doubt on the relationship between Doing Business
measures and the real world business environment as perceived by actual business owners
(Hallward-Driemeier and Pritchett, 2010). This paper helps to reconcile this recent skepticism

5
with an analysis of the relevance of Doing Business measures using a real-world output: new
firm registrations.
Importantly, this paper offers policymakers empirically-based insight into the impact of
the reform process on new firm creation. For instance, insufficiently large reforms may not have
the intended impact on firm registrations, resulting in a potential misallocation of money and
political capital. These results can help policymakers to design interventions with the biggest
impact on private sector growth.
The paper proceeds as follows. Section 2 presents our model and empirical
methodology. Section 3 discusses our data and summary statistics, Section 4 shows our results
and Section 5 concludes. Appendix 2 presents our results for an alternative sample of OECD
countries.
2. Methodology
2.1. Theoretical intuition
We begin with a simple model of reforms to formal business registration that guides our
empirical strategy. Assume there are benefits for an entrepreneur to operate a formally registered
firm (as compared to not starting a business or operating informally). This benefit might be
increased access to finance, a sales tax ID to attract larger or foreign customers, better contract
terms with suppliers or customers or a reduced risk of government sanctions. Suppose the total
sum of these benefits can be represented by monetary amount b.
On the other side, there are costs to registering a formal business, such as official and
non-official payments to start and operate the business, personnel and managerial time spent
dealing with required procedures and minimum capital requirements that need to be met.

6
Suppose the total cost is represented by c, which also includes the monetary value of employee
time and the time value of any delays. Clearly, individuals will only chose to register their firms
when the total benefits of registration exceed total costs, i.e. c < b.
Since benefits can vary from firm to firm, it follows then, that there should be a negative
relationship between the costs of registering a business and the number of new businesses
registered. This negative relationship is our first testable hypotheses.
Suppose there is a reform that reduces the costs of registering a business. This could be a
reduction in required direct fees, or a reduction in the number of procedures, that can be
translated to a reduction in costs because of personnel time savings. Assume that before the
reform the registration costs are equal to c0 and after the reform the total costs are c1, which is
lower than c0 (i.e., c1 < c0). The reform will only lead to new formal sector registrations when
post-reform costs fall below the benefits to registration, i.e. c1 < b.
Put another way, the reform might be effective in inducing new business registrations or
ineffective, depending on the relative magnitude of parameters b, c0 and c1. Specifically, there
are two possible cases, which we refer to as a “small reform” or a “large reform”:
Small reform: b < c1 < c0
Large reform: c1 <b < c0
In other words, if the reform is “small” then the reduction in costs is insufficient to fall
below the benefits, and therefore we should observe no significant increase in new firm
registrations. In the case of a “large” reform, the costs fall below the benefits and we should
observe a significant increase in new registrations. An important assumption in our model is that
only the registration costs change, while other costs or the benefits remain unchanged. For
example, we assume that the government will not simultaneously raise taxes on formally
registered businesses as it reduces the costs of registrations.

7
Clearly, different firms will receive different benefits from formal registration. In other
words, instead of a single benefit parameter there is a distribution of firms with various benefits.
In this case b can denote the average benefit. If the distribution of benefits is non-uniform - i.e. if
there is some mass around the average benefit, such as in a normal distribution, the relationship
between costs reduction and new registration will be non-linear. In this case the reform will be
large if the costs fall below the average benefit. Thus, there would be some threshold before
which reforms have little or no impact, and after which reforms have a significant impact on new
firm registrations.
So far we have shown that the impact of a reform will depend on both the benefits of
registration and the relative reduction in costs. In addition, the impact of a reform is likely to
depend on the initial conditions in a country. Suppose there are two groups of countries – one
with high initial costs and the other one with low initial costs. If in a country with high
registration costs the benefits are also very high, then even a small change in costs may induce a
significant number of new registrations. In this case, the benefit is just below the pre-reform
costs. This case is illustrated in Figure 1, Panel A. Here an identical level drop in costs in both
groups of countries results in similar increases in new registrations. In terms of percent changes,
countries with higher initial costs will need smaller percent changes to induce entrepreneurs to
register than countries with lower initial costs. In other words, in such an environment even a
small change in costs will be welcomed by severely constrained local firms.
Alternatively, higher registration costs might be symptomatic of overall weaker business
environments and fewer benefits to formal firms. For instance, in countries with less developed
financial systems - which often have high registration costs - the benefit of formal sector
financing might be less accessible. In this case, the average benefits are significantly below the
8
costs. This hypothesis is represented in Figure 1, Panel B. In this case, the benefits in both
groups of countries are pictured at about the same level, while the initial costs are significantly
higher in the high-costs group. Therefore a much larger level drop in costs is needed for costs to
fall below benefit in a high initial cost environment. Note that if the change is measured as a
percent change, the drop may be of similar magnitude (i.e. a 50 percent change in the high-cost
environment translates into a much larger level change than it is in a low-cost environment).
Thus, measuring reforms as a percent change will serve as a “normalizing” function with respect
to the initial business environment levels. Our paper offers a way to empirically test these two
alternative hypotheses.
To summarize, our model demonstrates that when registration costs are significantly
reduced, the cost of registrations for some firms will move below the expected benefits of formal
sector registration, and more entrepreneurs will chose to register under the new reformed regime.
The empirical tests that follow will identify the magnitude of reforms necessary for a significant
increase in the number of newly registered firms.
2.2. Empirical Strategy
First, we test the predicted negative relationship between regulatory barriers in starting a
business and registrations. To do that we run a simple model of new firm registrations on our
regulatory indicators, while capturing any country-specific unobservable factors with country
fixed effects.
Second, we investigate what magnitude of reforms produce the most significant changes
in newly registered businesses. Specifically, we measure reforms (the move from c0 to c1) as the
percent change over time in the Doing Business “Starting a Business” parameters. We construct

9
various indicators of “reform” along the percent change continuum, using discrete cutoffs; for
instance, countries that reduced costs by 20 percent or more (“Reform_20%”), countries that
reduced costs by 30 percent or more (“Reform_30%”) and so on. For each of the cutoffs, we
classify countries as treated (reformers, defined as change below the cutoff) or controls (non-
reformers, change above the cutoff).
Our empirical strategy here is to use a difference-in-difference estimation to test the
effect of one indicator of reform (e.g. “Reform_20%”) on new firm registration. We then
compare results for different cutoff points: If the cutoff point is correctly classified (i.e. it is close
to the “true” magnitude of reform seen in the data), the difference-in-difference estimation will
produce the most significant and largest in magnitude estimates of the impact. However, we
should observe a lower impact of misclassified reforms.3 In other words, this methodology
allows us to identify which cutoff points lead to the largest and most significant increases in
formally registered businesses.
3. Data and Descriptive Statistics
3.1 Data on New Firm Registrations
For our dependent variable, we use data on the number of new firms registered in the
calendar year. The data is collected directly from the local Registrar of Companies, which is the
entry point for entrepreneurs joining or transitioning to the formal sector in most countries, or
3 Thus, if a true reform, i.e. a change that makes cost fall below benefits is a reduction in 20% of costs, but we
classify a country as a reformer only if a reduction of 40% or more is observed, several countries with actual
reforms, i.e. those in the range of 20-40%, will be classified as non-reforms and hence the difference between
reformers and non-reformers will be muted. This is an example of Type I error, when true reformers are
misclassified as non-reformers. On the other hand, if a true reform is 40%, but we set our reform dummy for 20%, a
number of countries in the range of 20-40% will be classified as reformers, when in reality they are not. This is an
example of Type II error. In either case, we should observe the most significant results the closer our definition of
the reform dummy is to the magnitude of the actual reform.

10
other statistical offices, and are not based on surveys or estimations.4 The data includes only new
corporations, which are defined here as private companies with limited liability. Notably, this is
the same definition used by the World Bank‟s Doing Business report. It is also the most
prevalent formal business form in most countries around the world (Doing Business, 2010).5
The main variable of interest is new business “entry density”, calculated as the ratio of
newly registered limited liability firms per 1,000 working age population (those ages 15-64).6
The final dataset includes an unbalanced panel of 494 observations from 91 countries over the
six-year period 2004 to 2009. Figure 2, left panel, shows the distribution of entry density across
countries; it has a minimum value of 0.0021 (in Niger) and a maximum value of about 10.7
Entry density varies significantly by income groups: it ranges from 4.21 in high-income
countries to less than one in lower-middle and lower income countries (Figure 2, right panel). In
other words, there are on average about four limited-liability firms registered annually per 1,000
working age individuals in industrialized countries, as compared to about one firm per 1,000
individuals in developing countries.8
3.2 Business Environment Indicators
Our indicators of business environment regulations come from the Starting a Business
section of the World Bank‟s Doing Business database, which provides country-level indicators to
measure the efficiency of the business registration process. The first indicator, Starting Costs,
4 For additional information on the methodology, see Klapper and Love, 2010.
5 We exclude countries identified by the IMF (Zorome, 2011) as off-shore financial centers, since information
provided by these countries likely reflects a nontrivial number of shell companies, defined as companies that are
registered for tax purposes, but are not active businesses. For example, in 2007 the British Virgin Islands had 77,022
newly registered corporations, which translates to approximately four new firms for each working age individual. 6 The complete database and list of sources is available at: http://econ.worldbank.org/research/entrepreneurship.
7 We restricted entry density to be less than 10, which is equivalent to about the 98
th percentile of the original
distribution. Effectively this excludes two countries that are outliers on the number of new registrations (Iceland and
New Zealand). 8 Summary Statistics, by country, are shown in Appendix 1.

11
captures all official fees and additional fees for legal and professional services involved in
incorporating a business, and is measured as a percentage of the economy‟s income per capita.
The second indicator is the Number of Procedures necessary to incorporate a business. Third,
Starting Days, measures the time required to start a business, which is defined as the number of
days that incorporation lawyers indicate is necessary to complete all required procedures with
minimum follow-up with government agencies and no extra payments. Fourth, paid-in Minimum
Capital Requirement captures the amount that an entrepreneur needs to deposit in a bank or with
a notary before or shortly after registration and is recorded as a percentage of income per capita.
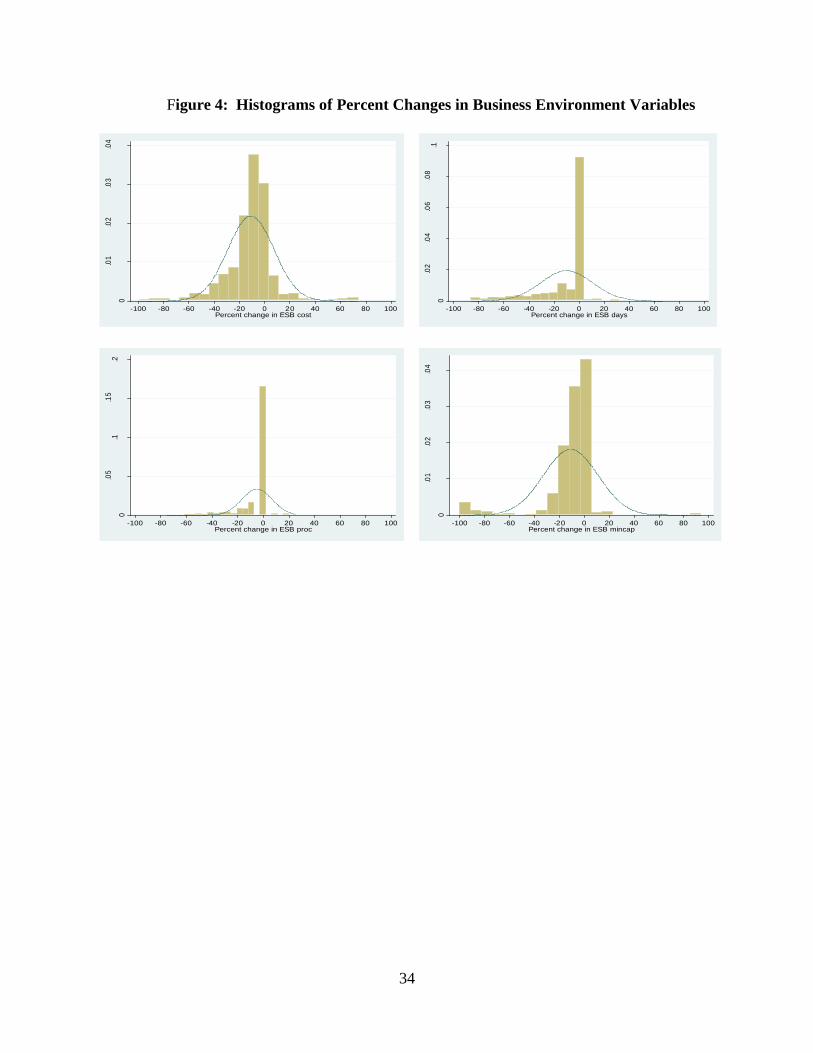
Figure 3 shows the relationship between the explanatory variables and entry density. Figure 4
shows the distributions of the annual percent change in these four explanatory variables.
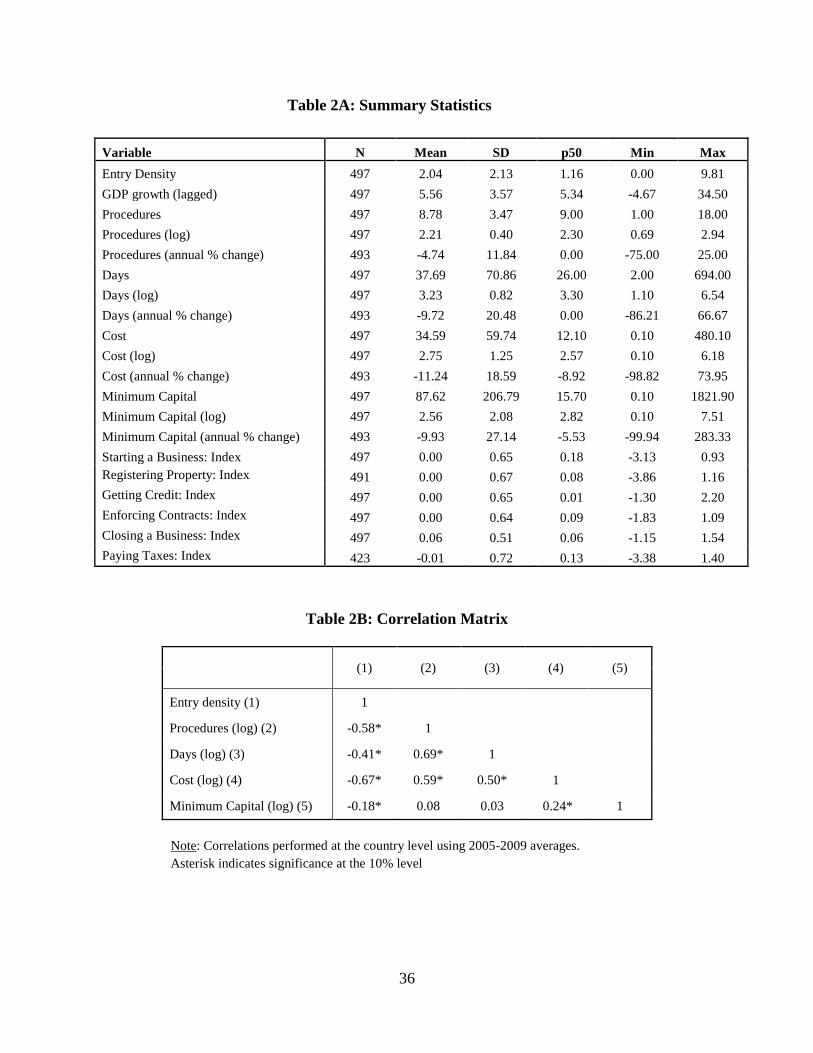
Complete variable definitions and summary statistics are shown in Tables 1 and 2. For
all four indicators of Starting a Business, the mean of the annual percent change is negative,
suggesting that, over time, most countries have been successful in lowering registration costs,
reducing days, procedures and capital requirements.
3.3 Classifying Reforms
Table 3 shows the number of reformers we obtain with various reform classifications
described above. For example, for a 20 percent cutoff for cost reform we count in our dataset 56
reformers. Clearly, as we increase the cutoff, we ask for a more significant change and the
number of reformers declines to 41 with at least a 30 percent drop in cost, 28 with a 40 percent
cutoff, 16 with a 50 percent cutoff, and only 7 with a 60 percent cutoff. We do not explore larger
(i.e. more negative) cutoffs because they produce insufficient numbers of reformers. We observe
similar trends across the different business environment variables; increasing the cutoff result in

12
a smaller number of reforming countries. For the purpose of our regression analysis, we look at
only the impact of the first reform for each of our definitions, i.e. we consider a country a
„reformer‟ for all subsequent years following the first reform.9
Often a country that is reforming the business registration process will make changes in
the process along several dimensions. For example, as the number of procedures goes down, the
length of the process will also go down, and often the costs will be reduced as well. It is possible
that when several changes occur simultaneously, smaller changes along each dimension will
produce significant results, while a single parameter change will not. Using the intuition of our
model, the aggregate cost reduction as a result of two reforms may fall below the benefit and the
joint reform will be identified as “large,” while each individual reform is independently too
“small.” We investigate this hypothesis by defining simultaneous reforms. In this case a country
is classified as a reformer if at least two reforms occur simultaneously. We also look at cases in
which three reforms occur simultaneously, although these are very rare.
In addition, reforms may occur in subsequent years. For example, the costs may be
reduced in one year and in the next year the number of procedures or days will be reduced.
Similarly, a single change by itself may be insufficient to induce significant number of new
registrations, but when the second change occurs, there will be cumulative effect that will make a
difference. To test this assumption we define sequential reforms. In other words, for each cutoff
we only classify a country as a reformer when two or more reforms with a given cutoff occur
sequentially. For example, at a 20 percent cutoff, a country is not classified as a reformer when
the first reform occurs. However, when a second 20 percent reform occurs, the country is
classified as a reformer under our “two sequential reforms_20%” definition. Similarly, for three
9 Note that since our data is a panel, a country can be identified as a reformer in more than one year - but the number
of countries with repeated reforms is rather small. For example, for a 50 percent cutoff we only have one country
with a repeated reform for costs, one country for procedures, six for days and nine for minimum capital.

13
sequential reforms a country is only classified as a reformer only after three reforms occur within
our sample frame.
Table 4 presents the number of countries classified as reformers according to each of
these different definitions. Column one shows the number of “reformers” classified for each
cutoff if any one of the four business environment measures previously discussed fell below the
cutoff in any given year. We get 78 “reformers” by this definition at a 20 percent cutoff and 45
at a 50 percent cutoff.
In Column 2 we classify a country as a reformer if two or more reforms occur
sequentially in a country. These two reforms could be any of the four measures discussed above,
i.e., it could be reform of days and procedures, or reform of cost and days, or any other
combination. We get fewer countries classified as reformers in the case of two reforms: 66 with
cutoff of 20 percent and only 24 with cutoff of 50 percent. Clearly, this is stricter definition then
the one used in column 1 and fewer countries fit this new criterion. In column 3 we tighten the
definition even further and require that two or more reforms occur simultaneously, in the same
year. In other words, column 3 is a subset of reformers classified in column 2. We get 50
countries at a 20 percent cutoff and only 14 countries at a 50 percent cutoff.
Column 4 shows the number of reformers when we change our definition to require that
at least three reforms occur in a country sequentially, i.e. the first reform in year one, the second
in year two and the third reform in year three (or the first reform in year one and the second and
third reform simultaneously in a future year). We only classify a country as a reformer when we
observe the third change happening. This definition is stricter than the one used in column two,
but is not necessarily stricter than the one used in column 3. We get about the same number of
reformers in columns 3 and 4.
14
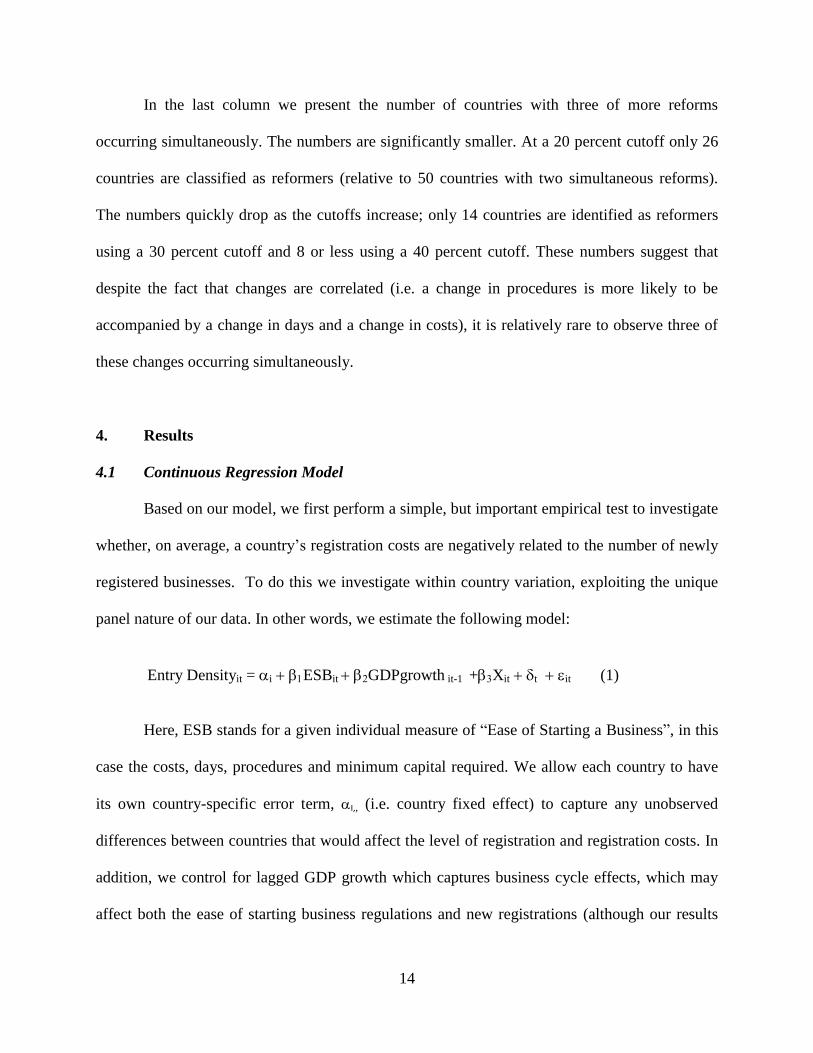
In the last column we present the number of countries with three of more reforms
occurring simultaneously. The numbers are significantly smaller. At a 20 percent cutoff only 26
countries are classified as reformers (relative to 50 countries with two simultaneous reforms).
The numbers quickly drop as the cutoffs increase; only 14 countries are identified as reformers
using a 30 percent cutoff and 8 or less using a 40 percent cutoff. These numbers suggest that
despite the fact that changes are correlated (i.e. a change in procedures is more likely to be
accompanied by a change in days and a change in costs), it is relatively rare to observe three of
these changes occurring simultaneously.
4. Results
4.1 Continuous Regression Model
Based on our model, we first perform a simple, but important empirical test to investigate
whether, on average, a country‟s registration costs are negatively related to the number of newly
registered businesses. To do this we investigate within country variation, exploiting the unique
panel nature of our data. In other words, we estimate the following model:
Entry Densityit = iESBit GDPgrowth it-1 +Xittit (1)
Here, ESB stands for a given individual measure of “Ease of Starting a Business”, in this
case the costs, days, procedures and minimum capital required. We allow each country to have
its own country-specific error term, I,, (i.e. country fixed effect) to capture any unobserved
differences between countries that would affect the level of registration and registration costs. In
addition, we control for lagged GDP growth which captures business cycle effects, which may
affect both the ease of starting business regulations and new registrations (although our results

15
are not sensitive to this control). We also include time dummies to control for any global changes
in the macroeconomic environment that may affect registrations in all countries. This is
important because our data covers the period of the global financial crisis. For example, Klapper
and Love (2010) show that number of new registrations dropped significantly during 2009 in
most countries. The time dummies will capture the average drop in registration in the year of the
crisis, relative to previous years, and eliminate the confounding impact of the crisis.10
In
addition, the time dummies will also capture global changes in registration trends. Thus, Klapper
and Love (2010) show that number of registered businesses is increasing overtime; in other
words there is a trend toward more formalization. If firm registrations are increasing in all
countries because of this trend, we may erroneously attribute the impact to reforms (which
capture the later years of the sample) to the increasing registration trend.
An important consideration is to isolate the impact of business registration reforms from
other reforms that may be happening at the same time. While reforms to business registration
should have a first order, direct impact on the number of registered businesses, other reforms,
such as improved access to finance or better contract enforcement, may also affect the number of
newly registered businesses. Therefore, in our model we control for a vector X, which represents
other features of the business environment. Specifically, we add indices measuring Doing
Business indicators for Registering Property, Getting Credit, Enforcing Contracts and Closing a
Business (described in Table 1).11
We estimate this model with errors clustered on the country
level to capture any serial correlation of errors within country.12
10
In addition, we test robustness of our results to eliminating the year 2009 from our regressions all together. This
significantly reduces our sample (by about 1/6) and some of the results become statistically weaker, but the general
patterns remain the same. 11
In separate regressions (available upon request) we also control for taxation by including the Doing Business
index of Tax regime; it is important to control for changes in tax policy given that firms view taxes (including tax-
compliance costs) as the major obstacle to registering (La Porta and Shleifer, 2008). However, our sample is
reduced by one year when the tax index is included (from 491 to 418 observations). The results for procedures and
16
Results are presented in Table 5. Columns 1-4 present our results without controls, and
columns 5-8 present results including controls for other business environment indicators. The
three main variables - costs, days and procedures - are all significant predictors of entry density
in both specifications. Minimum capital requirement has a predicted negative sign, but is not
significant at conventional levels. Including indices for other features of the Doing Business has
no material impact on our results, and the indices themselves are not significant in any of the
specifications. These results suggest that unlike business registration regulations, other
characteristics of the business environment do not have a first order impact on business
registration. Of course our results do not suggest that these reforms are not important – they are
likely important for other outcomes besides firm registration.
To summarize, our results so far show that there is a negative and significant relationship
between the costs of registering a business and the number of new firm registrations.
4.2 Reform Regression Model
In this section we investigate the impact of reforms to the registration process on business
registrations. Specifically, we test which magnitude of reforms produces the largest change in
business registrations. We run the following regressions:
Entry Densityit = iReformit GDPgrowth it-1 +Xittit (2)
Here, “Reform” is equal to one for all countries classified as reformers using each of the
cutoffs discussed above. This dummy is equal to one for the year in which reform occurred and
days remain significant at the same levels as reported, while the result for costs drops to about 15% significance,
likely as a result of the smaller sample. 12
Our results are robust to using one year lags of business environment variables to allow for delayed effects of
costs on new firm registrations (available upon request).

17
all years after the reform. In essence this is a difference-in-difference approach, in which
“treated” countries are the countries that have been classified as reformers versus controls (non-
reformers), and the time is defined as before and after the reform.
The main difference with the continuous framework discussed in the last section is that
each reform is treated as a discreet event, which is allowed to have a lasting impact during the
years subsequent to the reform. In contrast, in the previous section we only considered the
contemporaneous relationship between the level of business registration and the level of new
firm registrations.
Again, we estimate this model including lagged GDP growth, which ensures that changes
in new registrations are due to the specific reforms rather than business cycle effects, country and
year fixed effects and errors clustered on the country level. In addition, to capture the impact of
other features of the business environment, we add the same vector of control variables as in the
previous model: Registering Property, Getting Credit, Enforcing Contracts and Closing a
Business.13
4.3 Single Reform Results
Table 6 contains our main regression results. Each cell in the table reports the coefficient
of a separate regression; to save space, we only report the coefficient for the reform variable (i.e.
coefficient from model 2). We observe that for a cost reform to be effective, the costs need to
be reduced by at least 50 percent relative to the pre-reform level. Our result is similar for the
impact of a reduction in the number of days. The largest impact for costs and number of days is
13
In separate results, not reported, we add taxes as an additional control; although this reduces our sample by one-
year, our results remain virtually unchanged.

18
observed for a 60 percent reduction, but in this case only 7 countries are classified as reformers
in the case of costs and 23 for number of days (Table 3).
However, even a small change in the number of procedures, such as a 20 percent
reduction, produces significant results. The magnitude and significance of the procedures reform
coefficients peak at 40 percent. However, with higher cutoffs, such as a 50 or 60 percent, we
misclassify actual reforms of lower magnitude, and hence the size of the coefficient drops (see
the discussion of Type I errors in footnote 3). This does not imply that larger reforms are
ineffective. It simply suggests that in the case of procedures even smaller reforms are significant,
with an optimal reduction of about 40 to 50 percent. For minimum capital requirements we find
that a 20 percent reform, as well as 40-60 percent reforms, yield significant coefficients.14
To gauge the economic magnitude of these results in a way that is comparable with
previous literature we convert the increase in new density (our main measure, which is the ratio
of new firms to total population) to the percent increase in new registrations.15
The increase in
new registrations varies from country to country, depending on actual pre-reform number of new
registrations and the local population. We focus on OECD averages for comparability with
previous studies. We find that on average across OECD countries in our sample, a reduction of
50 percent or more in the number of procedures leads to an average increase of 14 percent in the
number of new registrations, while similar reductions in the number of days and costs lead to an
average 19 percent and 30 percent increase in new registrations of limited liability firms,
14
The results on minimum capital are somewhat weaker throughout the paper, perhaps because many countries do
not impose minimum capital requirements or because these requirements are not binding. In addition, the changes to
minimum capital requirements are often discrete in which they are completely eliminated, rather than reduced. This
is visible on the distributions of changes to minimum capital, which has significant density in the left tail of the
distribution. 15
We calculate the increase in new registrations by taking actual new density in a country, add the reform
coefficient, which shows an increase in new density as a result of a reform, for example at 50 percent reform we
obtain 0.23 for procedures or 0.35 for days and 0.57 for costs (Table 6). Then we multiply these new densities by
population to obtain new registrations after the reform and calculate a percent change in new registrations.

19
respectively.16
These results are remarkably consistent with previous studies of registration
reforms in two different OECD countries, as discussed in the introduction (see Branstetter, et al.,
2010, Bruhn, 2008, Bruhn 2010).17
4.4 Simultaneous and Sequential Reform Results
Next we investigate the impact of several reforms occurring simultaneously or
sequentially. Table 7 presents our results. In the first column a country is defined as a reformer if
any of the four business environment measures change by the percent specified in each cutoff. In
essence it parallels results in Table 6, but now lumps all reforms together in one measure. We
observe that if the reform is defined as a change in any of the four variables, the only significant
results are obtained with a 50 percent or 60 percent cutoff. Thus, a country must change one of
the four measures by at least 50 percent to result in a statistically significant increase in
registrations.
Column 2 presents results for two reforms that can occur either in the same year or in
subsequent years (i.e. sequentially). We observe that in this case even a 40 percent reduction in
the underlying measures is sufficient to produce a significant impact. Thus, if more than one
reform is occurring in a country, the magnitude of each of the reforms can be smaller because of
the synergistic effect.
We observe similar results for two reforms occurring simultaneously (column 3),
although the magnitudes of the coefficients are slightly larger for simultaneous reforms. For
16
As an additional robustness check, we also evaluate the impact of “negative” reforms, which refers to instances in
which starting a business measures increase. Though the sample size for these reforms is very small (generally less
than 10, even at 20 percent), we do observe a significant relationship between increases in procedures and decreases
in entry density (results available upon request). 17
Kaplan, et al. (2006) also study the impact of the same Mexican reform and find a 4 percent increase in the
number of newly registered firms. However, Bruhn (2011) argues that they underestimate the true impact because
the authors use data that does not include firms without employees or firms that fail to formally register their
employees for Social Security benefits.

20
example, for a 50 percent cutoff the coefficient on simultaneous reforms is 0.72, while the
coefficient on sequential reforms is 0.55. Even larger differences are observed for 60 percent
cutoff: 0.62 with two sequential reforms and 1.05 with two simultaneous reforms. This suggests
that there is some advantage in two reforms occurring simultaneously rather than sequentially.
Next, we investigate the impact of three reforms occurring sequentially in column 4. We
find that even a 30 percent reduction in three out of four measures results in a significant impact
on number of registered businesses. This further confirms the synergistic impact of reforms as
when three changes are occurring, each individual change can be smaller in magnitude than in
the case of single or double reforms. Thus, in combination even smaller reforms produce a
significant outcome.
The last column presents our results for three simultaneous reforms. The results are
similar to three sequential reforms, but the coefficients again are larger for the comparable
cutoffs. For example, at 30 percent cutoffs the three sequential reforms produce a change in 0.35
in entry density, while three simultaneous reforms produce a change of about 0.59, almost twice
as large. The results for 50 percent and 60 percent changes are excluded since there are only 5
and 2 countries, respectively, classified as reformers using this definition.
The coefficients in Table 7 also suggest that simultaneous and sequential reforms have an
economically significant impact on new firm registration. For example, for our sample of OECD
countries, two simultaneous reforms of at least 50 percent result in a 38 percent average or 22
percent median, which is consistent with Branstetter, et al. (2010) who study a reduction in both
procedures and time.
An important consideration is that multiple reforms – either sequentially or
simultaneously – might suggest that these reforms are part of a larger private sector reform
21
package. However, our results in Table 7 include controls for the four measures of the Doing
Business Environment discussed above, which mitigates this concern.
4.5 Sensitivity to Pre-reform Business Environment Levels
In this section we investigate whether the impact of reforms varies with the pre-reform
level of the business registration environment. In other words, we address the question of how
initial regulatory conditions affect the impact of reforms. As we discussed in section 2.1, our
model predicts two alternative scenarios in regard to the impact of initial costs. The first scenario
holds if in high initial costs environment the benefits are also relatively high. In this case even a
small change will be welcomed by severely constrained entrepreneurs. The second scenario is
that in high initial cost environments benefits are significantly below the costs and hence
entrepreneurs need larger changes to motivate them to register. While we cannot observe the
benefits directly, we can test these alternative hypotheses with the interaction of our reform
measures with initial conditions. Specifically, we use the following model:
Entry Densityi = iReformit Reformit*Pre-reform_leveliGDPgrowth it-1
+Xit + dtit (4)
The pre-reform level is defined as the level of business environment just a year before the
reform (again, we only consider first reforms). Thus, it is not time-varying (hence the subscript i)
and in the regression the level is subsumed in the fixed effects. In other words, this specification
allows us to investigate whether the same magnitude reform has more or less significant impact
with different pre-reform levels. We measure the pre-reform level of the business environment as
a combination of the four indicators of starting a business (cost, days, procedures and minimum
capital) and construct an average index of these indicators (standardized before averaging),

22
which we refer to as “ESB Index”. This index is constructed such that higher values indicate a
better business environment (i.e. lower costs, days, procedures and minimum capital). This
variable is approximately normally distributed with mean about zero and standard deviation
about one.
Table 8 presents the results for single variable regressions (i.e., matching those in Table
6). Once again each cell (of 4 rows each) is a single regression but now we report two
coefficients – the reform coefficient and the interaction of reform with pre-reform levels. We
observe that for almost all cutoff points and all four measures, the interactions with pre-reform
levels are significantly positive, meaning that better pre-reform indicators of the regulatory
environment for starting a business are associated with a larger magnitude of the reform. Thus, a
country with weak pre-existing business environment levels needs a larger reform to achieve the
same impact on the number of registered businesses than a country with strong business
environment.18
Our results show that for small reforms to the number of days or costs of starting a
business (i.e. reforms of 20 to 40 percent) the level effect of reforms is not significant, while the
interaction is positive. We interpret this to mean that small reforms are only effective in countries
with above average pre-reform business environments (i.e. with ESB index above zero). Larger
reforms (of 50 percent decline in days or costs) are effective even in countries with below
average business environment (because the coefficients and interaction are both significant), but
their effectiveness is lower in countries with weaker starting position (i.e. the interaction is
positive and significant for coefficients indicating at least an improvement of 50 percent).
18
Interaction results for multiple reforms are not reported to save space, but they are similar to single reform results
and most of the interactions are significantly positive.

23
For reductions in the number of procedures, we find, as before, that even small reforms of
20 or 30 percent are effective in most countries (except for the very worst initial conditions), but
the effect is larger in countries with higher pre-reform ESB index (i.e. better initial conditions).
To summarize, these results suggest that countries that start out in a disadvantaged
position (higher costs, more procedures and longer time) need larger reforms to achieve the same
impact on the number of registered businesses as countries that have relatively better ex-ante
business environments. In light of our model, these results suggest that in countries with high
registration costs (or long delays or a large number of procedures), the benefits of registrations
are significantly lower than the existing costs for a large number of entrepreneurs. These results
are inconsistent with the “public interest” theory of regulation and the hypothesis that countries
have high registration costs because there are high benefits of registrations, and instead support
the “public choice” theory, which suggests that high registration costs exist to benefit bureaucrats
and politicians (see Djankov et al., 2002).
4.6. Differences in Levels
So far our measures of reforms were constructed based on the percent change in the
underlying variables. A valid question arises as to whether the percent change is the most
relevant metric by which to gauge reform effectiveness or whether simple level differences
would provide more intuitive markers. For example, the question one might ask is what would be
the impact of the change in a given number of days (such as a reduction of 30 days) or a change
in a given number of procedures (for example, the elimination of two procedures). However, a
change of 2 procedures would mean a different thing, both numerically and economically, in a
country that starts out with 5 procedures (the average in OECD countries) or the one that starts

24
out with 14 procedures (e.g. Argentina). In other words, as we demonstrated in the previous
section, the initial conditions matter. Nevertheless, as an additional robustness test, we reproduce
our results using changes in levels of the underlying variables, rather than percent changes.
To construct our reform dummies in a way that can be comparable across countries, we
first generate changes in levels in each of our variables and then define our dummies in terms of
the percentile cutoffs. For example, p5 reform is defined as a reform for any change in levels that
is below 5th
percentile (since the reform is a negative change, this will capture the largest
negative changes). Similarly, we define p10 as 10th
percentile change, and so on up to 25th
percentile.
Table 9, Panel A shows the distributions of level changes and percent changes for two
groups of countries: the countries that start with relatively high ESB (i.e. those above the median
Ease of Starting a Business in our sample) and those that start with low ESB (i.e. below the
median in our sample). The table shows that reforms defined using percent changes have similar
distributions in both groups of countries. For example, the 5th
percentile of cost reform defined as
percent change is about 43 percent in high ESB countries and 45 percent in low ESB countries.
In contrast, reforms defined as level changes have very big differences in distributions in high
and low ESB countries: 5.8 in high ESB countries and 41 in low ESB countries for the same 5th
percentile cutoff. For number of days the differences are also large for levels (for example, 17
days in high ESB countries and 32 days in low ESB countries at 5th
percentile), while they are
much smaller for percent changes (i.e. 55 vs. 60 percent for the 5th
percentile).
Thus, when we define a reform based on level changes, we mix relatively small reforms
(that occur in high ESB countries) with relatively large reforms that occur in low ESB countries.
Because of this, the average results for levels are not significant (not reported). However, once

25
the initial levels of the ESB are controlled for and the interactions with the pre-reform ESB
levels are included in the regressions, we obtain significant results in Table 9, Panel B.
Specifically, almost all of the interactions are positive and significant, suggesting that pre-reform
levels do matter and they increase effectiveness for any size of reform, just as we found in the
previous results with percent changes.
To summarize, whether we measure reform in percent changes or in levels, our results
show that initial conditions matter. Therefore it is important to control for the interaction of
reforms with the pre-reform level of the ESB in the regressions. These results have a clear policy
implication in that countries that start out with low ESB need much larger changes in ESB to
achieve the same effect as countries that start with a high ESB. In other words, countries with
very weak business registration environments have a lot of catching up to do. This additional test
qualifies the overall message of the paper that small reforms are in generally ineffective,
especially in countries with low ESB.
4.7. Comparing the magnitudes-buckets approach.
All reform results discussed so far are based on defining reforms as cutoff points. For
example, a 20 percent reform dummy equals to one if the reform in a given year is at least 20
percent or more. In other words, the reforms in each regression start at a specified cutoff point
and include all larger reforms. This definition is convenient for empirical analysis and
policymakers, who may need to know the size of the minimum effective reform. However, the
drawback of such a definition is the difficulty in comparing statistical magnitudes between
various cutoff points – i.e. statistically speaking, is the impact of a 40 percent or more reform
significantly different from the impact of a 50 percent or more reform? In this section we address

26
this question by redefining our reform dummies into buckets, rather than using cutoffs as we
have done previously.
Specifically, we define multiple reforms buckets, such as reform of 1-19 percent, 20-29
percent, 30-39 percent, 40-49 percent and so on. The advantage of this approach is that we can
put all reform dummies in a single regression and run a “horserace” between different buckets.
However, the main disadvantage is the loss of degrees of freedom as now different buckets have
fewer reforms on which to estimate the coefficients.19
Table 10, Panel A shows the number of reforms in each bucket. As expected, the number
of reforms is relatively small, on average about 10 reforms per bucket (more for the case of the
lowest bucket for 1-19 percent, which were not considered “reforms” in our previous
definitions). Some buckets do not even have enough reforms to estimate separately. For example,
for minimum capital 40-49 percent and 50-59 percent buckets have zero or one reform per
bucket, respectively. We exclude these from the regression to avoid erroneous results based on
only one reform.
Table 10, Panel B presents our regression results. Unlike earlier tables, in which each cell
represents a single regression, now each column represents a single regression and all dummies
enter simultaneously. We find that for procedures, the largest impact is observed in 40-49
percent bucket, while the higher bucket results are also significant (but smaller). For days, costs
and minimum capital we only observe significant results in the 60 percent or more bucket.
The bottom of Table 10 shows F-tests for pair-wise comparisons of different coefficients.
We see that for procedures the coefficient on the 40-49 percent bucket (which has the largest
significant coefficient in the regression) is significantly different from the coefficient on the 1-19
19
Because our buckets are mutually exclusive, we now consider only the largest reform in each country, while
before we have considered the first reform, which may or may not be the largest. Our previous results are robust to
considering only the largest reforms.

27
percent bucket. Also, the coefficient for the 50-59 percent bucket is marginally different (at 15
percent) from those in the 1-19 percent bucket. These results square well with what we found in
the earlier tables – that for procedures the reform of 40 percent or more has the largest and most
significant coefficient.
For both days and costs, the coefficients for the 60 percent or more bucket are
significantly different from buckets below 50 percent, but are not significantly different from the
coefficients for the 50-59 percent bucket. This result closely matches our previous result, as for
both costs and days the coefficients on the 50 percent or more and 60 percent or more reforms
are significant (see Table 6). Finally, for the minimum capital regressions we find that the
coefficients for a reform of 60 percent or more are significantly different from the 30-39 percent
bucket and are marginally different from the 1-19 percent bucket.
In summary, these tests provide a robustness test to our previous results that suggest that
larger reforms - 40 percent or more for procedures and 50 percent or more for costs, days and
minimum capital- are significantly different from smaller reforms. While our results are robust to
this alternative approach, our main approach is more consistent with our model, in which a
reform is a discrete change that “kicks in” after costs drop below the benefits, which implies a
cutoff point. In addition, the cutoff results are easier to interpret for policy makers who may need
to know the minimum reduction (i.e. the cutoff) after which the intended results will occur.
5. Conclusion
In this paper we test the relationship between the Doing Business “Ease of Starting a
Business” measures of the regulatory environment and annual new firm registrations. We offer
an empirically based, quantitative approach to identifying business environment “reformers”.

28
Our results show that the ease of starting a business is a significant predictor of new
business registrations but that small reforms, in general less than a 40 percent reduction for
procedures, or less than 50 percent reduction for costs and days, do not have a significant effect
on new firm registration. This suggests that „token‟ reforms, perhaps motivated by political or
multilateral pressures to reform, do not have the intended effect on private sector activity.
Furthermore, we show that countries with relatively weaker business environments require
relatively larger reforms in order to impact new firm registration. It is likely the case that
countries with weaker business environments also have fewer benefits for formal sector
registration (such as access to formal financial and labor markets) and therefore larger reductions
in costs are necessary to incentivize firms to incur the costs of formal registration.
We also show that there is a synergistic impact of reforms. In the case of two sequential
reforms, each of the reforms can be smaller than if they occurred independently. In addition, two
reforms occurring simultaneously have more impact than if they occur over a longer period of
time.
Our results highlight the importance of defining reforms in a way that is consistent with
expected outcomes, i.e. in this case the number of newly registered businesses. The
methodology developed in this paper can offer alternative classifications of reformers, which can
be useful to policymakers, researchers and practitioners working to improve the business
environment and promote private sector development. Our results can also be helpful to motivate
policymakers to make larger, and more significant, reforms.
29
References
Ardagna, S., Lusardi, A., 2010. Explaining International Differences in Entrepreneurship: The
Role of Individual Characteristics and Regulatory Constraints. In Lerner, J., Shoar, A. (Eds.),
NBER Volume on International Differences in Entrepreneurship. University of Chicago
Press, Chicago, pp. 17-62.
Aghion, P., Blundell, R., Griffith, R., Howitt, P., Prantl, S., 2009. The Effects of Entry on
Incumbent Innovation and Productivity. The Review of Economics and Statistics 91, 20-32.
Antunes, A., Cavalcanti, T., 2009. Start-Up Costs, Limited Enforcement and the Hidden
Economy. European Economic Review 51, 203-224.
Audretsch, D., Keilbach, M., Lehmann, E., 2006. Entrepreneurship and Economic Growth.
Oxford University Press, Oxford.
Barseghyan, L., 2008. Entry Costs and Cross-Country Differences in Productivity and Output.
Journal of Economic Growth 13, 145-167.
Baumol, W., Litan, R., Schramm, C., 2007. Good Capitalism, Bad Capitalism and the Economics
of Growth and Prosperity. Yale University Press, New Haven.
Baumol, W., 2010. The microtheory of innovative entrepreneurship. Princeton University Press,
Princeton.
Berkowitz, D., DeJong, D., 2010. The Emergence of Bank-Issued Credit in Russia: an Empirical
Characterization. Unpublished Working Paper. University of Pittsburg.
Bertrand, M., Kramarz, F., 2001. Does Entry Regulation Hinder Job Creation? Evidence from
the French Retail Industry. Quarterly Journal of Economics 117, 1369-1413.
Black, S., Strahan, P., 2002. Entrepreneurship and bank credit availability. Journal of Finance
57, 2807-2833.
Brander, J., Hendricks, K., Amit, R., Whistler, D., 1998. The engine of growth hypothesis: On
the relationship between firm size and employment growth work. Unpublished working
paper. University of British Columbia.
Branstetter, L., Lima, F. Taylor, L., Venancio, A., 2010. Do Entry Regulations Deter
Entrepreneurship and Job Creation? Evidence form Recent Reforms in Portugal.
Unpublished Working Paper. NBER Working Paper Number 16473.
Bruhn, Miriam, 2008. “License to Sell: The Effect of Business Registration Reform on
Entrepreneurial Activity in Mexico”. World Bank Policy Research Working Paper 4538.
Bruhn, M., 2011. License to Sell: The Effect of Business Registration Reform on Entrepreneurial
Activity in Mexico. Review of Economics and Statistics 93, 382-386.
30
Chavis, L., Klapper, L., Love, I., 2011. The Impact of the Business Environment on Young Firm
Financing. World Bank Economic Review 25, 486-507.
Ciccone, A., Papaioannou, E., 2007. Red Tape and Delayed Entry. Journal of the European
Economic Association 5, 444–458.
Dabla-Norris, E., Gradstein, M., Inchauste, G., 2008. What Causes Firms to Hide Output? The
Determinants of Informality. Journal of Development Economics 85, 1–27.
DCED, 2008. Supporting Business Environment Reforms. Donor Committee for Enterprise
Development, Washington, DC.
De Soto, H., 1990. The Other Path. Harper and Row, New York.
Djankov, S., La Porta, R., Lopez-de-Silanes, F., Shleifer, A., 2002. The regulation of entry.
Quarterly Journal of Economics 117, 1-37.
Djankov, S., McLiesh, C., Ramalho, R., 2006. Regulation and Growth. Economics Letters 92,
395–401.
Fonseca, R., Lopez-Garcia, P., Pissarides, C., 2001. Entrepreneurship, Start-Up Costs and
Employment. European Economic Review 45, 692–705.
Hallward-Driemeier, M., Pritchett, L., 2011. How business is done and the „doing business‟
indicators: the investment climate when firms have climate control. Unpublished Working
Paper . World Bank Policy Research Working Paper Number 5563.
Haltiwanger, J., Jarmin, R., Miranda.J., 2009. Jobs Created from Business Startups in the United
States. Unpublished working paper. Kauffman Foundation.
Hause, J., Du Rietz, G., 1984. Entry, industry growth, and the microdynamics of industry supply.
Journal of Political Economy 92, 733-757.
Johnson, S., McMillan, J., Woodruff, C., 2000. Entrepreneurs and the Ordering of Institutional
Reform: Poland, Slovakia, Romania, Russia and Ukraine Compared. Economics of
Transition 81, 1-36.
Kaplan, D., Piedra, E., Seira, E., 2007. Entry Regulation and Business Start-ups: Evidence from
Mexico. Journal of Public Economics 95, 1501-1515.
Klapper, L., Amit, R., Guillen. M., 2010. Entrepreneurship and Firm Formation Across
Countries. In Lerner, J., Shoar, A. (Eds.), NBER Volume on International Differences in
Entrepreneurship. University of Chicago Press, Chicago, pp. 129-158.

31
Klapper, L., Laeven, L., Rajan, R., 2006. Entry Regulation as a Barrier to Entrepreneurship.
Journal of Financial Economics 82, 591-629.
Klapper, L., Love, I., 2011. The Impact of the Financial Crisis on New Firm Registration.
Economics Letters 113, 1-4.
La Porta, R., Shleifer, A., 2008. The Unofficial Economy and Economic Development.
Brookings Papers on Economic Activity 2, 275-364.
Lingelbach, D., De la Vina, L., Asel, P., 2005. What‟s Distinctive about Growth-Oriented
Entrepreneurship in Developing Countries? UTSA College of Business Center for Global
Entrepreneurship Working Paper No. 1.
Naude, W.., 2008. Entrepreneurship in Economic Development. Unpublished Working Paper.
UNU-WIDER Research Paper No. 2008/20.
Schramm, C., 2004. Building Entrepreneurial Economies. Foreign Affairs 83, 104-115.
Van Praag, C., Versloot, P., 2007. What is the Value of Entrepreneurship? A Review of Recent
Research. Small Business Economics 29, 351-382.
Zorome, A., 2007. Concept of Offshore Financial Centers: In Search of an Operational
Definition. Unpublished Working Paper. IMF Working Paper Number 07/87.

32
Figure 1: Graphical Representation of Relative Costs and Benefits
Panel A: High Benefits in High Initial
Cost Countries.
C0
B
C1
C0
B
C1
High initial cost Low initial cost
Panel B: Low Benefits in High Initial
Cost Countries
C0
C0
B
C1
B
C1
High initial cost Low initial cost
Figure 2: Distribution of Entry Density
Panel A: Distribution of Entry Density Panel B: Entry Density across Income Groups
0.2
.4.6
De
nsity
0 1 2 3 4 5 6 7 8 9 10Entry density
4.2
2.4
0.8 0.3
0
1
2
3
4
5
High
income
Upper
middle
income
Lower
middle
income
Low
income

33
Figure 3: Scatter plots of Business Environment Variables
0
2
4
6
8
10
0 50 100 150
En
try
Dn
eist
y
Cost (% GNI)
0
2
4
6
8
10
0 20 40 60 80 100
En
try
Den
sity
Days
0
2
4
6
8
10
0 5 10 15 20
En
try
Den
sity
Procedures
0
2
4
6
8
10
0 50 100 150 200
En
try
Den
sity
Minimum Capital (% GNI)
34
Figure 4: Histograms of Percent Changes in Business Environment Variables
0
.01
.02
.03
.04
De
nsi
ty
-100 -80 -60 -40 -20 0 20 40 60 80 100Percent change in ESB cost
0
.02
.04
.06
.08
.1
De
nsi
ty
-100 -80 -60 -40 -20 0 20 40 60 80 100Percent change in ESB days
0
.05
.1.1
5.2
De
nsi
ty
-100 -80 -60 -40 -20 0 20 40 60 80 100Percent change in ESB proc
0
.01
.02
.03
.04
De
nsi
ty
-100 -80 -60 -40 -20 0 20 40 60 80 100Percent change in ESB mincap

35
Table 1: Variable Definitions
Label Description
Entry Density
Entry density, defined as new firms registered per working age
population (normalized by1,000) (World Bank Entrepreneurship
Snapshots, 2010)
GDP growth (lagged) Lagged GDP growth(WB-WD, 2010)
Procedures
Procedures to register a business (number). Defined as any
interaction of the company founders with external parties (i.e.,
government agencies, lawyers, auditors or notaries) (Doing
Business)
Days
Time needed to register a business (days). The measure captures
the median duration that incorporation lawyers indicate is
necessary to complete a procedure. (Doing Business)
Cost
Cost to register a business. Cost is recorded as a percentage of
the economy‟s income per capita. It includes all official fees and
fees for legal or professional services if such services are
required by law (Doing Business)
Minimum Capital The paid-in minimum capital required deposit in a bank or with
a notary before registration (% GNI) (Doing Business)
Starting a Business: Index
Average of standardized values of procedures (#), time (days),
cost (% GNI) and minimum capital (% GNI) to register a
business (Doing Business)
Registering Property: Index Average of standardized values of procedures (#), time (days)
and cost (% GNI) to register a property (Doing Business)
Getting Credit: Index
Average of standardized values of strength of legal rights index
(0-10), depth of credit information index (0-6), public registery
coverage (% adult population), private credit bureau coverage
(% adult population) (Doing Business)
Enforcing Contracts: Index Average of standardized values of procedures (#), time (days)
and cost (% GNI) of enforcing contracts (Doing Business)
Closing a Business: Index
Average of standardized values of time (days), cost (% GNI) of
enforcing contracts and recovery rate (cents on dollar recovered
by creditors, inverted) (Doing Business)
Paying Taxes: Index
Average of standardized values of time (hours), payments
(number), and total tax rate (% profit before all taxes) for paying
taxes (Doing Business)
36
Table 2A: Summary Statistics
Variable N Mean SD p50 Min Max
Entry Density 497 2.04 2.13 1.16 0.00 9.81
GDP growth (lagged) 497 5.56 3.57 5.34 -4.67 34.50
Procedures 497 8.78 3.47 9.00 1.00 18.00
Procedures (log) 497 2.21 0.40 2.30 0.69 2.94
Procedures (annual % change) 493 -4.74 11.84 0.00 -75.00 25.00
Days 497 37.69 70.86 26.00 2.00 694.00
Days (log) 497 3.23 0.82 3.30 1.10 6.54
Days (annual % change) 493 -9.72 20.48 0.00 -86.21 66.67
Cost 497 34.59 59.74 12.10 0.10 480.10
Cost (log) 497 2.75 1.25 2.57 0.10 6.18
Cost (annual % change) 493 -11.24 18.59 -8.92 -98.82 73.95
Minimum Capital 497 87.62 206.79 15.70 0.10 1821.90
Minimum Capital (log) 497 2.56 2.08 2.82 0.10 7.51
Minimum Capital (annual % change) 493 -9.93 27.14 -5.53 -99.94 283.33
Starting a Business: Index 497 0.00 0.65 0.18 -3.13 0.93
Registering Property: Index 491 0.00 0.67 0.08 -3.86 1.16
Getting Credit: Index 497 0.00 0.65 0.01 -1.30 2.20
Enforcing Contracts: Index 497 0.00 0.64 0.09 -1.83 1.09
Closing a Business: Index 497 0.06 0.51 0.06 -1.15 1.54
Paying Taxes: Index 423 -0.01 0.72 0.13 -3.38 1.40
Table 2B: Correlation Matrix
(1) (2) (3) (4) (5)
Entry density (1) 1
Procedures (log) (2) -0.58* 1
Days (log) (3) -0.41* 0.69* 1
Cost (log) (4) -0.67* 0.59* 0.50* 1
Minimum Capital (log) (5) -0.18* 0.08 0.03 0.24* 1
Note: Correlations performed at the country level using 2005-2009 averages.
Asterisk indicates significance at the 10% level

37
Table 3: Number of Reforms with Different Cutoff Points, by Country
Cutoff 1 2 3 4
Procedures Reform Days Reform Cost Reform Min Cap Reform
20% 38 55 56 39
30% 27 47 41 28
40% 16 39 28 23
50% 8 31 16 23
60% 3 21 7 22
Table 4: Number of Simultaneous or Sequential Reforms, by Country
Cutoff
1 2 3 4 5
One or more
Reform
Two or more
reforms
occurring
sequentially
Two or more
reforms
occurring
simultaneously
Three or more
reforms
occurring
sequentially
Three or more
reforms
occurring
simultaneously
20% 78 66 50 52 26
30% 67 50 34 29 14
40% 56 34 22 16 8
50% 45 24 14 12 5
60% 34 17 7 6 2

38
Table 5: The Impact of Business Environment on New Firm Creation
This table uses an unbalanced panel dataset of 497 observations from 91 countries for the six-year period 2004 to
2009. All variables are defined in Table 1. The dependent variable is annual entry density. All columns include
country fixed effects, year fixed effects, and standard errors clustered at the country-level. Columns 5-8 also include
four additional controls for other Doing Business reforms, described in Table 1. P-values are in squared brackets.
***,**, and * represent significance at 1%, 5%, and 10% level respectively.
Variables Entry Density
1 2 3 4 5 6 7 8
Procedures (log) -0.674***
-0.708***
[0.003]
[0.005]
Days (log) -0.271*
-0.263*
[0.060]
[0.076]
Cost (log)
-0.259*
-0.259*
[0.057]
[0.074]
Min. Capital (log)
-0.061
-0.073
[0.294]
[0.227]
Registering Property (index)
0.072 0.135 0.137 0.214**
[0.485] [0.176] [0.221] [0.040]
Getting Credit (index)
-0.217 -0.174 -0.198 -0.229
[0.498] [0.606] [0.556] [0.511]
Enforcing Contracts (index)
-0.123 -0.053 -0.1 -0.051
[0.592] [0.826] [0.713] [0.841]
Closing a Business (index)
0.594 0.508 0.537 0.52
[0.132] [0.141] [0.173] [0.168]
GDP growth (lagged) 0.008 0.007 0.007 0.011 0.011 0.01 0.01 0.014
[0.574] [0.671] [0.680] [0.504] [0.499] [0.584] [0.587] [0.407]
Constant 3.253*** 2.667*** 2.490*** 1.873*** 3.235*** 2.563*** 2.405*** 1.824***
[0.000] [0.000] [0.000] [0.000] [0.000] [0.000] [0.000] [0.000]
Observations 497 497 497 497 491 491 491 491
Adjusted R-squared 0.947 0.946 0.946 0.945 0.947 0.946 0.946 0.945

39
Table 6: Regression Results for Single Reform
This table uses an unbalanced panel dataset of 487 observations from 91 countries for the six-year period 2004 to
2009. All variables are defined in Table 1. The dependent variable is annual entry density. The reported
independent variable is a reform dummy denoted by the reform variable (columns 1-4) and the cutoff level in each
row. Each box represents a separate regression. All models include country and year fixed effects and control for
lagged GDP growth and four doing business indices: Registering a Property, Getting Credit, Enforcing Contracts
and Closing a Business. Standard errors are clustered at the country-level. P-values are in squared brackets. ***,**,
and * represent significance at 1%, 5%, and 10% level respectively.
Cutoff 1 2 3 4
Procedures Reform Days Reform Cost Reform Min Cap Reform
20% 0.384** -0.023 -0.01 0.323*
[0.018] [0.865] [0.935] [0.079]
30% 0.394** 0.118 -0.012 0.252
[0.045] [0.494] [0.939] [0.189]
40% 0.412** 0.178 0.075 0.399*
[0.018] [0.357] [0.680] [0.080]
50% 0.239 0.354* 0.568** 0.399*
[0.160] [0.065] [0.038] [0.080]
60% 0.105 0.567** 0.601** 0.409*
[0.324] [0.023] [0.011] [0.092]

40
Table 7: Regression Results for Simultaneous or Sequential Reforms
This table uses an unbalanced panel dataset of 493 observations from 91 countries for the six-year period 2004 to
2009. All variables are defined in Table 1. The dependent variable is annual entry density. The reported
independent variable is a reform dummy denoted by the reform combination (columns 1-5) and the cutoff level in
each row. Each box represents a separate regression. All models include country and year fixed effects and control
for lagged GDP growth and four doing business indices: Registering a Property, Getting Credit, Enforcing Contracts
and Closing a Business. P-values are in squared brackets. ***,**, and * represent significance at 1%, 5%, and 10%
level respectively.
Cutoff
1 2 3 4 5
One or more
Reform
Two or more
Reforms
occurring
sequentially
Two or more
Reforms
occurring
simultaneously
Three or more
reforms
occurring
sequentially
Three or more
reforms
occurring
simultaneously
20% -0.031 0.132 0.215 0.044 0.291
[0.786] [0.253] [0.206] [0.746] [0.214]
30% -0.093 0.185 0.255 0.348** 0.589*
[0.436] [0.164] [0.217] [0.042] [0.079]
40% -0.02 0.407** 0.432 0.585** 0.883*
[0.884] [0.010] [0.123] [0.031] [0.067]
50% 0.309** 0.554*** 0.720** 0.575*
N/A [0.023] [0.004] [0.032] [0.089]
60% 0.410** 0.617** 1.051** 0.573***
N/A [0.022] [0.010] [0.041] [0.000]

41
Table 8: Regression Results for Single Reform, with Interactions
This table uses an unbalanced panel dataset of 487 observations from 91 countries for the six-year period 2004 to
2009. All variables are defined in Table 1. The dependent variable is annual entry density. The reported
independent variable is a reform dummy denoted by the reform variable in the top rows and the cutoff level in the
left columns and an interaction term between the reform dummy and the pre-reform index of the “Starting a
Business” (ESB Index) measures. Each box represents a separate regression. All models include country and year
fixed effects and control for lagged GDP growth and four doing business indices: Registering a Property, Getting
Credit, Enforcing Contracts and Closing a Business. Standard errors are clustered at the country-level. P-values are
in squared brackets. ***,**, and * represent significance at 1%, 5%, and 10% level respectively.
Cutoff Variable
1 2 3 4
Procedures
Reform Days Reform Cost Reform
Min Cap
Reform
20%
Reform 0.346** 0.01 0.017 0.373**
[0.014] [0.941] [0.892] [0.044]
Reform*pre-reform ESB Index 0.616** 0.217** 0.168* 0.335**
[0.012] [0.038] [0.055] [0.025]
30%
Reform 0.378** 0.186 0.025 0.248
[0.033] [0.297] [0.879] [0.174]
Reform*pre-reform ESB Index 0.634** 0.375** 0.185* 0.358*
[0.043] [0.017] [0.051] [0.087]
40%
Reform 0.374** 0.18 0.1 0.438**
[0.028] [0.322] [0.585] [0.042]
Reform*pre-reform ESB Index 0.249 0.612*** 0.193** 0.521**
[0.348] [0.001] [0.022] [0.050]
50%
Reform 0.211 0.368** 0.622** 0.438**
[0.187] [0.032] [0.016] [0.042]
Reform*pre-reform ESB Index 0.274* 0.724*** 0.494** 0.521**
[0.073] [0.001] [0.033] [0.050]
60%
Reform 0.137 0.450** 0.658*** 0.459**
[0.213] [0.012] [0.001] [0.044]
Reform*pre-reform ESB Index 0.157 0.607 0.869** 0.542*
[0.393] [0.209] [0.032] [0.051]

42
Table 9: Levels Results
This table uses an unbalanced panel dataset of 493 observations from 91 countries for the six-year period 2004 to
2009. All variables are defined in Table 1. The reform dummies are calculated as first differences (one year change
in level) and the cutoffs are based on the distribution of these values. The dependent variable is annual entry density.
The reported independent variable is a reform dummy denoted by the reform variable in the top rows and the cutoff
level in the left columns and an interaction term between the reform dummy and the pre-reform index of the
“Starting a Business” (ESB Index) measures. Each box represents a separate regression. All models include country
and year fixed effects and control for lagged GDP growth and four doing business indices: Registering a Property,
Getting Credit, Enforcing Contracts and Closing a Business. Standard errors are clustered at the country-level. P-
values are in squared brackets. ***,**, and * represent significance at 1%, 5%, and 10% level respectively.
Panel A
p5 p10 p15 p20 p25
Procedures
First difference High -2.00 -1.00 -1.00 0.00 0.00
Low -3.40 -2.00 -1.00 -1.00 -1.00
% Change High -32.62 -18.18 -11.11 0.00 0.00
Low -36.82 -20.00 -12.50 -10.00 -7.69
Days
First difference High -17.00 -10.70 -6.00 -3.40 -1.00
Low -32.00 -20.40 -14.00 -9.00 -6.00
% Change High -55.45 -35.27 -25.44 -14.97 -5.38
Low -60.36 -44.31 -34.69 -21.42 -16.13
Cost
First difference High -5.76 -3.44 -2.46 -1.90 -1.50
Low -41.08 -23.50 -16.60 -12.42 -10.90
% Change High -42.96 -28.20 -21.43 -18.22 -16.72
Low -45.09 -35.77 -31.33 -24.29 -19.89
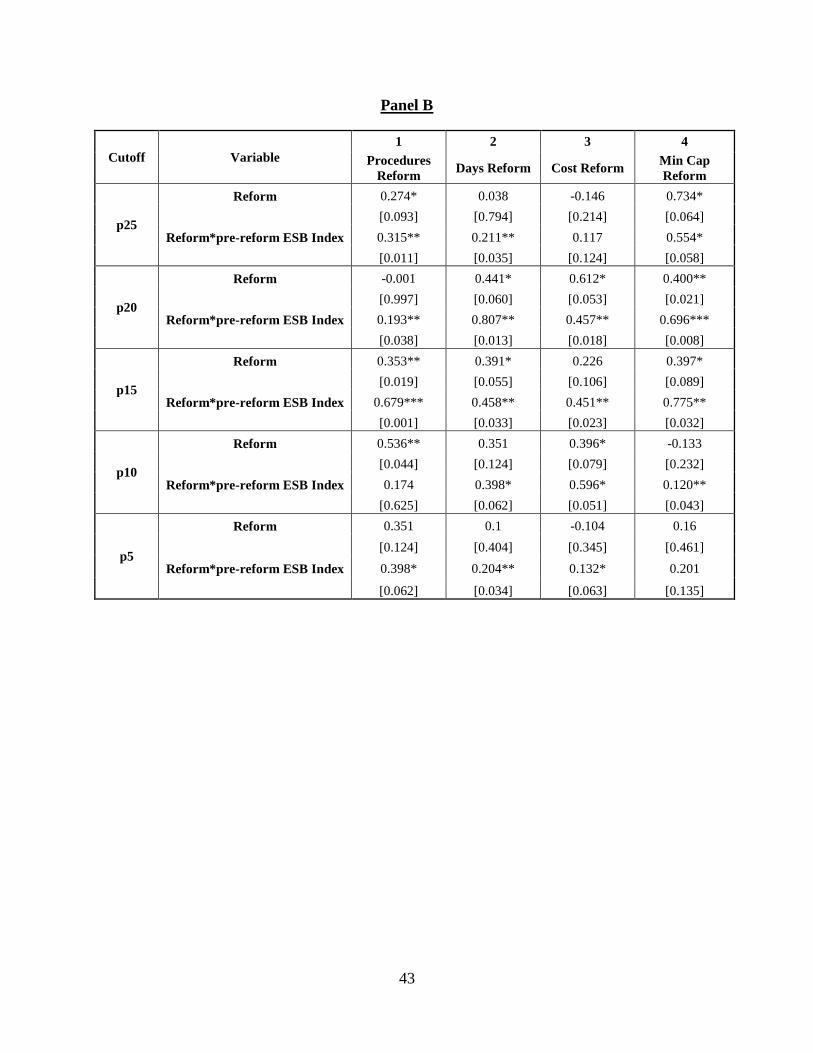
43
Panel B
Cutoff Variable
1 2 3 4
Procedures
Reform Days Reform Cost Reform
Min Cap
Reform
p25
Reform 0.274* 0.038 -0.146 0.734*
[0.093] [0.794] [0.214] [0.064]
Reform*pre-reform ESB Index 0.315** 0.211** 0.117 0.554*
[0.011] [0.035] [0.124] [0.058]
p20
Reform -0.001 0.441* 0.612* 0.400**
[0.997] [0.060] [0.053] [0.021]
Reform*pre-reform ESB Index 0.193** 0.807** 0.457** 0.696***
[0.038] [0.013] [0.018] [0.008]
p15
Reform 0.353** 0.391* 0.226 0.397*
[0.019] [0.055] [0.106] [0.089]
Reform*pre-reform ESB Index 0.679*** 0.458** 0.451** 0.775**
[0.001] [0.033] [0.023] [0.032]
p10
Reform 0.536** 0.351 0.396* -0.133
[0.044] [0.124] [0.079] [0.232]
Reform*pre-reform ESB Index 0.174 0.398* 0.596* 0.120**
[0.625] [0.062] [0.051] [0.043]
p5
Reform 0.351 0.1 -0.104 0.16
[0.124] [0.404] [0.345] [0.461]
Reform*pre-reform ESB Index 0.398* 0.204** 0.132* 0.201
[0.062] [0.034] [0.063] [0.135]

44
Table 10: Comparing Magnitudes - Buckets Approach
This table uses an unbalanced panel dataset of 493 observations from 91 countries for the six-year period 2004 to
2009. All variables are defined in Table 1. The dependent variable is annual entry density. The reported
independent variables are mutually exclusive reform dummies reflecting the cutoff bucket (1-19%, 20-29%, etc) into
which the biggest reform in each country falls into a given category. Each column represents a separate regression.
The excluded category is zero or no reforms for a country in a given category. All models include country and year
fixed effects and control for lagged GDP growth and four doing business indices: Registering a Property, Getting
Credit, Enforcing Contracts and Closing a Business. Standard errors are clustered at the country-level. P-values are
in squared brackets. ***,**, and * represent significance at 1%, 5%, and 10% level respectively.
Panel A. Number of bucket reforms by country
Procedures Days Cost Min Cap
1-19% 23 17 32 24
20-29% 11 8 15 11
30-39% 11 8 13 5
40-49% 8 8 12 0
50-59% 5 10 9 1
60+% 3 21 7 22

45
Panel B. Regression Results with Buckets
Procedures
Reform Days Reform Cost Reform
Min Cap
Reform
1-19% (biggest) 0.088 -0.048 -0.087 0.097
[0.584] [0.769] [0.448] [0.349]
20-29% (biggest) 0.23 -0.171 0.093 0.181
[0.281] [0.201] [0.673] [0.545]
30-39% (biggest) 0.371 0.011 0.016 -0.12
[0.295] [0.944] [0.895] [0.596]
40-49% (biggest) 0.704** -0.282 -0.15
[0.019] [0.461] [0.642]
50-59% (biggest) 0.464** -0.047 0.499
[0.023] [0.854] [0.225]
60+% (biggest) 0.246* 0.485* 0.740*** 0.449*
[0.069] [0.056] [0.000] [0.067]
F-Tests
20/29=1/19 0.54 0.49 0.44 0.77
30/39=1/19 0.44 0.77 0.51 0.33
30/39=20/29 0.72 0.33 0.74 0.38
40/49=1/19 0.07* 0.55 0.85
40/49=20/29 0.16 0.77 0.53
40/49=30/39 0.44 0.47 0.62
50/59=1/19 0.15 0.99 0.17
50/59=20/29 0.41 0.64 0.37
50/59=30/39 0.81 0.84 0.26
50/59=40/49 0.50 0.59 0.21
60+=1/19 0.37 0.05* 0.00*** 0.16
60+=20/29 0.94 0.01** 0.03** 0.46
60+=30/39 0.73 0.09* 0.00*** 0.06*
60+=40/49 0.13 0.09* 0.02**
60+=50/59 0.29 0.12 0.59

46
Appendix 1: Entry Density, Average 2004-2009
Entry Density is defined as new firms registered per working age population (normalized by 1,000). Offshore
financial centers identified by the IMF are shown in italics – and omitted from our empirical analysis.
Albania 0.77 Ghana 0.59 New Zealand 22.85
Algeria 0.45 Greece 0.94 Niger 0.00
Argentina 0.56 Guatemala 0.69 Nigeria 0.55
Armenia 1.49 Hong Kong, China 15.25 Norway 4.84
Australia 6.33 Hungary 4.46 Oman 1.42
Austria 0.64 Iceland 14.61 Pakistan 0.04
Azerbaijan 1.01 India 0.07 Panama 3.04
Belarus 0.45 Indonesia 0.17 Peru 2.13
Belgium 4.15 Ireland 5.97 Philippines 0.23
Belize 3.88 Israel 4.66 Poland 0.49
Bhutan 0.04 Italy 1.89 Portugal 4.01
Bolivia 0.34 Jamaica 1.12 Romania 5.75
Bosnia and Herzegovina 0.71 Japan 1.43 Russian Federation 4.03
Brazil 2.10 Jersey 48.67 Rwanda 0.19
Bulgaria 7.09 Jordan 0.59 Senegal 0.21
Burkina Faso 0.07 Kazakhstan 2.88 Serbia 2.10
Cambodia 0.23 Kenya 0.56 Singapore 6.55
Canada 8.00 Korea, Rep. 1.56 Slovak Republic 3.64
Chile 2.18 Kosovo 0.14 Slovenia 3.49
Colombia 1.02 Kyrgyz Republic 0.95 South Africa 1.13
Cook Islands 7.77 Latvia 5.88 Spain 4.57
Costa Rica 11.14 Liechtenstein 34.62 Sri Lanka 0.32
Croatia 2.95 Lithuania 2.09 Suriname 0.41
Cyprus 25.64 Luxembourg 6.59 Sweden 4.04
Czech Republic 2.53 Macedonia, FYR 6.16 Switzerland 3.38
Denmark 6.29 Madagascar 0.10 Tajikistan 0.26
Dominica 3.60 Malawi 0.07 Thailand 0.64
Dominican Republic 2.13 Malaysia 2.60 Togo 0.02
Egypt, Arab Rep. 0.13 Maldives 3.50 Tunisia 1.02
El Salvador 0.67 Malta 9.66 Turkey 0.99
Estonia 7.43 Mauritius 8.20 Uganda 0.62
Ethiopia 0.03 Mexico 0.62 Ukraine 0.91
Finland 3.20 Moldova 1.60 United Kingdom 9.25
France 3.14 Montenegro 3.75 Uruguay 3.07
Gabon 3.77 Morocco 0.98 Uzbekistan 0.56
Georgia 1.89 Netherlands 2.95 Vanuatu 4.21
Germany 1.18 Netherlands Antilles 8.84 Zambia 0.76

47
Appendix 2: OECD Data
We perform additional robustness tests using data from the OECD20
which includes
country-level statistics on the number of new firm registrations (including non-LLC‟s),
aggregated by employment buckets and sector. The data is an unbalanced panel dataset of 79
observations from 22 countries for the five-year period 2004 to 2008. However, on average, we
have only about three years of data per country. Using this data, we are able to replicate our
continuous results, similar to those reported in Table 5, in which we run a fixed effects
regression with continuous measures of ease of doing business.21
As shown in Panel A, we find
significant results for the complete sample (column 1) and the subsample of firms in the service
and retail sectors (column 3). Interestingly, we do not find a significant relationship for the
manufacturing sector (column 2), which might be explained by the need for firms in this sector
to register for formal financial, employer, and sales contracts, regardless of entry regulations.
Panel B shows that within the retail and service sectors, our results are most significant for firms
in the category of 5 to10 employees, which is the segment of the market more likely to choose
between formal and informal operations. Thus, the smallest firms, less than 5 employees, may
chose not to register regardless of the regulations, while the largest ones will have to register
regardless. Hence the marginal impact is observed for firms that are small, but not micro. These
results are consistent with evidence found by Branstettner, et al. (2010) in Portugal, who find that
entry regulation reforms have the largest effect on “marginal” firms that would be most deterred
by onerous regulations, such as small firms in low-tech sectors.
20
Complete data is available at: http://stats.oecd.org/Index.aspx?DataSetCode=SDBS_BDI. 21
It is not feasible to replicate our reform methodology on this dataset because there are not enough reforms in this
short time frame and in a relatively small number of OECD countries (which have fewer reforms to begin with,
because their registration process is already fairy efficient). In addition, for a few reforms that did occur in our
sample, there are not enough post-reform year observations.

48
Table A2: The Impact of Business Environment on New Firm Creation, OECD Data
This table uses an unbalanced panel dataset of 79 observations from 22 countries for the five-year period 2004 to
2008. The dependent variable is annual entry density using data from the OECD. All columns control for lagged
GDP growth (%), and include country fixed effects, year fixed effects, and standard errors clustered at the country-
level. P-values are in squared brackets. ***,**, * and a represent significance at 1%, 5%, 10% and 15% level
respectively.
Panel A: By Sector
All Manufacturing Service & Retail
(1) (2) (3)
Procedures (log) -2.443a
0.31
-1.916a
[0.104]
[0.387]
[0.104]
Days (log) -0.951**
0.049
-0.660*
[0.020]
[0.534]
[0.054]
Cost (log)
-1.888*
0.066
-1.396a
[0.089]
[0.759]
[0.116]
GDP Growth (lagged) 0.066 0.05 0.022 0.016 0.018 0.019 0.045 0.03 0.009
[0.644] [0.641] [0.858] [0.172] [0.195] [0.224] [0.703] [0.748] [0.933]
Constant 9.411*** 7.684*** 8.422*** -0.302 0.138 0.165 7.999*** 6.348*** 7.095***
[0.003] [0.000] [0.001] [0.666] [0.584] [0.698] [0.001] [0.000] [0.000]
Observations 63 63 63 79 79 79 74 74 74
R-squared 0.981 0.985 0.982 0.921 0.92 0.916 0.973 0.976 0.974
Entry Density: Mean 5.02
0.36
4.45
Entry Density: SD
4.26
0.25
3.19
Panel B: By Firm Size, Service & Retail Sector
Service & Retail
<5 5-10 >10
Procedures (log) -0.971
-0.249**
-0.108
[0.296]
[0.044]
[0.319]
Days (log)
-0.707*
-0.043*
-0.004
[0.075]
[0.092]
[0.747]
Cost (log)
-1.092a
-0.193*
-0.105
[0.147]
[0.050]
[0.304]
GDP Growth (lagged) 0.048 0.051 0.026 0.003 0.002 -0.002 0.001 0.001 -0.001
[0.712] [0.649] [0.842] [0.666] [0.770] [0.792] [0.667] [0.756] [0.721]
Constant 5.710*** 5.984*** 6.018*** 0.761*** 0.401*** 0.667*** 0.332 0.126** 0.336
[0.002] [0.000] [0.001] [0.005] [0.000] [0.004] [0.131] [0.019] [0.120]
Observations 58 58 58 73 73 73 69 69 69
R-squared 0.982 0.985 0.983 0.835 0.835 0.847 0.796 0.79 0.813
Entry Density: Mean
4.16
0.27
0.12
Entry Density: SD
3.52
0.15
0.07

49