THE IMPACT OF BANKING DEREGULATION ON CANADIAN BANKS RETURNS · THE IMPACT OF BANKING DEREGULATION...
38
Cahier de recherche 2009-01 THE IMPACT OF BANKING DEREGULATION ON CANADIAN BANKS RETURNS Christian Calmès* Département des sciences administratives Université du Québec (Outaouais) Laboratory for Research in Statistics and Probability Raymond Théoret Département de finance Université du Québec (Montréal) Corporate Reporting Chair __________________________________________________ * corresponding author at: Université du Québec en Outaouais, Canada. Tel : +1 819 595 3900 1893; fax +1 819 773 1747. E-mail address: [email protected] (C. Calmès). Acknowledgements. We would like to thank the seminar participants at the C.D. Howe Institute Conference on Financial Services Initiative, especially the director of research Finn Poschmann. We want to thank Professor David Laidler and Edward Neufeld for their valuable comments, Pr. Frank Milne for his helpful suggestions and Nicolas Pellerin for his research assistance. Finally, the seminar participants at our October UQO conference provided useful suggestions. Tuesday, January 06, 2009
Transcript of THE IMPACT OF BANKING DEREGULATION ON CANADIAN BANKS RETURNS · THE IMPACT OF BANKING DEREGULATION...
Cahier de recherche
2009-01
THE IMPACT OF BANKING DEREGULATION ON CANADIAN BANKS RETURNS
Christian Calmès* Département des sciences administratives
Université du Québec (Outaouais) Laboratory for Research in Statistics and Probability
Raymond Théoret Département de finance
Université du Québec (Montréal) Corporate Reporting Chair
__________________________________________________ * corresponding author at: Université du Québec en Outaouais, Canada. Tel : +1 819 595 3900 1893; fax +1 819 773 1747. E-mail address: [email protected] (C. Calmès). Acknowledgements. We would like to thank the seminar participants at the C.D. Howe Institute Conference on Financial Services Initiative, especially the director of research Finn Poschmann. We want to thank Professor David Laidler and Edward Neufeld for their valuable comments, Pr. Frank Milne for his helpful suggestions and Nicolas Pellerin for his research assistance. Finally, the seminar participants at our October UQO conference provided useful suggestions.
Tuesday, January 06, 2009
2
Abstract
This paper revisits the impact of OBS activities on Canadian banks risk-return trade-off. Recent studies (Stiroh and Rumble 2006, Calmès and Liu 2007) suggest that increasing OBS activities do not necessarily yield straightforward diversification benefits. However, adding a risk premium to earlier accounting returns models by resorting to an ARCH-M procedure, an updated sample reveals that the Canadian banks risk-return trade-off displays a structural break, around 1997. In the second subperiod (1997-2007) of our sample, we find that the share of noninterest income no longer negatively impacts banks returns. Relatedly, we find that a risk premium emerges while, in the first period (1988-1996), the volatility variable is not significant in any returns equations. Our results are thus consistent with a maturation process story. JEL Classification: G20; G21. Keywords: Regulatory changes; Noninterest income; Diversification; Structural break; Risk premium.
Résumé
Ce papier réexamine l’incidence des activités OBS sur l’arbitrage risque-rendement des banques canadiennes. Des études récentes (Stiroh et Rumble 2006, Calmès et Liu 2007) donnent à penser que l’essor des activités OBS ne conduit pas nécessairement à des bénéfices de diversification accrus. Cependant, grâce à l’ajout d’une prime de risque aux modèles antérieurs de rendements comptables à l’aide d’une procédure ARCH-M, un échantillon rajeuni révèle que l’arbitrage risque-rendement des banques a subi un bris structurel, que l’on peut situer aux environs de l’année 1997. Durant la deuxième partie de notre échantillon (1997-2007), nous constatons que la part des revenus autres que d’intérêt n’influe plus négativement sur les rendements bancaires. En parallèle, nous détectons l’émergence d’une prime de risque, alors qu’au cours de la première période (1988-1996), la volatilité conditionnelle n’a pas de pouvoir explicatif à l’intérieur des équations de rendements. Nos résultats sont donc cohérents avec un scénario d’apprentissage. Classification JEL : G20; G21. Mots-clefs : Changements réglementaires; Revenus autres que d’intérêt; Diversification; Bris structurel; prime de risque.
3
1. Introduction Beginning in the 1980s in Canada, financial deepening1 and financial
innovations led to a more market-oriented structure with firms increasingly relying
on financial markets to fund their investments, an evolution also observed in the
United-States and elsewhere (Boyd and Gertler 1994, Calmès 2004, Roldos 2006).
The evolution in the Canadian financial system gave way to a major change in
corporate financing, characterized with a relative decreased share of banks loans
(i.e. indirect financing) and an increased share of bonds and stocks. This financial
transformation challenged the Canadian banking business and justified, in part, the
successive amendments to the Canadian Bank Act. These amendments enabled
banks to act as security dealers and offer fiduciary services and portfolio advices
to investors2. They also allowed banks to securitize loans, a move in line with the
on-going financial deepening process. This kind of non traditional activities,
previously the "chasse gardée" of the three other pillars of the Canadian financial
system, are loosely classified as OBS (off-balance sheet) activities. At first, banks
might have thought that these new types of activities would have led to important
diversification benefits, with an improvement in their risk-return trade-off (Rose
1989, Sauders and Walters 1994). Indeed, the decision to diversify might be
considered endogenous (Campa and Kedia 2002, Stiroh and Rumble 2006) and the
result of an optimization process, theoretically leading to a better risk-return trade-
off on an expanded efficient frontier.
1 The expression “financial deepening” refers here not only to desintermediation and increased liquidity but also to greater market completeness. 2 The move towards off-balance sheet activities is partly endogenous, in the sense that it has been originated by banks themselves.
4
However, both in Canada and the United-States, researchers find quite the
opposite: OBS activities triggered a substantial increase in the volatility of banks'
net operating revenue growth (Acharya et al. 2002, Stiroh 2004, Stiroh 2006,
Stiroh and Rumble 2006, Calmès and Liu 2007, Calmès and Théoret 2009).
Furthermore, this volatility surge does not seem to be associated to greater
absolute or risk-adjusted (accounting) measures of bank returns − i.e. the return on
assets or the return on equity. Actually, these measures of banks returns decreased
with the upward trend in the share of noninterest income. Given the direct link
between accounting measures of bank performance and the level and volatility of
bank market returns, this situation might be perceived as problematic by banks
stakeholders.
In this paper, we first confirm that the surge in the OBS activities actually
increases the banking system riskiness. To explain the paradoxical weakness of
the diversification benefits associated to OBS activities, we provide a conjecture
rationalizing the deterioration of the risk-return trade-off over the 1988-2007
period (Calmès and Théoret 2009). We argue that noninterest income, being more
related to aggregate shocks compared to interest income, increases the exposure of
Canadian banks to market conditions, and more generally to macroeconomic
shocks, which are not easily diversifiable and whose relative importance tends to
grow relative to idiosyncratic shocks (Houston and Stiroh 2006). The risk-return
worsening might also partly be explained by bank herding behaviour ─ a
collective reaction of banks to aggregate shocks ─ which contributes to increase
the risk exposure of the whole banking system (Baum et al. 2002, Baum et al.
5
2005, Calmès and Salazar 2006, Quagliariello 2006). This is bad news for
financial stability but also a cause of concern for financial supervision agencies,
and more generally for banks shareholders.
Second, we focus on the change in the risk-return trade-off and the integration
of traditional lending and OBS activities. Contrary to what was observed before
1997, we find that, over the period 1997-2007, there is no longer a negative
correlation between banks returns and the share of noninterest income ─ the
revenues associated to OBS activities (Pellerin 2008). Our results are consistent
with a maturation process story. As it is usually the case, financial markets and
institutions eventually adjust to financial innovations, even if the adjustment is
generally slow to materialize (Caballero and Engle 2003).
In this respect, the main contribution of this paper is to resort to a new
empirical framework to study the recent change in the relationship between
various measures of banks returns and the share of noninterest income. We
analyze the emergence of a risk premium accounting for the OBS activities
riskiness by estimating a model of banks returns with an ARCH-M procedure
(Engle et al. 1986), a novelty in this literature. This risk was not explicitely
modeled in previous studies, an important omission from the standpoint of the
asset pricing theory. Indeed, considering risk-adjusted measures only is not
completely satisfying when returns are not first-degree homogenous in volatility.
Instead, the volatility should appear on the RHS of the returns equations, as it is
usually the case in asset pricing. Running this experiment unveils a maturation
process with banks starting to price the new type of risk in 1997 when the net
6
interest and noninterest revenues correlation changed sign. DeYoung and Roland
(2001) conjectured that the surging volatility of banks revenues should eventually
give rise to the incorporation of risk premia in various measures of bank
accounting returns, however, they did not test this conjecture. Our contribution
here is precisely to fill this gap with the introduction of the returns conditional
volatilities directly in banks returns equations.
Our empirical study runs from the first fiscal quarter of 1988 to the fourth
fiscal quarter of 2007. We find that the banks risk-return trade-off presents a
structural break, which may be dated around 1997. In the second subperiod (1997-
2007) of our sample, the share of noninterest income no longer impacts negatively
the two retained measures of banks returns, as was previously the case. Relatedly,
we find that a risk premium emerges in the second subperiod (1997-2007) while in
the first subperiod (1988-1996), the volatility variable is not significant in any
returns equations. These results are consistent with a maturation process story.
This paper is organized as follows. In section 2, we present the stylized facts
associated to the banking deregulation process. In section 3, we present a
conjecture explaining the increased riskiness of the Canadian financial system. In
section 4, we go on with the pricing of risk premia in banks returns. In this
section, an ARCH-M estimation procedure is described and then we discuss the
empirical results before concluding.
7
2. Banking Stylized Facts
2.1 A Changing Financial Landscape
Before examining the stylized facts related to the increased riskiness in
Canadian banking, we survey the evolution of the Canadian financial system over
the last decades. This evolution explains in part the various amendments to the
Canadian Bank Act which have taken place since the beginning of the 1980s.
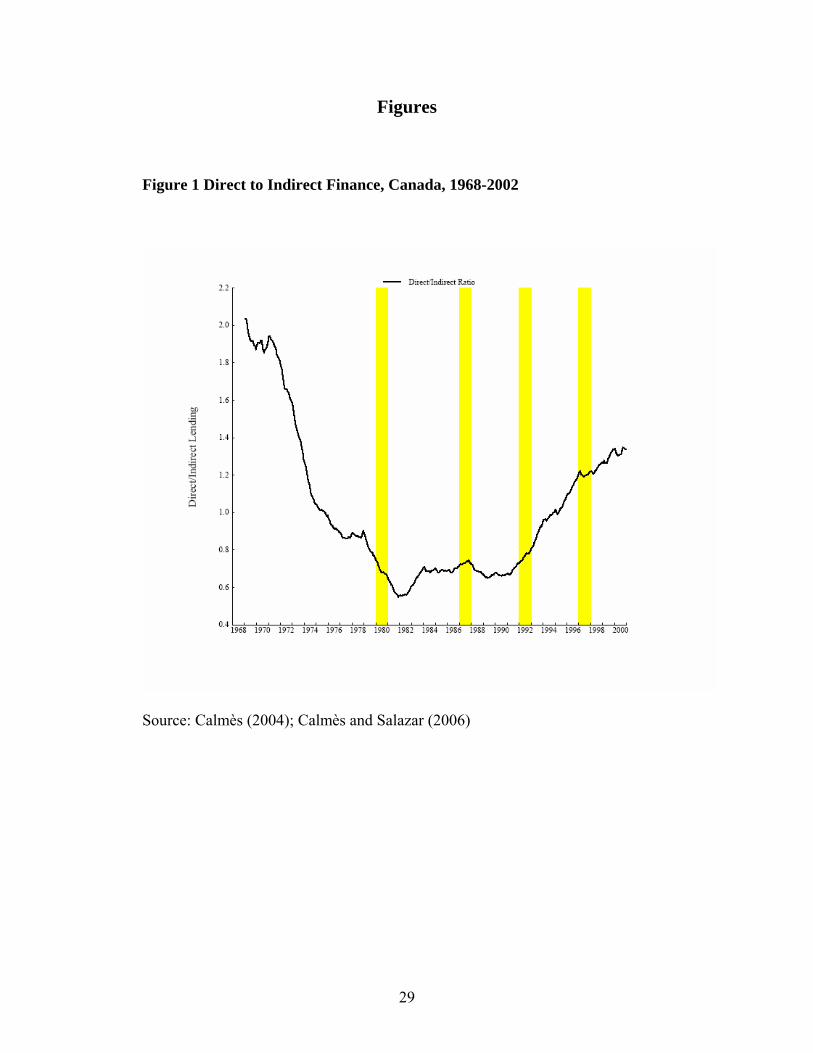
Insert figure 1 here
Figure 1 shows that a financial deepening process (as measured by the ratio of
direct to indirect finance) is developing in the Canadian financial system, since
1980.
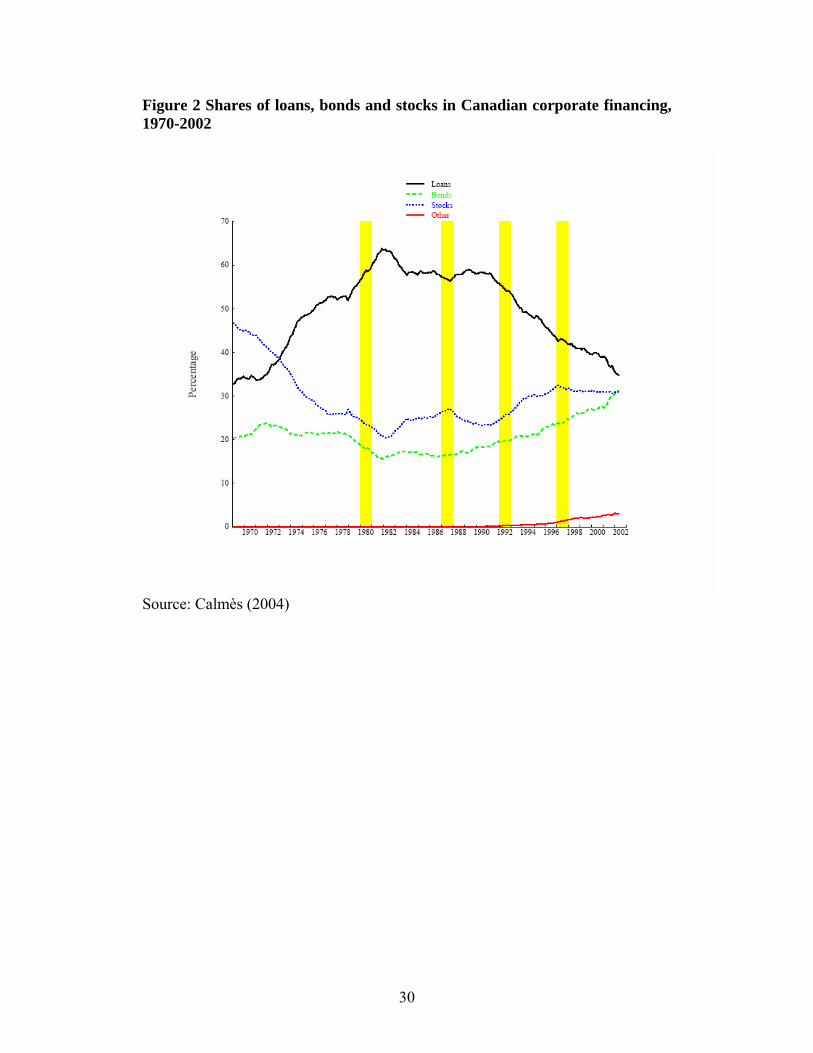
Insert figure 2 here
Consequently, and as presented in figure 2, the share of banks loans in
Canadian corporate financing has decreased progressively since 1980. In relative
terms, the shares of stocks and bonds have risen. The various amendments to the
Bank Act somewhat loosen the new constraints faced by the Canadian banking
industry. In figures 1 and 2, the dates associated to the Bank Act amendments are
shaded. Note that the market-oriented trend tends to coincide with these dates3.
Incidentally, the amendments made in 1992 and 1997 are very important in the
deregulation process, considering the changes observed thereafter.
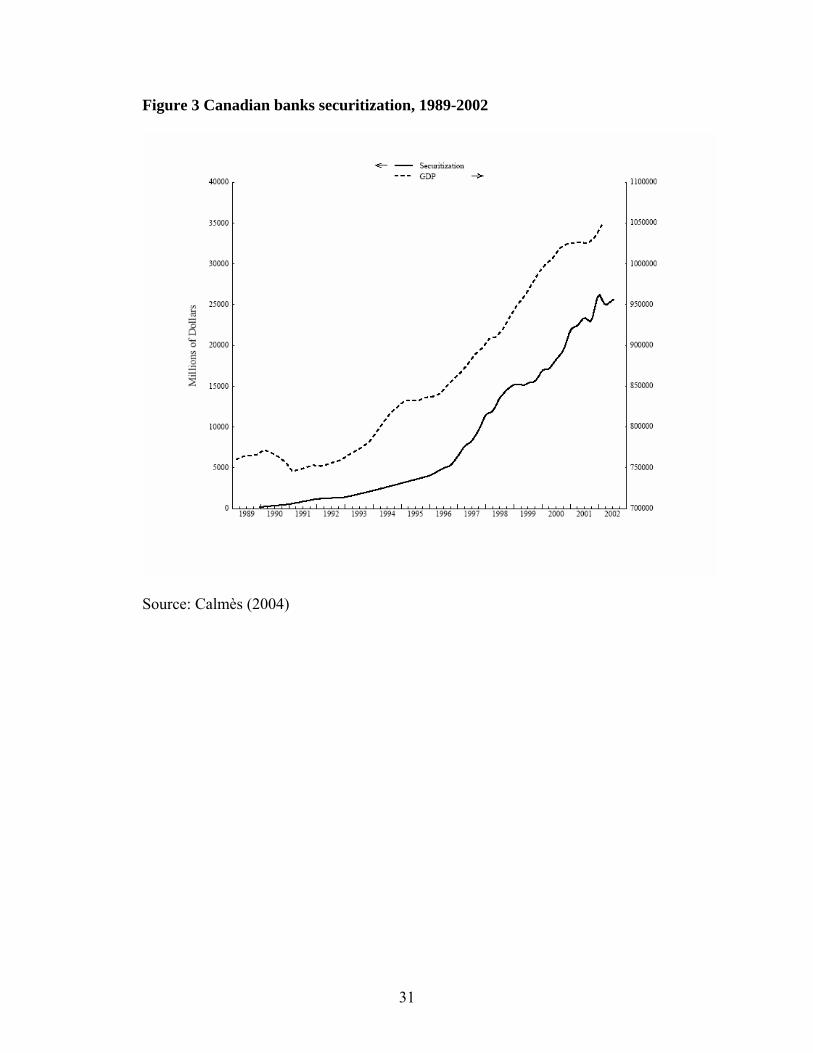
Insert figure 3 here
3 The synchronism between the Bank Act amendments and the structural breaks dates might suggest that financial deregulation is in part endogenous.
8
With deregulation, banks were also allowed to securitize their loans.
According to figure 3, the securitization process really took off in 19974. It
exploded thereafter. This non traditional activity illustrates the new type of
banking business begun after the recent changes in the Bank Act.
As a matter of fact, the Canadian banking deregulation process and the
concomitant changes in the financial system gave way to a number of OBS
activities, each generating new noninterest income. Noninterest income is a
heterogeneous aggregate that includes different components: trading income,
gains (losses) on instruments held for other than trading purposes, fiduciary
income, service fees, insurance and other fees and commissions. In the following
subsections, we detail OBS banks activities relatively to their assets and document
the resulting increased riskiness in the banking business.
2.2 Valuing Banks OBS Activities
The valuation of OBS activities presents many measurement problems
(Calmès 2004) but we can tackle them by resorting to the method suggested by
Boyd and Gertler (1994) who proposed to compute an asset-equivalent measure of
OBS activities. Let rBS be the mean return on balance sheet activities, ABS be the
value of balance sheet assets, and NBS the net revenue associated to balance sheet
activities. We have:
BSBSBS NAr =
4 The timing of securitization in Canada is partly related to the innovations made by the Canadian Mortgage and Housing Corporation (CMHC). The securitization process in Canada began in 1987 with the launching of the NHA MBS (National Housing Act – Mortgage-backed securities) by the CMHC. Securitization is much more developed in the United-States than in Canada, especially because of the earlier presence there of government-backed conduits such as Fannie Mae and Freddie Mac.
9
so
BS
BSBS r
NA =
The balance sheet assets are thus the capitalization, at the rBS rate, of the net
revenue generated by these assets. Similarly, we can write
OBS
OBSOBS r
NA =
where AOBS is the asset-equivalent of OBS activities, NOBS is the net revenue
associated to OBS activities and rOBS is the mean return on OBS activities.
Assume that
OBSBS rr =
that is the capitalization rate of balance sheet assets is the same as the one of OBS
assets. We can thus write
BSBS
OBSBS
BS
OBSOBS A
NORNNORNA
NNA ==
where NOR stands for net operating revenue. We measure respectively the ratio
(NOBS / NOR) by the share of noninterest income and the ratio (NBS / NOR) by the
share of net interest income in net operating revenue. We thus arrive at the
following measure of OBS activities, for the eight Canadian most important
banks, computed over the fourth quarter of 2007
2790228345.055.0
==×= BSOBS Asni
snoninA
where snonin represents the share of noninterest income, and sni the share of net
interest income. According to the asset equivalent computation, the assets related
to Canadian banks OBS activities are equal to 2790 billion $, an amount 122%
10
larger than the level of balance sheet assets. By comparison, they only represented
39% of balance sheet assets in 1988. Hence, we can state that similarly to the
American banks, Canadian banks activities are increasingly dominated by OBS
activities.
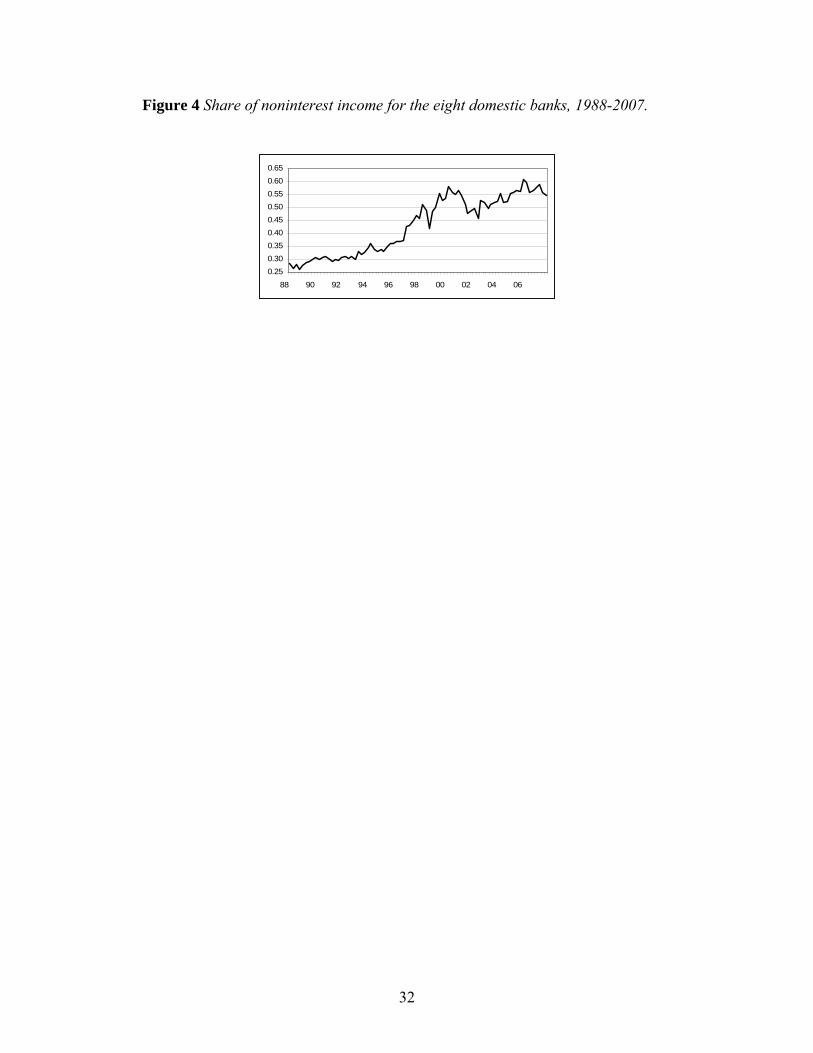
Insert figure 4 here
Figure 4 shows the resulting growing importance of the share of noninterest
income in Canadian banks' net operating revenue. Its upward trend began in 1992
and lasted until the bursting of the market bubble at the opening of the second
millennium. By 2000, noninterest income accounted for 57% of net operating
revenue, up from only 25% in 1988. This ratio seems to have stabilized thereafter,
our first evidence of a maturation process story. It recovered somewhat after the
high tech bubble burst, culminating at 60% in the first quarter of 2006 before
decreasing again with the recent credit crisis. Note also that the fluctuations of the
share of noninterest income are much larger after 1997 than before. Indeed, this
share became increasingly sensitive to the fluctuations of financial markets
(Calmès 2004, Calmès and Liu 2007).
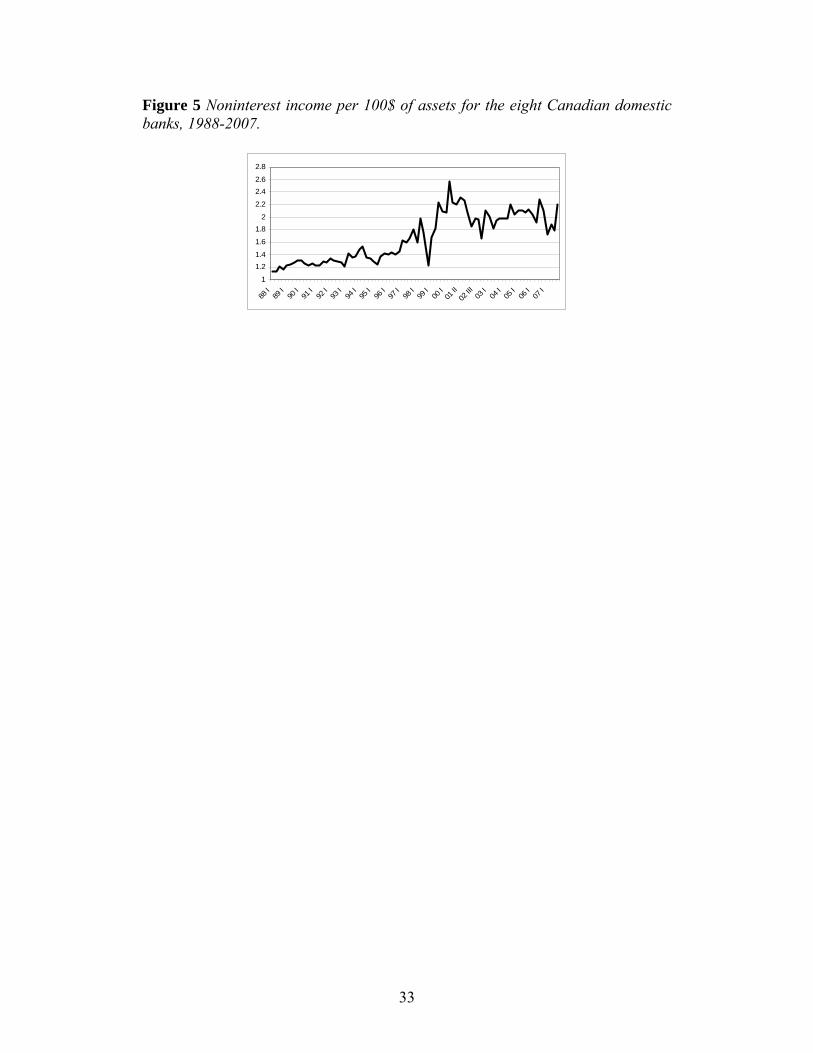
Insert figure 5 about here
As suggested by figure 5, the growing share of noninterest income in banks'
net operating revenue has boosted the bank ratio of noninterest income (per 100$
of balance sheet assets). Excluding the drop of this ratio during the 1998 financial
crisis (the Russian debt episode), this ratio doubled between 1988 and 2001. It
decreased steeply during the financial markets collapse of the beginning of the
second millennium and did not really recover thereafter. There is thus also
11
evidence of a maturation process here. Again, and similarly to the share of
noninterest income, this ratio is increasingly dependent on financial markets
fluctuations.
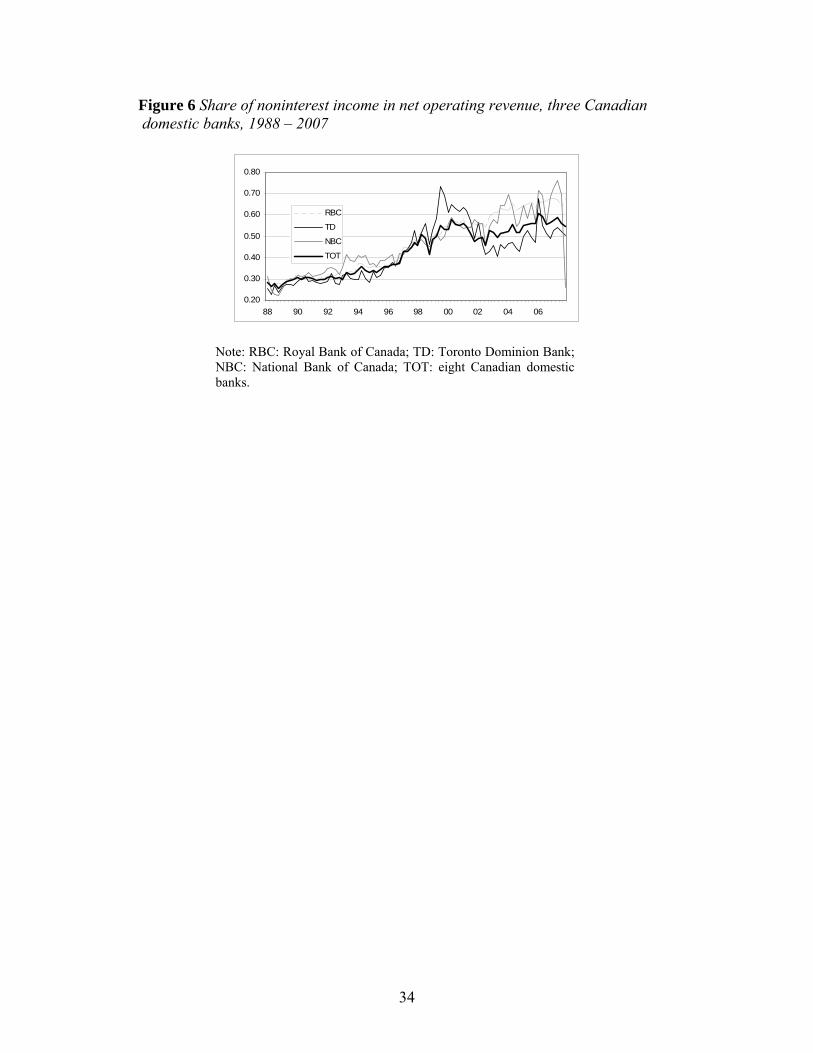
Insert figure 6 here
The post 1997 increased volatility of the noninterest income share is much
more striking if we consider individual banks instead of the pool of the eight
Canadian domestic banks. Figure 6 provides a comparison of the noninterest
shares for three Canadian banks differing by size: a relatively small-sized bank,
the National Bank of Canada (NBC); a medium-sized bank, the Toronto-
Dominion Bank (TD), and a large-sized bank, the Royal Bank of Canada (RBC).
Contrary to the RBC share, which is much more representative of the pool, the
NBC and especially the TD share have become very volatile since the financial
crisis of 1997. While the NBC share has remained on a volatile upward trend
before collapsing on the fourth quarter of 2007, the TD share has decreased
substantially since 2000. The dispersion between banks shares has also greatly
increased since 1997, perhaps an additional indication of improved diversification
in the Canadian banking industry since that year.
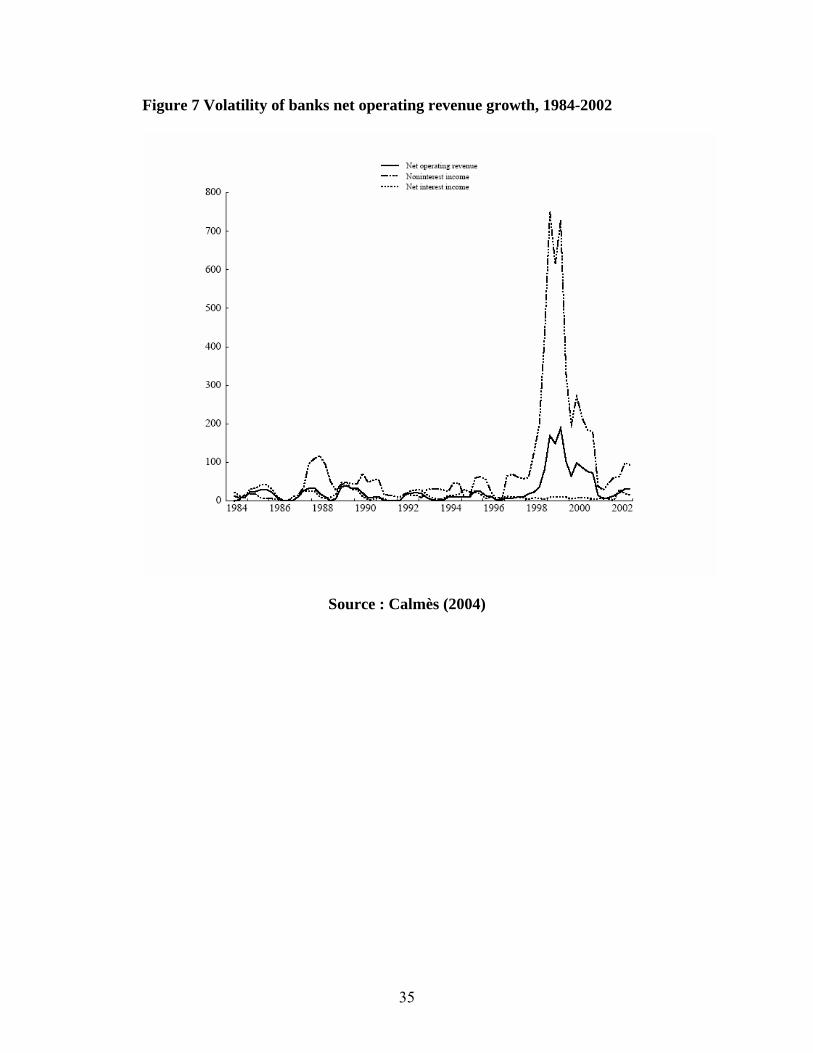
Insert figure 7 here
2.3 The Increase in Operating Revenue Growth Volatility
The noninterest income share of banks operating revenue is thus increasing.
And as shown at figure 7, the noninterest income component of banks net
operating revenue is more volatile than the net interest income one. The volatility
of the noninterest income growth was exacerbated by the market turmoil which
12
took place around the turn of the second millennium, which suggests that
noninterest income is becoming very sensitive to stock markets.
Hence, the direct impact of the growing share of noninterest income is the
increase in the volatility of banks' net operating revenue growth. Indeed, activities
related to noninterest income are much more volatile than those associated
associated to net interest income (Stiroh 2004, Calmès and Liu 2007). There is
actually a diversification effect due to the fact that the correlation between interest
and noninterest income is less than one, but this indirect effect is quite low in
comparison to the direct one (Calmès and Liu 2007). Moreover, the correlation
between these two forms of income is quite unstable. Hence, the direct
contribution of noninterest income to the volatility of net operating revenue
growth largely dominates. By increasing the operating leverage, this effect
magnifies the volatility of profits growth (De Young and Roland 2001).
A decomposition of the variance of Canadian banks net operating revenue
growth will shed more light on the relative contribution of noninterest income to
the increased volatility of total income growth.
Following Stiroh (2006) and Calmès and Liu (2007), we decompose the net
operating revenue growth with a portfolio approach in order to analyze its
volatility with two components: volatility of net interest income growth and
volatility of noninterest income growth. The growth of net operating revenue
(NOR) is computed as:
( ) ( )11
lnlnln)ln( −−
−=⎟⎟⎠
⎞⎜⎜⎝
⎛= tt
t
t NORNORNORNORNORd
Its variance may thus be decomposed as follows:
13
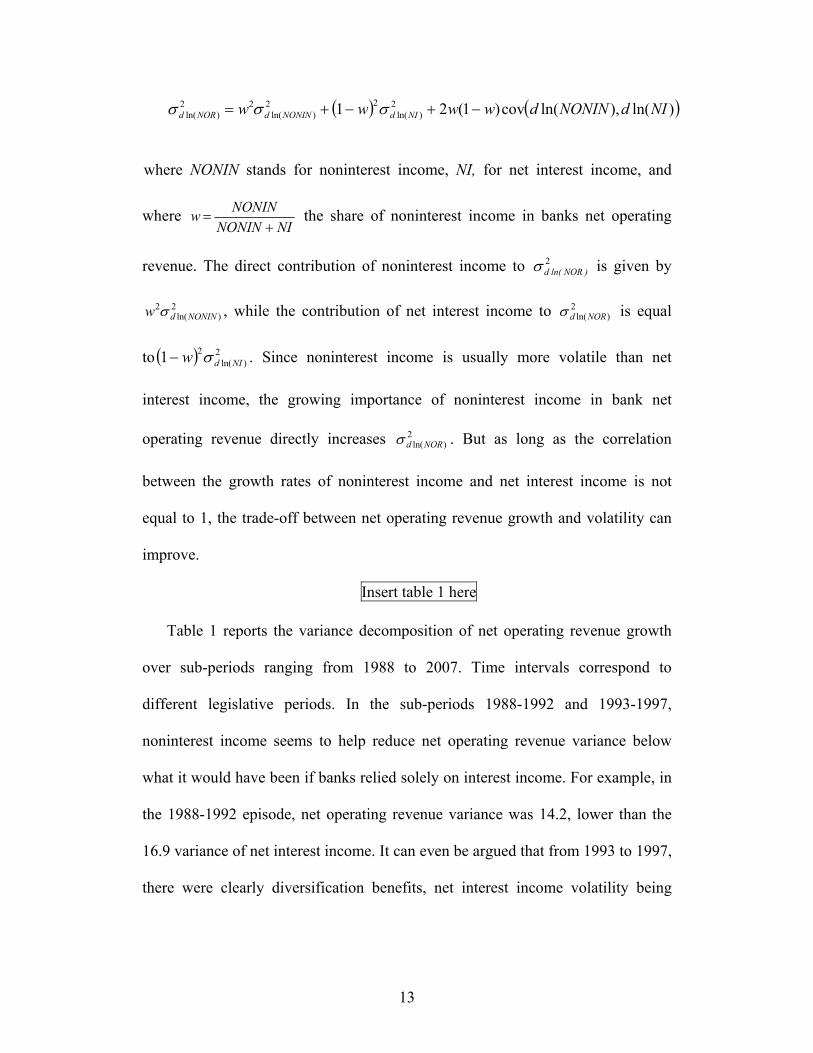
( ) ( ))ln(),ln(cov)1(21 2)ln(
22)ln(
22)ln( NIdNONINdwwww NIdNONINdNORd −+−+= σσσ
where NONIN stands for noninterest income, NI, for net interest income, and
where NINONIN
NONINw+
= the share of noninterest income in banks net operating
revenue. The direct contribution of noninterest income to 2)NORln(dσ is given by
2)ln(
2NONINdw σ , while the contribution of net interest income to 2
)ln(NORdσ is equal
to ( ) 2)ln(
21 NIdw σ− . Since noninterest income is usually more volatile than net
interest income, the growing importance of noninterest income in bank net
operating revenue directly increases 2)ln(NORdσ . But as long as the correlation
between the growth rates of noninterest income and net interest income is not
equal to 1, the trade-off between net operating revenue growth and volatility can
improve.
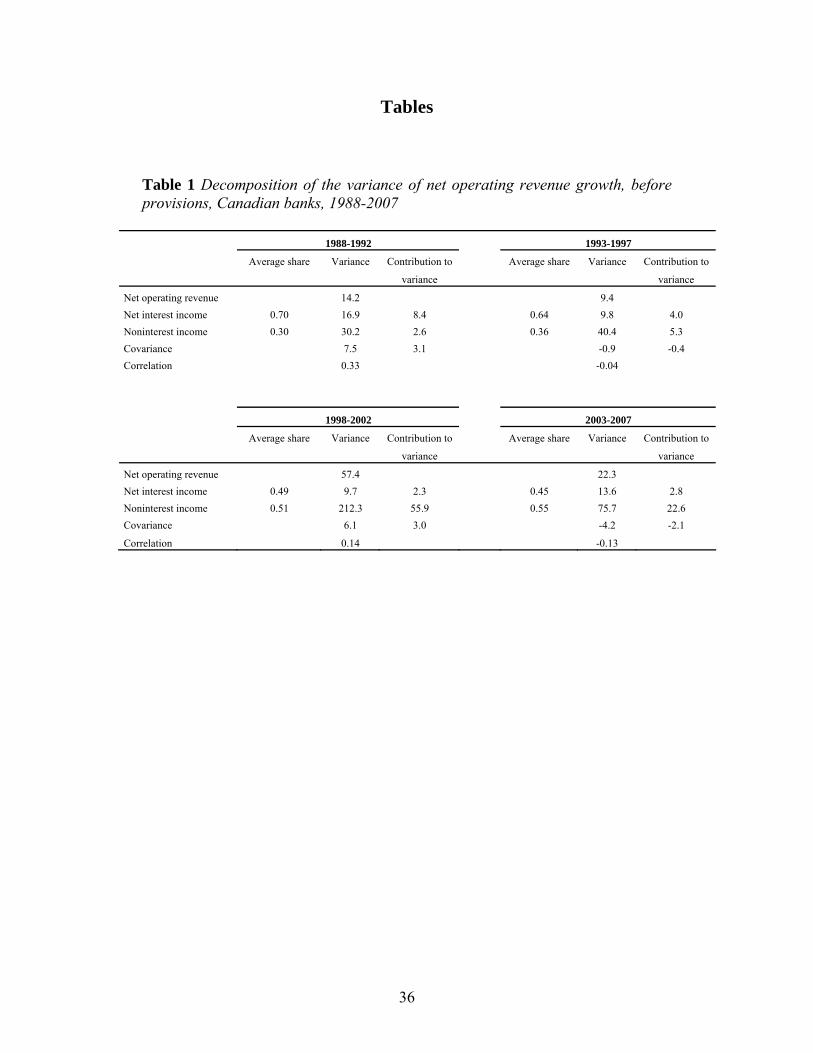
Insert table 1 here
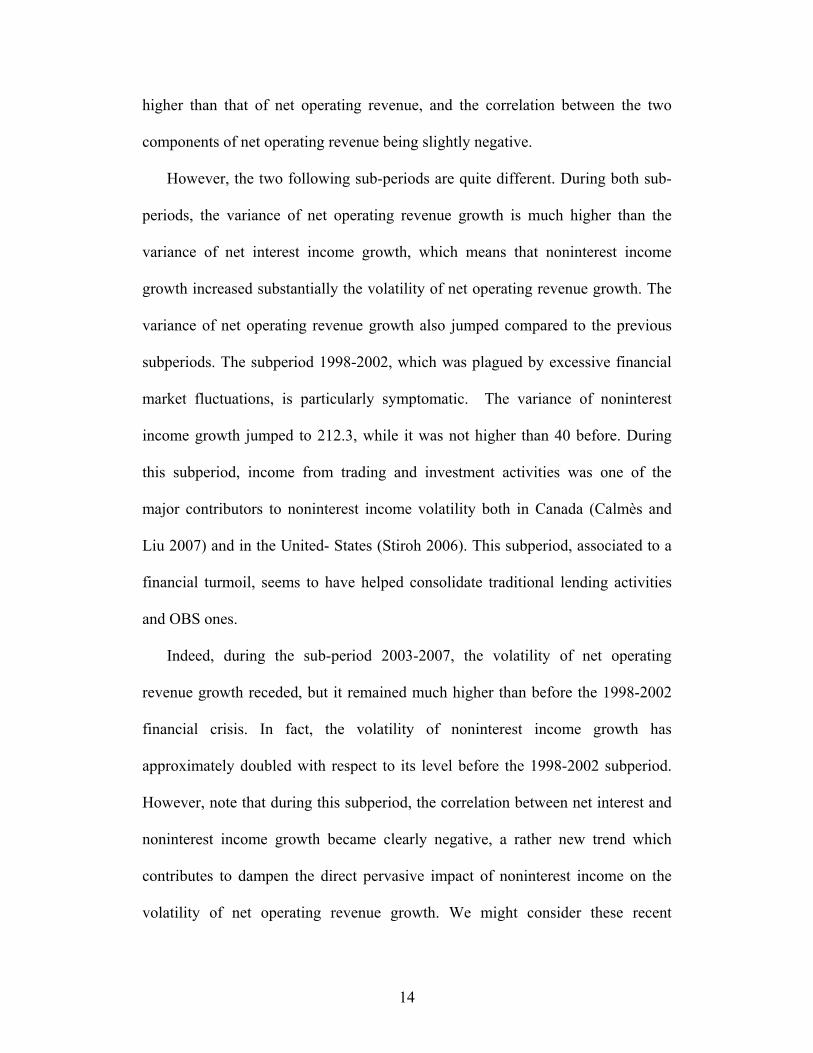
Table 1 reports the variance decomposition of net operating revenue growth
over sub-periods ranging from 1988 to 2007. Time intervals correspond to
different legislative periods. In the sub-periods 1988-1992 and 1993-1997,
noninterest income seems to help reduce net operating revenue variance below
what it would have been if banks relied solely on interest income. For example, in
the 1988-1992 episode, net operating revenue variance was 14.2, lower than the
16.9 variance of net interest income. It can even be argued that from 1993 to 1997,
there were clearly diversification benefits, net interest income volatility being
14
higher than that of net operating revenue, and the correlation between the two
components of net operating revenue being slightly negative.
However, the two following sub-periods are quite different. During both sub-
periods, the variance of net operating revenue growth is much higher than the
variance of net interest income growth, which means that noninterest income
growth increased substantially the volatility of net operating revenue growth. The
variance of net operating revenue growth also jumped compared to the previous
subperiods. The subperiod 1998-2002, which was plagued by excessive financial
market fluctuations, is particularly symptomatic. The variance of noninterest
income growth jumped to 212.3, while it was not higher than 40 before. During
this subperiod, income from trading and investment activities was one of the
major contributors to noninterest income volatility both in Canada (Calmès and
Liu 2007) and in the United- States (Stiroh 2006). This subperiod, associated to a
financial turmoil, seems to have helped consolidate traditional lending activities
and OBS ones.
Indeed, during the sub-period 2003-2007, the volatility of net operating
revenue growth receded, but it remained much higher than before the 1998-2002
financial crisis. In fact, the volatility of noninterest income growth has
approximately doubled with respect to its level before the 1998-2002 subperiod.
However, note that during this subperiod, the correlation between net interest and
noninterest income growth became clearly negative, a rather new trend which
contributes to dampen the direct pervasive impact of noninterest income on the
volatility of net operating revenue growth. We might consider these recent
15
developments as the concretization of a maturation process. In other words, this
observation is consistent with the idea that non traditional activities are now better
understood and managed − a standard “learning by doing” took place. Note
however that the volatility of noninterest income growth is increasingly related to
the one of income from trading and investment activities, the highest among the
components of noninterest income, a delicate situation from the standpoint of the
risk-return trade-off.
To conclude, the Canadian banking system definitively became riskier
following the successive deregulation waves, and this might be bad news from the
standpoint of financial stability. But thanks to the financial market turmoil we
recently went through, adjustments to deregulation are now on the way. We test
these hypotheses in the next sections.
3. A Conjecture about the Deteriorating Risk-Return Trade-Off OBS activities generate a specific systemic risk, which, by nature, is non-
diversifiable. Consequently, Canadian banks have become more sensitive to
aggregate shocks (both macroeconomic and financial). Our preliminary
experiments results tend to suggest that financial aggregate shocks have gained
momentum relative to indiosyncratic ones. Houston and Stiroh (2006) document
the same phenomenon in the United-States. And data suggest that this situation is
even more pronounced if we shift the analyis from individual banks to the whole
set of Canadian banks. There also seems to be some evidence of a herding
behaviour whereby banks tend to behave alike when faced by aggregate shocks,
16
which both add to and compound the existing systemic risk (Calmès and Salazar
2006).
In this context, net interest income, being related to physical stocks, (e.g.
loans and other assets), tends to respond to idiosyncratic shocks, like borrower
default, whereas noninterest income, being related to flows, (e.g. service fees and
trading revenues) would react more to aggregate shocks, like unexpected changes
in stock market indices and macroeconomic aggregates (Calmès 2003). Since the
former shocks are diversifiable while the latter are not, this observation
complements the idea that the changing structure of bank revenues is associated
with increasingly volatile banks' net operating revenues growth, as already
suggested in Calmès (2004) and Stiroh (2004). With a greater involvement in OBS
activities, Canadian banks are more sensitive to financial aggregate shocks.
In this spirit, Houston and Stiroh (2006) find that financial aggregate risk has
increased in the United-States since 1990 (relative to idiosyncratic risk). We still
have to confirm this more formally, but if this is also the case for Canada, there
would be an additional force driving banking risk and compounding the effect of
higher banks sensitivity to risk5. We can represent the banks exposure to aggregate
shocks by the simple following product:
Exposure to aggregate risk = sensitivity to aggregate shocks x level of aggregate risk
where the level of aggregate risk is itself the product of aggregate risk frequency
and intensity. While the two factors on the RHS of this equation rise as it has been
the case in recent episodes, it constitutes a situation unfavourable to financial
stability.
5 We are currently conducting research on that topic.
17
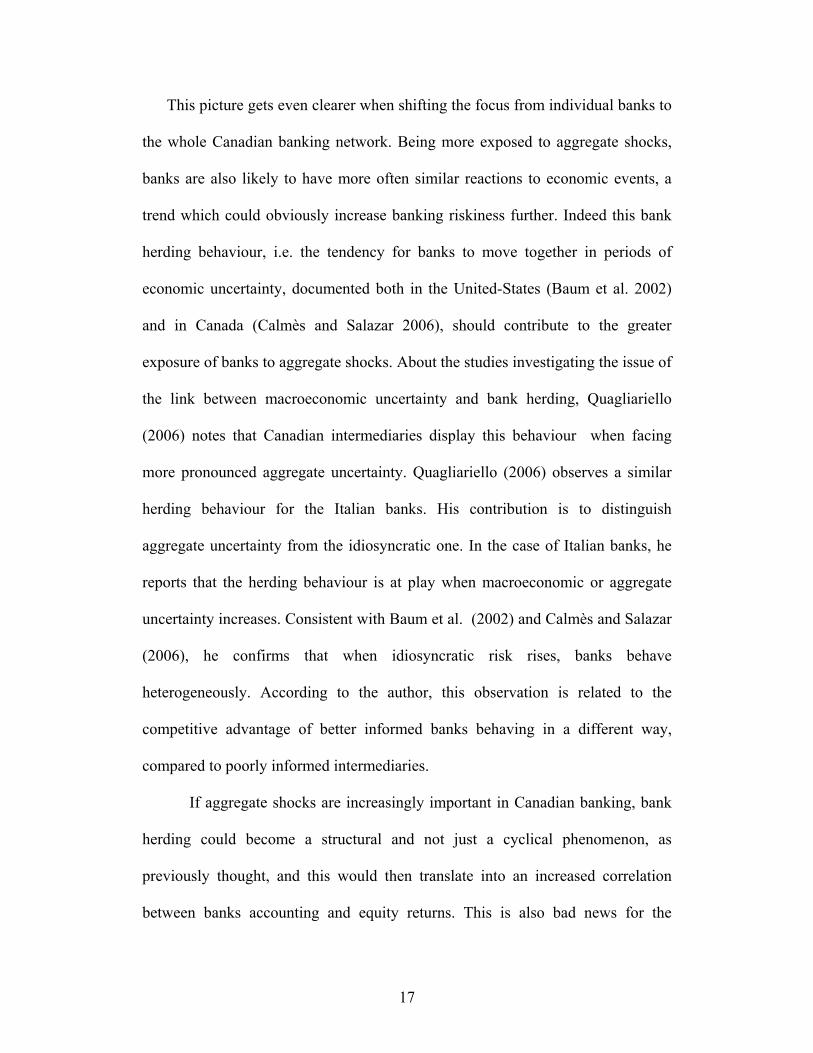
This picture gets even clearer when shifting the focus from individual banks to
the whole Canadian banking network. Being more exposed to aggregate shocks,
banks are also likely to have more often similar reactions to economic events, a
trend which could obviously increase banking riskiness further. Indeed this bank
herding behaviour, i.e. the tendency for banks to move together in periods of
economic uncertainty, documented both in the United-States (Baum et al. 2002)
and in Canada (Calmès and Salazar 2006), should contribute to the greater
exposure of banks to aggregate shocks. About the studies investigating the issue of
the link between macroeconomic uncertainty and bank herding, Quagliariello
(2006) notes that Canadian intermediaries display this behaviour when facing
more pronounced aggregate uncertainty. Quagliariello (2006) observes a similar
herding behaviour for the Italian banks. His contribution is to distinguish
aggregate uncertainty from the idiosyncratic one. In the case of Italian banks, he
reports that the herding behaviour is at play when macroeconomic or aggregate
uncertainty increases. Consistent with Baum et al. (2002) and Calmès and Salazar
(2006), he confirms that when idiosyncratic risk rises, banks behave
heterogeneously. According to the author, this observation is related to the
competitive advantage of better informed banks behaving in a different way,
compared to poorly informed intermediaries.
If aggregate shocks are increasingly important in Canadian banking, bank
herding could become a structural and not just a cyclical phenomenon, as
previously thought, and this would then translate into an increased correlation
between banks accounting and equity returns. This is also bad news for the
18
investors in search of portfolio diversification, since herding is at the antipodes of
diversification and it weakens banking stability.
4. Methodology and Empirical Results
4.1 Two Hypotheses about the Maturation Process
It is well-known that markets usually undertake the necessary adjustments
when confronted with increased risk. According to the stylized facts we document,
a structural break has taken place around 1997. In this respect, the hypotheses
studied in this paper are the following.
We want first to examine whether there is a maturation process taking place in
the Canadian banking sector, as expected by Calmès (2003). According to this
hypothesis, in the long run, the share of noninterest income in banks' net operating
revenue would no longer impact negatively on banks accounting performance
measures. We confirm this idea and date the break-even point around 1997. A
Chow test is run to check for this structural break.
Second, we want to confirm that, in light of the increased riskiness of their
operations, Canadian banks have adjusted to this situation by incorporating a risk
premium in the return of their OBS activities. This premium, pricing the risk
associated to OBS activities, came with some delay, and emerged around the year
1997.
Note that De Young and Roland (2001) conjecture that the surging volatility
of banks revenues should give rise to the incorporation of risk premia in various
measures of bank accounting returns. However, they did not test this conjecture.
19
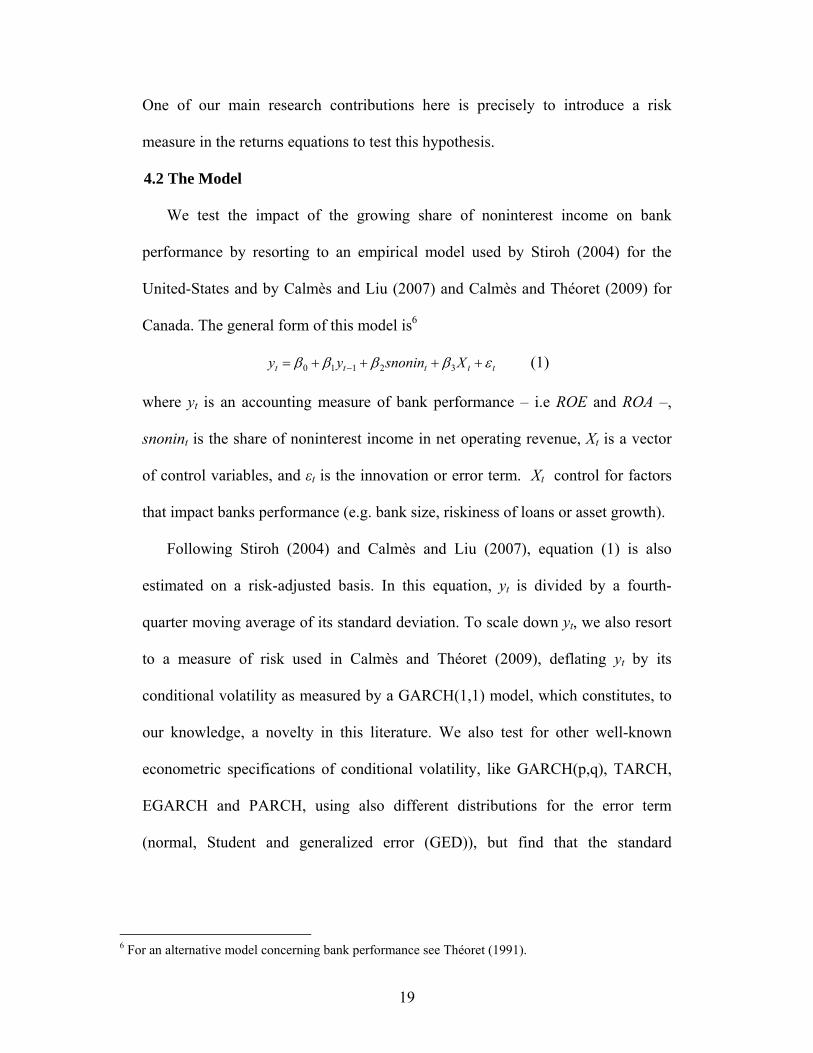
One of our main research contributions here is precisely to introduce a risk
measure in the returns equations to test this hypothesis.
4.2 The Model
We test the impact of the growing share of noninterest income on bank
performance by resorting to an empirical model used by Stiroh (2004) for the
United-States and by Calmès and Liu (2007) and Calmès and Théoret (2009) for
Canada. The general form of this model is6
ttttt Xsnoninyy εββββ ++++= − 32110 (1)
where yt is an accounting measure of bank performance – i.e ROE and ROA –,
snonint is the share of noninterest income in net operating revenue, Xt is a vector
of control variables, and εt is the innovation or error term. Xt control for factors
that impact banks performance (e.g. bank size, riskiness of loans or asset growth).
Following Stiroh (2004) and Calmès and Liu (2007), equation (1) is also
estimated on a risk-adjusted basis. In this equation, yt is divided by a fourth-
quarter moving average of its standard deviation. To scale down yt, we also resort
to a measure of risk used in Calmès and Théoret (2009), deflating yt by its
conditional volatility as measured by a GARCH(1,1) model, which constitutes, to
our knowledge, a novelty in this literature. We also test for other well-known
econometric specifications of conditional volatility, like GARCH(p,q), TARCH,
EGARCH and PARCH, using also different distributions for the error term
(normal, Student and generalized error (GED)), but find that the standard
6 For an alternative model concerning bank performance see Théoret (1991).
20
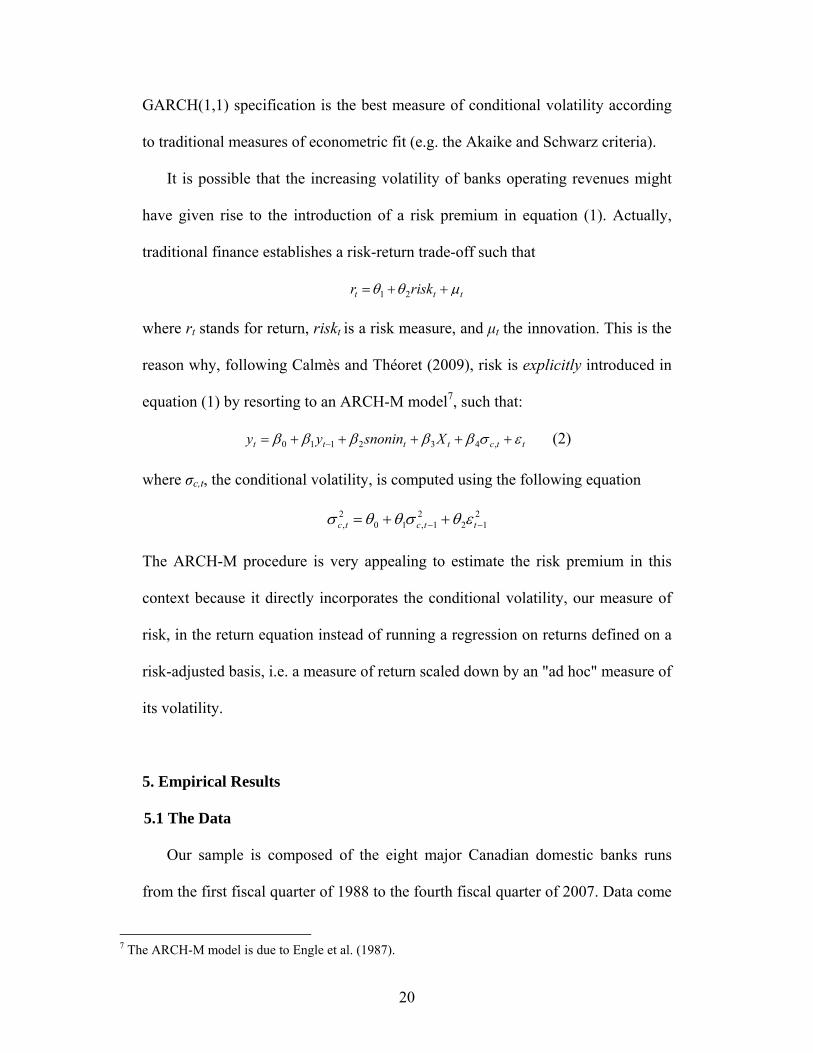
GARCH(1,1) specification is the best measure of conditional volatility according
to traditional measures of econometric fit (e.g. the Akaike and Schwarz criteria).
It is possible that the increasing volatility of banks operating revenues might
have given rise to the introduction of a risk premium in equation (1). Actually,
traditional finance establishes a risk-return trade-off such that
ttt riskr μθθ ++= 21
where rt stands for return, riskt is a risk measure, and μt the innovation. This is the
reason why, following Calmès and Théoret (2009), risk is explicitly introduced in
equation (1) by resorting to an ARCH-M model7, such that:
ttctttt Xsnoninyy εσβββββ +++++= − ,432110 (2)
where σc,t, the conditional volatility, is computed using the following equation
212
21,10
2, −− ++= ttctc εθσθθσ
The ARCH-M procedure is very appealing to estimate the risk premium in this
context because it directly incorporates the conditional volatility, our measure of
risk, in the return equation instead of running a regression on returns defined on a
risk-adjusted basis, i.e. a measure of return scaled down by an "ad hoc" measure of
its volatility.
5. Empirical Results
5.1 The Data
Our sample is composed of the eight major Canadian domestic banks runs
from the first fiscal quarter of 1988 to the fourth fiscal quarter of 2007. Data come
7 The ARCH-M model is due to Engle et al. (1987).
21
from the Canadian Bankers Association and the Office of the Superintendent of
Financial Institutions (Canada). Unit root tests suggest that all statistical series are
stationary, so they are modelled in levels. Following Calmès and Liu (2007), we
keep the ratio of loan loss provisions to total assets as the only control variable
because the other ones are found not significant.
5.2 The Results over the Whole Sample
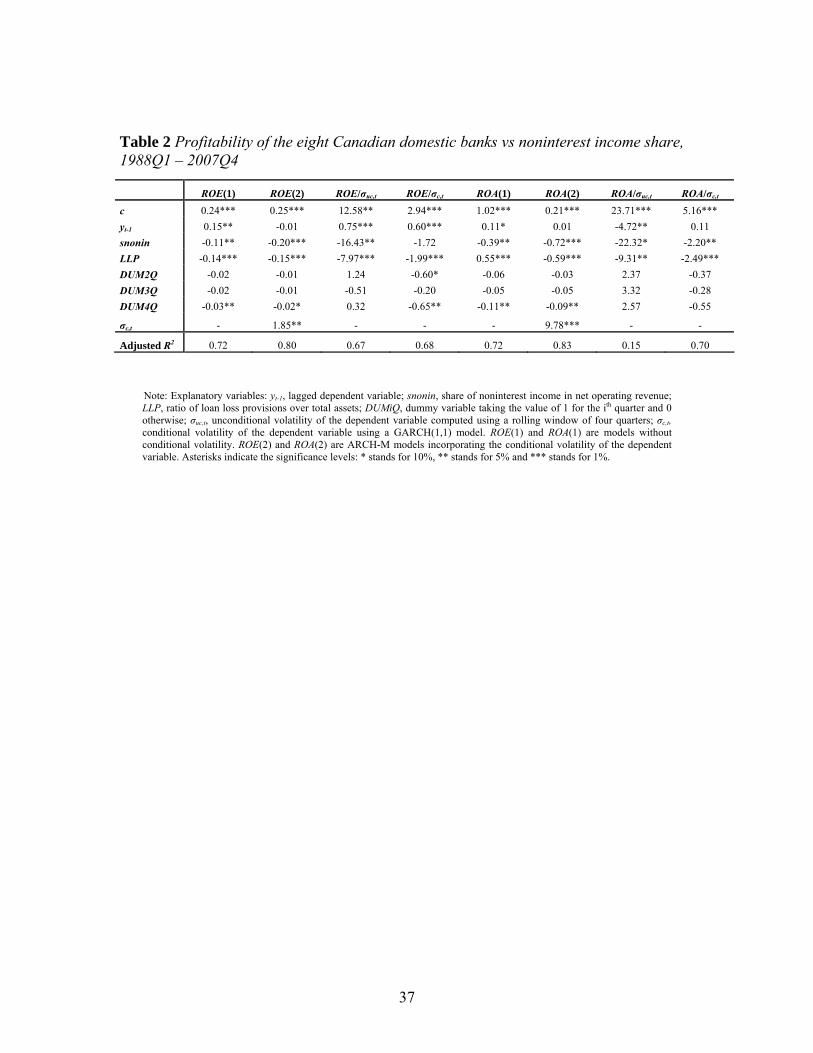
Table 2 reports the estimation of equations (1) and (2) for the whole sample
period running from 1988 to 2007. Estimating equation (1) − which excludes a
risk premium − for the ratios ROE and ROA gives good results with an adjusted R2
equal to 0.72 for both ratios. Before adjusting for risk, estimation of equation (1)
reveals that the coefficient of the share of noninterest income is significantly
negative for the two performance ratios. This sign confirms that increased OBS
activities tended to reduce Canadian banks mean returns over the whole period of
analysis. It is equal to -0.11 in the ROE equation, and a much higher figure obtains
for ROA one, -0.39, an expected result since the ratio of ROA to ROE is mean-
reverting to a level of 4 over the period of analysis (this ratio is not very volatile
except during extreme events8). These results suggest that OBS activities reduce
the performance of Canadian banks in terms of mean returns over the whole
sample period, while they also increase the volatility of bank net operating
revenue growth.
Insert table 2 here
8 For instance, for the fourth fiscal quarter of 2007, the eight major Canadian banks had a ROE of 0.18 and a ROA of 0.79.
22
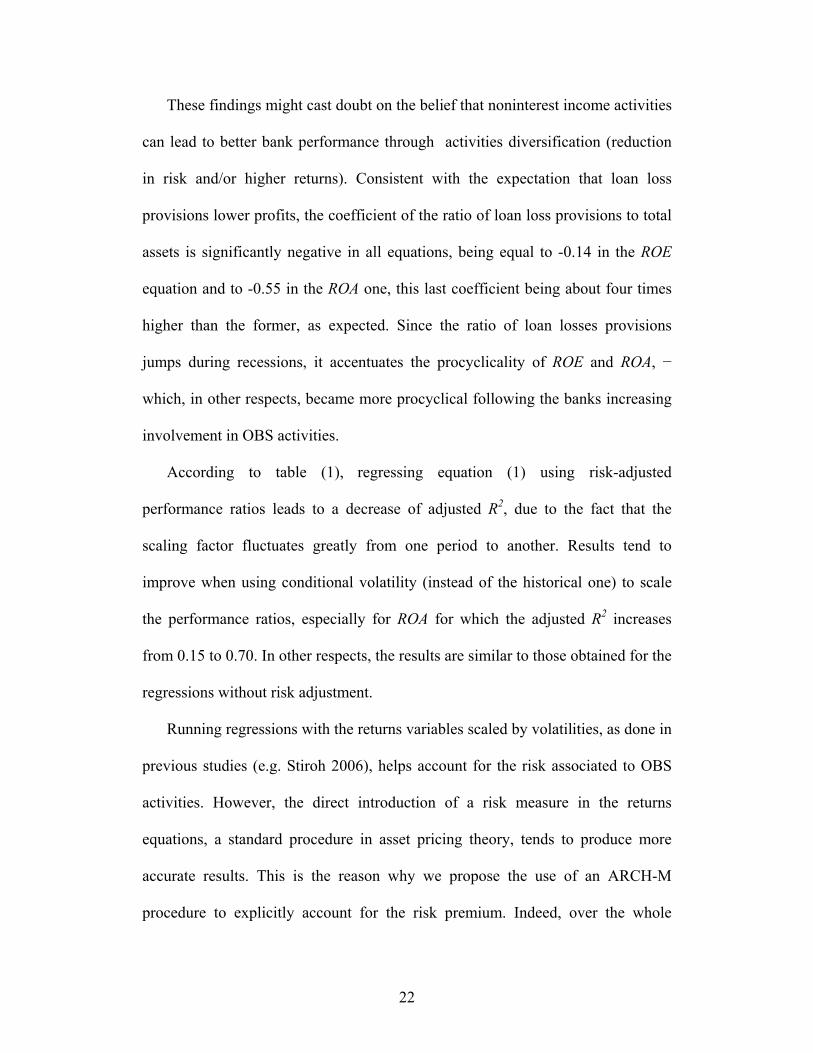
These findings might cast doubt on the belief that noninterest income activities
can lead to better bank performance through activities diversification (reduction
in risk and/or higher returns). Consistent with the expectation that loan loss
provisions lower profits, the coefficient of the ratio of loan loss provisions to total
assets is significantly negative in all equations, being equal to -0.14 in the ROE
equation and to -0.55 in the ROA one, this last coefficient being about four times
higher than the former, as expected. Since the ratio of loan losses provisions
jumps during recessions, it accentuates the procyclicality of ROE and ROA, −
which, in other respects, became more procyclical following the banks increasing
involvement in OBS activities.
According to table (1), regressing equation (1) using risk-adjusted
performance ratios leads to a decrease of adjusted R2, due to the fact that the
scaling factor fluctuates greatly from one period to another. Results tend to
improve when using conditional volatility (instead of the historical one) to scale
the performance ratios, especially for ROA for which the adjusted R2 increases
from 0.15 to 0.70. In other respects, the results are similar to those obtained for the
regressions without risk adjustment.
Running regressions with the returns variables scaled by volatilities, as done in
previous studies (e.g. Stiroh 2006), helps account for the risk associated to OBS
activities. However, the direct introduction of a risk measure in the returns
equations, a standard procedure in asset pricing theory, tends to produce more
accurate results. This is the reason why we propose the use of an ARCH-M
procedure to explicitly account for the risk premium. Indeed, over the whole
23
sample period, this approach improves the adjusted R2 for both equations of ROE
and ROA. The sensitivity of ROE to the conditional volatility of the innovation is
1.85. At 9.78, it appears much higher for ROA, a normal situation, as explained
earlier. More importantly, the rigorous incorporation of a risk premium in the
returns equation leads to some significant changes in the sensitivities of ROE and
ROA to the yt-1 and snonin variables. In both equations, following the addition of a
risk premium, the coefficient of snonin almost double in absolute value, shifting
from -0.11 to -0.20 in the ROE equation and from -0.39 to -0.72 in the ROA one.
This shift is achieved at the expense of the autoregression coefficient. Before
adding the risk premium, the coefficient of yt-1 is equal to 0.15 for ROE and 0.11
for ROA, and is significant for both returns measures. But when accounting for the
risk premium, the coefficient of yt-1 is near 0 in both equations, and no longer
significant. In summary, introducing the risk premium in the returns equation
neutralizes the autoregressivity of the returns variables, transfering this impact to
the snonin variable, which becomes even more potent. Hence, the standard
specification of returns overstates the role of yt-1 relative to snonin. Using our
approach instead, snonin appears to be the main factor for explaining banks
returns over the whole sample.
5.3 The Maturation Process Story
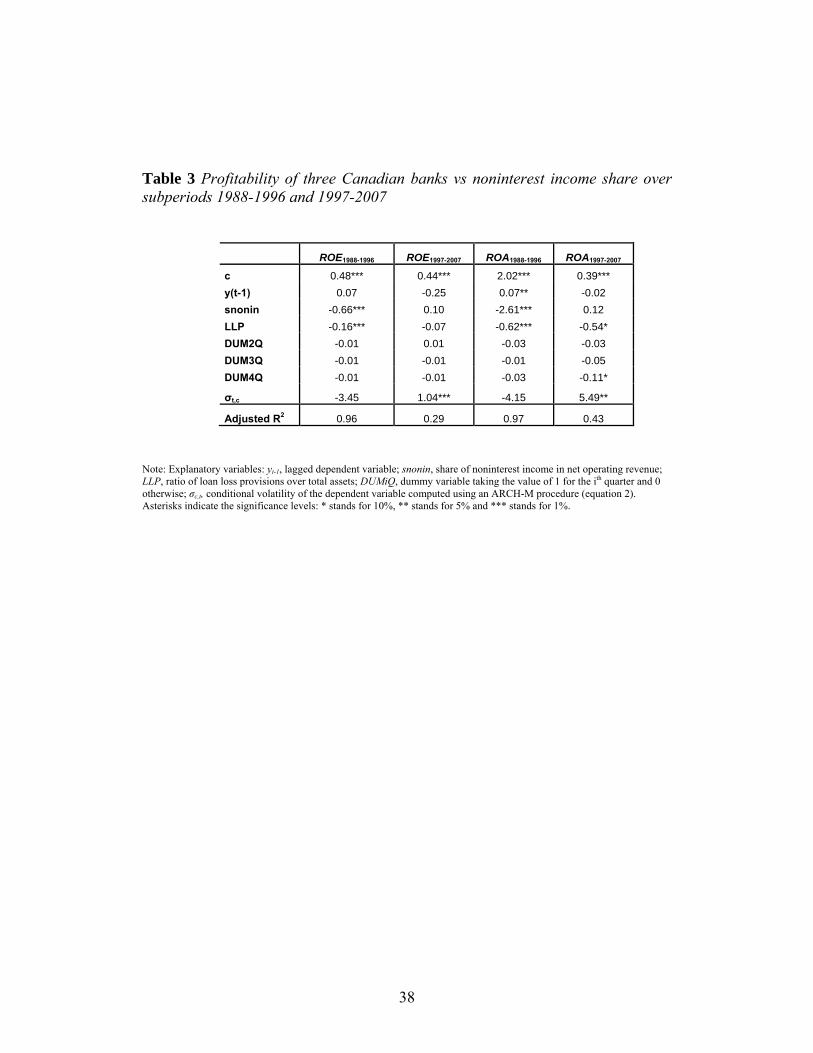
As documented previously, a structural break took place around 1997 (Pellerin
2008). This break corresponds to the increase in the volatility of the net operating
revenues growth and of the ratio of noninterest income (per 100$ of assets). We
thus reestimate equation (2) over the two following subperiods: 1988-1996 and
24
1997-2007. The results are reported in table 3. A Chow test confirms that a
structural break occurred around 1997. According to table 3, hypothesis 1 tends to
be supported by the data. The strong negative effect of snonin on either ROE or
ROA seems to have been only significant over the first subperiod, running from
1988 to 1996. Indeed, the estimated coefficients of the snonin variable are much
higher over the first subperiod (1988-1996) than over the whole sample (1988-
2007), being respectively -0.66 and -2.61 for ROE and ROA over the former
period and -0.20 an -0.72 over the latter period. In the second subperiod (1997-
2007), the coefficient of snonin is actually positive but not significant in both
returns equations (i.e. for ROE and ROA). This evidence supports the hypothesis
that a maturation process took place, which led to a better integration of the
traditional bank lending activities with OBS ones. In other words, adjustment to
the worsening risk-return trade-off was slow to materialize (Calmès 2003), but
finally emerged in the second part of the sample.
The second hypothesis seems also supported by the empirical evidence. The
ARCH-M procedure used in this paper proves very useful for capturing the
nonlinearity created by the change in volatility of revenues. As table 3 shows, a
significant risk premium, required to price the increasing risk related to the
surging OBS activities, emerges in the second subperiod, the coefficients
associated to the conditional volatility being respectively 1.04 and 5.49 for ROE
and ROA, both significant at the 5% level. In contrast, over the first subperiod, this
risk premium is not significant. The sign of the coefficients of the conditional
volatility is even negative in both equations, suggesting that over this subperiod,
25
volatility was actually detrimental to returns. As noted previously, beginning
around 1997, the volatility of the operating revenues growth and of the share of
noninterest income have increased greatly. Finally note that, for both returns, the
adjusted R2 is much lower in the second subperiod because the idiosyncratic risk
increased substantially during this second subperiod (1997-2007).
To conclude on these experiments, this evidence supports the idea that a
maturation process took place, and that Canadian banks have adapted to the
increased volatility of their operations.
6. Conclusion
Following deregulation, risk definitively increased in the Canadian banking
system because the volatility of noninterest income growth is much higher than
the one of net interest income growth. Even if the adequate pricing for this
increased risk was slow to materialize, it finally emerged in 1997, and financial
institutions adapted to the new situation. Previous studies on the subject (e.g.
Stiroh 2006, Calmès and Liu 2007) were somewhat dubious about the
diversification benefits associated to the rising share of OBS activities, and about
their relative profitability. The new evidence we provide suggests that a
maturation process is actually at play, leading to a better pricing of banks
activities and a better integration of these activities with traditional lending in the
more recent periods (after 1997). Actually, over the last period running from 2003
to 2007, a significant negative correlation appeared between interest and
26
noninterest income, which has been rarely the case before. This suggests that the
OBS diversifications benefits finally unravels.
Concerning the need to re-regulate in order to control the increased risk in the
Canadian banking system, we must realize that the move toward OBS activities
might be endogenous to the banking industry, in the sense that it was originated by
banks themselves. Under that scenario, banks initiated and even fostered the
financial deregulation process, by shifting their activities toward, a priori, more
profitable ones, like underwriting and securitization. Indeed, the branches network
of Canadian banks was becoming less profitable. During the transition, banks have
encouraged their customers to be more market-oriented, substituting securities
issues for loans. Based on this plausible scenario and on the endogeneity of the
deregulation process, re-regulation would not be a good idea. There is also
evidence that banks engaged in new activities before having received the
authorization to do so9. The legislators only sanctioned such moves, an example of
banks and government intermingling interests.
Our results open the doors to very promising research avenues. First, the
decision by a bank to diversify its activities has to be endogenized, as suggested
by Campa and Kedia (2002), a research avenue previously mentioned by Stiroh
(2006)10.
Second, the pricing of OBS activities is still in its infancy in the setting of the
literature related to our study. Our paper makes a first contribution in that
9 This was the case for two Canadian banks engaged in brokerage activities before the 1987 Bank Act amendment. Banks capitalized on Bank Act loopholes at the time. 10 We are presently conducting research on the subject.
27
direction. However, equations of banks returns must be improved further to shed
more light on the banks risk-return trade-off.
References
Acharya, V. V., Iftekhar, H., and Saunders, A. (2002) “The effects of Focus and Diversification on Bank Risk and Return: Evidence from Individual Bank Loan Portfolio”, Working Paper, New Jersey Institute of thechnology.
Baum, C.F., Caglayan, M., and Ozhan, N. (2002) “The Impact of Macroeconomic Uncertainty on Bank Lending Behaviour. ” Working Paper, University of Liverpool.
Baum, C.F., Caglayan, M., and Ozhan, N. (2005) “The second moments matter: The response of bank lending behaviour to macroeconomic uncertainty.” Working Paper no. 521, Boston College.
Boyd, J.H., and Gertler, M. (1994) “Are Banks Dead? Or are the reports greatly exaggerated?.” Federal Reserve Bank of Minneapolis Quarterly Review, 18(3), 1-27.
Caballero, R.J., and Engle, E. (2003) “Adjustment is much slower than you think.” Working Paper no. 9898, National Bureau of Economic Research.
Calmès, C. (2003) “Revenue Shift and Performance of U.S. Bank Holding Companies, a Discussion.” The Evolving Financial System and Public Policy. Bank of Canada Conference organized by Christian Calmès, 12-05-2003.
Calmès, C. (2004) “Regulatory changes and financial structure: the case of Canada.” Swiss Journal of Economics and Statistics, 140(1), 1-35.
Calmès, C., and Liu, Y. (2007) “Financial structure change and banking income: a Canada – U.S. comparison.” Journal of International Financial Markets, Institutions and Money, in press.
Calmès, C., and Salazar J. (2006) “Variance macroéconomique conditionnelle et mesure de dispersion des actifs dans les portefeuilles bancaires.” In: Racicot, F.E., and Théoret, R., Finance computationnelle et gestion des risques. Presses de l'Université du Québec: Ste-Foy.
Calmès, C., and Théoret, R. (2009) “Surging OBS activities and banks revenue volatility: Or how to explain the declining appeal of bank stocks in Canada.” In: Stock Market Volatility. Chapman & Hall/CRC Finance Series, forthcoming.
Campa, J.M., and Kedia, S. (2002) “Explaining the diversification discount.” Journal of Finance, 57 (4), 1731-1762.
Cecchetti, S.G. (2008) “Crisis and responses: the Federal Reserve and the financial crisis of 2007-2008.” Working Paper no. 14134, National Bureau of Economic Research.
DeYoung, R., and Roland, K.P. (2001) “Product mix and earnings volatility at commercial banks: evidence from a degree of total leverage model.” Journal of Financial Intermediation, 10(1), 54-84.
28
Engle, R.F., Lilien, D.M., and Robins, R.P. (1986) “Estimating Time-Varying Risk Premia in the Term Structure: the ARCH-M Model.” Econometrica, 55(2), 391-407.
Houston, J.F., and Stiroh, K.J. (2006) “Three decades of financial sector risk.” Staff report no. 248, Federal Reserve Bank of New York.
Jermann, U., and Quadrini, V. (2006) “Financial innovations and Macroeconomic Volatility.” Working Paper, Wharton School and University of Southern California.
Ozenbas, D., and San Vincente Portes, L. (2006) “On balance sheets, idiosyncratic risk and aggregate volatility: Is firm volatility good for the economy?.” Working Paper, Montclair State University.
Pellerin, N. (2008) “L'effet des activités hors-bilan sur la rentabilité et la volatilité des revenus des banques canadiennes.” mémoire, DESS finance, Université du Québec en Outaouais (UQO).
Quagliariello, M. (2006) “Macroeconomic uncertainty and banks' lending decisions: the case of Italy. ” Working Paper no. 2006/02, University of York.
Roldos, J. (2006) “Disintermediation and Monetary Transmission in Canada.” Working Paper, International Monetary Fund.
Rose, P.S. (1989) “Diversification of the Banking Firm.” The Financial Review, 24(2), 251-280.
Saunders, A., and Walter, I. (1994) Universal banking in the United-States: What could we gain? What could we lose?. Oxford University Press: New York.
Stiroh, K.J. (2004) “Diversification in banking: is noninterest income the answer?.” Journal of Money, Credit and Banking, 36(5), 853-882.
Stiroh, K.J. (2006) “A portfolio view of banking with interest and noninterest activities.” Journal of Money, Credit and Banking, 38(5), 1351-1361.
Stiroh, K.J. and Rumble, A. (2006) “The dark side of diversification: the case of US financial holding companies.” Journal of Banking & Finance, 30(8), 2131- 2161.
Théoret, R. (1991) “Un modèle économétrique des marges bénéficiaires des caisses populaires Desjardins du Québec et des banques à charte canadiennes.” L'Actualité économique, Revue d'analyse économique, 67(1), 58-79.
29
Figures
Figure 1 Direct to Indirect Finance, Canada, 1968-2002
Source: Calmès (2004); Calmès and Salazar (2006)
30
Figure 2 Shares of loans, bonds and stocks in Canadian corporate financing, 1970-2002
Source: Calmès (2004)
31
Figure 3 Canadian banks securitization, 1989-2002
Source: Calmès (2004)
32
Figure 4 Share of noninterest income for the eight domestic banks, 1988-2007.
0.250.300.350.400.450.500.550.600.65
88 90 92 94 96 98 00 02 04 06
33
Figure 5 Noninterest income per 100$ of assets for the eight Canadian domestic banks, 1988-2007.
1
1.21.4
1.6
1.82
2.2
2.42.6
2.8
88 I
89 I
90 I
91 I
92 I
93 I
94 I
95 I
96 I
97 I
98 I
99 I
00 I
01 II
02 III 03
I04
I05
I06
I07
I
34
Figure 6 Share of noninterest income in net operating revenue, three Canadian domestic banks, 1988 – 2007
0.20
0.30
0.40
0.50
0.60
0.70
0.80
88 90 92 94 96 98 00 02 04 06
RBC
TD
NBC
TOT
Note: RBC: Royal Bank of Canada; TD: Toronto Dominion Bank; NBC: National Bank of Canada; TOT: eight Canadian domestic banks.
35
Figure 7 Volatility of banks net operating revenue growth, 1984-2002
Source : Calmès (2004)
36
Tables
Table 1 Decomposition of the variance of net operating revenue growth, before provisions, Canadian banks, 1988-2007
1988-1992 1993-1997
Average share Variance Contribution to Average share Variance Contribution to
variance variance
Net operating revenue 14.2 9.4 Net interest income 0.70 16.9 8.4 0.64 9.8 4.0 Noninterest income 0.30 30.2 2.6 0.36 40.4 5.3 Covariance 7.5 3.1 -0.9 -0.4 Correlation 0.33 -0.04
1998-2002 2003-2007
Average share Variance Contribution to Average share Variance Contribution to
variance variance
Net operating revenue 57.4 22.3 Net interest income 0.49 9.7 2.3 0.45 13.6 2.8 Noninterest income 0.51 212.3 55.9 0.55 75.7 22.6 Covariance 6.1 3.0 -4.2 -2.1
Correlation 0.14 -0.13
37
Table 2 Profitability of the eight Canadian domestic banks vs noninterest income share, 1988Q1 – 2007Q4
Note: Explanatory variables: yt-1, lagged dependent variable; snonin, share of noninterest income in net operating revenue; LLP, ratio of loan loss provisions over total assets; DUMiQ, dummy variable taking the value of 1 for the ith quarter and 0 otherwise; σuc,t, unconditional volatility of the dependent variable computed using a rolling window of four quarters; σc,t, conditional volatility of the dependent variable using a GARCH(1,1) model. ROE(1) and ROA(1) are models without conditional volatility. ROE(2) and ROA(2) are ARCH-M models incorporating the conditional volatility of the dependent variable. Asterisks indicate the significance levels: * stands for 10%, ** stands for 5% and *** stands for 1%.
ROE(1) ROE(2) ROE/σuc,t ROE/σc,t ROA(1) ROA(2) ROA/σuc,t ROA/σc,t c 0.24*** 0.25*** 12.58** 2.94*** 1.02*** 0.21*** 23.71*** 5.16*** yt-1 0.15** -0.01 0.75*** 0.60*** 0.11* 0.01 -4.72** 0.11 snonin -0.11** -0.20*** -16.43** -1.72 -0.39** -0.72*** -22.32* -2.20** LLP -0.14*** -0.15*** -7.97*** -1.99*** 0.55*** -0.59*** -9.31** -2.49*** DUM2Q -0.02 -0.01 1.24 -0.60* -0.06 -0.03 2.37 -0.37 DUM3Q -0.02 -0.01 -0.51 -0.20 -0.05 -0.05 3.32 -0.28 DUM4Q -0.03** -0.02* 0.32 -0.65** -0.11** -0.09** 2.57 -0.55
σc,t - 1.85** - - - 9.78*** - -
Adjusted R2 0.72 0.80 0.67 0.68 0.72 0.83 0.15 0.70
38
Table 3 Profitability of three Canadian banks vs noninterest income share over subperiods 1988-1996 and 1997-2007
ROE1988-1996 ROE1997-2007 ROA1988-1996 ROA1997-2007 c 0.48*** 0.44*** 2.02*** 0.39*** y(t-1) 0.07 -0.25 0.07** -0.02 snonin -0.66*** 0.10 -2.61*** 0.12 LLP -0.16*** -0.07 -0.62*** -0.54* DUM2Q -0.01 0.01 -0.03 -0.03 DUM3Q -0.01 -0.01 -0.01 -0.05 DUM4Q -0.01 -0.01 -0.03 -0.11*
σt,c -3.45 1.04*** -4.15 5.49**
Adjusted R2 0.96 0.29 0.97 0.43
Note: Explanatory variables: yt-1, lagged dependent variable; snonin, share of noninterest income in net operating revenue; LLP, ratio of loan loss provisions over total assets; DUMiQ, dummy variable taking the value of 1 for the ith quarter and 0 otherwise; σc,t, conditional volatility of the dependent variable computed using an ARCH-M procedure (equation 2). Asterisks indicate the significance levels: * stands for 10%, ** stands for 5% and *** stands for 1%.