The Impact of Avatar Tracking Errors on User Experience in VR
11
The Impact of Avatar Tracking Errors on User Experience in VR Nicholas Toothman * Facebook Reality Labs University of California, Davis Michael Neff † Facebook Reality Labs University of California, Davis ABSTRACT There is evidence that adding motion-tracked avatars to virtual envi- ronments increases users’ sense of presence. High quality motion capture systems are cost sensitive for the average user and low cost resource-constrained systems introduce various forms of error to the tracking. Much research has looked at the impact of particular kinds of error, primarily latency, on factors such as body ownership, but it is still not known what level of tracking error is permissible in these systems to afford compelling social interaction. This paper presents a series of experiments employing a sizable subject pool (n=96) that study the impact of motion tracking errors on user experience for activities including social interaction and virtual object manipulation. Diverse forms of error that arise in tracking are examined, including latency, popping (jumps in position), stuttering (positions held in time) and constant noise. The focus is on error on a person’s own avatar, but some conditions also include error on an interlocutor, which appears underexplored. The picture that emerges is complex. Certain forms of error impact performance, a person’s sense of em- bodiment, enjoyment and perceived usability, while others do not. Notably, evidence was not found that tracking errors impact social presence, even when those errors are severe. 1 I NTRODUCTION There is evidence that including avatars that track people’s move- ment in virtual environments increases their sense of presence [23, 25], and of focus here, social presence [24]. However, the majority of potential VR users do not have access to the type of high end motion capture systems often used in lab experiments (e.g. [25]) and resource-constrained tracking solutions tend to introduce more errors. It is therefore important to understand what types of error may impact the user experience. This paper presents a series of four experiments, each looking at a different set of errors that may arise in tracking. Errors include both different forms of latency and different forms of noise, all applied on top of high-end motion capture tracking. Our focus is on error on one’s own avatar, although some conditions include error on the interlocutor. We are primarily interested in the tracking quality needed to support social interac- tion, so users were asked to engage in three tasks that feature the type of moderate movement common during such exchanges: social discussion, reaching for an object and placing an object. Results indicate that high levels of either rotational noise or la- tency impact both task performance and subjective measures of user experience, including enjoyment, usability and embodiment. More modest noise levels had neither objective nor subjective impacts. Interestingly, no evidence was found that tracking error impacts social presence, even when the error levels are extreme. 2 BACKGROUND Latency and Communication: The impact of latency has been widely studied for communication technology (e.g. [4, 20, 33]). A * e-mail: [email protected] † e-mail: [email protected] study of HP’s Halo telepresence system with delays of 0, 250ms and 2000ms above the system latency showed a decline of multi- ple factors (conversation flow, floor management) due to latency, but notably did not show the expected communication breakdown. There were no significant effects on conversational style, jokes or task strategy and people continued to tell jokes, a behavior that is considered to be time sensitive, even with 2000ms delays. The rec- ommended limit on Round Trip latency Time (RTT) ranges from 100 to 600ms [4]. Schoenberg [20] argues that even when people are not aware of the delay, they may end up receiving a different message due to the delay by attributing technical impairments to people’s dispositions. Context plays an important role in determining the impact of latency. It is postulated that latency may not have an impact if partic- ipants are under no pressure to finish the task quickly [20]. Looking at avatar tracking, Waltemate et al. [32] suggest that participants infer delay based on the motor error in the task, not the actual delay, and whether they notice delay may be task dependent. Latency and Manipulation Error Ellis et al. [3] studied the impact of latency on a fine manipulation task. They found that the more precise the task was, the greater the sensitivity to latency. Ragan et al. [18] replicated the original Ellis study, but tested both latency and jitter, showing that time to complete the task increased as latency increased, but interestingly, increasing jitter decreased the time to complete the task. Lee et al. [11] also replicated the Ellis study. Morice et al. [16] observe that performance of a virtual ball bouncing task begins to deteriorate beyond 110ms, but subjective experience does not diminish with increased latency. Waltemate et al. [32] find that higher latency impacts performance and decreases embodiment, although not to a point of total loss. Teather et al. [29] compare 2D mouse input with 3DOF tracking input to simulate a mouse and find that latency more strongly impacts performance for 2D pointing and 3D object movement tasks than low levels of spatial jitter, but that erratic jitter significantly disrupts performance as well. Noise: Aside from the work of Ragan et al. [18] on jitter (dis- cussed above), no studies examining the impact of spatial avatar noise on presence or related measures were found. Recent work has studied the effects of latency-based jitter on simulator sickness in VR [28]. They found that self-reported and physiological measures of cybersickness increase with their form of quasi-random jitter, which they establish in earlier work [27]. Implemented as a tempo- ral delay, this form of jitter is not necessarily caused by poor network performance for social VR experiences, which is one condition we hope to better understand with our experiments. Offset and Other Visual Errors: Groen and Werkhoven [6] examined the impact of errors in hand position on VR users. When hand position is visually manipulated by wearing a prism, subjects will adapt over time and there will be a compensatory error when the prism is removed, before the subject re-establishes the default mapping. Notably, studies have shown that this adaptation does not occur with latencies of 300ms and is heavily reduced when laten- cies exceed 60ms. Ellis et al. [2] found that increases in headset display latency and decreases in refresh rate, respectively, impacted task performance, while spatial distortions did not. In Groen and Werkhoven’s study, subjects were required to manipulate blocks while there was an offset error to the position of their hands, a lateral offset of 10cm. They found no difference in the positioning errors
Transcript of The Impact of Avatar Tracking Errors on User Experience in VR

The Impact of Avatar Tracking Errors on User Experience in VRNicholas Toothman*
Facebook Reality LabsUniversity of California, Davis
Michael Neff†Facebook Reality Labs
University of California, Davis
ABSTRACT
There is evidence that adding motion-tracked avatars to virtual envi-ronments increases users’ sense of presence. High quality motioncapture systems are cost sensitive for the average user and low costresource-constrained systems introduce various forms of error to thetracking. Much research has looked at the impact of particular kindsof error, primarily latency, on factors such as body ownership, but itis still not known what level of tracking error is permissible in thesesystems to afford compelling social interaction. This paper presentsa series of experiments employing a sizable subject pool (n=96) thatstudy the impact of motion tracking errors on user experience foractivities including social interaction and virtual object manipulation.Diverse forms of error that arise in tracking are examined, includinglatency, popping (jumps in position), stuttering (positions held intime) and constant noise. The focus is on error on a person’s ownavatar, but some conditions also include error on an interlocutor,which appears underexplored. The picture that emerges is complex.Certain forms of error impact performance, a person’s sense of em-bodiment, enjoyment and perceived usability, while others do not.Notably, evidence was not found that tracking errors impact socialpresence, even when those errors are severe.
1 INTRODUCTION
There is evidence that including avatars that track people’s move-ment in virtual environments increases their sense of presence [23,25], and of focus here, social presence [24]. However, the majorityof potential VR users do not have access to the type of high endmotion capture systems often used in lab experiments (e.g. [25])and resource-constrained tracking solutions tend to introduce moreerrors. It is therefore important to understand what types of errormay impact the user experience. This paper presents a series offour experiments, each looking at a different set of errors that mayarise in tracking. Errors include both different forms of latencyand different forms of noise, all applied on top of high-end motioncapture tracking. Our focus is on error on one’s own avatar, althoughsome conditions include error on the interlocutor. We are primarilyinterested in the tracking quality needed to support social interac-tion, so users were asked to engage in three tasks that feature thetype of moderate movement common during such exchanges: socialdiscussion, reaching for an object and placing an object.
Results indicate that high levels of either rotational noise or la-tency impact both task performance and subjective measures of userexperience, including enjoyment, usability and embodiment. Moremodest noise levels had neither objective nor subjective impacts.Interestingly, no evidence was found that tracking error impactssocial presence, even when the error levels are extreme.
2 BACKGROUND
Latency and Communication: The impact of latency has beenwidely studied for communication technology (e.g. [4, 20, 33]). A
*e-mail: [email protected]†e-mail: [email protected]
study of HP’s Halo telepresence system with delays of 0, 250msand 2000ms above the system latency showed a decline of multi-ple factors (conversation flow, floor management) due to latency,but notably did not show the expected communication breakdown.There were no significant effects on conversational style, jokes ortask strategy and people continued to tell jokes, a behavior that isconsidered to be time sensitive, even with 2000ms delays. The rec-ommended limit on Round Trip latency Time (RTT) ranges from100 to 600ms [4].
Schoenberg [20] argues that even when people are not aware ofthe delay, they may end up receiving a different message due to thedelay by attributing technical impairments to people’s dispositions.
Context plays an important role in determining the impact oflatency. It is postulated that latency may not have an impact if partic-ipants are under no pressure to finish the task quickly [20]. Lookingat avatar tracking, Waltemate et al. [32] suggest that participantsinfer delay based on the motor error in the task, not the actual delay,and whether they notice delay may be task dependent.
Latency and Manipulation Error Ellis et al. [3] studied theimpact of latency on a fine manipulation task. They found thatthe more precise the task was, the greater the sensitivity to latency.Ragan et al. [18] replicated the original Ellis study, but tested bothlatency and jitter, showing that time to complete the task increasedas latency increased, but interestingly, increasing jitter decreased thetime to complete the task. Lee et al. [11] also replicated the Ellisstudy. Morice et al. [16] observe that performance of a virtual ballbouncing task begins to deteriorate beyond 110ms, but subjectiveexperience does not diminish with increased latency. Waltemate etal. [32] find that higher latency impacts performance and decreasesembodiment, although not to a point of total loss. Teather et al. [29]compare 2D mouse input with 3DOF tracking input to simulate amouse and find that latency more strongly impacts performance for2D pointing and 3D object movement tasks than low levels of spatialjitter, but that erratic jitter significantly disrupts performance as well.
Noise: Aside from the work of Ragan et al. [18] on jitter (dis-cussed above), no studies examining the impact of spatial avatarnoise on presence or related measures were found. Recent work hasstudied the effects of latency-based jitter on simulator sickness inVR [28]. They found that self-reported and physiological measuresof cybersickness increase with their form of quasi-random jitter,which they establish in earlier work [27]. Implemented as a tempo-ral delay, this form of jitter is not necessarily caused by poor networkperformance for social VR experiences, which is one condition wehope to better understand with our experiments.
Offset and Other Visual Errors: Groen and Werkhoven [6]examined the impact of errors in hand position on VR users. Whenhand position is visually manipulated by wearing a prism, subjectswill adapt over time and there will be a compensatory error whenthe prism is removed, before the subject re-establishes the defaultmapping. Notably, studies have shown that this adaptation does notoccur with latencies of 300ms and is heavily reduced when laten-cies exceed 60ms. Ellis et al. [2] found that increases in headsetdisplay latency and decreases in refresh rate, respectively, impactedtask performance, while spatial distortions did not. In Groen andWerkhoven’s study, subjects were required to manipulate blockswhile there was an offset error to the position of their hands, a lateraloffset of 10cm. They found no difference in the positioning errors

of the block or the time to complete the task when compared to asetup that had no error. Lateiner and Sainburg [10] examined howproprioception and visual feedback on the initial position of the handimpacted hand movement, showing that the visual information dom-inated when there were discordant signals. Sprague et al. conducteda similar experiment looking at errors in head registration (HR) [26].
The above studies offer evidence that offset errors may not impedeperformance, but they did not examine whether these errors impactedengagement. Recent work has looked at physical errors in AR -virtual humans walking through objects or not being appropriatelyoccluded by objects - and concluded that these physical errors lowersocial presence [7].
A number of studies have looked at the virtual hand illusion,where the subjects real hand is replaced by a VR impostor. Schwindet al. [21] and Lin and Joerg [12] both examined the impact ofchanging the hand’s appearance. Kokkinara and Slater [8] found thatvisuomotor sychronous stimulation contributes the greatest to theattainment of the body ownership illusion, compared to synchronousvisuotactile stimulation, but a disruption in either mode contributesequally to the probability of breaking the illusion.
Both Mohler et al. [15] and Ries et al. [19] find that the use of amotion-tracked, accurately-scaled avatar in VR aids in egocentricdistance judgments. Other work has examined the role of avatar sizeand varied spatiotemporal mappings [9, 14]
3 METHOD
Our primary interest is on the impact of tracking error on socialinteraction. To explore this, we developed three tasks: a social in-teraction task, a target touching task, and an object placement task.The latter two physical manipulation tasks are moderate speed, mod-erate difficulty tasks, comparable to the type of daily life activitiessomeone might undertake during a social interaction. These taskswere repeated across four experiments that each explored differenttypes of error that may occur during tracking (Sec. 3.3). To helpwith pacing and minimize fatigue, a maximum task duration of 10minutes was enforced for each task, although the majority of trialswere completed well before the time limit.
3.1 Experimental Setup and ApparatusEach participant partook in a single experiment, during a singlesession that lasted between 90 and 120 minutes. The study was IRBapproved, and before the session, participants read and signed aninformed consent form. Twenty four participants partook in eachexperiment, with demographic data summarized in Table 1.
The apparatus followed standard practices for embodied virtualreality experiments (e.g. [25]). A Vicon Vantage 16 marker-basedoptical motion capture system with 24 cameras in a 6m by 7.5mtracking area was used to track participants, who wore lycra motioncapture suits with a standard 53 marker layout, following specifica-tions for Vicon’s Shogun Live software [30]. Motion capture latencyis 8.3ms [31]. With local system clock synchronization [5] andframe timestamping, end-to-end latency (motion capture, motionsolve, network transfer, and application to avatar) was measuredto be under 50ms for two full-body tracked subjects with headsets.Participants experienced the scene in first person, wearing an Ocu-lus Rift HMD with 90 Hz refresh rate, 110° viewing angles and2160x1200 resolution. Head tracking was enabled for the motiontracking space by affixing unique marker trees to the headsets andtracking them as rigid bodies; without the need to solve full-bodymotion, headset transform latency is approximately on par with re-tail performance. The virtual environment was developed in Unity3D and sized to match the tracking area. Three separate computerswith identical hardware (i7-6700k CPU, Geforce GTX 1080, 1 TBSSD) on a closed gigabit LAN were used: one to run the motioncapture software, one to perform the motion solve and fitting for theavatars, and one to run the Unity scene in VR and record experiment
Figure 1: The female (left) and male avatars used in the study.
Experi-ment
# Partic-ipants
#Female
Age Avg. VR Ex-perience
1. 24 12 41.5 (12.6) 1.5 (0.7)2. 24 9 39.9 (12.8) 1.6 (0.7)3. 24 11 43.2 (13.3) 1.9 (0.8)4. 24 16 38.5 (12.8) 1.5 (0.8)
Table 1: Demographic data for each experiment. Parentheses indicatestandard deviation. VR experience was rated on a 5-point scale, from“I have never tried it before. (1)” to “I use it frequently. (5)”. The meanscores all lie between no experience and having tried VR once (2).
data and screen capture using OBS (Open Broadcaster Software).Participants were represented in the environment as gender matched,neutral avatars (Figure 1) that were automatically scaled to theirproportions based on a range of motion performed at the beginningof the trial. The avatars would actively mirror their movement andthe artificial error used in the experiments was added on top of thebaseline motion capture. In addition, the artificial errors only affectthe avatar body; they do not modify the headset’s transform.
3.2 Experimental Task and Procedure
All experiments included the social interaction and target touchingtask. Experiment 4 added a precision placement task to comparepositioning to touch.
Task 1. Guided Social Interaction: The first task provided adyadic social exchange. A member of the research team appearedin VR with the participant and lead this guided social interaction.When the participant appeared in the virtual environment, he/shewas instructed to walk along an illuminated path on the floor to reacha 3x4 grid of floating placards, each measuring 34cm by 25cm. Thispart of the task cued the participant to notice his/her lower body,and any error in its movement. Each placard displayed a differentfood item. The participant was instructed to select and grab threeplacards, one at a time, that display food items they would enjoyand show the placard to the experimenter, explaining what they likeabout the food item (Figure 2). They were encouraged to gesture atthe placards, which ensured that the avatar limbs were brought intotheir visual field. After completing an explanation, they replacedthe placard in its original location and repeated the task twice more.During this scenario, the participating researcher provided friendlybackchannel behavior and responded to participant questions, butdid not engage in extended discussions. This was done to makeinteraction as consistent as possible across sessions.
Task 2. Target Touching: Participants completed a target touch-ing task. Twenty five bubbles would appear in front of them, oneat a time, and they had to pop them by touching them with theirdominant hand (Fig. 3). They were instructed to return their handto their side after each pop. Only the avatar’s fingertips contained

Figure 2: Task 1: The participant (right) discusses a selected placard.
Figure 3: Task 2 (left): The participant had to pop bubbles that ap-peared in front of her/him. Task 3 (right): Participants had to preciselyplace boxes back into their outline frame.
colliders that could pop the bubbles, so they were instructed to beprecise with their movements. All bubbles had a diameter of 4cmand appeared at predetermined random locations in a 10cm wide by50cm tall area in front of them, so no locomotion was required forthis task. This could be viewed as a more controlled version of thereach for the placard in Task 1.
Task 3. Positioning Accuracy: In this task, participants wereasked to place a series of 6 12.5cm cubes in equally-sized outlinedframes (Fig. 3). They were permitted to grab and release the cube asmany times as they liked until satisfied with the fit. Again, this iscomparable to the placard return action done in Task 1.
Participants repeated one task with all error levels before movingon to the next. The order of error conditions for each task wasrandomized using a Williams design Latin square for carryoverbalance.
Performance Measures: Performance was evaluated with acombination of subjective and task execution measures. For Task 1,participants completed surveys at the end of each error condition,described below. For Task 2, the time to complete each pop dividedby its difficulty provided an objective measure of performance (Sec-tion 6). Participants were also asked how difficult they found thetask with the prompt: “It was easy to play the game using my virtualavatar.” In Experiment 4, participants were asked to respond to threeprompts: “It was easy to use the interface for this task”, “I enjoyedinteracting with this interface”, “I felt as if the virtual body was mybody”.
For Task 3, the positional and rotational error of the placementswas calculated. Participants responded to the same three prompts asused in the latter version of Task 2.
After each iteration of Task 1, participants completed the Seman-tic Difference measure of social presence [17, 22], in which theyrated the experience on 7-point scales with the following end labels:(Impersonal–Personal), (Cold–Warm), (Beautiful–Ugly), (Small–Large), (Sensitive–Insensitive), (Colorless–Colorful), (Sociable–
1. I perceive that I am in the presence of another person in theroom with me.
2. I feel that the person is watching me and is aware of my pres-ence.
3. The thought that the person is not a real person crosses mymind often.
4. The person appears to be sentient (conscious and alive) to me.5. I perceive the person as being only a computerized image, not
as a real person.Table 2: Questions for the Social Presence survey from [1].
1. I felt that if I moved my (real) body, the avatar body wouldmove.
2. I felt that my body was in the location of the virtual body.3. I felt as if the virtual body was my body.
Table 3: Questions for the Embodiment survey.
Unsociable), (Active–Passive). They then completed four additionalsurveys. The first provided an alternate measure of social presence(Table 2). The second measured how much they felt the avatar rep-resented their own body (Table 3). The third rated performanceof the avatar as an interface (Table 4) and the fourth rated spa-tial presence (Table 5). Each consisted of prompts rated on sevenpoint Likert scales with ratings from: “Disagree strongly” to “Agreestrongly”. After the experiment, participants completed a writtenPost-experiment Survey, (Sec. 8) and the experiment concludedwith a debriefing interview.
3.3 Error Levels
The experiments used synthetic errors designed to simulate the typesof errors that may arise from imperfect motion tracking or networkconditions. Latency corresponds to delay in motion solving, skeletonfiltering, or network transmission. If the solver has poor temporalcoherence, there can be noise in the output (vibration). If there areproblems with local minima, the solution may jump between twodifferent solutions, creating popping. Connectivity issues can leadto stuttering. These errors are implemented at the application level.Solved motion capture data frames are timestamped and added toa queue. For constant latency, the software checks the differencebetween the current time and the queue’s front and dequeues framesuntil the difference is less than the specified latency value. Thelast frame to be dequeued, if any, is then applied to the avatar. Togenerate stuttering errors, the software alternates between applyingno error and constant latency to the avatar by generating latencyspikes of uniform random duration between minimum and maximumlength presets for the error level.
Along with the minimum and maximum spike duration, schedul-ing this behavior requires specifying a ratio R of total spike time Sto total session time T,R = S
T . Then by considering spike lengthas a continuous random variable L∼ uniform (min,max), E(L) =min+max
2 , we can deduce the rest of the scheduling behavior. Forexample, with T = 10 minutes, R = 30%, and range(L) = (2,8)seconds: S = 3 minutes, E(L) = 5 seconds, and the error level gen-erates 36 spikes ( S
E(L) ), leaving T −S = 7 minutes total of no-error
intervals, each of duration N =E(L)(T−S)
S = 11.67 seconds. To re-duce participants’ accustomization of N over the session length, we
1. I enjoyed interacting with this interface.2. It felt natural to interact through the system.3. It was frustrating to interact through this interface.4. It was easy to use the interface for this task.5. I’d be interested in using this system regularly.
Table 4: Questions on frustration or enjoyment of using the interface.

1. The displayed environment seemed natural.2. I felt I was visiting the places in the displayed environment3. I felt surrounded by the displayed environment.4. It felt realistic to move things in the displayed environment.
Table 5: Questions on spatial presence based on the ITC Sense ofPresence Inventory.
LS75 75 ms delay experienced during “spikes” lasting 2-8 sec-onds. These spikes are distributed to occur for a total ofR = 15% of the experiment run time.
LS150* 150 ms delay experienced during “spikes” lasting 2-8seconds. Spikes are distributed to occur for a total ofR = 30% of the experiment run time.
LS300 300 ms delay experienced during ”spikes” lasting 2-8seconds. Spikes are distributed to occur for a total ofR = 45% of the experiment run time.
L75 75 ms constant delay.L150* 150 ms constant delay.L300* 300 ms constant delay.
Table 6: Latency error levels used in Experiment 1. * indicates condi-tions used in Task 1 (Guided Social Interaction).
compute each no-error interval as N× (X ∼ uniform (0.75,1.25)),ensuring that E(N) does not change and the ratio R is maintained.The result is a periodic random spiking behavior that is easy toconfigure and apply for both latency and noise error.
The noise error is generated as a random rotation offset appliedto each joint’s local transform. For vibration noise, the offsets arerecomputed every frame, and for popping noise, the offsets arerecomputed at the beginning of each spike. A very small amountof jitter (0.03 * the random range for the error level) is applied ontop of the popping offsets on each frame to make the error appearless artificial. Each joint’s noise error is weighted by its hierarchicaldistance from the pelvis root joint. This can be defined recursively,for all joints j with parent p D( j) = || j− p||+D(p), and DMAX =max({D( j) : j ∈M}). Then the noise error weight for j is W ( j) =D( j)DMAX
∈ [0,1]. Thus the hips receive relatively little noise, whilethe hands and feet are more strongly weighted, corresponding torealistic tracking scenarios where the limbs are lost more frequentlythan the torso.
Experiment 1 focused on latency and Experiment 2 on noise. Ex-periment 3 examined more extreme forms of noise and the differencebetween errors in self tracking and errors in tracking of the inter-locutor. Experiment 4 combined these issues, examining latency,self-noise and other-noise.
The following nomenclature denotes the various types of noise.NE stands for No Error and was a condition in all experiments.L indicates constant Latency. LS indicates Sporadic Latency, orintermittent lag. V indicates Vibration, or constant noise whichmakes the character appear to vibrate. P indicates Popping, or jumpsin the position of the character that last for a short duration. Sindicates Stuttering, where the character’s position freezes brieflyand then continues moving. Popping is a spatial error and stutteringa freezing in time. C is a composite of noise modes, described below.Examples of all noise conditions are shown in the accompanyingvideo. These are live recorded from the application used in theexperiment, faithfully representing what was seen.
The error levels are summarized in Tables 6, 7, 8 and 9, with theerror levels used in Task 1 (social interaction) marked with an *.The error levels for Experiments 1 and 2 were determined by testingranges of initial values with 2 experts with VR and motion captureexperience, and adjusting them until they were found to reasonablyrepresent a span of conditions for the error types. The results ofthese experiments were then analyzed and used to develop the errorlevels for Experiments 3 and 4, again evaluated by experts.
V.5* Vibration with error ranging between 0 and 0.5 degrees.V1* Vibration with error ranging between 0 and 1 degree.P4R30* Popping with error ranging between 0 and 4 degrees. Error
occurs for R = 30% of the task duration.P4R80* Popping with error ranging between 0 and 4 degrees. Error
occurs for R = 80% of the task duration.P6R30 Popping with error ranging between 0 and 6 degrees. Error
occurs for R = 30% of the task duration.P6R80 Popping with error ranging between 0 and 6 degrees. Error
occurs for R = 80% of the task duration.Table 7: Noise error conditions used in Experiment 2. All poppingerrors lasted 0.5 to 1.5 seconds.
S Stutter only.SV6* Stutter and vibration ranging between 0 and 6 degrees.SP10* Stutter and popping ranging between 2 and 10 degrees.V6 Vibration noise only.P Popping noise only.SV6B* SV6 applied to both (B) participant and interviewer.SP10B* SP10 applied to both (B) participant and interviewer.
Table 8: Noise and disruption error conditions used in Experiment 3.
Experiment 3 applies Stuttering to freeze the body for a period oftime, ranging from 100 ms to 350 ms. These stutters were generatedto occur during R = 67% of the task duration. When there is nostutter, either Vibration or Popping were triggered (see Table 8). Forpopping, spikes lasted between 0.25 s and 1 s and were distributed tocover R = 80% of the task duration. There was no synchronizationof error between the participant and the interviewer.
Experiment 4 used a composite noise that switched between Vi-bration and Popping. Spike lengths lasted between 0.5s and 2s,distributed to occur for a total of R = 50% of the experiment du-ration. When a spike is active, vibration noise is applied. Whenno spike is active, popping noise is applied. As can be seen in theaccompanying video, these are quite extreme levels of error. Errorwas not synchronized between the participant and interviewer.
4 RESULTS OVERVIEW
In the sections below, the results are grouped by task in order toreveal patterns across all experiments. A similar statistical approachwas used throughout the analysis. For all multi-question surveys,Chronbach’s alpha was calculated as a measure of internal consis-tency. This was generally between .7 and .9, but fell between .6and .7 in three cases, as listed in the supplemental material (Ta-ble 12). Repeated measures ANOVAs were run to determine ifeach dependent value varied significantly across the experiencederror conditions. Mauchly’s test for sphericity was run on all dataand correction by Greenhouse-Geiser or Huynh-Feldt were appliedas needed. Type II error was corrected for using False DiscoveryRate correction. Bonferroni-corrected pairwise t-tests were run forpost-hoc analysis. Significance was evaluated at the p < 0.05 level.
5 TASK 1: SOCIAL INTERACTION
Task 1 focused on how tracking error impacted participants’ expe-riences of embodied VR while engaged in a social conversation.
L250* 250 ms constant delay.L300 300 ms constant delay.L350* 350 ms constant delay.C3 Composite noise. Popping ranged between 0 and 3 de-
grees; vibration between 0 and 0.09 deg.C6* Composite noise. Popping ranged between 0 and 6 de-
grees; vibration between 0 and 0.18 degrees.C6I* C6 applied to interviewer only.Table 9: Noise and time error conditions used in Experiment 4.

Figure 4: Subjective ratings on two social presence scales. Columns correspond to the different experiments and rows to rating categories. Thegrey bars correspond to the “no added error” baseline, green bars show error added only to the self-avatar, blue bars show error added to bothavatars and red bars show error added to the other avatar only. Significance at the 0.05 level after Bonferroni correction is indicated with *, at 0.01with ** and at 0.001 with ***.
Results are shown in Figures 4 and 5. Full numeric results are in-cluded in the supplemental material. In the following subsections,we will summarize results followed immediately by discussion.Social Presence: Both measures of Social Presence, SemanticDifferences and Bailenson et al.’s survey [1], showed very littleevidence that tracking error impacts users subjective experienceof social presence, even for severe error. The ANOVA was neversignificant for Semantic Difference nor Social Presence, and scoreswere very consistent across conditions.
It was surprising that tracking error did not impact social pres-ence as it was expected that the resultant visual disruption in theavatar would impact the believability of the interaction and lowerthe sense of presence. However, no evidence was found for thiswith a sample size of 24 participants per experiment, which a poweranalysis indicates is sufficient to at least detect large effects. Thisresult comes despite a very high level of error applied to the avatars,especially in Exp. 4, creating clear and marked visual disruption (cf.video). Some test conditions also included error on the interlocutor.Previous research found that motion tracked avatars led to signifi-cantly higher social presence than when they were not present [24].Combining these results suggests that tracked avatars are importantfor increasing social presence in VR interactions, but this effect maynot be diminished if the tracking is glitchy. Investigating this fur-ther with very experienced users or higher stakes social interactionsseems worthwhile.Sense of Embodiment: For Experiment 1, all conditions averagebetween 5.69 and 5.86 on embodiment, except L300, which fallsoff to 4.88. L150 is the only condition significantly better thanL300. For Exp. 2 (Noise), the vibration errors produced slightlylower embodiment than NE and popping, but no differences weresignificant. For Exp 3, NE is rated highest, the two errors appliedjust to the self avatar are next highest and the two errors applied tothe self and other are the lowest. The only significant differenceis between NE and SV6B, the most extreme cases. The extremeerror in Experiment 4 had a marked impact on embodiment, withNE being rated highest, then C6I (noise only on the interviewer),followed by L250, L350 and C6. Significant differences are markedin Fig. 5.
While tracking error had minimal impact on social presence, itdoes appear to impact a sense of embodiment, especially when the
error is large. Latency appears to have an impact when it is long(300 msec in Exp 1 and 350 msec in Exp. 4, which was significantlyworse than 250 ms and NE). Small amounts of noise did not have asignificant impact (Exp 2), but larger amounts of noise did (esp. Exp4 and to a degree in Exp. 3). It is interesting to note that showingtracking error on the other avatar in Exp 3, as well as the self, appearsto lower the perception of embodiment compared to just self error,although this difference was not significant with our sample size. InExp. 4, noise only on the other avatar did not lead to a significantdecline from NE. A possible explanation is that if there is error onone’s own avatar, seeing error on others increases the general senseof a lack of connection, but if the self-avatar is well tracked, externalerror is not connected to the sense of self.Interface: For the interface usability questions, the adjusted p val-ues are significant for the ANOVAs in every experiment. For latencyin Exp. 1, there is the same general trend of all ratings appearingsimilar until a marked decline for L300. There is a tendency forL150 to be rated higher than L300 (pad j = 0.051). For Exp. 2, noise,NE and the popping conditions are similar, with a drop for vibration,but none of these differences were significant on post-hoc analysis.For Exp. 3, NE was rated highest (5.48), SV6, SP10, SP10B rangefrom 5.01 to 4.82 and SV6B is lowest at 4.39. SV6B is significantlyworse than NE and SV6. For Exp 4, C6 was rated significantly worsethan NE, L250 and C6I.
Certain levels of tracking error do appear to impact users senseof interface usability. L300 appears to be over a threshold wherethe latency negatively impacts the experience. People appear tohave a lower preference for vibration noise than popping, but thedifference was not significant here. It is interesting in Exp. 3 thatthe differences only reached significant levels when stutter vibrationwas shown on both the self and other avatar, again indicating apossible additive effect when viewing error on other avatars. Themore extreme noise in Exp. 4 lead to a significant degradation. L350dropped to a point that it was not significantly better than the noisecondition, whereas L250 was. Interestingly, the noise only on theother person produced similar ratings to NE, so it appears noise onboth decreases the interface usability (Exp. 3), but noise only on theinterlocutor does not (Exp. 4).Spatial Presence: Calculating the alpha for the spatial presencequestions indicated that the internal consistency of the survey could
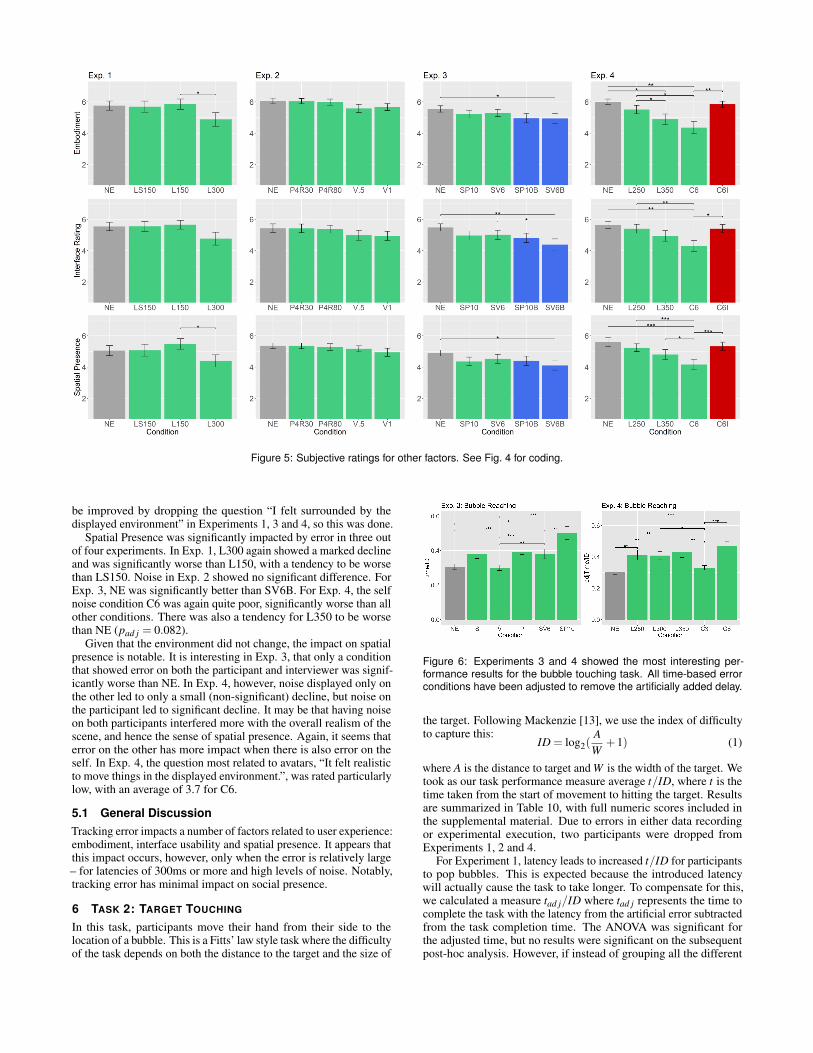
Figure 5: Subjective ratings for other factors. See Fig. 4 for coding.
be improved by dropping the question “I felt surrounded by thedisplayed environment” in Experiments 1, 3 and 4, so this was done.
Spatial Presence was significantly impacted by error in three outof four experiments. In Exp. 1, L300 again showed a marked declineand was significantly worse than L150, with a tendency to be worsethan LS150. Noise in Exp. 2 showed no significant difference. ForExp. 3, NE was significantly better than SV6B. For Exp. 4, the selfnoise condition C6 was again quite poor, significantly worse than allother conditions. There was also a tendency for L350 to be worsethan NE (pad j = 0.082).
Given that the environment did not change, the impact on spatialpresence is notable. It is interesting in Exp. 3, that only a conditionthat showed error on both the participant and interviewer was signif-icantly worse than NE. In Exp. 4, however, noise displayed only onthe other led to only a small (non-significant) decline, but noise onthe participant led to significant decline. It may be that having noiseon both participants interfered more with the overall realism of thescene, and hence the sense of spatial presence. Again, it seems thaterror on the other has more impact when there is also error on theself. In Exp. 4, the question most related to avatars, “It felt realisticto move things in the displayed environment.”, was rated particularlylow, with an average of 3.7 for C6.
5.1 General DiscussionTracking error impacts a number of factors related to user experience:embodiment, interface usability and spatial presence. It appears thatthis impact occurs, however, only when the error is relatively large– for latencies of 300ms or more and high levels of noise. Notably,tracking error has minimal impact on social presence.
6 TASK 2: TARGET TOUCHING
In this task, participants move their hand from their side to thelocation of a bubble. This is a Fitts’ law style task where the difficultyof the task depends on both the distance to the target and the size of
Figure 6: Experiments 3 and 4 showed the most interesting per-formance results for the bubble touching task. All time-based errorconditions have been adjusted to remove the artificially added delay.
the target. Following Mackenzie [13], we use the index of difficultyto capture this:
ID = log2(AW
+1) (1)
where A is the distance to target and W is the width of the target. Wetook as our task performance measure average t/ID, where t is thetime taken from the start of movement to hitting the target. Resultsare summarized in Table 10, with full numeric scores included inthe supplemental material. Due to errors in either data recordingor experimental execution, two participants were dropped fromExperiments 1, 2 and 4.
For Experiment 1, latency leads to increased t/ID for participantsto pop bubbles. This is expected because the introduced latencywill actually cause the task to take longer. To compensate for this,we calculated a measure tad j/ID where tad j represents the time tocomplete the task with the latency from the artificial error subtractedfrom the task completion time. The ANOVA was significant forthe adjusted time, but no results were significant on the subsequentpost-hoc analysis. However, if instead of grouping all the different

Figure 7: Ease of Use ratings for the bubble popping task across all experiments and all conditions.
Figure 8: For Exp. 4, participants also rated the their enjoyment andfeeling of embodiment during the bubble pop task.
forms of lag into a single ANOVA, we group only the constanterror conditions (0, 75, 150, 300 ms), the ANOVA is significantand pairwise t-tests with Bonferroni correction show a tendencyfor NE < L300,(pad j = 0.062). This provides evidence that at 300msec, lag adds a disruption to the task that goes beyond simply theadded delay. (It is worth noting that Bonferroni is a conservativecorrection method.) The base and adjusted time results for theconstant lag cases are shown in Figure 9. Notice that performancedegrades as error increases even after adjusting the performancetime to account for the direct impact of the latency.
Ratings of task ease declined steadily with increasing lag, withmore extreme lag differences generally leading to significant differ-ences in ratings (Figure 7). The decline appears proportional to thetotal amount of delay received, as ease of use decayed more quicklywith constant latency than with sporadic latency. This is somewhatsurprising as we anticipated the inconsistency of sporadic latencymight be distracting and cause a greater impact on performance.
For Exp. 2, the noise conditions did not produce any significantdifferences in performance for reaching, nor were there significantdifferences in terms of task ease ratings. An explanation of this isthat the vibration error actually does not make the task any moredifficult as the rapidly vibrating hand essentially acts as a largerobject to hit the target with. Popping error may have been similar.
For Exp. 3, performance on the reaching task seems to reveal athree level structure (Fig. 6). NE and V had similar performance,again suggesting that vibratory error does not impact performanceon a touching task. S, P and SV6 also had similar performance,although only two members of this group were significantly worsethan the top group: SV6 was worse than V, and P was worse thanNE. This suggests that the presense of either popping or stutteringlowers performance. SP10 performs significantly worse than allother conditions, suggesting the combination of stutter and poppingmakes touch tasks particularly difficult. In terms of ease of useratings (Fig. 7), NE was perceived as easier to use than any othercondition, even though V had even less actual performance error.SP10 was viewed as the most difficult, and was in practice. S wasviewed as easier than SV6, although performance was comparable.
For Exp. 4, it is again most instructive to look at the adjusted timeresults (Fig. 6). Performance on NE was significantly better than allconditions except C3. C3 was significantly better than L300, L350and C6. This suggests that all the large latency conditions degradedperformance beyond the error that the latency itself added. Therewas no significant difference between the latency levels. Large noiseerror degraded performance, but small error did not. For ease of use,NE was rated highest, then the latency conditions grouped, with nosignificant differences between them, then came C3 and finally C6(Fig. 7). C6 was significantly worse than all conditions but C3. C3was significantly worse than NE and L300, with a tendency to beworse than L250. NE is also tendentially better than L250 and L300.It is interesting that C3 was viewed quite difficult to use, despite itsperformance actually being quite good. For enjoyment, there arethree loose groupings, NE, latency and error (Fig. 8). C6 was sig-nificantly worse than all conditions except C3. C3 was significantlyworse than NE and L300. In terms of believing the avatar was theirown body, the NE condition significantly outperformed all errorconditions. The noise conditions were rated lower than latency, butthis was not significant. It is interesting that the noise is consistentlyviewed more negatively than latency, even though the mild noise(C3) often performs better. This may reflect the relatively jarringnature of this condition, compared to the smooth latency conditions.
7 TASK 3: PRECISION PLACEMENT
In Exp. 4, we added a placard placement task. The results of theANOVAs are summarized in Table 11, with full numeric data in thesupplemental doc. In terms of position error, NE performed best,followed by the latency conditions, then C3 and finally C6, with thedifferences between each of the four groups being significant. Theresults for orientation error were similar, except there was no longera significant difference between NE and the latency conditions (NEremained numerically lower). Ratings for ease of use, enjoyment andwhether the avatar represented their own body were consistent, withC3 and C6 always being significantly worse than all other conditions.There was always some decline for the latency conditions fromNE, particularly for Body Rating, but these differences were notsignificant. These are summarized in Figure 9.
Overall, noise was much more problematic for participants onthe precision task. It lead to worse performance and also lowersubjective ratings. Latency can be compensated for by slowingdown, and we saw longer return times compared to the NE condition,so this may be the strategy that participants employed. There is nosimple strategy to compensate for the noise conditions, given theirhigh degree of randomness.
8 POST-EXPERIMENT SURVEYS
In order to gain some insight into whether participants were con-sciously aware of the tracking error, they were asked in an exitsurvey to describe any differences they noticed across the trials.They were also given a chance to provide any additional comments.To analyze the data, two separate coders decided if each participant

Category Exp. ANOVA Result Post-hoc
time/ID 1 F6,126 = 16.70, pad j < 0.0001NE < {L75,L150,LS300}< L300; {LS75,LS150}< L300; LS75 < L150;(Tend. L150 < L300, pad j = 0.095)
2 F6,126 = 2.12, pad j = 0.054 No Signficance3 F5,115 = 13.97, pad j < 0.0001 {NE,S,V,P,SV 6}< SP10; NE < P; V < SV 64 F5,105 = 22.73, p < 0.0001 {NE,C3}< {L250,L300,L350,C6}
adjTime/ID 1 F6,126 =, pad j = 0.013 No significannt post-hoc results (see discussion)4 F5,105 = 10.66, p < 0.0001 NE < L250;{NE,C3}< {L300,L350,C6}Table 10: Results from ANOVAs and significant post-hoc t-tests for the bubble popping experiments.
Figure 9: Participant ratings of ease, enjoyment and level of embodi-ment they experienced during precision placement, Task 3. Bottomright shows the impact of latency for raw time and adjusted time inTask2
Category ANOVA Result Post-hoc
Position Er-ror
F5,115 = 43.0, p < 0.0001 NE < L250,L300,L350 <C3 <C6
OrientationError
F5,115 = 41.64, p < 0.0001 NE,L250,L300,L350 <C3 <C6
Table 11: Results from ANOVAs and significant post-hoc t-tests forExperiment 4 precision task.
understood the error and if they expressed anything negative thatmight be related to the error. Participant comments were rated “2” ifthey correctly identified the type of error, “1” if they identified therewas error in the tracking, but not the specific type and “0” for nodemonstrated awareness. Coders considered any comment negativeif it suggested tracking error led to a less optimal, or negative, userexperience. The coders discussed all cases in which their scoresdiffered and reached consensus.
In all experiments, a plurality of comments were rated as ’2’, andin all cases but Exp. 2, this was a clear majority, ranging from 63%to 88%. For Exp. 2, 42% of participants were rated as ’2’, 25% wererated as ’1’ and 33% were rated ’0’. Overall, this indicates a highawareness of the experimental manipulation, i.e. people noticed thetracking error, although this was slightly lower for Exp. 2, whereone third expressed no awareness.
The number of participants whose comments indicated that track-ing error had a negative impact on their experience range from 21%for Exp. 2 to 67% for Exp. 4. The rates were highest for the con-ditions that included latency (42% for Exp. 1 and 67% for Exp 4),although Exp. 4 also had very high levels of noise. The noise onlyconditions were lower (21% Exp. 2 and 33% Exp. 3). This may indi-cate that they were less conscious of the noise interfering with theiractivities or found it less distracting. Some of the comments rated as
negative were relatively minor, such as “Other times it lagged andI found that slightly annoying.” (Exp. 4), while others were moresevere, such as “When everything was correct it was quite good, butthe intended errors ruined the experience”(Exp. 4).
Some comments indicated that the error may have impacted somepeople’s sense of connection with the avatar. One participant inExp. 1 wrote “Sometimes, ’being’ the avatar felt more realsitic(aka harmonious/one body), and sometimes it felt like I was merelycontrolling the actions of the avatar,” and another said “The slowerresponses made me feel disconnected and frustrated with inaccuratemovements.” In Exp. 2, one participant commented “Some trialswere far smoother than others. A few felt amazingly smooth andmade me feel interactive.” A participant in Exp. 3 wrote “Theshaking detracts from feeling like it is your body.”
9 DISCUSSION AND CONCLUSION
As the exit interview indicates, the majority of the participants wereaware of the error and many indicated it negatively impacted theirexperience in some way. It appears that as latency gets large, some-where around 300 ms, there is a qualitative drop in the experience.Relatively small levels of noise, although still noticeable and rangingup to 4 degrees, appeared to have very little impact on user experi-ence. As the noise became larger, the experience degraded. This isespecially true for tasks requiring precision placement. Interestingly,vibratory error has no significant impact on target touching tasks,likely because it effectively makes the arm cover a larger target zone,actually easing the task. The most fascinating result is that despitethese clear indications of degraded performance, social presence didnot decline, even when very substantial tracking errors were intro-duced to both the participant and interlocutor in Exp. 4. Previouswork showed that having no avatars present degraded social pres-ence [24], so it is not simply the case that the avatars do not matter.It may be that the presence of the avatar was enough to establish thesocial presence, and participants were willing to attribute the errorsto bad technology, like a poor quality phone call, without losingthe connection to the other person. Another explanation is that thenonverbal communication came through clearly enough despite theerrors, given the high quality underlying tracking, and hence theerrors did not diminish the sense of social connection.
It should be noted that the social interaction here was brief andlow-stakes. It may be that the impact on social presence wouldchange in a more high stakes situation, where the participant hadto either convey or read more subtle social information, such as ahigh stakes negotiation or approaching someone for a date. In thesescenarios, the errors might generate more uncertainty and lower thesense of social presence. It would also be interesting to calibrateerror in the experiments to specific tracking techniques. Nonetheless,it remains fascinating in this scenario that tracking error had a clearimpact on people’s sense of embodiment, but not their sense of socialpresence.Acknowledgements: We would like to thank the FRL team fortheir support, and in particular, Alexandra Wayne and Sean Idol forhelping run participants.

REFERENCES
[1] J. N. Bailenson, J. Blascovich, A. C. Beall, and J. M. Loomis. Equi-librium theory revisited: Mutual gaze and personal space in virtualenvironments. Presence: Teleoperators and virtual environments,10(6):583–598, 2001.
[2] S. R. Ellis, B. D. Adelstein, S. Baumeler, G. Jense, and R. H. Jacoby.Sensor spatial distortion, visual latency, and update rate effects on 3Dtracking in virtual environments. In VR, p. 218. IEEE, 1999.
[3] S. R. Ellis, F. Breant, B. Manges, R. Jacoby, and B. D. Adelstein.Factors influencing operator interaction with virtual objects viewed viahead-mounted see-through displays: viewing conditions and renderinglatency. In Virtual Reality Annual International Symposium, 1997.,IEEE 1997, pp. 138–145. IEEE, 1997.
[4] E. Geelhoed, A. Parker, D. J. Williams, and M. Groen. Effects oflatency on telepresence. HP Labs Technical Report: HPL-2009-120,2009.
[5] I. Greyware Automation Products. Domain time ii, 2018.[6] J. Groen and P. J. Werkhoven. Visuomotor adaptation to virtual hand
position in interactive virtual environments. Presence: Teleoperatorsand Virtual Environments, 7(5):429–446, 1998.
[7] K. Kim, D. Maloney, G. Bruder, J. N. Bailenson, and G. F. Welch.The effects of virtual human’s spatial and behavioral coherence withphysical objects on social presence in ar. Computer Animation andVirtual Worlds, 28(3-4), 2017.
[8] E. Kokkinara and M. Slater. Measuring the effects through time of theinfluence of visuomotor and visuotactile synchronous stimulation on avirtual body ownership illusion. Perception, 43(1):43–58, 2014.
[9] E. Kokkinara, M. Slater, and J. Lopez-Moliner. The effects of visuomo-tor calibration to the perceived space and body, through embodimentin immersive virtual reality. ACM Transactions on Applied Perception(TAP), 13(1):3, 2015.
[10] J. E. Lateiner and R. L. Sainburg. Differential contributions of vi-sion and proprioception to movement accuracy. Experimental brainresearch, 151(4):446–454, 2003.
[11] C. Lee, S. Bonebrake, D. A. Bowman, and T. Hollerer. The role oflatency in the validity of AR simulation. In Virtual Reality Conference(VR), 2010 IEEE, pp. 11–18. IEEE, 2010.
[12] L. Lin and S. Jorg. Need a hand?: how appearance affects the virtualhand illusion. In Proceedings of the ACM Symposium on AppliedPerception, pp. 69–76. ACM, 2016.
[13] I. S. MacKenzie. Fitts’ law as a research and design tool in human-computer interaction. Human-computer interaction, 7(1):91–139,1992.
[14] A. Maselli and M. Slater. The building blocks of the full body owner-ship illusion. Frontiers in Human Neuroscience, 7:83, 2013. doi: 10.3389/fnhum.2013.00083
[15] B. J. Mohler, H. H. Bulthoff, W. B. Thompson, and S. H. Creem-Regehr. A full-body avatar improves egocentric distance judgments inan immersive virtual environment. In Proceedings of the 5th symposiumon Applied perception in graphics and visualization, p. 194. ACM,2008.
[16] A. H. Morice, I. A. Siegler, and B. G. Bardy. Action-perception pat-terns in virtual ball bouncing: Combating system latency and trackingfunctional validity. Journal of neuroscience methods, 169(1):255–266,2008.
[17] C. E. Osgood, G. J. Suci, and P. H. Tannenbaum. The measurement ofmeaning. University of Illinois Press, 1964.
[18] E. Ragan, C. Wilkes, D. A. Bowman, and T. Hollerer. Simulation ofaugmented reality systems in purely virtual environments. In VirtualReality Conference, 2009. VR 2009. IEEE, pp. 287–288. IEEE, 2009.
[19] B. Ries, V. Interrante, M. Kaeding, and L. Anderson. The effect of self-embodiment on distance perception in immersive virtual environments.In Proceedings of the 2008 ACM symposium on Virtual reality softwareand technology, pp. 167–170. ACM, 2008.
[20] K. Schoenberg. The quality of mediated-conversation under transmis-sion delay. PhD thesis, TU Berlin, 2016.
[21] V. Schwind, P. Knierim, C. Tasci, P. Franczak, N. Haas, and N. Henze.These are not my hands!: Effect of gender on the perception of avatarhands in virtual reality. In Proceedings of the 2017 CHI Conference on
Human Factors in Computing Systems, pp. 1577–1582. ACM, 2017.[22] J. Short, E. Williams, and B. Christie. The social psychology of
telecommunications. 1976.[23] M. Slater, B. Spanlang, and D. Corominas. Simulating virtual environ-
ments within virtual environments as the basis for a psychophysics ofpresence. ACM Transactions on Graphics (TOG), 29(4):92, 2010.
[24] H. J. Smith and M. Neff. Communication behavior in embodied virtualreality. In Proceedings of the 2018 CHI Conference on Human Factorsin Computing Systems, p. 289. ACM, 2018.
[25] B. Spanlang, J.-M. Normand, D. Borland, K. Kilteni, E. Giannopoulos,A. Pomes, M. Gonzalez-Franco, D. Perez-Marcos, J. Arroyo-Palacios,X. N. Muncunill, et al. How to build an embodiment lab: achievingbody representation illusions in virtual reality. Frontiers in Roboticsand AI, 1:9, 2014.
[26] D. W. Sprague, B. A. Po, and K. S. Booth. The importance of accurateVR head registration on skilled motor performance. In Proceedings ofGraphics interface 2006, pp. 131–137. Canadian Information Process-ing Society, 2006.
[27] J.-P. Stauffert, F. Niebling, and M. E. Latoschik. Towards comparableevaluation methods and measures for timing behavior of virtual realitysystems. In Proceedings of the 22nd ACM Conference on VirtualReality Software and Technology, pp. 47–50. ACM, 2016.
[28] J.-P. Stauffert, F. Niebling, and M. E. Latoschik. Effects of latencyjitter on simulator sickness in a search task. In 2018 IEEE Conferenceon Virtual Reality and 3D User Interfaces (VR), pp. 121–127. IEEE,2018.
[29] R. J. Teather, A. Pavlovych, W. Stuerzlinger, and I. S. MacKenzie.Effects of tracking technology, latency, and spatial jitter on objectmovement. In 3D User Interfaces, 2009. 3DUI 2009. IEEE Symposiumon, pp. 43–50. IEEE, 2009.
[30] Vicon. Shogun 1.1 documentation: Create subjects and props, 2018.[31] Vicon. Vantage motion capture camera, 2018.[32] T. Waltemate, I. Senna, F. Hulsmann, M. Rohde, S. Kopp, M. Ernst,
and M. Botsch. The impact of latency on perceptual judgments andmotor performance in closed-loop interaction in virtual reality. InProceedings of the 22nd ACM Conference on Virtual Reality Softwareand Technology, pp. 27–35. ACM, 2016.
[33] S. Whittaker. Theories and methods in mediated communication. Thehandbook of discourse processes, pp. 243–286, 2003.

Supplemental Material
Category Ex. α ANOVA Result Post-hoc
Semantic 1 0.79 F3,60 = 3.56, pad j = 0.068 No significanceDifference 2 0.82 F4,92 = 2.72, pad j = 0.068 No significance
3 0.79 F4,92 = 0.347, pad j = 0.85 No significance4 0.84 F4,92 =, pad j = 0.32 No significance
Social 1 0.80 F3,60 = 3.33, pad j = 0.079 No significancePresence 2 0.61 F4,92 = 1.06, pad j = 0.38 No significance
3 0.69 F4,92 = 2.63, pad j = 0.079 No significance4 0.71 F4,92 = 2.01, pad j = 0.13 No significance
Embodi- 1 0.87 ∗F3,60 = 4.42, pad j = 0.014 L150 > L300ment 2 0.74 F4,92 = 2.44, pad j = 0.0525 No significance
3 0.86 ∗F4,92 = 3.50, pad j = 0.014 NE > SV 6B4 0.85 ∗F4,92 = 10.39, p < 0.0001 NE > {L350,C6}
L250 > {L350,C6}C6I >C6Tend :C6I > L350(pad j = 0.07)
Interface 1 0.88 ∗F3,60 = 5.01, pad j = 0.005 Tend. :L150 > L300(pad j =
0.051)2 0.90 ∗F4,92 = 3.37, pad j = 0.013 No post-hoc results3 0.89 ∗F4,92 = 7.08, pad = 0.0001 {NE,SV 6}> SV 6B4 0.89 ∗F4,92 = 8.69, p < 0.0001 {NE,L250,C6I}>C6
Spatial 1 0.78 ∗F3,60 = 7.53, p = 0.00047 L150 > L300;Tend. :L150 > NE(pad j = 0.057)LS150 > L300(pad j =
0.095)Presence 2 0.6 F4,92 = 2.04, pad j = 0.096 No significance
3 0.7 ∗F4,92 = 3.87, pad j = 0.008 NE > SV 6B4 0.82 ∗F4,92 = 15.02, p < 0.0001 {NE,L250,L350,C6I} >
C6Tend. :NE > L350(pad j = 0.082)
Table 12: Results from ANOVAs and significant post-hoc t-tests forall computed measures. Chronbach’s α is reported for the questionsthat constitute each measure. Significance values for post-hoc resultsare reported in Figure 4 and 5
Category NE LS150 L150 L300
Semantic Difference µ 4.83 5.17 4.86 4.65Semantic Difference SE 0.22 0.22 0.23 0.20
Social Presence µ 5.29 5.20 5.48 5.15Social Presence SE 0.31 0.31 0.27 0.30
Embodiment µ 5.76 5.69 5.86 4.88Embodiment SE 0.30 0.36 0.33 0.43
Interface µ 5.54 5.55 5.66 4.77Interface SE 0.27 0.31 0.28 0.41
Spatial Presence µ 5.04 5.08 5.48 4.40Spatial Presence SE 0.32 0.38 0.33 0.39
Table 13: Subjective results from Experiment 1
Category NE P4R30 P4R80 V.5 V1
Semantic Difference µ 5.32 5.11 5.16 4.89 4.98Semantic Difference SE 0.22 0.21 0.21 0.21 0.20
Social Presence µ 5.90 5.96 5.85 5.72 5.86Social Presence SE 0.18 0.15 0.15 0.20 0.15
Embodiment µ 6.06 6.05 5.99 5.58 5.67Embodiment SE 0.18 0.17 0.20 0.26 0.22
Interface µ 5.43 5.43 5.38 4.98 4.95Interface SE 0.28 0.27 0.25 0.31 0.29
Spatial Presence µ 5.35 5.35 5.28 5.17 4.95Spatial Presence SE 0.18 0.18 0.22 0.19 0.26
Table 14: Subjective results from Experiment 2
Category NE SP10 SV6 SV6B SP10B
Semantic Difference µ 4.15 4.06 4.09 4.07 4.15Semantic Difference SE 0.098 0.11 0.10 0.11 0.094
Social Presence µ 5.47 5.64 5.43 5.24 5.52Social Presence SE 0.16 0.16 0.18 0.22 0.19
Embodiment µ 5.56 5.22 5.29 4.94 4.96Embodiment SE 0.21 0.24 0.24 0.31 0.29
Interface µ 5.48 4.97 5.01 4.39 4.82Interface SE 0.23 0.28 0.29 0.36 0.30
Spatial Presence µ 4.91 4.36 4.53 4.10 4.40Spatial Presence SE 0.19 0.28 0.29 0.30 0.30
Table 15: Subjective results from Experiment 3
Category NE L250 L350 C6 C6I
Semantic Difference µ 4.39 4.13 4.29 4.16 4.18Semantic Difference SE 0.13 0.14 0.10 0.12 0.11
Social Presence µ 5.75 5.73 5.58 5.43 5.48Social Presence SE 0.20 0.20 0.21 0.21 0.24
Embodiment µ 6.00 5.51 4.89 4.36 5.84Embodiment SE 0.18 0.27 0.34 0.40 0.20
Interface µ 5.64 5.40 4.94 4.30 5.40Interface SE 0.24 0.28 0.34 0.36 0.27
Spatial Presence µ 5.60 5.24 4.81 4.17 5.33Spatial Presence SE 0.27 0.25 0.31 0.34 0.26
Table 16: Subjective results from Experiment 4.
Category NE LS75 L75 LS150 L150 LS300 L300time/ID µ 0.31 0.33 0.37 0.36 0.43 0.38 0.48time/ID SE 0.013 0.018 0.018 0.017 0.028 0.020 0.031adjT/ID µ 0.31 0.33 0.34 0.34 0.37 0.33 0.39adjT/ID SE 0.014 0.017 0.018 0.016 0.027 0.019 0.029Ease µ 6.94 6.67 6.47 6.50 6.03 5.97 4.97Ease SE 0.056 0.18 0.15 0.19 0.27 0.30 0.35
Table 17: Target touch results, Experiment 1. (adjT stands for adjustedtime)
Category NE V.5 V1 P4R30 P4R80 P3R80 P6R80time/ID µ 0.266 0.268 0.269 0.272 0.267 0.297 0.291time/IDSE
0.0092 0.011 0.011 0.010 0.010 0.016 0.019
Ease µ 6.40 6.14 5.77 6.42 6.13 6.40 6.23Ease SE 0.20 0.30 0.30 0.19 0.21 0.14 0.22
Table 18: Target touch results, Experiment 2Category NE S V6 P SV6 SP10time/ID µ 0.305 0.382 0.301 0.391 0.381 0.502time/ID SE 0.016 0.028 0.016 0.013 0.027 0.036Ease µ 6.73 5.71 5.00 4.96 4.52 3.89Ease SE 0.14 0.24 0.39 0.34 0.39 0.35
Table 19: Target touch results, Experiment 3.

Category NE L250 L300 L350 C3 C6time/ID µ 0.301 0.491 0.497 0.535 0.330 0.469time/ID SE 0.015 0.034 0.028 0.035 0.015 0.027adjtime/ID µ 0.301 0.413 0.408 0.429 0.330 0.469adjtime/ID SE 0.015 0.032 0.027 0.034 0.015 0.027Ease µ 6.41 5.32 5.45 5.23 4.27 3.5Ease SE 0.22 0.31 0.30 0.30 0.42 0.43Enjoy µ 6.27 4.95 5.32 5.00 4.09 3.91Enjoy SE 0.26 0.39 0.33 0.40 0.46 0.49Body µ 5.75 4.06 4.11 3.84 3.34 3.20Body SE 0.30 0.39 0.37 0.38 0.41 0.42
Table 20: Target touch results, Experiment 4
Category NE L250 L300 L350 C3 C6
Pos. Error (cm) µ 1.19 1.27 1.67 1.65 2.95 4.42Pos. Error SE 0.19 0.14 0.26 0.25 0.21 0.38
Or. Error (deg) µ 5.86 6.34 7.14 7.64 11.34 18.01Or. Error SE 0.86 0.92 1.14 1.50 1.13 1.34
Num Grabs µ 1.47 1.34 1.45 1.54 2.55 2.62Num Grabs SE 0.15 0.12 0.12 0.14 0.40 0.36
ReturnTime (s) µ 6.46 8.65 9.21 10.4 7.83 9.41ReturnTime SE 0.69 0.82 1.01 1.46 1.02 1.15
EaseRating µ 5.46 5.08 5.17 4.96 2.63 2.23EaseRating SE 0.34 0.33 0.29 0.36 0.35 0.34
EnjoyRating µ 5.63 5.08 5.41 5.38 3.58 3.42EnjoyRating SE 0.31 0.39 0.33 0.35 0.43 0.45
BodyRating µ 5.17 4.58 4.65 4.31 2.96 2.73BodyRating SE 0.35 0.40 0.33 0.34 0.36 0.39
Table 21: Precision placement results, Experiment 4