The Impact of Alcohol on Mental Health, Physical Fitness, and … · 2017-06-21 · The Impact of...
38
NBER WORKING PAPER SERIES THE IMPACT OF ALCOHOL ON MENTAL HEALTH, PHYSICAL FITNESS, AND JOB PERFORMANCE Marigee Bacolod Jesse M. Cunha Yu-Chu Shen Working Paper 23542 http://www.nber.org/papers/w23542 NATIONAL BUREAU OF ECONOMIC RESEARCH 1050 Massachusetts Avenue Cambridge, MA 02138 June 2017 We thank Jeremy Arkes for helpful comments. Any opinions, findings, and conclusions or recommendations expressed in this material are those of the authors and do not necessarily reflect the views of the Departments of the Navy or Defense, or the National Bureau of Economic Research. NBER working papers are circulated for discussion and comment purposes. They have not been peer-reviewed or been subject to the review by the NBER Board of Directors that accompanies official NBER publications. © 2017 by Marigee Bacolod, Jesse M. Cunha, and Yu-Chu Shen. All rights reserved. Short sections of text, not to exceed two paragraphs, may be quoted without explicit permission provided that full credit, including © notice, is given to the source.
Transcript of The Impact of Alcohol on Mental Health, Physical Fitness, and … · 2017-06-21 · The Impact of...

NBER WORKING PAPER SERIES
THE IMPACT OF ALCOHOL ON MENTAL HEALTH, PHYSICAL FITNESS, ANDJOB PERFORMANCE
Marigee BacolodJesse M. CunhaYu-Chu Shen
Working Paper 23542http://www.nber.org/papers/w23542
NATIONAL BUREAU OF ECONOMIC RESEARCH1050 Massachusetts Avenue
Cambridge, MA 02138June 2017
We thank Jeremy Arkes for helpful comments. Any opinions, findings, and conclusions or recommendations expressed in this material are those of the authors and do not necessarily reflect the views of the Departments of the Navy or Defense, or the National Bureau of Economic Research.
NBER working papers are circulated for discussion and comment purposes. They have not been peer-reviewed or been subject to the review by the NBER Board of Directors that accompanies official NBER publications.
© 2017 by Marigee Bacolod, Jesse M. Cunha, and Yu-Chu Shen. All rights reserved. Short sections of text, not to exceed two paragraphs, may be quoted without explicit permission provided that full credit, including © notice, is given to the source.

The Impact of Alcohol on Mental Health, Physical Fitness, and Job PerformanceMarigee Bacolod, Jesse M. Cunha, and Yu-Chu ShenNBER Working Paper No. 23542June 2017JEL No. I1,I12
ABSTRACT
We study the impact of legal access to alcohol on a range of behavioral and physical outcomes of U.S. Army soldiers in a regression discontinuity design. The wealth of novel data collected by the military on cognitive ability, psychological health, and family history allows us to explore how impacts vary with risk factors for alcohol consumption. Overall, we observe a large and significant increase in drinking after the 21st birthday, but the increases are largest amongst those who were depressed, had a family history of mental health problems, had better coping ability, and had higher cognitive ability. Despite the large increase in consumption, we do not find any meaningful impacts of legal access to alcohol - overall or in any sub-group - on any of the short-term outcomes we observe, including suicidal tendencies, depression, tobacco use, physical fitness, psychological health, deployability, smoking, and job-related infractions. Acknowledging the limitations for extrapolation out of sample, we discuss the policy implications of our results.
Marigee BacolodGraduate School of Business and Public PolicyNaval Postgraduate SchoolMonterey CA [email protected]
Jesse M. CunhaNaval Postgraduate SchoolGraduate School of Businessand Public Policy555 Dyer RdMonterey, CA [email protected]
Yu-Chu ShenGraduate School of Business and Public PolicyNaval Postgraduate School555 Dyer RoadMonterey, CA 93943and [email protected]
1. IntroductionAlcohol is a pervasive part of our society, and its consumption can have widespread conse-
quences. Plausible theoretical arguments can link alcohol to numerous adverse outcomes, such as
death, crime, sexual activity, poor educational performance, unemployment, low job productivity,
the use of related vices such as drugs and tobacco, poor inter- and intra-personal relationships,
and mental and physical health problems. Importantly, the impacts of alcohol consumption are
likely to vary across individuals. For example, cognitive ability or mental health may aid or hinder
individuals in mitigating the effects of alcohol on judgement and choices.
Despite clear theoretical pathways, it is difficult to estimate causal relationships empirically be-
cause of either unobserved joint factors that determine both drinking and adverse outcomes (e.g.,
lack of self-control may precipitate both alcohol consumption and poor education outcomes) or
reverse causality (e.g., poor mental health can induce one to consume alcohol). The most credible
empirical estimates to date of the impacts of alcohol consumption come from regression disconti-
nuity (RD) designs around the U.S. Minimum Legal Drinking Age (MLDA) of 21 years. The RD
approach compares individuals just before and after their 21st birthday, and relies on the assump-
tion that there are no other factors influencing alcohol consumption or outcomes of interest at this
threshold. RD estimates of the MLDA have shown that legal access to alcohol increases mortality
(Carpenter and Dobkin, 2009), lowers academic performance (Carrell, Hoekstra and West, 2011;
Lindo, Swensen and Waddell, 2013), increases crime (Carpenter and Dobkin, 2015), and increases
the use of marijuana and tobacco (Dee, 1999; Crost and Guerrero, 2012), amongst others.
In this paper, we expand the literature in two ways, using several novel datasets on U.S. Army
soldiers. First, we examine outcomes that have not yet been studied in the context of the MLDA,
including suicidal tendencies, psychological health, physical fitness, job-related infractions, and
fitness for combat deployment. Second, we explore heterogeneity in the impacts of alcohol in
terms of potential risk factors, including self-control, depression, coping ability, cognitive ability,
and a family history of mental health problems or substance abuse.
Our population is all enlisted U.S. Army soldiers between 2009 and 2015.1 This is the only
population we are aware of that contains such a rich panel of data on alcohol consumption and men-
tal, behavioral, and physical outcomes. Outcomes from soldiers are important in their own right:
there are 1.3 million active duty military members who are tasked with safeguarding our country,
and the U.S. military is heavily involved in alcohol abuse prevention (Leskin, 2015). Heavy drink-
1Data is available for officers; however, only a handful of officers turn 21 years old while on active duty, as afour-year college degree is required to obtain an officer’s commission.
1

ing among service members has also been increasing since 2001 when the US entered its longest
armed conflict to-date (Bray and Hourani, 2007; Oster et al., 2012). The rising trend in drinking
and alcohol related problems is especially noticeable among those returning from deployment (Ja-
cobson et al., 2008; Shen, Arkes and Williams, 2012; Bray, Brown and Williams, 2013), as many
resort to alcohol as a way to cope with combat trauma.
Our data are drawn from multiple administrative databases. The Periodic Health Assessment
(PHA) is a required, annual clinical health assessment which contains self-reports of alcohol and
tobacco use, depressive symptoms, and suicidal thoughts, as well as the information that deter-
mines fitness for military deployment, a measure of job performance; the Global Assessment Tool
(GAT) is an annual, self-administered and self-diagnostic psychometric assessment, identifies as-
pects of soldier’s underlying psychological traits; annual physical fitness tests include scores for
the number of push-ups and sit-ups completed at one time and the time taken to run two miles; and
judicial and non-judicial punishments are recorded for any breach of military conduct or law.
Our first finding is that poor psychological health is correlated with alcohol consumption, both
below and above 21 years of age. Second, there is a large discontinuous increase in alcohol con-
sumption at age 21, both in the likelihood of drinking (a 75% increase) and the amount of drinking
in any one sitting (increasing from about a third of a drink to an average of 2 drinks per day). In
addition, those soldiers who were depressed at the baseline or have family history of mental health
problems have larger change in their drinking behavior relative to all other soldiers. On the other
hand, soldiers with better coping ability and those in the top quartile of AFQT distribution also
have larger responses in drinking behavior when they turn 21. Finally, despite the increase in al-
cohol consumption, we do not observe any meaningful impacts on any of the short-term outcomes
we observe, including suicidal tendencies, depression, tobacco use, physical fitness, psychological
health, deployability, and job-related infractions. This null finding is precisely estimated, and is
true over the entire population and when we stratify by soldiers’ baseline psychological traits.
In sum, our findings suggest that while gaining legal access to alcohol increases overall drink-
ing behavior among U.S. soldiers, it did not have immediate harmful consequences on the observ-
able dimensions of soldier health, fitness, and job performance. However, this conclusion must
be qualified by the limitations of our data and empirical setting. First, as with any RD around the
MLDA, we are only able to look at the subset of individuals around their 21st birthday. While al-
cohol consumption has been shown in laboratory settings to compromise physical and motor skills
(Vogel-Sprott, 1979; Fogarty and Vogel-Sprott, 2002), our study population are young soldiers at
or near their physical prime. It is thus unclear whether our results are externally valid to subjects
2
who are younger or older than this sample. Second, the RD research design precludes us from
looking at the long-term impact of alcohol consumption and from examining outcomes that may
take time to manifest. Finally, despite our wealth of data, there are other important short-term
outcomes that we do not observe, such as death, hospitalizations, and accidents. Nonetheless, our
study adds important outcomes to a growing body of work of credible estimates of the effects of
alcohol consumption, and demonstrates the importance of recognizing the variation in risk factors
for alcohol consumption across the population.
The rest of the paper proceeds as follows. The next section describes our data and the setting
of our sample. Section 3 discusses our empirical methods in detail, while Section 4 presents the
main results. Finally, Section 5 concludes.
2. Data and Sample
2.1 Data
Our population is U.S. Army enlisted soldiers, and our data come from personnel records
and routine health assessments that are collected on all enlisted soldiers. The Master Personnel
File identifies the set of soldiers of an age close to their 21st birthday and contains their demo-
graphic information such as birthdate, gender, race/ethnicity, the Armed Forces Qualifying Test
(AFQT) score, and educational attainment. We merge the Master Personnel File to several other
person-level databases which contain additional information on mental, physical, and behavioral
outcomes.
Periodic Health Assessment. The Periodic Health Assessment (PHA) is a required annual
assessment that is used primarily to screen for health problems and determine if a solider is fit for
a combat deployment. Some of the data in the PHA is measured by a clinician, and some is self-
reported by the service member. The clinically measured data include height, weight, vision and
hearing ability, blood pressure, and cholesterol level. The self-reported data come from questions
about current and past health symptoms and diseases, alcohol and tobacco use, behavioral and
mental health history, and family history of mental health problems and chemical dependency.
Soldiers are informed that the elements of the PHA will not be shared with their superiors, and
only used to assess their fitness for deployment. Nonetheless, it is possible that soldiers are not
truthful with the self-reported PHA data, as they know that the PHA is used to determine eligibility
for deployment, and deployability is a major determinant of promotion and career advancement.
Soldiers wishing to appear mentally healthy may shade mental health issues or alcohol use, while
soldiers wishing to not be deployed may fabricate these conditions.
3

Global Assessment Tool The Global Assessment Tool (GAT) is a self-evaluation tool that was
developed by the Army in 2009 as part of its efforts to improve soldiers’ psychological resiliency.
All soldiers are required to take the assessment yearly through an online module. They are told
explicitly that their responses are confidential and will not be seen by their superiors. In contrast
to the PHA, there is less reason to believe that soldiers would not be truthful on the GAT as there
is not a direct link between responses and one’s career.
The GAT contains 105 questions, either binary responses or on five- or 10-point scales, that are
intended to assess a soldier’s psychological health in 14 categories: depression, catastrophizing,
positive affect, adaptability, coping ability, optimism, character, engagement in the workplace,
friendship, loneliness, organizational trust, family satisfaction, family support, and spirituality.
For full details of the GAT questionnaire see Lester et al. (2011).
Other Administrative Databases Physical fitness data come from the Digital Training Man-
agement System (DTMS), and include scores from the required annual assessments of three events:
push-ups, sit-ups, and a 2-mile run. Lastly, we obtain records of all infractions recorded in a sol-
dier’s official file from the interactive Electronic Records of Management System (iPERMS). This
data contains both judicial proceedings (i.e., court martial) as well as minor breaches of military
conduct.
2.2 Outcomes
Next we describe the outcome measures that are drawn from these various databases. We ex-
amine the impacts of legal access to alcohol on both soldiers’ drinking behavior and outcomes that
are known to be correlated with alcohol consumption or could potentially be influenced by alco-
hol consumption. Theoretical mechanisms through which alcohol could influence these outcomes
include compromised judgment and impaired physical and/or motor skills.
Alcohol consumption. We define four measures of alcohol consumption from questions on
the PHA. The first question is: How often do you have a drink containing alcohol?, to which the
soldier can respond: “never”, “monthly or less”, “2-4 times a month”, “2-3 times a week”, or “4 or
more times a week.” From this, we define an indicator for whether a person drinks alcohol. Given
the vagueness of the text, it is unclear whether this question is asking about whether a person has
ever drank alcohol, or whether they have drank alcohol recently. It is worth noting that among our
under-21 sample, close to 13% of the soldiers had consumed alcohol. We also calculate from this
question the proportion of days in which a person drinks, constructing the measure logically from
responses. For example, those who reported drinking “monthly or less” are assigned a value of
1/30, those who report “2-4 times a month” are assigned 3/30, and so forth.
4
If the answer to the first question is anything other than “never”, the respondent proceeds to
answer about the intensity of their drinking behavior. They were next asked How many drinks
containing alcohol do you have on a typical day when you are drinking? (1-2, 3-4, 5-6, 7-9, or
10+), from which we define a linear variable of the number of drinks on a typical drinking day,
imputing the midpoint of the category ranges and coding ”10+” as 10 drinks. Finally, respondents
were asked: How often do you have six or more drinks on one occasion? (never, less than monthly,
monthly, weekly, or daily), from which we define the proportion of “binge” drinking days in a
similar manner to the proportion of drinking days.
Tobacco use. Past studies have documented that alcohol use and tobacco use have common risk
factors (Verdejo-Garcıa, Lawrence and Clark, 2008). Using responses from the PHA, we define
three measures of smoking on both the extensive and intensive margins. On the extensive margin,
soldiers were asked Do you use any kind of tobacco products?; close to 30% of those under 21
years old reported they do. On the intensive margin, smokers were first asked about the number
of cigarettes smoked, and we define a moderate or heavy smoker as 11 or more cigarettes per day
(results are robust to the use of the continuous number of cigarettes smoked). They were then asked
three questions about their level of nicotine dependency that, along with the number of cigarettes
smoked per day, facilitates the calculation of the Fagerstrom score (Heatherton et al., 1991): How
soon after waking up do you smoke your first cigarettes; Do you find it difficult to refrain from
smoking in places where it is forbidden; Do you smoke more frequently in the morning; and Do
you smoke even if you are sick in bed most of the day. The Fagerstrom score ranges from 0 to 10,
and we classify those with a score of 5 or higher as having a moderate or high nicotine dependence
(results are robust to the use of the linear Fagerstrom score). Amongst smokers under 21 years old,
26% are moderate or heavy smokers, and 14% are classified as having a moderate or high nicotine
dependence.
Depression and suicide ideation. Alcohol use been shown to be correlated with both major
depression and suicide ideation (Wang and Patten, 2001; Fergusson, Boden and Horwood, 2009;
LeardMann et al., 2013; Fuehrlein et al., 2016; Thompson and Swartout, 2017). However, there is
no evidence to date on the causal pathways at play. The PHA contains nine screening questions
for depression which ask about mood and behavior in the last two weeks. Following the Army’s
psychological health referral guideline, we define a soldier to be at risk of clinical depression if he
answered “more than half the days” or “nearly every day” to at least one of these nine questions.2
2The exact wording in the PHA is: Over the last two weeks, how often have you been bothered by any of thefollowing problems? (1) Little interest or pleasure in doing things? (2) Feeling down, depressed or hopeless? (3)Trouble falling asleep or staying asleep, or sleeping too much, (4) Feeling tired or having little energy, (5) Poor
5
In our sample, 6.5% of soldiers under 21 were screened positive for depression. The PHA also
has one question concerning suicide ideation. We define the indicator self-harm thoughts if they
answer anything other than “never” to the question How often in the last 2 weeks were you bothered
by “thoughts that you would be better off dead, or of hurting yourself in some way.” Self-harm
thoughts are rare, with only 0.1% of soldiers in the under-21 sample defined as such.
Fitness for deployment. A soldier is determined to be fit for deployment “to an austere envi-
ronment” if he has a PULHES score above the occupation-specific minimum. The PULHES is a
function of six factors: (P)hysical capacity or stamina; (U)pper extremities; (L)ower extremities;
(H)earing and ears; (E)yes, and (P)sychiatric stability. Approximately 93% of our under-21 sample
were deemed to be fit for deployment.
Coping ability and self control. The GAT assesses two psychological traits, coping ability
and self-control, that may be influenced by alcohol consumption through disruptions in the brain’s
neurotransmitter balance (Verdejo-Garcıa, Lawrence and Clark, 2008). We define self-control as
the answer to a single question from the GAT measured on a scale of 0-10: Think about how you
have acted in actual situations during the past four weeks. Select a number from 0 to 10 according
to how often you showed/used self control. We define coping ability as the sum of responses
from 8 questions as on the GAT, each with a score of 1 to 5: How well do the following statements
describe you–(1) For things I cannot change, I accept them and move on; (2) I control my emotions
by changing how I think about things; (3) When something stresses me out, I try to avoid it or not
think about it; (4) When something stresses me out, I try to solve the problem; (5) When bad
things happen, I try to see the positive sides; (6) I usually keep my emotions to myself; (7) When
something stresses me out, I have effective ways to deal with it; and (8) When I am feeling upset, I
keep my feelings to myself. We take the sum of responses from these 8 questions to form the coping
ability outcome, where a higher score reflects a better coping ability.
Physical fitness. Laboratory settings have shown alcohol consumption can result in slower
movement and poorer coordination. Our next set of outcomes thus capture a soldiers’ physical fit-
ness. The PFT is a twice-yearly assessment of soldier’s muscular strength and physical endurance
consisting of three events: push-ups, sit-ups, and a 2-mile run. Each event is scored between 0 and
100, and a 60 is required in all events to pass. Passing scores are assigned by gender and age group
for the number of push-ups and pull-ups completed, and the time required for the 2-mile run. For
appetite or overeating, (6) Feeling bad about yourself - or that you are a failure or that you have let yourself or yourfamily down, (7) Trouble concentrating on things, such as reading the newspaper or watching television, (8) Movingor speaking so slowly that other people could have noticed. Or the opposite - being so fidgety or restless that you havebeen moving around a lot more than normal, (9) Thoughts that you would be better off dead, or of hurting yourself insome way.
6
example, for a 21-year old male, the passing ranges are: 42-71 push-ups, 53-78 sit-ups, a 2-mile
run time between 15 minutes 54 seconds and 13 minutes. (For full details of the test, see Army
(2012).) We consider as outcomes the separate event scores as well as the aggregate score (sum
across all three events).
Job-related infractions. Our final set of outcomes identify all recorded breaches of military
conduct or regulation. There is evidence from non-military populations that crime increases with
legal access to alcohol (Carpenter and Dobkin, 2011), with the plausible pathway being alcohol
impairing judgement. The job of a soldier is unique in that one is always subject to the the Uniform
Code of Military Justice (UCMJ) regardless of whether the soldier is on duty; thus, any breach of
the UCMJ can be considered a job-related infraction.
The iPERMS database contains various levels of offenses varying in severity. We classify
these offense records into three categories, and consider offenses of each type separately, as well
as an aggregate measure of having committed any offense. A level 1 offense is a minor offense
known as a “letter of reprimand.” It is recorded by the soldier’s commanding officer for a broad
range of behaviors deemed unbecoming of a military service member, such as insubordination, an
initial report of sexual harassment, or disorderly conduct. These types of offenses do not result in
punishments, but the letter stays on the soldier’s personnel record and may affect future promotions
or assignments. A level 2 offense is when a soldier goes through proceedings under Article-15 of
the UCMJ. When a soldier commits an offense covered by the UCMJ, his commanding officer can
decide to process him under Article-15 or bring formal charges. Article-15 proceedings can result
in punishments (such as demotion, confinement, jail time for no more than 30 days, extra duties),
but do not result in a criminal record. Soldiers who undergo Article-15 proceedings do not go
through a formal adjudication process (although soldiers have the right to request a full military
legal trial). Finally, a level 3 offense is one which the commanding officer deems serious enough
to merit a full judicial hearing, known as military court martial. If convicted under a court martial,
the soldier will have a criminal record and receive punishments that range from demotion, fines,
jail time or dishonorable discharge (which affect his post-military benefits). One thing to keep in
mind is that while we can classify types of offenses, our data does not indicate the nature of any
offense. Offenses are relatively rare, with only 3.4% of the under-21 sample having at least one
offense.
2.3 Sample Selection
Using a window of 6 months above and below the 21st birthday, we first identify all soldiers
in the Master Personnel File who were aged 20.5 to 21.5 at anytime between 2009 and 2015.
7

We exclude soldiers stationed either outside the U.S. and or on bases within 50 miles of the U.S.
borders with Mexico and Canada, as commanders at these locations have the discretion to adopt
an MLDA other than 21 years old. We also exclude any soldiers who do not have a GAT test
before their 21st birthday. Our working sample size is 29,329 soldiers, but some outcomes are
not observed for every soldier in the window around their 21st birthday. For instance, in the PHA
sample which we use for our main analysis, we only have 11,905 observations. In contrast we are
able to capture more soldiers in the PFT sample (n =28,998) since soldiers are required to take the
test two times a year.
Table 1 summarizes the characteristics of the individuals in our analysis: the majority are male
(83%) and white (59.9%), virtually all have a High School diploma (a requirement for military
service), and the average AFQT score is the 56th percentile. We summarize the outcome variables
as we discuss our results below.
3. MethodsWe use a Regression Discontinuity (RD) design which exploits the discontinuity in legal access
to alcohol at age 21. Outcomes for individuals observed just prior to their 21st birthday serve as
the counterfactual for individuals observe just after their 21st birthday. Causal identification of the
impact of legal access to alcohol rests on the assumption that no other factors related to outcomes
of interest changed at this threshold other than alcohol access becoming legal, and also that there
is no systematic sorting of when the PHA, PFT, and GAT were taken.3
Formally, for each person i, let Di = agei−21 be the distance in days between the observation
of the outcome and the person’s 21st birthday, and Ti be an indicator of being over 21: Ti = 1{Di ≥0}. Yi are outcomes of interest, such as measures of alcohol consumption and health measures, and
we estimate models of the following form:
Yi = β0 +β1Ti +g(Di)+ γXi + εi,
where D = (D,D2)′ and g(Di) = α0D+α1T ∗D. Thus, g(D) is a 2nd order polynomial of D in our
parametric specification, with interactions of the over 21 indicator with the quadratic function. β1
is the discrete change in Yi at the discontinuity. For variance reduction purposes, we also include
X , a set of control variables in some of our specifications. Standard errors are adjusted to allow for
3While a subset of soldiers could have been drinking before turning age 21, and this early drinking behavior couldhave affected their GAT score, we are exploiting variation from increased alcohol access at age 21. As such, theinterpretation of the treatment effect is conditional on their GAT score prior to age 21 and is the effect of the marginalincrease of access to alcohol at age 21.
8

an arbitrary correlation in errors at the level of D, the distance to age 21, to account for potential
misspecification as suggested by Lee and Card (2008).
While in principle we could use nonparametric local linear regression or other techniques, the
underlying data (in particular, of age) are not actually continuous but rather discrete. Following
Lee and Card (2008), we then assess the adequacy of our parametric representation by comparing
our model with a non-parametric specification that includes a full set of indicators for each value
of D (that is, for each day away from the 21st birthday):
Yi = ∑d
αdZdi + γXi +µi,
where Zd is a dummy variable that equals 1 if the soldier i’s age is equal to d, and 0 otherwise. The
coefficients αd are represented as open circles in the figures we discuss below, while the quadratic
polynomial fit of the above equation are represented as connected lines/curves. These plots al-
low for a simple “eyeball” test of the extent to which our parametric formulation is a reasonable
representation of the data.
To confirm our visual examination with a more formal test, we calculate a goodness of fit
statistic as developed in Lee and Card (2008) and as summarized in Lee and Lemieux (2010),
G =(ESSr−ESSur)/(J−K)
ESSUR/(N− J),
where ESSr is the estimated sum of squares of the restricted (quadratic) model while ESSur is the
estimated sum of squares of the unrestricted (fully-saturated) model. G follows a F(J−K,N− J)
distribution where J is the number of values taken by D and K is the number of parameters in the
restricted model. With this F- statistic we can test the null hypothesis that the polynomial fit is as
good or has as much explanatory power as the fully flexible model. In our models, the F- statistics
indicate that the restricted and unrestricted models have similar goodness of fits.
3.1 Heterogeneity Analysis
A novel contribution of our analysis is that we are able to estimate the heterogeneous impacts
of the MLDA in terms of risk factors for alcohol consumption. We explore the following five
dimensions of heterogeneity, using soldier’s score on that dimension before they turned 21 years
old.
Depression, Self-control, and Coping Ability. In our main analysis, we consider depression,
self-control, and coping ability as outcomes that may be be affected by alcohol use; however, the
direction of causality could run the other way, whereby these psychological attributes are the risk
9
factors leading to drinking (Verdejo-Garcıa, Lawrence and Clark, 2008).
Self-control and coping ability are already described in section 2.2 and come from the GAT.
For depression, we use screening questions from the PHA as our outcome, but we stratify soldiers
based on their GAT depression scale for the heterogeneity analysis. While there is overlap in the
questions, the PHA follows clinical screening questions more closely and contains more details.
In contrast, the GAT depression scale is based on fewer questions and is intended to capture a
soldier’s inherent tendencies toward being depressed. Specifically, GAT measures depression using
5 questions. Respondents were asked to rate on a 5-point scale (from “not at all” to “every day”)
how often in the past four weeks they were bothered by any of the problems listed. Examples of
the problems include “Feeling down, depressed or hopeless,” and “Feeling very angry.” 4 We take
the sum of scales across all responses to form the baseline depression scale.
Armed Forces Qualifying Test percentile. The AFQT percentile is computed based on test
scores from the following aptitude tests: arithmetic reasoning, mathematics knowledge, paragraph
comprehension, and word knowledge. The Army uses results from these tests to assign soldiers
to suitable military occupation. It is normalized so the AFQT scores are reported as percentiles
between 1 and 99. The U.S. Army requires a minimum score of 31 on the AFQT for a person to
be enlisted. A score below 31 would require a waiver. As Table 1 shows, the average AFQT score
in our sample is 56.
Family history of mental health problems and/or chemical dependency. On the PHA, a
soldier was asked to identify whether their parents, grandparent, and/or siblings had mental health
problems or chemical dependencies.5 We classify soldiers into those with and without any family
history of mental health or chemical dependency, and approximately 13% of our sample reported
having any family history. Our results are robust to looking separately at histories of mental health
problems and chemical dependencies, as well as using the number of family members with a
reported condition.
4The complete questions in the GAT are: (1) Feeling down, depressed or hopeless, (2) Feeling tired or having littleenergy, (3) Poor appetite or overeating, (4) Feeling very angry, (5) Trouble concentrating on things, such as readingthe newspaper or watching television.
5Mental health problems include any of the following disorders: Generalized anxiety disorder, Depression, Bipolardisease, Schizophrenia, Obsessive compulsive disorder, Attention deficit disorder, Split personality disorder, Person-ality disorder, Adjustment disorder, Eating disorder, Tourette syndrome, Agoraphobia, Autism, Seasonal affectivedisorder, Suicide, Multiple disorders. Chemical dependency includes any of the following categories: alcohol, co-caine/crack, heroin, marijuana, methamphetamine, narcotics, glue/solvents, LSD, benzodiazepines, Ecstasy, multipledependency, other chemical dependency.
10

4. Results
4.1 The impact of MLDA on alcohol consumption
We first examine the impact of legal access to alcohol on self-reported alcohol consumption.
Figure 2 presents four different measures of alcohol consumption amongst soldiers in the 180 days
before and after their 21st birthday. A visual comparison of the parametric estimates and the daily
means suggest that the quadratic parameterization fits the data reasonably well. We confirm this
with the F−statistic described above, which tests the null hypothesis that the polynomial model
has as much explanatory power as the fully flexible (non-parametric) model.
The top left panel of Figure 2 shows that approximately 13% of soldiers report having drank
any alcohol prior to their 21st birthday. The bottom left panel shows that soldiers consume very
little prior to turning age 21, on average about a third of a drink (this measure includes those who
do not drink as drinking 0 drinks). The top right and bottom right panels of Figure 2 show that
amongst those who drink at all, the proportion of drinking days is very low and the proportion of
binge drinking days (having six or more drinks on one occasion) is even lower.
For the first two months after the 21st birthday, there is a clear rising propensity in the intensive
and extensive margins of alcohol consumption, which then plateau at new higher levels. About
70% of soldiers report having ever drank alcohol by the 2nd month after their 21st birthday, and
the number of drinks on a typical drinking day rises to about 2. The proportion of drinking days
rises to about 10%, and while the proportion of binge drinking days also rises it is still low, at about
0.02%. This ramp-up after the 21st birthday is consistent with the fact that soldiers must wait until
they are off-duty before they can purchase alcohol and drink – depending on one’s occupation or
phase of training, this freedom to drink may be delayed by weeks or months.
Table 2 confirms the visual impacts seen in Figure 2, although the point estimates are muted as
our regression model does not distinguish between the post-birthday ramp-up in drinking and the
eventual plateau. For example, the RD point estimate for drinking at all is 9.5 percentage points,
which is an increase of 74.8% (=0.095/0.127) even though 2 months after the 21st birthday the
increase over the pre-21 rate is over 5-fold (˜13% to ˜70%).
It is worth noting that these estimates of the impact of the MLDA on alcohol consumption
are slightly larger than those found amongst both the U.S. population as a whole (a 6 percentage
point increase found in Carpenter and Dobkin (2009) using the National Health Interview Survey)
and the U.S. college student population (a 6.5 percentage point increase found in Lindo, Swensen
and Waddell (2013) using the NLSY 97). The pre-21 alcohol consumption we observe amongst
11

soldiers is also lower than has been reported in the civilian population. These low rates could be
reflecting under-age soldiers’ unwillingness to report alcohol use: soldiers may not know, or not
believe, that the PHA is not shared with their direct superiors. However, young soldiers generally
live on bases with limited access to alcohol and face strict penalties for drinking under the legal
age, supporting the validity of these low rates. That alcohol consumption slopes upward in the next
60 days after turning 21, as opposed to a discontinuous change at exactly 21, suggests that access
to alcohol is driving this change in alcohol behavior, further validating our research design.
4.2 The impact of MLDA on mental health, physical fitness, and job performance
Figure 3 presents visual evidence of the change in selected outcomes around the 21st birthday.
As with the alcohol consumption measures, the quadratic parametric specifications fit the data
reasonably well (this is also confirmed by the F- statistics described above). Table 2 contains RD
estimates of all of our outcomes of interest.
By and large, we observe no systematic differences in any of the outcomes we study for sol-
diers before and after the 21st birthday. That is, virtually all of these RD estimates are small in
magnitude, precisely estimated (standard errors are small, partially stemming from the large sam-
ple sizes), and statistically indistinguishable from zero.6 For instance, in the PHA sample, 29.7%
of the soldiers reported being a smoker just before they turned 21. The estimated impact of turning
age 21 is to increase the prevalence of smoking by 2.2 percentage points, but this estimate is not
statistically distinguishable from 0. Our finding on smoking is consistent with Yoruk and Yoruk
(2011) who show that the MLDA has a small and insignificant impact on cigarette (and marijuana)
use.7
That our estimates of the impacts of MLDA are indistinguishable from zero are also not being
driven by the baseline mean. For instance, 93.3% of soldiers are classified as “Fit for deployment”
prior to turning 21. The RD estimate of turning 21 is to lower this percentage by 0.8 percentage
points, but then again the estimate is not statistically different from zero. We do find that the
impact of the MLDA on job-related infractions (“Any offense”) is significant at the 5 percent
level (and is driven by level 1 offenses), but is extremely small in magnitude and economically
insignificant. This is in part due to the low-frequency nature of this event, which is why we present
the RD in Figure 3 aggregated to the weekly level. In addition, Appendix Table 4 shows that6With the large number of outcomes we consider, one may be concerned about issues of multiple inference; how-
ever, common adjustments will tend to increase p-values of hypothesis tests, further supporting our general finding ofno impacts of the MLDA on these outcomes (Savin, 1980).
7The military has a ”Zero Tolerance” policy on the use of illicit drugs, the consequence for which is expulsionfrom service (Bachman et al., 1999); it is therefore not surprising that the PHA does not ask about marijuana or otherillicit drug use.
12
the significant estimate is purely an artifact of the functional form rather than a true decline in
job-related infractions post-21.
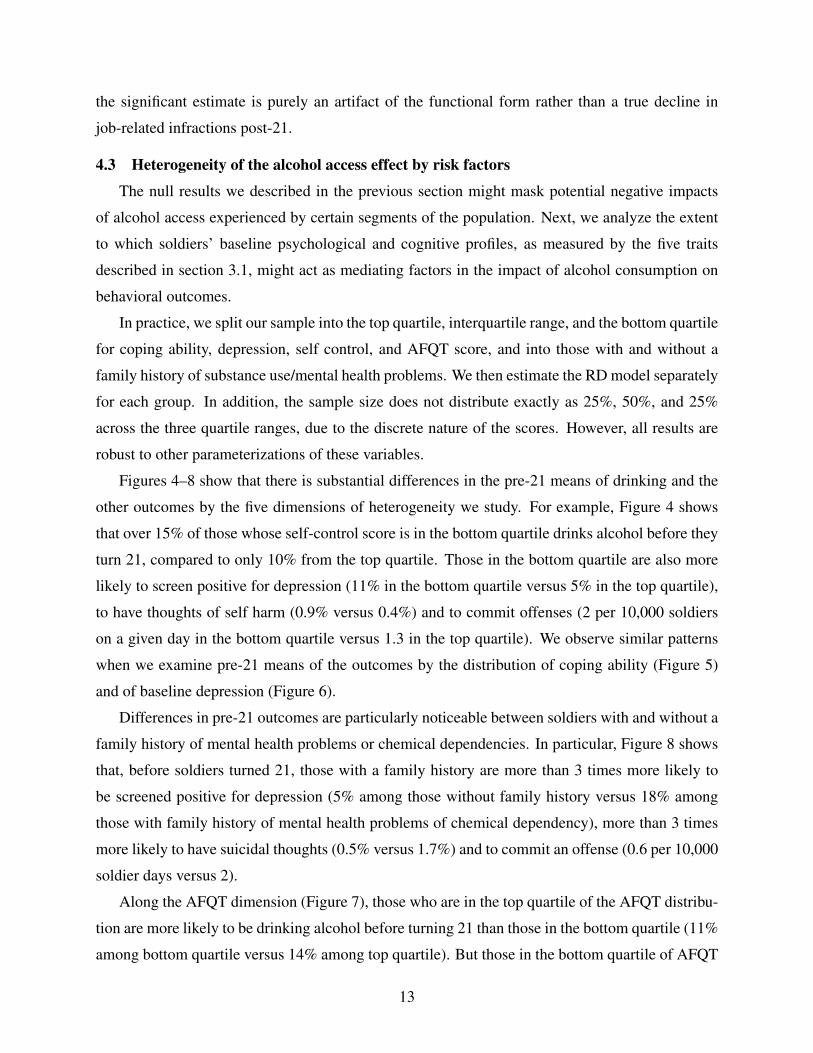
4.3 Heterogeneity of the alcohol access effect by risk factors
The null results we described in the previous section might mask potential negative impacts
of alcohol access experienced by certain segments of the population. Next, we analyze the extent
to which soldiers’ baseline psychological and cognitive profiles, as measured by the five traits
described in section 3.1, might act as mediating factors in the impact of alcohol consumption on
behavioral outcomes.
In practice, we split our sample into the top quartile, interquartile range, and the bottom quartile
for coping ability, depression, self control, and AFQT score, and into those with and without a
family history of substance use/mental health problems. We then estimate the RD model separately
for each group. In addition, the sample size does not distribute exactly as 25%, 50%, and 25%
across the three quartile ranges, due to the discrete nature of the scores. However, all results are
robust to other parameterizations of these variables.
Figures 4–8 show that there is substantial differences in the pre-21 means of drinking and the
other outcomes by the five dimensions of heterogeneity we study. For example, Figure 4 shows
that over 15% of those whose self-control score is in the bottom quartile drinks alcohol before they
turn 21, compared to only 10% from the top quartile. Those in the bottom quartile are also more
likely to screen positive for depression (11% in the bottom quartile versus 5% in the top quartile),
to have thoughts of self harm (0.9% versus 0.4%) and to commit offenses (2 per 10,000 soldiers
on a given day in the bottom quartile versus 1.3 in the top quartile). We observe similar patterns
when we examine pre-21 means of the outcomes by the distribution of coping ability (Figure 5)
and of baseline depression (Figure 6).
Differences in pre-21 outcomes are particularly noticeable between soldiers with and without a
family history of mental health problems or chemical dependencies. In particular, Figure 8 shows
that, before soldiers turned 21, those with a family history are more than 3 times more likely to
be screened positive for depression (5% among those without family history versus 18% among
those with family history of mental health problems of chemical dependency), more than 3 times
more likely to have suicidal thoughts (0.5% versus 1.7%) and to commit an offense (0.6 per 10,000
soldier days versus 2).
Along the AFQT dimension (Figure 7), those who are in the top quartile of the AFQT distribu-
tion are more likely to be drinking alcohol before turning 21 than those in the bottom quartile (11%
among bottom quartile versus 14% among top quartile). But those in the bottom quartile of AFQT
13

distribution are a bit more likely to have suicidal thoughts (1.1% versus 0.8%) or commit offense
(1.6 per 10,000 soldier on a given day versus 1.1). One thing to note is that across all 5 traits, we
generally do not see differences in physical outcomes (total fitness score and fit for deployment)
by the distribution of the trait.
These patterns are generally consistent with the descriptive findings in Marsden (2014), which
uses data from select years between 1980 to 2008 of the Department of Defense Surveys of Health
Related Behaviors Among Active Duty Military Personnel. For instance, in a multivariate logit
adjusting for demographics and other factors, they find that prevalence of suicide ideation is sig-
nificantly related to depression symptoms and avoidance coping. Marsden (2014) also find heavy
drinking is not significantly related to active coping.
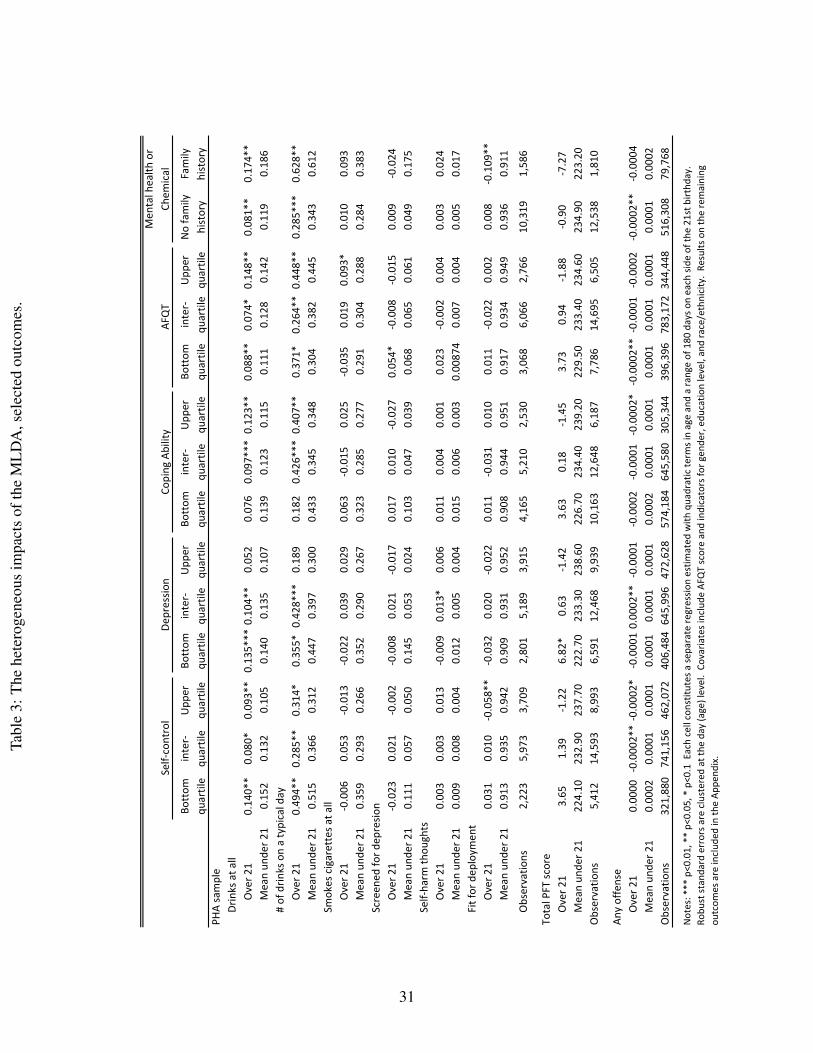
Table 3 report estimates of the causal impact of legal access to alcohol on selected outcomes
(the remaining outcomes are reported in Appendix Table 5 for efficiency). Each column represents
a separate RD model for that sub-sample of soldiers. For example, when we categorize soldiers
by their baseline depression score, the RD estimates show that those who score in the bottom
quartile of depression have larger response to MLDA (probability of drinking goes up by 0.13,
p<0.01) than those in the top quartile (probability of drinking goes up by 0.05, p>0.10). We also
observe larger responses among those with family history of mental health or chemical dependency
problems (RD estimates are 0.08 versus 0.17, both p<0.05). Interestingly, those with better coping
ability have larger responses to MLDA than those in the bottom quartile of coping (0.12, p<0.05
versus 0.076, p>0.1); and those in the top quartile of AFQT distribution also have larger response
to MLDA than those in the bottom quartile (0.148 versus 0.088, p<0.05 for both).
The stratified analysis on drinking outcomes suggest that MLDA mainly affects those with
better cognitive ability (better AFQT and coping skills)–soldiers who are likely to be workers
with better productivity to start with and are better equipped to cope with the stressful military
environment. As a result, we might not expect to see significant loss in worker job performance
when these soldiers gain legal access to alcohol.
Indeed, when we examine the non-drinking outcomes, we find no significant negative or posi-
tive impacts of turning 21. However, part of the null finding might be due to the low frequency of
the outcomes. For example, the RD estimates for suicidal thoughts is 0.003 (i.e., 0.3 percentage
point increase off a base rate of 0.6%) for those without family history and 0.024 (i.e., 2.4 percent-
age point increase off a base rate of 2.3%) for those with family history of mental health problems
or chemical dependency. Even though the magnitude of the estimate is fairly large in the practical
sense, the standard errors are also very large due to the fact that very few soldiers reported having
14
suicidal thoughts.
4.4 Validity of the RD and robustness of main results
One critical assumption for the RD to work in this context is that soldiers are not systematically
manipulating (sorting into) when they take the PHA, PFT, and GAT to either before or after their
21st birthday; and that alcohol consumption is indeed impacted upon gaining legal access after
one’s 21st birthday.
For all practical purpose, there is no reason to believe that soldiers would purposefully choose
to take either assessment before or after turning 21, since soldiers do not reap any benefit whether
the assessments were taken before or after their birthday. Empirically, Figure 1 shows the distri-
bution of ages across all our samples when the tests were taken, and there does not appear to be
bunching before or after the 21st birthday. These figures suggest soldiers are not manipulating
when they take the PHA, GAT, and fitness test around their 21st birthday, thus verifying the first
assumption for RD validity. The results discussed in Section 4.1 clearly demonstrates that the
second assumption holds as well.
To check whether our null findings are statistical artifacts of our modeling choices, Appendix
Tables 2, 3, and 4 report estimates of the impact of turning 21 on the PHA, PFT, GAT, and iPERMS
outcomes, respectively, across six different models: linear, quadratic, and cubic specifications of
g(D) with and without controls of X as discussed in the Methods section above. These tables
also report the F-statistic and the mean values of the outcomes. These tables verify (1) that the
quadratic model is a good representation of our data and (2) that the results are robust to the
inclusion or exclusion of the controls.
In addition to verifying the robustness of our results to the inclusion of soldiers’ characteris-
tics, we can also test whether these characteristics themselves vary across the age 21 threshold.
Specifically, soldiers just under and over 21 should have baseline characteristics that are the same
on average. Figures 1 showed that soldiers are not selectively sorting when they take mental and
physical health and fitness assessments relative to their 21st birthday. This time we would like to
verify whether E(X |D) is continuous through their 21st birthday, at D = 0. For instance, one may
worry that high cognitive ability soldiers disproportionately take the assessments after their 21st
birthday. To the extent that soldiers’ cognitive ability independently affect outcomes, this factor
could in principle confound our estimates of the treatment effect of legal access to alcohol.
Appendix Table 1 reports our results testing for smoothness in the observable characteristics
of soldiers across age 21. Across the 32 regressions we estimate (eight outcomes for each of the 4
databases), the discontinuity is not statistically distinguishable from zero at the 5% level in all cases
15
except for one. Note that similar to our analyses of multiple outcomes above, these critical values
are unadjusted for the problem of multiple comparisons, which can lead one to more rejections of
the null hypothesis when the null is in fact correct (Savin 1980).
In the case that is significant at the 5% level, we find higher share of women taking the PHA
at just over age 21 by 5.47 percentage points (but the gender imbalance is not found in the other 3
samples). To the extent that these discontinuities are real, an increase in the share of women at 21
would lead us to understate the effects of MLDA on alcohol consumption at 21, since women on
average drink less than men. Given that we do not find significant negative effects of MLDA on
other behavioral outcomes, we are not concerned about the gender imbalance across age 21.
5. ConclusionIn this paper, we estimate the impact of legal access to alcohol on a wide range of behavioral
and physical outcomes of young U.S. Army soldiers, and we explore whether these impacts vary
with risk factors for alcohol abuse.
Using data on all soldiers between 2009 and 2015, we observe a large and significant increase
in drinking after the 21st birthday overall, and the increases are largest amongst those who were
depressed, had a family history of mental health problems, had better coping ability, and had
higher cognitive ability. Despite the large increase in consumption, we do not find any meaningful
impacts of legal access to alcohol - overall or in any sub-group - on any of the short-term outcomes
we observe, including suicidal tendencies, depression, tobacco use, physical fitness, psychological
health, deployability, smoking, and job-related infractions.
How do our results add to the current knowledge of drinking behaviors in the military? Drink-
ing and use of tobacco products have long been part of the military culture (Oster et al., 2012).
Alcohol is even used by unit leaders as a way to build unit cohesion and reward the completion of
difficult tasks. As one USMC sergeant recounted in a New York Times Op-Ed of his experience,
beer consumption and underage drinking are common within the barracks even though alcohol is
prohibited inside the military compound (Brennan, 2012). Soldiers do know they will get punished
if they get caught drinking underage or drinking hard alcohol within the barracks. Thus, it makes
sense that using data from the military workplace, we find increases in alcohol have no meaning-
ful impact on soldiers’ physical and mental health and adverse behaviors, even as attaining legal
access increased their consumption.
While the null findings on this set of short-term outcomes are encouraging from a public health
viewpoint, and perhaps suggest that soldiers are drinking responsibly, more information is needed
16
to understand the full impact of alcohol consumption amongst service members; thus, our results
need to be interpreted carefully if they are to be used to inform public policy. For one, it must be
recognized that there could be medium- and long-run consequences of drinking that manifest over
time and that we can not observe through this RD design on the MLDA. And, we do not observe
important short-term outcomes such as injury or death, which have been shown to increase with
legal access (Carpenter and Dobkin, 2009). Finally, while young soldiers are broadly representative
of the high-school educated population, the restricted and controlled environment of the military
invalidate the extrapolation of our results to the civilian population of 21 year olds.
17
ReferencesArmy, US. 2012. “FM 7-22 Army Physical Readiness Training.” Washington, DC: Headquarters,
Department of the Army.
Bachman, Jerald G, Peter Freedman-Doan, Patrick M O’malley, Lloyd D Johnston, andDavid R Segal. 1999. “Changing patterns of drug use among US military recruits before andafter enlistment.” American Journal of Public Health, 89(5): 672–677.
Bray, Robert M., and Laurel L. Hourani. 2007. “Substance use trends among active duty mili-tary personnel: findings from the United States Department of Defense Health Related BehaviorSurveys, 1980–2005.” Addiction, 102(7): 1092–1101.
Bray, Robert M., Janice M. Brown, and Jason Williams. 2013. “Trends in Binge and HeavyDrinking, Alcohol-Related Problems, and Combat Exposure in the U.S. Military.” SubstanceUse & Misuse, 48(10): 799–810.
Brennan, Thomas James. 2012. “In the Military, the Drinking Can Start on Day 1.” New YorkTimes.
Carpenter, Christopher, and Carlos Dobkin. 2009. “The effect of alcohol consumption on mor-tality: regression discontinuity evidence from the minimum drinking age.” American EconomicJournal: Applied Economics, 1(1): 164–182.
Carpenter, Christopher, and Carlos Dobkin. 2011. “The minimum legal drinking age and publichealth.” The Journal of Economic Perspectives, 25(2): 133–156.
Carpenter, Christopher, and Carlos Dobkin. 2015. “The minimum legal drinking age andcrime.” Review of Economics and Statistics, 97(2): 521–524.
Carrell, Scott E, Mark Hoekstra, and James E West. 2011. “Does drinking impair college per-formance? Evidence from a regression discontinuity approach.” Journal of Public Economics,95(1): 54–62.
Crost, Benjamin, and Santiago Guerrero. 2012. “The effect of alcohol availability on marijuanause: Evidence from the minimum legal drinking age.” Journal of Health Economics, 31(1): 112–121.
Dee, Thomas S. 1999. “The complementarity of teen smoking and drinking.” Journal of HealthEconomics, 18(6): 769–793.
Fergusson, David M, Joseph M Boden, and L John Horwood. 2009. “Tests of causal linksbetween alcohol abuse or dependence and major depression.” Archives of General Psychiatry,66(3): 260–266.
Fogarty, Jennifer N, and Muriel Vogel-Sprott. 2002. “Cognitive processes and motor skills differin sensitivity to alcohol impairment.” Journal of Studies on Alcohol, 63(4): 404–411.
18

Fuehrlein, Brian S, Natalie Mota, Albert J Arias, Louis A Trevisan, Lorig K Kachadourian,John H Krystal, Steven M Southwick, and Robert H Pietrzak. 2016. “The burden of alco-hol use disorders in US military veterans: results from the National Health and Resilience inVeterans Study.” Addiction, 111(10): 1786–1794.
Heatherton, Todd F, Lynn T Kozlowski, Richard C Frecker, and Karl-Olov Fagerstrom. 1991.“The Fagerstrom test for nicotine dependence: a revision of the Fagerstrom Tolerance Question-naire.” British Journal of Addiction, 86(9): 1119–1127.
Jacobson, Isabel G, Margaret AK Ryan, Tomoko I Hooper, Tyler C Smith, Paul J Amoroso,Edward J Boyko, Gary D Gackstetter, Timothy S Wells, and Nicole S Bell. 2008. “Alco-hol use and alcohol-related problems before and after military combat deployment.” JAMA,300(6): 663–675.
LeardMann, Cynthia A, Teresa M Powell, Tyler C Smith, Michael R Bell, Besa Smith, Ed-ward J Boyko, Tomoko I Hooper, Gary D Gackstetter, Mark Ghamsary, and Charles WHoge. 2013. “Risk factors associated with suicide in current and former US military personnel.”JAMA, 310(5): 496–506.
Leskin, Gregory. 2015. “Preventing Substance Abuse in Military Members and Their Families.”Prevention Tactics, 9(14).
Lester, Paul B, Peter D Harms, Denise J Bulling, Mitchel N Herian, and Seth M Spain. 2011.“Evaluation of Relationships Between Reported Resilience and Soldier Outcomes. Report# 1:Negative Outcomes (Suicide, Drug Use, & Violent Crimes).” DTIC Document.
Lindo, Jason M, Isaac D Swensen, and Glen R Waddell. 2013. “Alcohol and student perfor-mance: Estimating the effect of legal access.” Journal of Health Economics, 32(1): 22–32.
Marsden, Robert M. Bray; Laurel L. Hourani; Jason Williams; Marian E. Lane; Mary Ellen.2014. Understanding Military Workforce Productivity: Effects of Substance Abuse, Health, andMental Health. Springer.
Oster, Maryjo, Emily Morden, Treatment Committee on Prevention, Diagnosis, Managementof Substance Use Disorders in the U. S. Armed Forces, Board on the Health of Select Pop-ulations, and Institute of Medicine. 2012. Substance Use Disorders in the U.S. Armed Forces.Washington, D.C.:National Academies Press.
Savin, Neil E. 1980. “The Bonferroni and the Scheffe multiple comparison procedures.” The Re-view of Economic Studies, 255–273.
Shen, Yu-Chu, Jeremy Arkes, and Thomas V Williams. 2012. “Effects of Iraq/Afghanistandeployments on major depression and substance use disorder: analysis of active duty personnelin the US military.” American Journal of Public Health, 102(S1): S80–S87.
Thompson, Martie P, and Kevin Swartout. 2017. “Epidemiology of suicide attempts amongyouth transitioning to adulthood.” Journal of Youth and Adolescence, 1–11.
19

Verdejo-Garcıa, Antonio, Andrew J Lawrence, and Luke Clark. 2008. “Impulsivity as avulnerability marker for substance-use disorders: review of findings from high-risk research,problem gamblers and genetic association studies.” Neuroscience & Biobehavioral Reviews,32(4): 777–810.
Vogel-Sprott, MD. 1979. “Acute recovery and tolerance to low doses of alcohol: differences incognitive and motor skill performance.” Psychopharmacology, 61(3): 287–291.
Wang, JianLi, and Scott B Patten. 2001. “Alcohol consumption and major depression: findingsfrom a follow-up study.” The Canadian Journal of Psychiatry, 46(7): 632–638.
Yoruk, Barıs K, and Ceren Ertan Yoruk. 2011. “The impact of minimum legal drinking age lawson alcohol consumption, smoking, and marijuana use: Evidence from a regression discontinuitydesign using exact date of birth.” Journal of Health Economics, 30(4): 740–752.
20

Figure 1: The distribution of the age of soldiers observed in our databases.
Notes: Datasets include all U.S. Army soldiers between the ages of 20.5 and 21.5 at any time between 2009 and2015. Every U.S. Army soldier is required to take the PHA and GAT once per year, and the PFT twice per year.
21

Figure 2: The impact of the MLDA on alcohol consumption amongst U.S. Army soldiers.
Notes: Data are self-reports from the Personal Health Assessments (PHA) of U.S. Army soldiers who were betweenthe ages of 20.5 and 21.5 at any time between 2009 and 2015. Circles indicate the daily averages. The solid lines areseparate fitted quadratic functions of age below and above age 21. See text for detailed definitions of the outcomes.
22

Figure 3: The impacts of the MLDA on selected mental health, physical fitness, and job perfor-mance outcomes.
Notes: Circles indicate the daily averages. The solid lines are separate fitted quadratic functions of age below andabove age 21. See text for definitions of the outcomes.
23
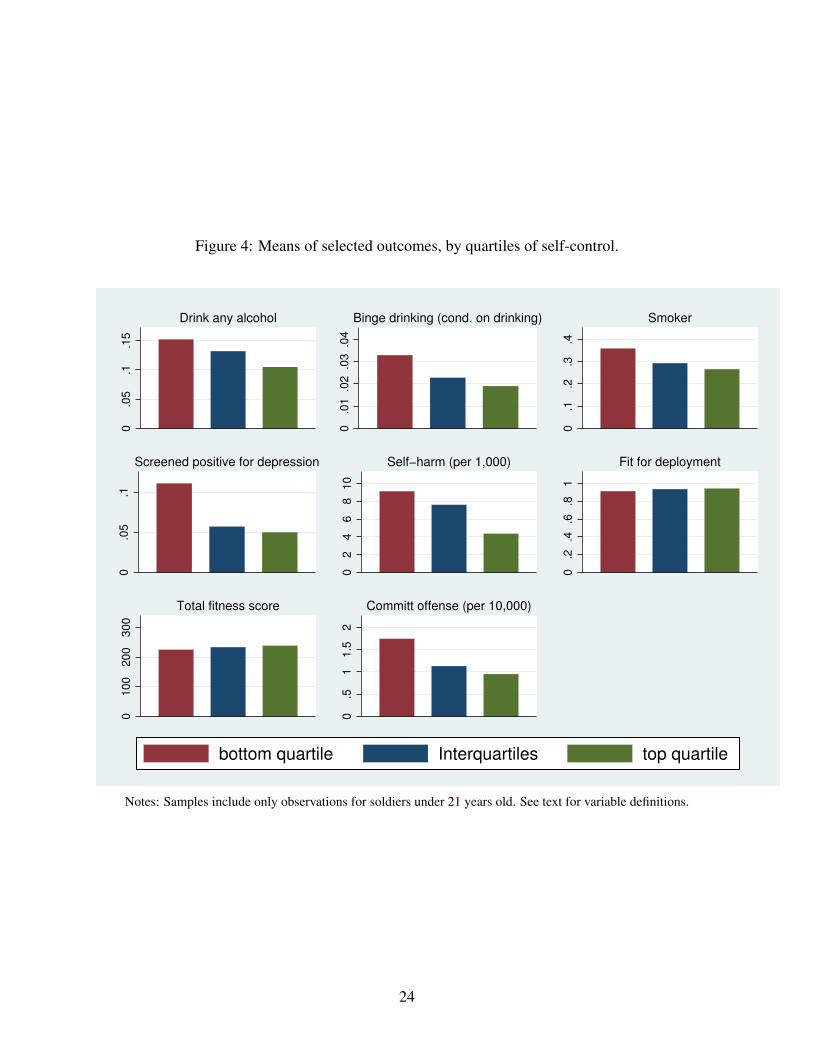
Figure 4: Means of selected outcomes, by quartiles of self-control.
0.0
5.1
.15
Drink any alcohol
0.0
1.0
2.0
3.0
4
Binge drinking (cond. on drinking)
0.1
.2.3
.4
Smoker
0.0
5.1
Screened positive for depression
02
46
81
0
Self−harm (per 1,000)
0.2
.4.6
.81
Fit for deployment
01
00
20
03
00
Total fitness score
0.5
11
.52
Committ offense (per 10,000)
bottom quartile Interquartiles top quartile
Notes: Samples include only observations for soldiers under 21 years old. See text for variable definitions.
24
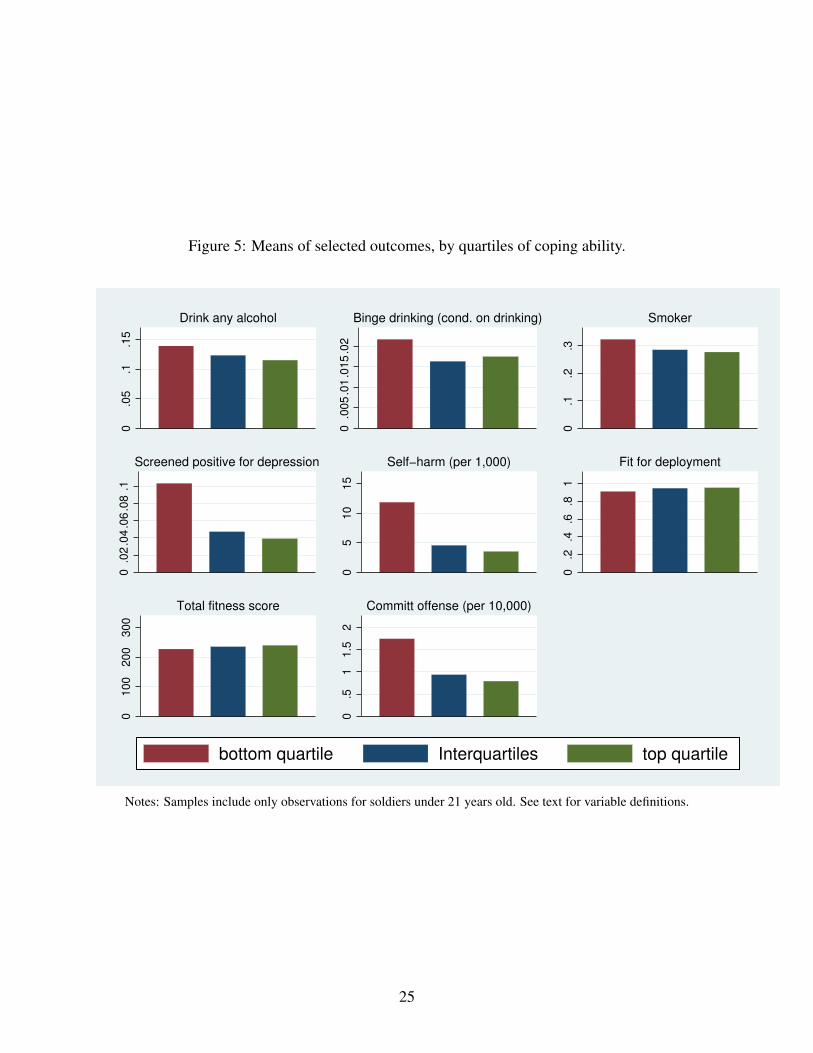
Figure 5: Means of selected outcomes, by quartiles of coping ability.
0.0
5.1
.15
Drink any alcohol
0.0
05
.01
.01
5.0
2
Binge drinking (cond. on drinking)
0.1
.2.3
Smoker
0.0
2.0
4.0
6.0
8.1
Screened positive for depression
05
10
15
Self−harm (per 1,000)
0.2
.4.6
.81
Fit for deployment
01
00
20
03
00
Total fitness score
0.5
11
.52
Committ offense (per 10,000)
bottom quartile Interquartiles top quartile
Notes: Samples include only observations for soldiers under 21 years old. See text for variable definitions.
25
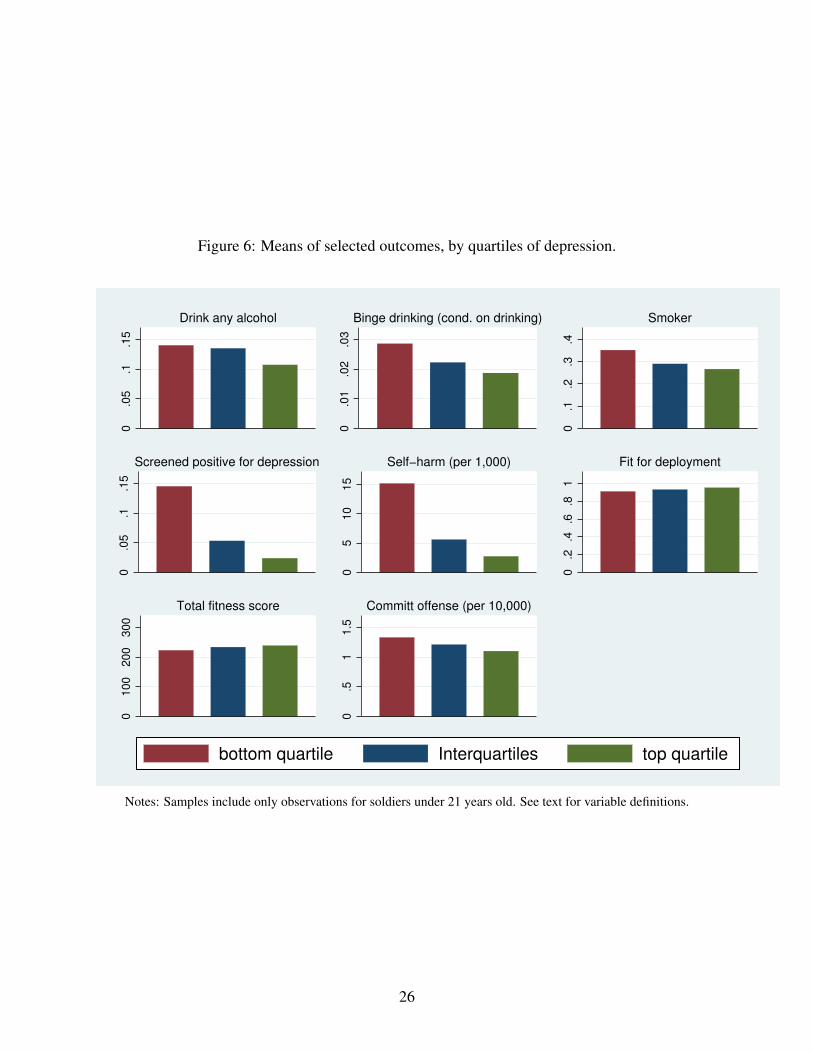
Figure 6: Means of selected outcomes, by quartiles of depression.
0.0
5.1
.15
Drink any alcohol
0.0
1.0
2.0
3
Binge drinking (cond. on drinking)
0.1
.2.3
.4
Smoker
0.0
5.1
.15
Screened positive for depression
05
10
15
Self−harm (per 1,000)
0.2
.4.6
.81
Fit for deployment
01
00
20
03
00
Total fitness score
0.5
11
.5
Committ offense (per 10,000)
bottom quartile Interquartiles top quartile
Notes: Samples include only observations for soldiers under 21 years old. See text for variable definitions.
26
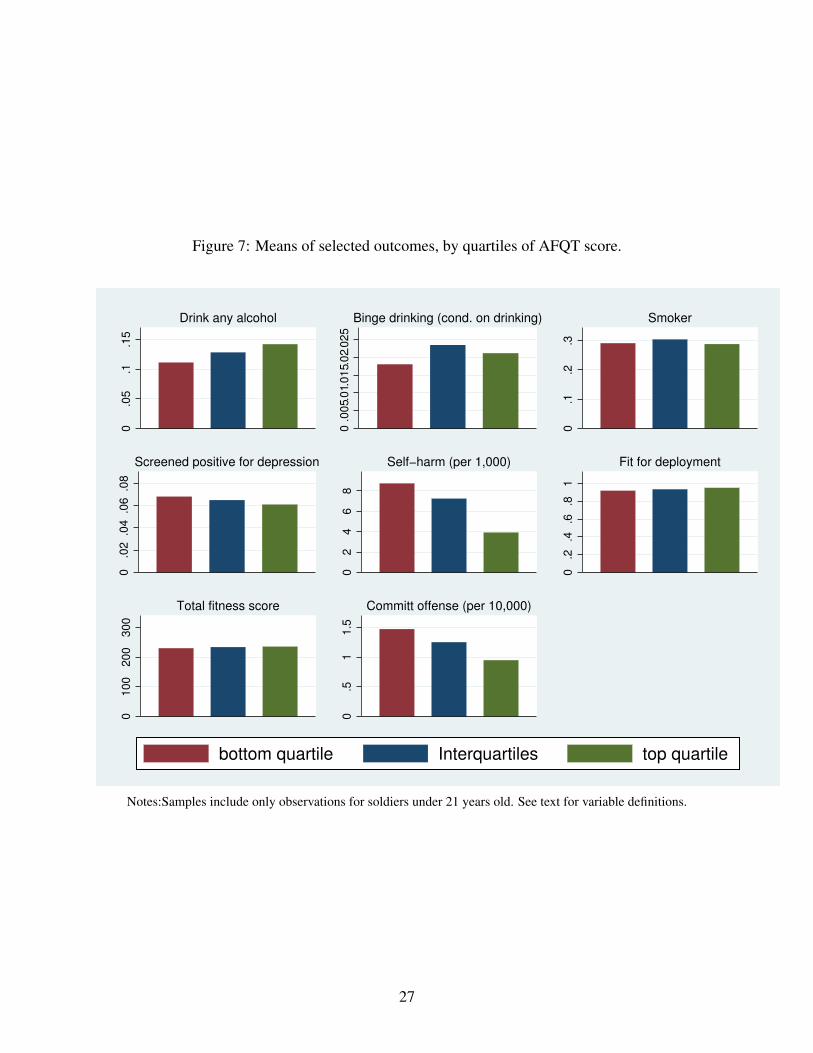
Figure 7: Means of selected outcomes, by quartiles of AFQT score.
0.0
5.1
.15
Drink any alcohol
0.0
05.
01.
01
5.0
2.0
25
Binge drinking (cond. on drinking)
0.1
.2.3
Smoker
0.0
2.0
4.0
6.0
8
Screened positive for depression
02
46
8
Self−harm (per 1,000)
0.2
.4.6
.81
Fit for deployment
01
00
20
03
00
Total fitness score
0.5
11
.5
Committ offense (per 10,000)
bottom quartile Interquartiles top quartile
Notes:Samples include only observations for soldiers under 21 years old. See text for variable definitions.
27

Figure 8: Means of selected outcomes, by any family history of mental health problems or chemicaldependency.
0.0
5.1
.15
.2
Drink any alcohol
0.0
1.0
2.0
3
Binge drinking (cond. on drinking)
0.1
.2.3
.4
Smoker
0.0
5.1
.15
.2
Screened positive for depression
05
10
15
20
Self−harm (per 1,000)
0.2
.4.6
.81
Fit for deployment
01
00
20
03
00
Total fitness score
0.5
11
.52
Committ offense (per 10,000)
no history has family history
Notes: Samples include only observations for soldiers under 21 years old. See text for variable definitions.
28

Table 1: Summary statistics of the population of soldiers aged 20.5 to 21.5 years old between 2009and 2015.
Mean s.d. Observations
Age 20.96 0.28 11,905Male 0.828 0.377 11,905Completedhighschool 0.987 0.115 11,905ArmedForcesQualifyingTest(AFQT)score 56.21 17.79 11,905White 0.60 0.49 11,905Black 0.219 0.413 11,905Asian 0.036 0.187 11,905Hispanic 0.136 0.343 11,905Otherrace 0.010 0.099 11,905
Notes:Sampleincludesallsoldiersbetween2009and2015thatwereobservedinthePHAatanytime180daysbeforeor180daysaftertheir21stbirthday.
29

Table 2: The impacts of the MLDA.
Outcome Over 21 (s.e.) Obs.Mean, under 21 sample
Personal Health Assessment (PHA) sampleDrinks at all 0.095*** (0.033) 11,905 0.127Proportion of drinking days 0.012** (0.005) 11,901 0.000# of alcoholic drinks on a typical drinking day 0.334*** (0.107) 11,903 0.376Proportion of binge-‐drinking days (6+ drinks per day) 0.001 (0.002) 11,905 0.003
Smokes cigarettes at all 0.022 (0.024) 11,905 0.297Moderate to heavy smoker 0.007 (0.014) 11,905 0.079Moderate to high nicotine dependency 0.000 (0.010) 11,905 0.041
Screened for depression 0.007 (0.013) 11,905 0.065Self-‐harm thoughts 0.006 (0.006) 11,905 0.001Fit for deployment -‐0.008 (0.016) 11,905 0.933
Global Assessment Tool (GAT) sampleCoping ability 0.025 (0.059) 15,321 3.92Self-‐control 0.044 (0.236) 15,321 26.06
Physical Fitness Test (PFT) sampleTotal PFT score 1.02 (1.59) 28,998 232.60Push-‐up score 0.38 (0.52) 28,998 83.74Sit-‐up score 0.09 (0.64) 28,998 79.592-‐mile run score 0.56 (0.87) 28,998 69.30
Non-‐Judicial and Judicial Punishment sampleAny offense -‐0.0001** (0.0001) 1,525,108 0.000123Level 1 offense (letter of reprimand) -‐0.0001*** (0.0000) 1,525,108 0.0000723Level 2 offense (Article 15 proceedings) 0.0000 (0.0000) 1,525,108 0.0000273Level 3 offense (court martial) 0.0000 (0.0000) 1,525,108 0.0000232
Notes: *** p<0.01, ** p<0.05, * p<0.1 Each row constitutes a separate regression estimated with quadratic terms in age and a range of 180 days on each side of the 21st birthday. Robust standard errors are clustered at the day (age) level. Covariates include AFQT score and indicators for gender, education level, and race/ethnicity.
30
Tabl
e3:
The
hete
roge
neou
sim
pact
sof
the
ML
DA
,sel
ecte
dou
tcom
es.
Bottom
qu
artile
inter-‐
quartile
Upp
er
quartile
Bottom
qu
artile
inter-‐
quartile
Upp
er
quartile
Bottom
qu
artile
inter-‐
quartile
Upp
er
quartile
Bottom
qu
artile
inter-‐
quartile
Upp
er
quartile
No family
history
Family
history
PHA sample
Drinks at a
llOver 2
10.14
0**
0.080*
0.09
3**
0.13
5***
0.10
4**
0.052
0.076
0.09
7***
0.12
3**
0.08
8**
0.074*
0.14
8**
0.08
1**
0.17
4**
Mean un
der 2
10.152
0.132
0.105
0.140
0.135
0.107
0.139
0.123
0.115
0.111
0.128
0.142
0.119
0.186
# of drin
ks on a typical day
Over 2
10.49
4**
0.28
5**
0.314*
0.355*
0.42
8***
0.189
0.182
0.42
6***
0.40
7**
0.371*
0.26
4**
0.44
8**
0.28
5***
0.62
8**
Mean un
der 2
10.515
0.366
0.312
0.447
0.397
0.300
0.433
0.345
0.348
0.304
0.382
0.445
0.343
0.612
Smokes cigarettes a
t all
Over 2
1-‐0.006
0.053
-‐0.013
-‐0.022
0.039
0.029
0.063
-‐0.015
0.025
-‐0.035
0.019
0.093*
0.010
0.093
Mean un
der 2
10.359
0.293
0.266
0.352
0.290
0.267
0.323
0.285
0.277
0.291
0.304
0.288
0.284
0.383
Screen
ed fo
r dep
resio
nOver 2
1-‐0.023
0.021
-‐0.002
-‐0.008
0.021
-‐0.017
0.017
0.010
-‐0.027
0.054*
-‐0.008
-‐0.015
0.009
-‐0.024
Mean un
der 2
10.111
0.057
0.050
0.145
0.053
0.024
0.103
0.047
0.039
0.068
0.065
0.061
0.049
0.175
Self-‐harm
thou
ghts
Over 2
10.003
0.003
0.013
-‐0.009
0.013*
0.006
0.011
0.004
0.001
0.023
-‐0.002
0.004
0.003
0.024
Mean un
der 2
10.009
0.008
0.004
0.012
0.005
0.004
0.015
0.006
0.003
0.00874
0.007
0.004
0.005
0.017
Fit for dep
loym
ent
Over 2
10.031
0.010
-‐0.058
**-‐0.032
0.020
-‐0.022
0.011
-‐0.031
0.010
0.011
-‐0.022
0.002
0.008
-‐0.109
**Mean un
der 2
10.913
0.935
0.942
0.909
0.931
0.952
0.908
0.944
0.951
0.917
0.934
0.949
0.936
0.911
Observatio
ns2,223
5,973
3,709
2,801
5,189
3,915
4,165
5,210
2,530
3,068
6,066
2,766
10,319
1,586
Total PFT sc
ore
Over 2
13.65
1.39
-‐1.22
6.82*
0.63
-‐1.42
3.63
0.18
-‐1.45
3.73
0.94
-‐1.88
-‐0.90
-‐7.27
Mean un
der 2
1224.10
232.90
237.70
222.70
233.30
238.60
226.70
234.40
239.20
229.50
233.40
234.60
234.90
223.20
Observatio
ns5,412
14,593
8,993
6,591
12,468
9,939
10,163
12,648
6,187
7,786
14,695
6,505
12,538
1,810
Any offense
Over 2
10.0000
-‐0.000
2**-‐0.000
2*-‐0.000
1-‐0.00
02***-‐0.00
01-‐0.000
2-‐0.000
1-‐0.000
2*-‐0.000
2**-‐0.000
1-‐0.000
2-‐0.000
2**
-‐0.000
4Mean un
der 2
10.0002
0.0001
0.0001
0.0001
0.0001
0.0001
0.0002
0.0001
0.0001
0.0001
0.0001
0.0001
0.0001
0.0002
Observatio
ns321,880
741,156
462,072
406,484
645,996
472,628
574,184
645,580
305,344
396,396
783,172
344,448
516,308
79,768
Notes: *** p<0.01, ** p<
0.05
, * p<0.1 Each cell constitutes a se
parate re
gressio
n estim
ated
with
quadratic te
rms in age and a range of 180
days o
n each side
of the
21st b
irthd
ay.
Robu
st standard errors a
re clustered
at the
day (age) level. Co
varia
tes include
AFQ
T score and indicators fo
r gen
der, ed
ucation level, and race/ethnicity. Re
sults on the remaining
outcom
es are includ
ed in th
e Ap
pend
ix.
Self-‐control
Depressio
nCo
ping Ability
AFQT
Men
tal health
or
Chem
ical
31

Appendix Table 1: Tests of the balance of covariates across the MLDA discontinuity.
Outcome Over21 (s.e.) Obs.Mean,under21sample
PersonalHealthAssessment(PHA)sampleFemale 0.055*** (0.020) 11,905 0.159AFQTscore 0.347 (0.826) 11,905 56.250HighSchoolonly 0.000 (0.006) 11,905 0.985Completedcollege -0.001 (0.005) 11,905 0.011Black -0.017 (0.022) 11,905 0.212Hispanic -0.020 (0.015) 11,905 0.139Asian 0.001 (0.009) 11,905 0.038Otherrace 0.004 (0.006) 11,905 0.010
PhysicalFitnessTest(PFT)sampleFemale -0.005 (0.010) 28,998 0.137AFQTscore -0.225 (0.654) 28,998 55.470HighSchoolonly 0.002 (0.004) 28,998 0.988Completedcollege -0.003 (0.003) 28,998 0.009Black -0.023* (0.013) 28,998 0.216Hispanic 0.007 (0.012) 28,998 0.136Asian 0.011* (0.006) 28,998 0.036Otherrace 0.002 (0.004) 28,998 0.010
GlobalAssessmentTool(GAT)sampleFemale -0.017 (0.015) 15,321 0.159AFQTscore 0.307 (0.764) 15,321 55.860HighSchoolonly 0.000 (0.005) 15,321 0.985Completedcollege -0.002 (0.004) 15,321 0.012Black -0.021 (0.015) 15,321 0.201Hispanic -0.014 (0.014) 15,321 0.127Asian 0.005 (0.008) 15,321 0.033Otherrace 0.002 (0.004) 15,321 0.010
Non-JudicialandJudicialPunishmentsampleFemale 0.000 (0.000) 1,530,000 0.161AFQTscore 0.000 (0.000) 1,530,000 55.110HighSchoolonly 0.000 (0.000) 1,530,000 0.984Completedcollege 0.000 (0.000) 1,530,000 0.011Black 0.000 (0.000) 1,530,000 0.198Hispanic 0.000 (0.000) 1,530,000 0.128Asian 0.000 (0.000) 1,530,000 0.032Otherrace 0.000 (0.000) 1,530,000 0.011
Notes:***p<0.01,**p<0.05,*p<0.1Eachrowconstitutesaseparateregressionestimatedwithquadratictermsinageandarangeof180daysoneachsideofthe21stbirthday.Robuststandarderrorsareclusteredattheday(age)level.CovariatesincludeAFQTscoreandindicatorsforgender,educationlevel,andrace/ethnicity.
32

Appendix Table 2: Robustness of the RD estimates, PHA sample outcomes.
Orderofpolynomialinage 1 2 3 1 2 3Covariates? No No No Yes Yes YesDrinksatallOver21 0.296*** 0.095*** -0.093** 0.297*** 0.098*** -0.087**[s.e] [0.030] [0.033] [0.031] [0.030] [0.033] [0.031]p-value 1.00 1.00 0.91 1.00 0.98 0.00
ProportionofdrinkingdaysOver21 0.042*** 0.012** -0.014 0.043*** 0.013** -0.012**[s.e] [0.005] [0.005] [0.005] [0.005] [0.005] [0.005]p-value 1.00 0.99 0.70 1.00 0.19 0.00
#ofdrinksonatypicaldrinkingdayOver21 0.835*** 0.334*** -0.212** 0.847*** 0.356*** -0.173*[s.e] [0.096] [0.107] [0.103] [0.095] [0.106] [0.104]p-value 1.00 1.00 1.00 0.97 0.00 0.00
Proportionofbinge-drinkingdaysOver21 0.007*** 0.001 -0.003 0.007*** 0.002 -0.002[s.e] [0.001] [0.002] [0.002] [0.001] [0.002] [0.002]p-value 0.76 0.44 0.31 0.12 0.02 0.01
SmokescigarettesatallOver21 0.021 0.022 0.004 0.023 0.026 0.014[s.e] [0.016] [0.024] [0.033] [0.016] [0.024] [0.032]p-value 0.27 0.28 0.26 0.00 0.00 0.00
ModeratetoheavysmokerOver21 0.011 0.007 0.000 0.012 0.006 0.002[s.e] [0.009] [0.014] [0.018] [0.009] [0.014] [0.018]p-value 0.38 0.41 0.43 0.00 0.00 0.00
Moderate/highnictoinedependencyOver21 -0.001 0.000 -0.007 -0.001 -0.001 -0.006[s.e] [0.007] [0.010] [0.014] [0.007] [0.010] [0.014]p-value 0.38 0.41 0.43 0.00 0.00 0.00
ScreenedfordepressionOver21 -0.004 0.007 -0.009 -0.006 0.004 -0.012[s.e] [0.009] [0.013] [0.016] [0.009] [0.013] [0.016]p-value 0.71 0.71 0.70 0.25 0.25 0.24
Self-harmthoughtsOver21 0.002 0.006 0.009 0.002 0.006 0.008[s.e] [0.004] [0.006] [0.008] [0.004] [0.006] [0.008]p-value 0.82 0.82 0.81 0.78 0.79 0.78
FitfordeploymentOver21 -0.009 -0.008 0.000 -0.003 0.004 0.017[s.e] [0.011] [0.016] [0.022] [0.011] [0.016] [0.021]p-value 0.69 0.69 0.67 0.00 0.00 0.00
Observations 11,905 11,905 11,905 11,905 11,905 11,905
Notes:***p<0.01,**p<0.05,*p<0.1Eachrowconstitutesaseparateregressionestimatedwithquadratictermsinageandarangeof180daysoneachsideofthe21stbirthday.Robuststandarderrorsareclusteredattheday(age)level.Thep-valueisfromatestofwhetherthenon-parametricmodelisequaltotheparametricmodel;seetextfordetails.CovariatesincludeAFQTscoreandindicatorsforgender,educationlevel,andrace/ethnicity.
33

Appendix Table 3: Robustness of the RD estimates, GAT and PFT samples outcomes.
Orderofpolynomialinage 1 2 3 1 2 3
Covariates? No No No Yes Yes Yes
GlobalAssessmentTool(GAT)sampleCopingability
Over21 -0.048 0.025 -0.068 -0.050 0.024 -0.073
[s.e] [0.039] [0.059] [0.076] [0.039] [0.059] [0.076]
p-value 0.80 0.79 0.78 0.03 0.02 0.02
Self-control
Over21 0.0396 0.0441 -0.1311 0.0186 0.0137 -0.1792
[s.e] [0.165] [0.236] [0.318] [0.166] [0.238] [0.323]
p-value 0.85 0.85 0.86 0.03 0.03 0.03
Observations 15,321 15,321 15,321 15,315 15,315 15,315
PhysicalFitnessTest(PFT)sampleTotalPFTscore
Over21 2.20** 1.02 1.37 2.11** 0.94 1.28
[s.e] [1.06] [1.59] [2.02] [1.06] [1.60] [2.04]
p-value 0.63 0.53 0.50 0.00 0.00 0.00
Push-upscore
Over21 0.64* 0.38 0.59 0.61* 0.33 0.53
[s.e] [0.35] [0.52] [0.65] [0.35] [0.52] [0.65]
p-value 0.91 0.88 0.86 0.00 0.00 0.00
Sit-upscore
Over21 0.77* 0.09 0.47 0.75* 0.09 0.45
[s.e] [0.42] [0.64] [0.86] [0.41] [0.64] [0.86]
p-value 0.97 0.96 0.96 0.85 0.90 0.93
2-milerunscore
Over21 0.79 0.56 0.31 0.75 0.52 0.29
[s.e] [0.57] [0.87] [1.11] [0.57] [0.87] [1.11]
p-value 0.43 0.37 0.36 0.00 0.00 0.00
Observations 28,998 28,998 28,998 28,986 28,986 28,986
Notes:***p<0.01,**p<0.05,*p<0.1Eachrowconstitutesaseparateregressionestimatedwithquadratictermsinageanda
rangeof180daysoneachsideofthe21stbirthday.Robuststandarderrorsareclusteredattheday(age)level.Covariates
includeAFQTscoreandindicatorsforgender,educationlevel,andrace/ethnicity.
34

Appendix Table 4: Robustness of the RD estimates, IPERMS sample outcomes.
Orderofpolynomialinage 1 2 3 1 2 3Covariates? No No No Yes Yes YesNon-JudicialandJudicialPunishmentsampleAnyoffenseOver21 0.0000 -0.0001** -0.0001 0.0000 -0.0001** -0.0001[s.e] [0.0000] [0.0001] [0.0001] [0.0000] [0.0001] [0.0001]p-value 0.99 0.90 0.59 0.78 0.14 0.00
Level1offense(letterofreprimand)Over21 0.0000 -0.0001*** -0.0001** 0.0000 -0.0001** -0.0001**[s.e] [0.0000] [0.0000] [0.0000] [0.0000] [0.0000] [0.0000]p-value 0.90 0.62 0.15 0.57 0.13 0.00
Level2offense(Article15proceedings)Over21 0.0000 0.0000 0.0000 0.0000 0.0000 0.0000[s.e] [0.0000] [0.0000] [0.0000] [0.0000] [0.0000] [0.0000]p-value 0.46 0.42 0.50 0.52 0.48 0.52
Level3offense(courtmartial)Over21 0.0000* 0.0000 0.0000 0.0000* 0.0000 0.0000[s.e] [0.0000] [0.0000] [0.0000] [0.0000] [0.0000] [0.0000]p-value 0.46 0.40 0.36 0.05 0.03 0.02
Observations 1,525,108 1,525,108 1,525,108 1,524,016 1,524,016 1,524,015
Notes:***p<0.01,**p<0.05,*p<0.1Eachrowconstitutesaseparateregressionestimatedwithquadratictermsinageandarangeof180daysoneachsideofthe21stbirthday.Robuststandarderrorsareclusteredattheday(age)level.CovaritaesincludeAFQTscoreandindicatorsforgender,educationlevel,andrace/ethnicity.
35

App
endi
xTa
ble
5:T
hehe
tero
gene
ous
impa
cts
ofth
eM
LD
A,f
urth
erou
tcom
es.
Bottom
quartile
inter-
quartile
Upper
quartile
Bottom
quartile
inter-
quartile
Upper
quartile
Bottom
quartile
inter-
quartile
Upper
quartile
Bottom
quartile
inter-
quartile
Upper
quartile
Nofamily
history
Family
history
PHAsample
Proportionofdrinkingdays
Over21
0.007
0.011*
0.015**
0.018*
0.017**
0.001
0.009
0.012**
0.015*
0.022***
0.008
0.009
0.012**
0.014
Meanunder21
0.019
0.013
0.010
0.016
0.014
0.009
0.015
0.012
0.011
0.011
0.013
0.015
0.012
0.023
Bingedrinkingdays
Over21
-0.005
0.001
0.006*
-0.001
0.003
0.001
0.002
0.000
0.002
0.004
0.000
0.001
0.002
-0.001
Meanunder21
0.005
0.003
0.002
0.004
0.003
0.002
0.003
0.002
0.002
0.002
0.003
0.003
0.002
0.005
Moderate/heavysmoker
Over21
0.008
-0.002
0.017
0.013
0.003
0.002
0.026
-0.010
0.004
0.018
0.002
0.002
0.002
0.030
Meanunder21
0.123
0.072
0.065
0.115
0.073
0.062
0.097
0.072
0.065
0.061
0.085
0.086
0.072
0.130
Moderate/highnictoinedependency
Over21
0.022
-0.019
0.015
0.004
0.001
-0.010
0.019
-0.012
-0.014
0.010
0.003
-0.018
-0.001
0.003
Meanunder21
0.070
0.040
0.027
0.069
0.038
0.026
0.062
0.031
0.029
0.036
0.042
0.046
0.037
0.073
Observations
2,223
5,973
3,709
2,801
5,189
3,915
4,165
5,210
2,530
3,068
6,066
2,766
10,319
1,586
PFTsample
Push-upscore
Over21
1.53
0.80
-0.98
3.18***
0.21
-0.99
1.97**
-0.20
-0.10
1.71
-0.03
-0.41
0.14
-3.13
Meanunder21
81.41
83.64
85A
80.96
83.81
85.56
81.90
84.31
85.73
83.50
84.16
83.07
84.38
81.51
Sit-upscore
Over21
0.83
0.47
-1.02
1.83
-0.69
0.12
0.39
-0.02
-0.16
0.74
0.70
-1.93
0.19
-2.16
Meanunder21
77.28
79.47
81.28
76.91
79.86
81.10
78.03
80.02
81.39
78.45
79.64
80.89
79.82
76.67
2-m
ilerunscore
Over21
1.28
0.12
0.78
1.80
1.10
-0.55
1.27
0.39
-0.26
1.27
0.27
0.46
-1.22
-1.98
Meanunder21
65.40
69.76
71.03
64.86
69.63
71.92
66.74
70.05
72.11
67.58
69.64
70.63
70.72
65.06
Observations
5,412
14,593
8,993
6,591
12,468
9,939
10,163
12,648
6,187
7,786
14,695
6,505
12,538
1,810
NJPsample
Level1offense(letterofreprimand)
Over21
0.0002*
-0.0001*
-0.0001
0.0002***-0.0001**0.0000
-0.0002***-0.0001
-0.0001
-0.0002**-0.00010.0002**
-0.0001*
0.0005*
Meanunder21
0.0001
0.0001
0.0001
0.0001
0.0001
0.0001
0.0001
0.0000
0.0000
0.0001
0.0001
0.0001
0.0000
0.0001
Level2offense(Article15proceedings)
Over21
0.0001
-0.0001
0.0000
0.0000
-0.0001
0.0000
0.0000
0.0000
-0.0000*
0.0000
0.0000
0.0000
-0.0001*
0.0001
Meanunder21
0.0000
0.0000
0.0000
0.0000
0.0000
0.0000
0.0000
0.0000
0.0000
0.0000
0.0000
0.0000
0.0000
0.0001
Level3offense(courtm
artial)
Over21
0.0001
0.0000
0.0000
0.0001
0.0000
0.0000
0.0401
0.0000
0.0000
0.0000
0.0000
0.0000
0.0000
0.0000
Meanunder21
0.0001
0.0000
0.0000
0.0000
0.0000
0.0000
0.0000
0.0000
0.0000
0.0000
0.0000
0.0000
0.0000
0.0000
Observations
321,880
741,156
462,072
406,484
645,996
472,628
574,184
645,580
305,344
396,396
783,172
344,448
516,308
79,768
Notes:***p<0.01,**p<0.05,*p<0.1Eachcellconstitutesaseparateregressionestim
atedwithquadraticterm
sinageandarangeof180daysoneachsideofthe21stbirthday.Robust
standarderrorsareclusteredattheday(age)level.CovaritaesincludeAFQTscoreandindicatorsforgender,educationlevel,andrace/ethnicity.
Self-control
Depression
CopingAbility
AFQT
Mentalhealthor
Chemical
36