The impact of adjusting PMT voltages on spillover and ...web.mit.edu/flowcytometry/www/Cytometry...
14
Cytometry tutorial: The impact of adjusting PMT voltages on spillover and compensation Thomas Myles Ashhurst 1,2,3 , Adrian Lloyd Smith 3,4 1 Viral Immunopathology Laboratory, Discipline of Pathology, Sydney Medical School, The University of Sydney 2 Marie Bashir Institute for Infectious Disease and Biosecurity (MBI), The University of Sydney 3 Ramaciotti Facility for Human Systems Biology (RFHSB), The Centenary Institute and The University of Sydney) 4 Sydney Cytometry Facility, The Centenary Institute and The University of Sydney) Contact: [email protected], [email protected]
Transcript of The impact of adjusting PMT voltages on spillover and ...web.mit.edu/flowcytometry/www/Cytometry...

Cytometry tutorial: The impact of adjusting PMT voltages on spillover and compensation
Thomas Myles Ashhurst1,2,3, Adrian Lloyd Smith3,4
1Viral Immunopathology Laboratory, Discipline of Pathology, Sydney Medical School, The University of Sydney
2Marie Bashir Institute for Infectious Disease and Biosecurity (MBI), The University of Sydney
3Ramaciotti Facility for Human Systems Biology (RFHSB), The Centenary Institute and The University of Sydney)4Sydney Cytometry Facility, The Centenary Institute and The University of Sydney)
Contact: [email protected], [email protected]

Misconception: “I need to adjust my voltage to lower the compensation required between two overlapping fluorophores.”
Voltage adjustment to reduce spillover?
Case study • My APC comp bead (A) spills into the APC/Cy7 detector
(R780) (B) • The compensation value is 64.5% (B) • My supervisor thinks this is too high and wants me to
reduce the compensation value by lowering the voltage of R780
• If I reduce the voltage from 800V to 700V or 600V I can reduce the compensation value • from 64.5% (high) (B) • to 24.6 (medium) (C) • or 7.78% (low) (D)
R780: 800 V COMP: 64.5%
R780: 700 V COMP: 24.6%
R780: 600 V COMP: 7.78%
B
C
D
A

Refresher: what is compensation?
Compensation is “correcting” fluorescence spillover
0% 2% 5% 10% 16.9% 17.5%
Compensation value (extracting PE from the PECF594 (YG610) detector): 6,824 / 40,362 x 100
= 16.9%
This compensation value is dependent on voltages
Comp(YG610) = Measure(YG610) - %Measure(YG582)
40,362
6,824
PE+ comp bead
Correct compensation: Median Fluorescence Intensity (MFI) of PE+ and PE- beads in the PECF594 (YG610) detector are equal
Over-compensated
Targ
et d
etec
tor (
YG58
2)
Non-target detector (YG610)Why is this spreading?

A+B+ cellsA+B- cells
A-B+ cellsPe
rCP/
Cy5
.5 a
nti-A
BV650 anti-B
PerC
P/C
y5.5
ant
i-A
BV711 anti-B
A-B+ cells
A+B+ cellsA+B- cells
Diagrammatic example: • PerCP/Cy5.5 (with marker “A”) spreads into the BV711 and BV650 detectors, leading to a loss of resolution in both. • Figure 1: BV711 is bright enough, and marker “B” is expressed highly enough that A+B+ cells can be resolved from A+B- cells. • Figure 2: However, BV650 is not bright enough to resolve A+B+ cells from A+B- cells.
What is spreading error?
Figure 1: resolvable Figure 2: not resolvable
Spreading error is what causes problems for resolving true positive populations due to spreading of the negative population.
The process of correct compensation reveals (not creates) measurement error, known as spreading error (SE)
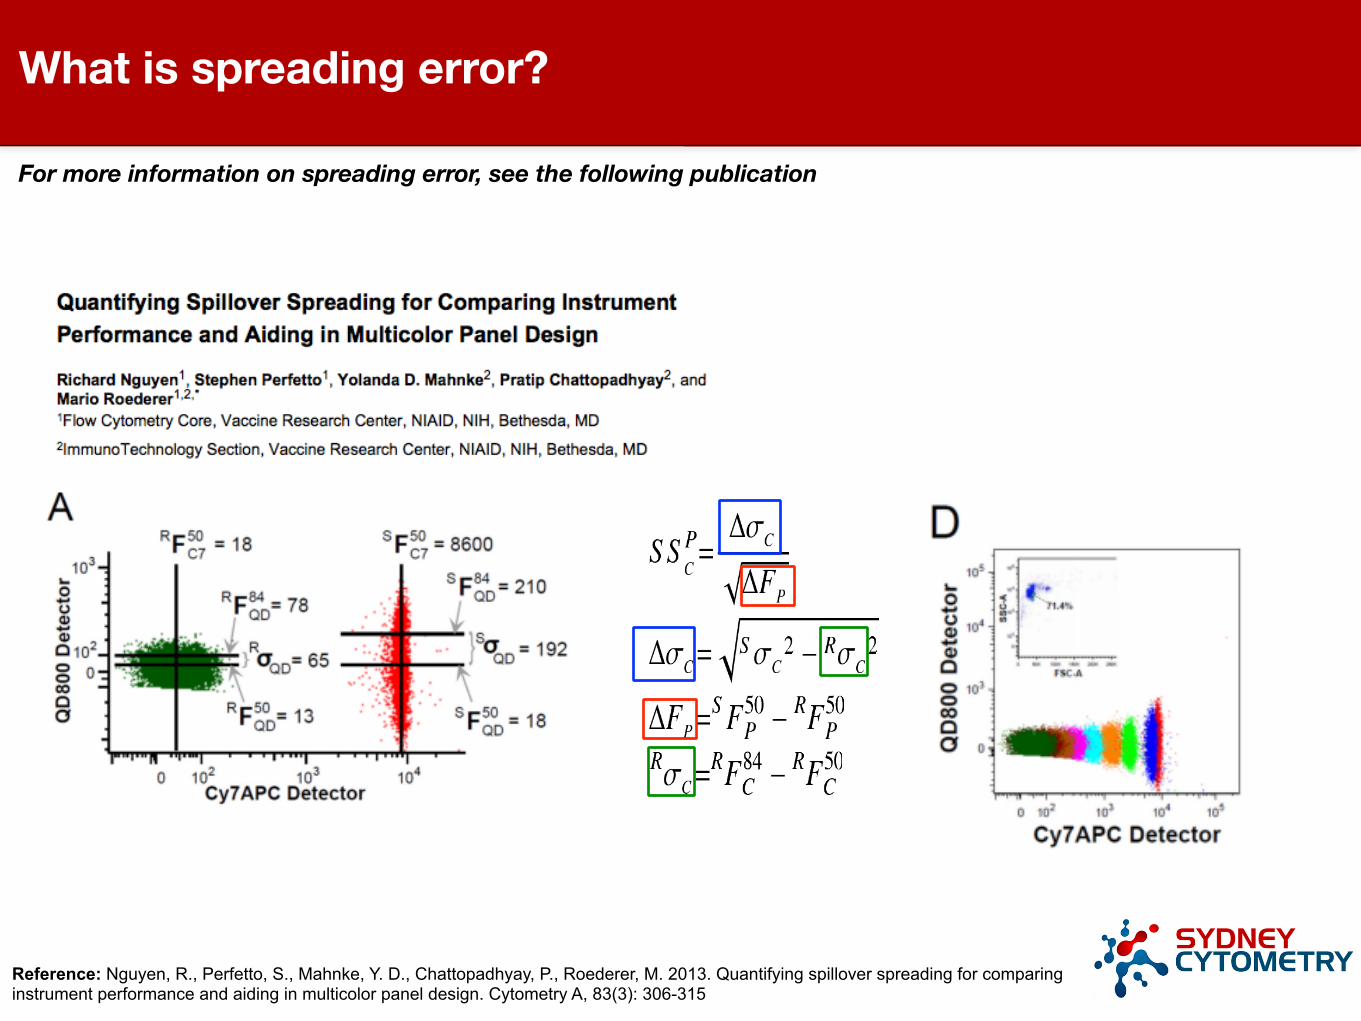
What is spreading error?
For more information on spreading error, see the following publication
Reference: Nguyen, R., Perfetto, S., Mahnke, Y. D., Chattopadhyay, P., Roederer, M. 2013. Quantifying spillover spreading for comparing instrument performance and aiding in multicolor panel design. Cytometry A, 83(3): 306-315

What is spreading error?
The process of correct compensation reveals (not creates) measurement error, known as spreading error (SE)
Unc
ompe
nsat
edC
ompe
nsat
ed
Low SE Medium SE High SE
SE: 1.93 SE: 6.68 SE: 11.60
COMP: ~8% COMP: ~71.43% COMP: ~57.14%
PE+ beads BV711+ beads BV711+ beadsExample: • Higher compensation values tend to
correlate with higher spreading error values (i.e. more spillover, more the measurement error will spread)
• However, higher compensation values cannot predict higher spreading error values
Example: • BV711 into BV785 detector
• Comp = 71.43% • SE = 6.68
• BV711 into AF700 detector • Comp = 57.14% • SE = 11.60
Despite the higher compensation value, the SE is lower

Detector voltages
CS&T beads (neg, dim, and bright) run at various voltages
What happens when we adjust the voltages for a given detector
CS&T beads Negative bead Dim bead Bright bead
Electronic noise rSD: 53.7
• Each detector uses a photomultiplier (PMT) that amplifies any signal picked up in that detector. The voltage applied dictates the level of amplification
• At a specific voltage (~600 volts for the FITC detector in this example), fluorescence signal is a) detectible above background, and b) is consistently and proportionately separated
• Voltages above this value do not increase the separation of signal (A) (including dim-neg, dim-bright, bright-neg)• Voltages below this value compromise the detection of low-end (dim) signal (B)• This is true of any signal (target fluorophore or spillover fluorophore) appearing in the detector
FITC detector
Sepa
rati
on r
atio
D
im b
ead:
nega
tive
bea
d Separation ratio Bright bead:negative bead
A
B
‘Voltage scan’ approach to determine minimum voltage: Perfetto, S. P., Ambrozak, D., Nguyen, R., Chattopadhyay, P. K., & Roederer, M. (2012). Quality assurance for polychromatic flow cytometry using a
suite of calibration beads, 7(12), 2067–2079. doi:10.1038/nprot.2012.126i

Let’s take a look at the performance of the APC/Cy7 detector (R780)
• The minimum voltage required for optimal separation of signal from noise is between 500-550 volts• Voltages above the minimum for separation (550 volts) do not increase the separation of signal (A)• Voltages below the minimum for separation (550 volts) compromise the detection of low-end (dim) signal (B)• The separation of bright from dim signal occurs at lower voltages (~350 volts)• This is true of any signal (target fluorophore or spillover fluorophore) appearing in the R780 detector
• COMP beads were recorded, where the R780 voltage was increased in 50V increments from 350 V up to 800 V
• At a specific voltage (550 volts in this case), fluorescence signal is • a) detectible above background, and • b) is consistently separated for any voltages above
this• This is clearly seen with the APC/Cy7 comp bead in
the R780 detector• However, this is also true of contaminating signals,
such as the uncompensated APC comp bead in the R780 detector
APC/Cy7 and APC in the R780 detector
550 volts
550 volts
A
B
A
B
• In this case lowering the voltage below 500-550 volts would result in the loss of dim APC/Cy7 signal
‘Voltage scan’ approach to determine minimum voltage: Perfetto, S. P., Ambrozak, D., Nguyen, R., Chattopadhyay, P. K., & Roederer, M. (2012). Quality assurance for polychromatic flow cytometry using a
suite of calibration beads, 7(12), 2067–2079. doi:10.1038/nprot.2012.126i
550 V 4.06%
Fixed
Fixed
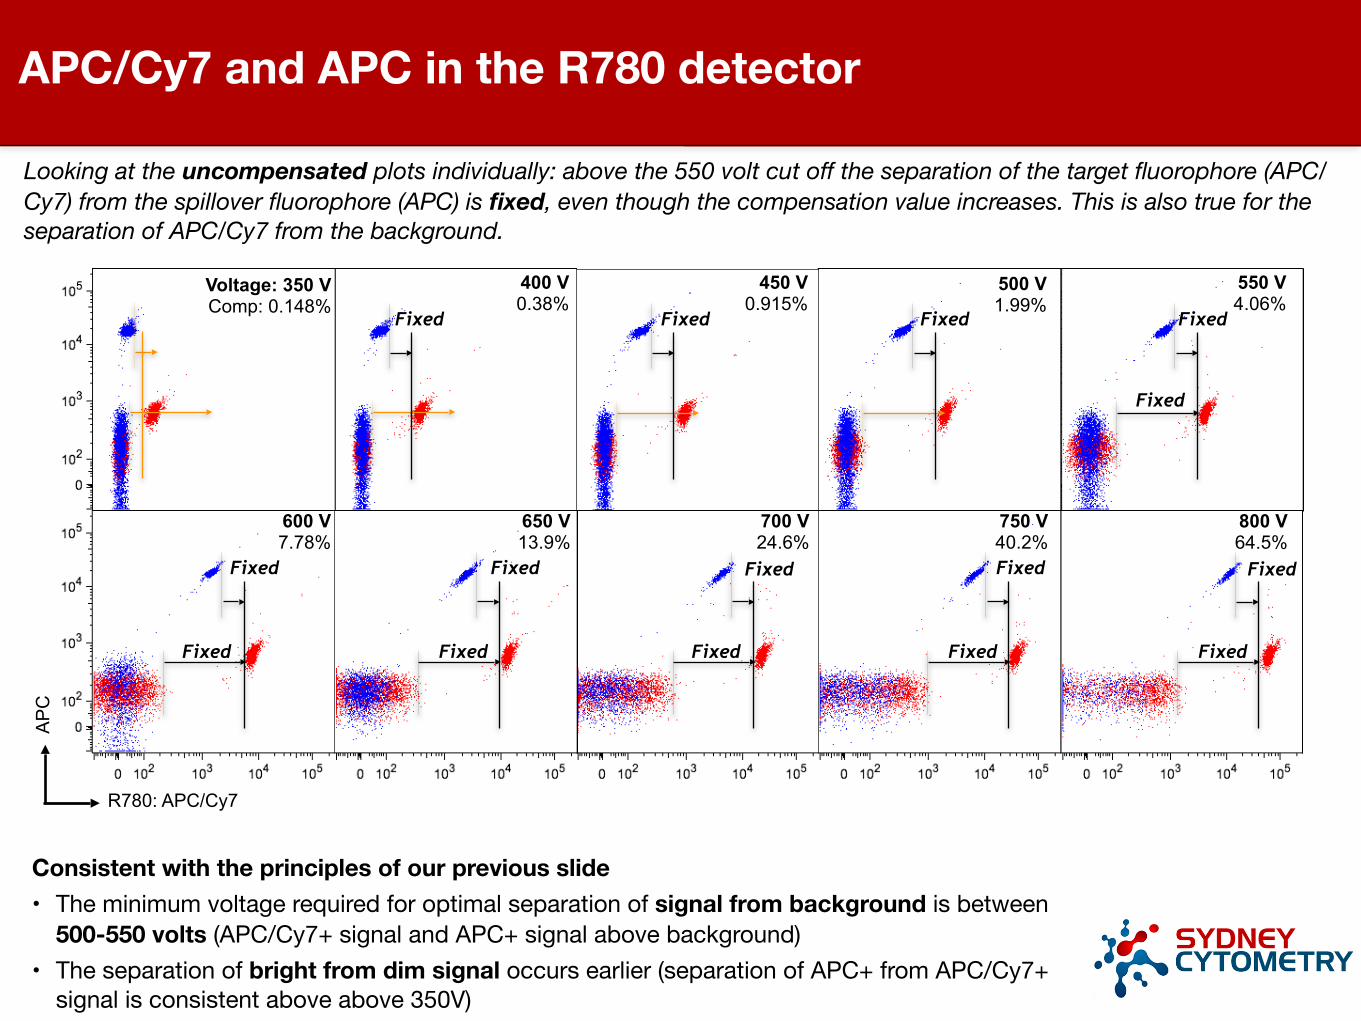
Looking at the uncompensated plots individually: above the 550 volt cut off the separation of the target fluorophore (APC/Cy7) from the spillover fluorophore (APC) is fixed, even though the compensation value increases. This is also true for the separation of APC/Cy7 from the background.
APC/Cy7 and APC in the R780 detector
Consistent with the principles of our previous slide • The minimum voltage required for optimal separation of signal from background is between
500-550 volts (APC/Cy7+ signal and APC+ signal above background) • The separation of bright from dim signal occurs earlier (separation of APC+ from APC/Cy7+
signal is consistent above above 350V)
Fixed
500 V 1.99%
Fixed
450 V 0.915%
Fixed
400 V 0.38%
Voltage: 350 V Comp: 0.148%
Fixed
Fixed
800 V 64.5%
Fixed
Fixed
750 V 40.2%
Fixed
Fixed
700 V 24.6%
Fixed
Fixed
650 V 13.9%
Fixed
Fixed
600 V 7.78%
R780: APC/Cy7
AP
C

Looking at the compensated plots individually: above the 550 volt cut off the separation of the target fluorophore (APC/Cy7) from the spread of the compensated spillover fluorophore (APC) is fixed, even though the compensation value increases.
APC/Cy7 and APC in the R780 detector
• The minimum voltage required for optimal separation of signal from background is between 500-550 volts• The separation of compensated APC+ (now in the negative/low region scale of the R780 detector) from
APC/Cy7+ signal is consistent above above 550 V
550 V 4.06%
Fixed
500 V 1.99%
Fixed
450 V 0.915%
400 V 0.38%
Voltage: 350 V Comp: 0.148%
800 V 64.5%
Fixed
750 V 40.2%
Fixed
700 V 24.6%
Fixed
650 V 13.9%
Fixed
600 V 7.78%
Fixed
R780: APC/Cy7
AP
C

800 V
Fixed
750 V
Fixed
700 V
FixedFixed
650 V
Fixed
600 V550 V
Fixed
500 V
Fixed
450 V400 V350 V
APC/Cy7 and APC in the R780 detector
Overlay of the compensated data: 350-800 volts in R780
To replay
R780: APC/Cy7
AP
C

So what does compensation >100% look like?
Despite compensation values of ~140%, the spreading error, and resolution of target (UVLD) from non-target (BUV395) signal is reasonable.

On-the-fly method for setting voltages (not a full optimisation procedure) • Start with the CS&T assigned voltages (this will set an approximate minimum for separation of dim signal)• Run through your full set of compensation beads/cells — reduce voltages for any detector where the signal is off-scale/
in the non-linear range (typically reduce if the peak is above 10^5). Even if reducing the voltage compromises the resolution of dim signal, it is more important to have linear signals (signal on-scale), as it is absolutely required for correct compensation
• Run through the compensation controls again and check the spillover values. Voltages should not be modified to reduce these values, as this will not impact resolution
• Check each of your sample types (especially samples from any stimulation or inflammatory situation) to ensure signals are all on scale/in the linear range
• Record compensation controls, apply compensation, and record samples
Full optimisation procedure: see the following resources • Sydney Cytometry Facility optimisation and tracking (email [email protected] or
[email protected])• BD Application settings using unstained cells (https://www.bdbiosciences.com/documents/
BD_FACSDiva_Stndrd_App_Setup_TechBulletin.pdf)• VRC bead suite optimisation method (http://www.nature.com/nprot/journal/v7/n12/abs/nprot.2012.126.html)
So how do I set my voltages?
Summary: changing voltages does not impact resolution • Users are often concerned by high compensation values, especially values above 100%, and want to reduce
the voltage of the detector receiving spillover to reduce the compensation value• However, decreasing/increase voltages will only modify the compensation value, and will not change the
impact of spillover/spreading on the resolution of positive signal
PMT voltages: properly optimised • Each detector will have a minimum voltage where signal is consistently and proportionally detected above
background• Decreasing the voltage for a given PMT below this minimum, then resolution of dim populations will be lost. • Increase the voltage for a given PMT above this gives no advantage to population resolution.• Often the cause for abnormally high compensation values (values >100% in particular) are a result of improperly
optimised PMT voltages, for example, such as unnecessarily high default voltages being set by the CS&T program in some detectors.
• Use a proper optimisation protocol (or at least an on-the-fly method) to optimise PMT voltages
What do I do if I have spillover/spreading error causing a loss of resolution in my data • Firstly, optimise your instrument• If spillover/spreading error is causing a loss of resolution in your data on an optimised system, the solution is to
modify your panel, not to modify the voltages
Summary and application