
The Impact of 401(k) Loans on Saving Beshears, Choi, Laibson... · The Impact of 401(k) Loans on...
24
The Impact of 401(k) Loans on Saving by John Beshears, Stanford University and NBER James J. Choi, Yale University and NBER David Laibson, Harvard University and NBER Brigitte C. Madrian, Harvard University and NBER September 29, 2010 The research reported herein was pursuant to a grant from the U.S. Social Security Administration (SSA) funded as part of the Retirement Research Consortium (RRC). The findings and conclusions expressed are solely those of the authors and do not represent the views of SSA, the NIA, any other agency of the Federal Government, the NBER, or the RRC. We thank Hewitt Associates for providing data and insights into 401(k) loans from the perspective of a plan administrator. We are particularly grateful to Pam Hess, Yan Xu, and Kirsten Bradford for their feedback on this project. We are also indebted to Yeguang Chi, Eric Zwick, Anna Blank, Patrick Turley, and Chelsea Zhang for their research assistance. Additional financial support from the NIA (grants R01-AG021650 and T32-AG00186) is gratefully acknowledged.
Transcript of The Impact of 401(k) Loans on Saving Beshears, Choi, Laibson... · The Impact of 401(k) Loans on...

The Impact of 401(k) Loans on Saving
by
John Beshears, Stanford University and NBER
James J. Choi, Yale University and NBER
David Laibson, Harvard University and NBER
Brigitte C. Madrian, Harvard University and NBER
September 29, 2010
The research reported herein was pursuant to a grant from the U.S. Social Security Administration (SSA) funded as part of the Retirement Research Consortium (RRC). The findings and conclusions expressed are solely those of the authors and do not represent the views of SSA, the NIA, any other agency of the Federal Government, the NBER, or the RRC. We thank Hewitt Associates for providing data and insights into 401(k) loans from the perspective of a plan administrator. We are particularly grateful to Pam Hess, Yan Xu, and Kirsten Bradford for their feedback on this project. We are also indebted to Yeguang Chi, Eric Zwick, Anna Blank, Patrick Turley, and Chelsea Zhang for their research assistance. Additional financial support from the NIA (grants R01-AG021650 and T32-AG00186) is gratefully acknowledged.

1
The Impact of 401(k) Loans on Saving
Abstract: Although the popular press and politicians often describe 401(k) loans as a problem, classical economic theory has a more benign view. Loans from a 401(k) can relax liquidity constraints and increase household utility. Moreover, loan provisions may have the subtle effect of raising net asset accumulation by making 401(k) participation more appealing: employees who can access their 401(k) assets if they need them may be willing to put more money into an otherwise illiquid 401(k) account. Our research suggests that 401(k) loans are neither a blessing nor a bogeyman. Conditional on borrowing to finance consumption, we show that a 401(k) loan may be a reasonable source of credit in many circumstances. We further show that the net impact of 401(k) loans on asset accumulation is likely to be small (and could be either positive or negative) for a reasonable range of parameter assumptions.
John Beshears Stanford University Graduate School of Business 518 Memorial Way Stanford, CA 94305-5015 [email protected]
James J. Choi Yale School of Management 135 Prospect Street P.O. Box 208200 New Have, CT 06520-8200 [email protected]
David Laibson Department of Economics Harvard University Littauer M-14 Cambridge, MA 02138 [email protected]
Brigitte C. Madrian Kennedy School of Government Harvard University 79 JFK Street Cambridge, MA 02138 [email protected]

2
In Shakespeare’s Hamlet, Polonius instructs his son: “Neither a borrower nor a lender
be.” The advent of the 401(k) loan has created the curious possibility of violating Polonius’s
maxim twice in the same transaction: individuals can borrow from their 401(k) wealth and repay
themselves.
Borrowing from defined contribution savings plans, including 401(k) plans, has long
been permissible, and such loans are prevalent. The Investment Company Institute reports that
18% of 401(k) participants had a 401(k) loan in 2008 (Holden, VanDerhei and Alonso, 2009).
Nevertheless, the impact of this borrowing on economic outcomes has only recently begun to
attract attention in the academic and policy worlds. Anecdotally, the recent economic slowdown
has caused the fraction of 401(k) participants with a 401(k) loan to rise.1 This increase, coupled
with the introduction of the 401(k) debit card,2 motivated Senators Herb Kohl and Charles
Schumer to propose legislation that would limit the number of outstanding 401(k) loans to three
per participant and ban 401(k) debit cards outright (Asci, 2008). The concern is that easy access
to one’s retirement nest egg will lead to excessive consumption in the present at the expense of
future financial security.
Although the popular press and politicians often describe 401(k) loans as a problem,
classical economic theory has a more benign view. Loans from a 401(k) can relax liquidity
constraints and increase household utility. Moreover, loan provisions may have the subtle effect
of raising net asset accumulation by making 401(k) participation more appealing. Employees
who know that they can access their 401(k) assets if they need them may be willing to put more
money into an otherwise illiquid 401(k) account.
Our research suggests that 401(k) loans are neither a blessing nor a bogeyman.
Conditional on borrowing to finance consumption, we show that a 401(k) loan may be a
reasonable source of credit in many circumstances. We further show that the net impact of
1 See, for example, Transamerica Center for Retirement Studies (2008). 2 See Burton (2008) on the 401(k) debit card.

3
401(k) loans on asset accumulation is likely to be small (and could be either positive or negative)
for a reasonable range of parameter assumptions.
In Section I, we explain how 401(k) loans work, briefly describing some of the key
provisions that matter for the analysis that follows. In Section II, we consider the economics of
401(k) loans—how do they compare to other potential sources of credit? In Section III, we
calibrate the impact of having a 401(k) loan provision on wealth accumulation. Section V
concludes.
II. How 401(k) Loans Work
We refer the interested reader to Beshears et al. (2010) for a more comprehensive
overview of 401(k) loan features and an analysis of 401(k) loan availability and loan utilization.
Here we briefly summarize some of the findings in that paper that are relevant for thinking about
the economics of 401(k) loans.
Regulatory oversight of 401(k) loans is shared by the Department of the Treasury and the
Department of Labor, the two agencies that jointly regulate tax-favored savings plans. Under the
Internal Revenue Code, qualified retirement savings plans may provide plan participants with the
option of obtaining one or more loans against their plan balances.3 Savings plans are not required
to make loans available, but if they do, they must be made available to all participants on a
reasonably equivalent basis. Holden, VanDerhei and Alonso (2009) calculate that 88% of 401(k)
participants belong to plans that have allow for participant loans.
The terms of a 401(k) loan are set by individual savings plans, within certain regulatory
bounds. Most plans place no restrictions on the purposes to which the proceeds from a 401(k)
loan may be dedicated. When a loan is made to a 401(k) participant, the plan liquidates some of
its assets to make the loan disbursement, and the participant’s account balance is reduced
correspondingly. The participant is then responsible for the timely repayment of the loan. Loan
payments, which include both principal and interest, are made with after-tax dollars and are
credited to the participant’s account.
Plans have discretion in determining the interest rate for 401(k) loans; however, the
interest rate chosen must be reasonable, meaning that it must be similar to what other financial
3 Qualified plans are those that satisfy the requirements of I.R.C. 401(a), annuity plans that satisfy 403(a) or 403(b), and governmental plans (Internal Revenue Service). Loans are not permitted from IRAs, SEPs, or other similar plans.

4
institutions are charging for similar types of loans. In practice, most savings plans peg their loan
interest rates to the prime rate, with prime+1% being the most common interest rate charged.
If a participant defaults on his or her loan, the outstanding balance at the time of default is
treated as a taxable distribution from the plan and is subject to the 10% early withdrawal penalty
for participants under the age of 59½.4 If a participant’s employment is terminated, loans must
typically be repaid in full within a reasonable period of time, typically 60 to 90 days, or the
outstanding loan balance is treated as a taxable distribution from the plan.
III. The Economics of 401(k) Loans
The existence of the 401(k) loan channel raises several economic questions. When does a
401(k) loan reduce borrowing costs compared to other sources of liquidity? How do 401(k) loans
affect overall retirement wealth accumulation? How do 401(k) loans affect individual utility?
A reader of the popular press will quickly conclude that there is no consensus answer to
these questions. Articles and websites with titles such as “Robbing Tomorrow to Pay for Today”
and “401(k) Loans are Hazardous to Your Wealth” argue that 401(k) loans are a bad idea in
general.5 A recent study that was widely cited by the media suggests that 401(k) loans may
decrease wealth accumulation at retirement by as much as 22% (Weller and Wenger, 2008). The
study further asserts that 401(k) loans have “significant downsides” (p. 1), including the fact that
borrowed money is not earning an investment return, the interest and principal payments are
made with after-tax dollars, the interest paid on the loan is typically below the market rate of
interest, and loans in default incur an immediate tax liability and possibly a 10% tax penalty.
Others commentators, however, cite the advantages of 401(k) loans.6 Loans from a
401(k) involve less paperwork. Many analysts in the popular press point out that the interest on a
401(k) loan is paid to oneself, although they sometimes neglect the opportunity cost of foregone
returns on the funds that have been withdrawn from the 401(k) plan.
Most of the assessments of 401(k) loans make a host of unstated assumptions about what
savings rates would be like in the absence of a 401(k) loan option, the utility value of the
consumption funded by the 401(k) loan, whether another type of loan would be taken in the
4 Plans may suspend loan payments for employees on active military duty and for employees on leave for a period of up to one year. 5 See Weller and Wenger (2008) and Applegarth, and Reeves and Villareal (2008). 6 See Reeves and Villareal (2008) and Applegarth.
5
absence of a 401(k) loan, the interest rate that would be charged by another source of credit, the
interest rate on the 401(k) loan relative to the rate of return on other assets in the 401(k) plan, and
whether the loan is paid back in full. These assumptions importantly affect the conclusions about
the welfare consequences of 401(k) loans.
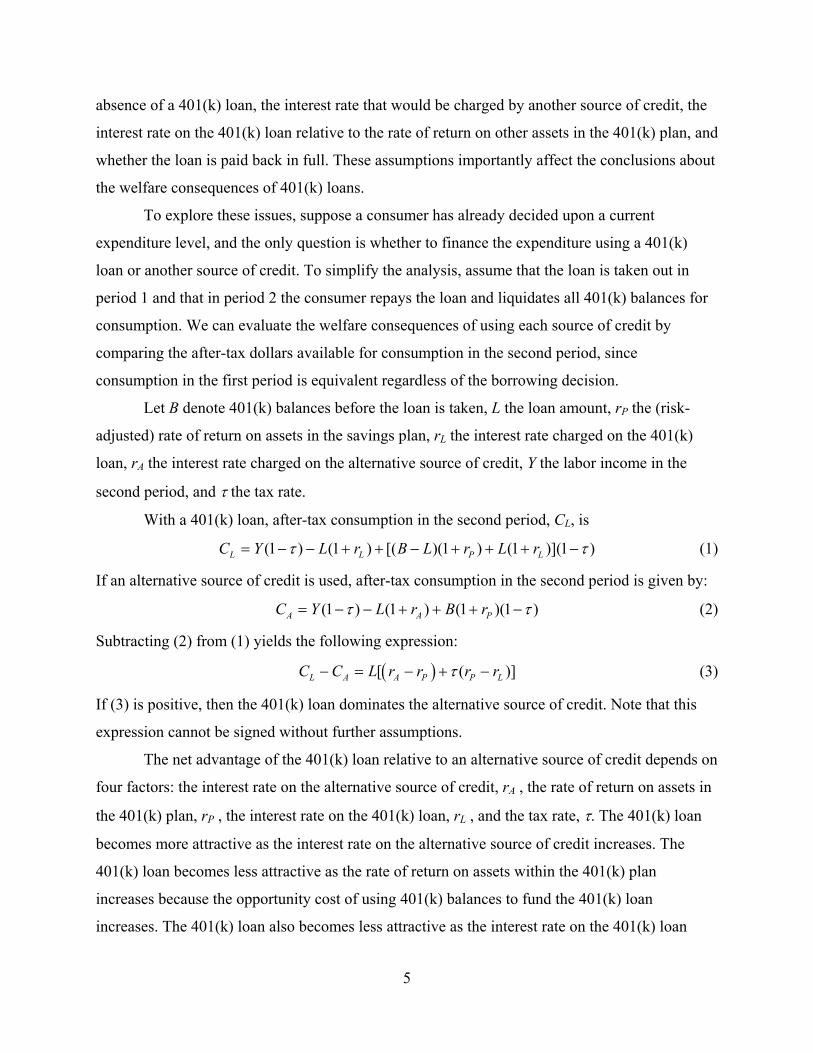
To explore these issues, suppose a consumer has already decided upon a current
expenditure level, and the only question is whether to finance the expenditure using a 401(k)
loan or another source of credit. To simplify the analysis, assume that the loan is taken out in
period 1 and that in period 2 the consumer repays the loan and liquidates all 401(k) balances for
consumption. We can evaluate the welfare consequences of using each source of credit by
comparing the after-tax dollars available for consumption in the second period, since
consumption in the first period is equivalent regardless of the borrowing decision.
Let B denote 401(k) balances before the loan is taken, L the loan amount, rP the (risk-
adjusted) rate of return on assets in the savings plan, rL the interest rate charged on the 401(k)
loan, rA the interest rate charged on the alternative source of credit, Y the labor income in the
second period, and the tax rate.
With a 401(k) loan, after-tax consumption in the second period, CL, is
(1 ) (1 ) [( )(1 ) (1 )](1 )L L P LC Y L r B L r L r (1)
If an alternative source of credit is used, after-tax consumption in the second period is given by:
(1 ) (1 ) (1 )(1 )A A PC Y L r B r (2)
Subtracting (2) from (1) yields the following expression:
[ ( )]L A A P P LC C L r r r r (3)
If (3) is positive, then the 401(k) loan dominates the alternative source of credit. Note that this
expression cannot be signed without further assumptions.
The net advantage of the 401(k) loan relative to an alternative source of credit depends on
four factors: the interest rate on the alternative source of credit, rA , the rate of return on assets in
the 401(k) plan, rP , the interest rate on the 401(k) loan, rL , and the tax rate, . The 401(k) loan
becomes more attractive as the interest rate on the alternative source of credit increases. The
401(k) loan becomes less attractive as the rate of return on assets within the 401(k) plan
increases because the opportunity cost of using 401(k) balances to fund the 401(k) loan
increases. The 401(k) loan also becomes less attractive as the interest rate on the 401(k) loan

6
increases because the interest payments on the 401(k) loan are taxed twice: payments are made
with after-tax dollars, and they are taxed again when distributed. The impact of a higher tax rate
on the attractiveness of a 401(k) loan is ambiguous and depends on the magnitude of the 401(k)
loan interest rate relative to the rate of return on assets in the 401(k) plan. Intuitively, a higher tax
rate increases the cost of the double taxation of 401(k) loan interest payments, but it also reduces
the opportunity cost of giving up the rate of return on plan assets by taking out a loan.
There are a number of special cases in which expression (3) simplifies. The first is when
= 0. In this case, expression (3) reduces to L[rA – rP], implying that a 401(k) loan will be
preferred if the interest rate on the alternative source of credit exceeds the rate of return on assets
within the plan—a likely outcome if the alternative source of credit is a credit card. The Joint
committee on Taxation (2008) reports that 37% of households have no federal tax liability, and
state income tax rates are generally quite low for most households. Thus, for many households,
the = 0 scenario may be a good benchmark.
Similarly, if rL is equal to rP, expression (3) again reduces to L[rA – rP]. This is also a
leading benchmark, since “prime +1” is a typical 401(k) loan interest rate and also a reasonable
approximation for the risk-adjusted return on assets within the 401(k) plan.
It is worth noting that the term L (rP – rL) in (3) is likely to be relatively unimportant
even when ≠ 0 and rP ≠ rL. The expression L (rP - rL) is the product of and (rP – rL), scaled
by L. Since both and (rP – rL) are likely to be near zero, their product is likely to be near zero.
Hence, L (rP – rL) is likely to be less important than L(rA – rP).
Table 1 calculates the advantage of a 401(k) loan as a percent of loan size (that is, the
part of expression (3) in brackets) for various combinations of rA, rL, rP, and :
)]()[( LPPAAL rrrr
L
CC
(4)
If (4) is positive, then a 401(k) loan dominates the relevant alternative source of credit. Note that
this expression cannot be signed without further assumptions. We use three values of : 0%,
15%, and 35%. The first two tax rates, 0% and 15%, are the two most prevalent federal marginal
tax rates (Joint Tax Committee, 2008), and 35% is the highest current federal marginal tax rate.
Likewise, we use three values for rP: 3% (meant to approximate a long-run rate of return on
money market funds), 5%, and 7%. We peg our assumed interest rates for the 401(k) loan and
alternative sources of credit to a long-run benchmark prime rate of 5%. We use two values for rL:
7
5% (equivalent to the benchmark prime rate) and 7% (the benchmark prime rate + 2%), which
encompass the prevailing range of 401(k) loan rates for the vast majority of 401(k) plans
(Beshears et al. 2010). Finally, we consider three alternative sources of credit: a home equity
loan, a personal loan for a purchase of a large durable (e.g., a car), and a personal credit card.
Because mortgage interest is tax deductible, the effective interest rate on a home equity loan
depends on a consumer’s marginal tax rate; we assume that rA for a home equity loan is equal to
6%×(1–). The interest rate we assume for a personal loan is the benchmark prime rate plus 2%,
or 7%. Finally, the interest rate we assume for a credit card loan is the benchmark prime rate +
10%, or 15% in Table 1.
The cells in Table 1 report the advantage of a 401(k) loan relative to alternative sources
of credit for the various assumptions about tax rates, interest rates, and the return on assets in the
401(k) plan described above. Positive values indicate that a 401(k) loan maximizes second
period consumption, negative values that the alternative credit source maximizes second period
consumption. Note that for all of our calibrated cases, a 401(k) loan dominates borrowing on a
credit card and increases second period consumption by 8% to 12% of the loan amount. The
picture is somewhat more ambiguous for the other alternative sources of credit. A home equity
loan is usually preferred (or only weakly dominated) for consumers with a very high marginal
tax rate ( = 35%). At lower tax rates (0% or 15%), it is preferred only in when the return on
401(k) assets is high (7% in Table 1). For the parameter values assumed in Table 1, a personal
loan never dominates a 401(k) loan, but could be preferred if the expected rate of return on assets
in the plan were higher than the values assumed in Table 1. For a 7% rate of return on plan
assets, a personal loan and a 401(k) loan appear to be close substitutes.
Of course, the analysis above has made many simplifying assumptions, and relaxing
these assumptions could affect some of the conclusions. For example, incorporating an
application fee and a tax penalty upon default for a 401(k) loan would make such loans less
attractive. There are additional potential costs associated with other forms of credit as well: home
equity loans often come with application fees; home equity loans, personal loans, and credit card
loans carry penalties for late payments; and although default on these loans does not carry a tax

8
penalty, it may increase the cost of borrowing in the future.7 These factors would make a 401(k)
loan more attractive.
III. Calibrating the Impact of 401(k) Loans on Wealth Accumulation
Much of the recent criticism of 401(k) loans has been made not on the grounds that a
401(k) loan is inferior vis-à-vis other sources of credit, but on the grounds that 401(k) loans are
easy (i.e., tempting) credit. That is, that 401(k) loan availability induces individuals to consume
more today than they otherwise would have consumed, implicitly reducing saving.
In fact, however, the existence of a loan option has numerous consequences for wealth
formation with potentially offsetting effects—the purported negative “savings effect” is actually
ambiguous. We briefly list the potential ways that a 401(k) loan option could impact wealth
accumulation below. We then discuss the nature of the evidence on the magnitudes of these
various effects and calibrate the overall impact on wealth accumulation.
Participation effect (+): The existence of a loan option may increase 401(k)
participation, since a loan option increases the flexibility (and hence the value) of
401(k) savings.
Contribution rate effect (+): The existence of a loan option may increase average
401(k) contribution rates (conditional on enrollment) for the same reasons that it may
increase savings plan participation—because the loan option increases the flexibility
of 401(k) savings.
Credit availability effect (-): The existence of a loan option may increase the
likelihood of borrowing, since a loan option makes 401(k) savings liquid.
Repayment crowd-out effect (-): The repayment of a loan may crowd out existing
savings flows.
Default effect at separation (-): 401(k) loans typically becomes payable in full at the
time of separation, so a job loss or job departure may lead to a 401(k) loan default. In
the case of default, the outstanding loan amount will not be repaid which reduces
future wealth. Also, a 10% tax penalty is levied, which could reduce current wealth.
Borrowing cost effect (+/-): The existence of a loan option may reduce borrowing
costs (as discussed in conjunction with Table 1), which could either reduce or raise
7 401(k) loan default is not reported to the credit bureaus and does not adversely affect an individual’s credit rating.

9
borrowing or saving depending on whether the substitution effect or the income effect
dominates.
Whether the negative effects listed above outweigh the positive effects or vice versa is
ultimately an empirical question. We turn now to placing a magnitude on these various effects so
that we can make some determination about the net effect of 401(k) loans on wealth
accumulation
We first consider the impact of having a loan option on participation in and contributions
to a 401(k) plan. Having a loan option increases the flexibility of saving in the 401(k) plan by
making the plan a vehicle for precautionary as well as retirement saving. This makes
participation in the plan more attractive; similarly, it also makes contributing at a higher rate
more attractive.
Loan participation effect. We turn to three sources for insight on the potential magnitude
of the loan participation effect.8 The first two are studies by the General Accounting Office
(GAO, 1997) and Mitchell, Utkus, and Yang (2007), both of which use cross-sectional, plan-
level variation to identify the loan effect on savings plan participation. The GAO study uses
firm-level data from the 1992 IRS Form 5500 filings of over 7,000 plans and finds that plans
with a loan option have a 401(k) participation rate that is 6 percentage points higher than in plans
without a loan option. Mitchell, Utkus, and Yang (2007) use participant-level data for over 500
plans in 2001 and find no difference in participation rates between plans with and without a loan
option. Because there are many differences between the types of firms that have a loan provision
and those that do not, a causal interpretation of these cross-sectional regressions is problematic,
although the results are certainly suggestive.
Our third source of information on the enrollment effects comes from an empirical
analysis of savings plan participation at a large health care organization that added a loan option
to its plan in July 2002. For this organization, we have a series of year-end cross-sections from
2002 to 2007 with individual-level data on all employees eligible to participate in the savings
plan. The data include demographic information such as birth date, hire date, gender, and
compensation. They also contain information on the date that an employee first enrolled in the
8 Love (2007) simulates a stochastic life-cycle model of consumption and savings under various assumptions about 401(k) plan provisions. The paper does not examine 401(k) loans specifically, but does consider the impact of liquidity by comparing participation and contributions with and without a 10% early withdrawal penalty. Simulated 401(k) participation rates are substantially higher for some groups of workers without the early withdrawal penalty. See also Love (2006).
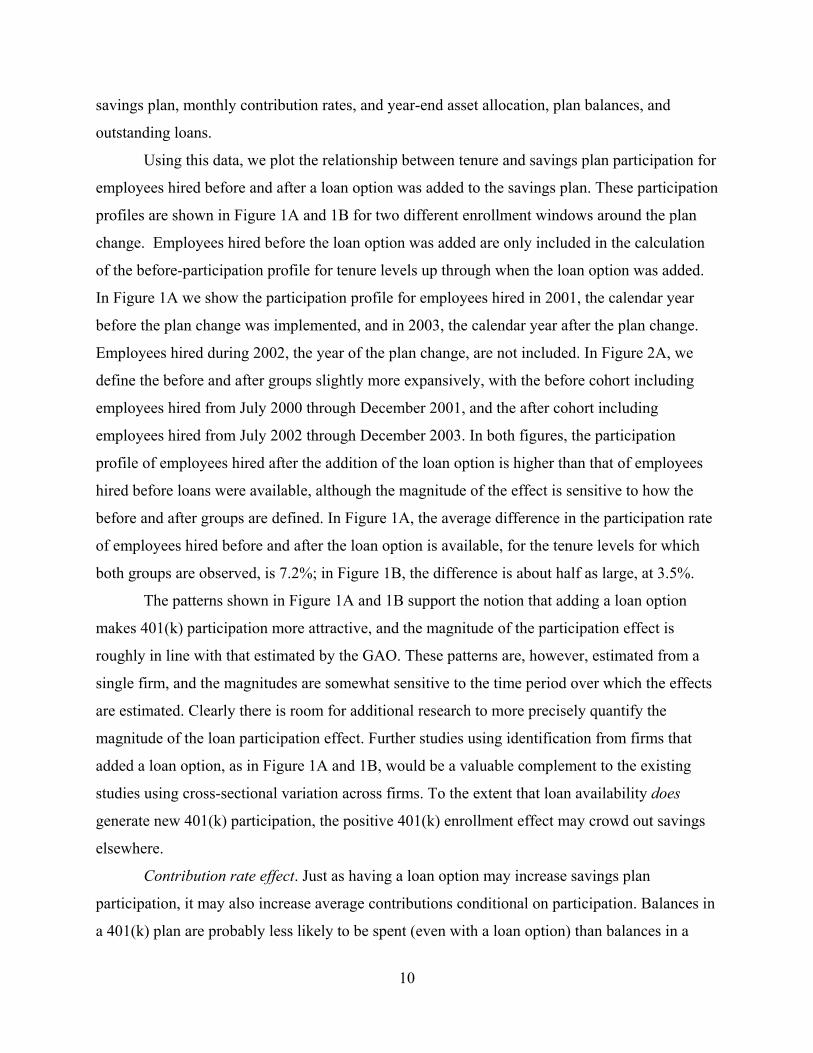
10
savings plan, monthly contribution rates, and year-end asset allocation, plan balances, and
outstanding loans.
Using this data, we plot the relationship between tenure and savings plan participation for
employees hired before and after a loan option was added to the savings plan. These participation
profiles are shown in Figure 1A and 1B for two different enrollment windows around the plan
change. Employees hired before the loan option was added are only included in the calculation
of the before-participation profile for tenure levels up through when the loan option was added.
In Figure 1A we show the participation profile for employees hired in 2001, the calendar year
before the plan change was implemented, and in 2003, the calendar year after the plan change.
Employees hired during 2002, the year of the plan change, are not included. In Figure 2A, we
define the before and after groups slightly more expansively, with the before cohort including
employees hired from July 2000 through December 2001, and the after cohort including
employees hired from July 2002 through December 2003. In both figures, the participation
profile of employees hired after the addition of the loan option is higher than that of employees
hired before loans were available, although the magnitude of the effect is sensitive to how the
before and after groups are defined. In Figure 1A, the average difference in the participation rate
of employees hired before and after the loan option is available, for the tenure levels for which
both groups are observed, is 7.2%; in Figure 1B, the difference is about half as large, at 3.5%.
The patterns shown in Figure 1A and 1B support the notion that adding a loan option
makes 401(k) participation more attractive, and the magnitude of the participation effect is
roughly in line with that estimated by the GAO. These patterns are, however, estimated from a
single firm, and the magnitudes are somewhat sensitive to the time period over which the effects
are estimated. Clearly there is room for additional research to more precisely quantify the
magnitude of the loan participation effect. Further studies using identification from firms that
added a loan option, as in Figure 1A and 1B, would be a valuable complement to the existing
studies using cross-sectional variation across firms. To the extent that loan availability does
generate new 401(k) participation, the positive 401(k) enrollment effect may crowd out savings
elsewhere.
Contribution rate effect. Just as having a loan option may increase savings plan
participation, it may also increase average contributions conditional on participation. Balances in
a 401(k) plan are probably less likely to be spent (even with a loan option) than balances in a
11
regular investment account, particularly if that alternative investment account is not a tax-
deferred retirement account with a withdrawal penalty. In their study of the effect of having a
loan option on savings plan participation, the GAO (1997) also estimates that employee
contributions are 35% higher in plans with a loan provision than in plans without a loan
provision. Mitchell, Utkus, and Yang (2007), despite estimating that a loan provision has no
impact on plan participation, do find that a loan option increases plan contributions by 10%
(from a base contribution rate of 6.1% to 6.7%).9 Similar effects on employee contributions are
estimated by Holden and VanDerhei (2001), who use participant-level data from 1999, and by
Munnell, Sunden, and Taylor (2000) using individual-level data from the 1998 Survey of
Consumer Finances.10 Unfortunately, the administrative data that we used in Figure 1A and 1B
to examine the impact of adding a loan option on savings plan participation does not include
sufficient information on contributions to the plan predating the adoption of the loan option to
allow us to replicate our analysis in Figure 1A and 1B for contributions conditional on savings
plan participation. Our final caveat on the participation effect discussed above also applies here:
new 401(k) savings resulting from increased contribution rates in response to having a loan
option could simply displace saving that would otherwise occur elsewhere.
Credit availability effect. Without a loan provision, penalty-free withdrawals from a
401(k) are only available once participants reach the age of 59 ½; for younger participants,
withdrawals are only available under conditions of financial hardship (if the firm chooses to
allow such withdrawals) or after an employee separates from the firm, and these withdrawals
incur a 10% tax penalty. The existence of a loan option makes 401(k) savings more liquid,
allowing employees to tap into their accumulated balances with a repayment plan and without
incurring a tax penalty. Unfortunately, there is no evidence on the extent to which savings plan
participants use 401(k) loans to finance consumption that would have been financed through
other means anyway, versus the extent to which this potentially cheaper source of credit actually
induces new pre-retirement consumption. In our calibration below, we will assume two diverging
values that represent our best guesses of a low versus a high credit availability effect.
9 This result is for employees who are not classified as highly compensated according to the IRS non-discrimination rules, and includes the vast majority of plan participants. 10 Holden and VanDerhei (2001) estimate that having a loan provision increases the average contribution rate of savings plan participants by 0.6 percentage points, using administrative data from 1999 for a large sample of 401(k) plans. Munnell, Sunden, and Taylor (2000) find that being able to borrow against plan balances increases the average contribution rate of savings plan participants by 1 percentage point.

12
Repayment crowd-out effect. The repayment of a loan may crowd out existing savings
flows (whether the loan is a 401(k) loan or a loan from an alternative source). To the extent that
loan repayment displaces existing contributions, asset accumulation is reduced. One of the key
assumptions driving the conclusions in a recent study suggesting that 401(k) loans may decrease
retirement wealth accumulation by as much as 22% (Weller and Wenger, 2008) is that loan
repayments completely displace contributions to the plan while the loan is being repaid. To
evaluate the actual magnitude of the repayment crowd-out effect in practice, we examine the
pattern of contributions rates for loan recipients before and after participants take out a loan. The
data for this analysis are a series of year-end cross-sections, from 2002 to 2007, for 21 different
companies with a loan option. The extracts are comprised of individual-level data on all
employees eligible to participate in the savings plan. They include demographic information
such as birth date, hire date, gender, and compensation. They also contain information on the
date that an employee first enrolled in the savings plan, monthly contribution rates, and year-end
asset allocation, plan balances, and outstanding loans. For participant loans, we know the loan
date, the original loan amount, the repayment amount and frequency, the loan duration, the loan
interest rate, and the outstanding balance at year-end.
In Figure 2 we plot the average contribution rate of loan recipients by time relative to
when the loan was taken out (time 0 on the x-axis). In this graph, we include only those loan
recipients who took out loans with durations of 12, 24 or 36 months, and we plot the relationship
between contribution rates and time separately for each group.11 At the time that the loan is
taken, loan recipients are contributing approximately 6% of pay to their savings plan. Before the
loan is taken, their average contribution rate is increasing almost linearly, from a baseline of 4%
36 months before loan initiation. This apparent pre-loan increase in contribution rates is driven
almost entirely by non-participants joining the savings plan and going from a contribution of 0 to
something positive; conditional on participating in the savings plan, pre-loan contribution rates
are virtually flat among eventual loan recipients (not shown). Contribution rates show a very
slight dip around the time of loan receipt. The most interesting pattern in Figure 2, however, is
the effect that loan repayment has on savings plan contributions: there is a marked increase in
contribution rates at the time of complete loan repayment—12 months post-loan for those with
11 Beshears et al. (2010) calculate that about half of all loans have an initial duration of one to three years, and a separate investigation reveals that most of these loans have a duration or either exactly 12, 24, or 36 months.

13
12-month loans, 24 months post-loan for those with 24-month loans, 36 months post-loan for
those with 36-month loans. The contribution rate increase at or shortly following loan repayment
is on the order or 1% to 1.5% of pay.
Unfortunately, we do not know the counterfactual contribution rate for loan recipients in
the absence of a 401(k) loan. Would it have been their 6% average contribution rate just prior to
taking out a loan? Would it have been their 7% average contribution rate observed subsequent to
payoff of their loans? Would it have been something between 6% and 7%? Or might it have been
even higher than 7%? What does seem clear is that Figure 2 is not consistent with savings plan
contributions entirely ceasing during loan repayment as assumed by Weller and Wenger (2008).
A more reasonable estimate of the extent of loan repayment crowd-out would be in the range
0.5% to 1% of pay.
Default effect at separation. Since a 401(k) loan must typically be repaid in full at the
time of a job separation, job turnover generates the possibility of 401(k) loan default for
borrowers who either do not have other means to repay their loans, or do not bother to repay
their loans. Such a default is not reported to credit bureaus since the borrower is defaulting on a
loan to herself. However, the default does terminate loan repayments—prematurely ending the
flow of deposits into the 401(k) account—and generates an immediate tax liability.
Conversations with plan administrators suggest that the default rate upon separation is
approximately 70% conditional on having an outstanding 401(k) loan at the time of job
separation. However, the effect of separation-related defaults on wealth formation is likely to be
relatively small in aggregate because only a small fraction of savings plan participants terminate
employment with an outstanding loan balance: most employees do not have an outstanding loan,
and most employees with outstanding loans do not terminate their employment.12 If we assume
that 18% of savings plan participants have an outstanding 401(k) loan balance, that the turnover
rate among these individuals is 20% per annum, and that the default rate conditional on job
turnover with an outstanding loan is 70%, then only about 2.5% of savings plan participants
would experience a loan-related default in a given year. We think that this is an upper-bound
estimate on the likely proportion of savings plan participants who default on a 401(k) loan.
12 Holden, VanDerhei and Alonso (2009) report that 18% of savings plan participants had an outstanding loan in 2009. The job separation rate for the U.S. economy overall is about 30% (Shimer, 2010). For savings plan participants, it is likely to be much lower, as job turnover tends to be lower in firms offering non-wage benefits like a savings plan.

14
Borrowing cost effect. The existence of a loan option may reduce borrowing costs (as
shown in Table 1), which could either reduce or raise savings depending on whether the
substitution effect or the income effect dominates. In the calibration that follows, we ignore any
potential borrowing cost effect as we think that this effect, which is theoretically ambiguous, is
likely to be quite small.
In Table 2 we estimate the potential savings (rate) impact of having a 401(k) loan
provision. We analyze two sets of benchmark assumptions: pessimistic assumptions in which the
potential positive effects on savings are small and the negative effects are large, and optimistic
assumptions in which the potential positive effects on savings are large and the negative effects
are small.
We first calculate the direct effect of having a loan option on savings—the participation
and contribution rate effects described above. We assume that the initial 401(k) participation rate
is either 60% (pessimistic scenario) or 70% (optimistic scenario), numbers that are roughly in
line with prevailing participation rates in companies that do not have automatic enrollment. We
then assume that the impact of having a loan option on plan participation is either nil (pessimistic
scenario, based on Mitchell, Utkus and Yang, 2007) or a 6 percentage point increase in
participation (optimistic scenario, based on GAO, 1997). We assume that the impact of having a
loan option on the average contribution rate to the plan is either a 0.6 percentage point increase
(pessimistic scenario, based on Mitchell, Utkus and, Yang, 2007 and Holden and VanDerhei,
2001), or a 1.0 percentage point increase (optimistic scenario, based on Munnell, Sunden and
Taylor, 2000).
Under our pessimistic set of assumptions, having a 401(k) loan option increases
contributions to the savings plan by 0.6% × 0.60 = 0.36% of pay (a 0.6 percentage point increase
in the average contribution rate multiplied by a participation frequency of 0.60). However, some
of these contributions may simply reflect savings reshuffled from other parts of the balance
sheet. Assuming a (pessimistic) 50% crowd-out rate results in a net increase in the average total
savings rate of 0.18% of income. Under our optimistic set of assumptions, having a 401(k) loan
option increases contributions to the savings plan by (6% × 0.06) + (1% × 0.76) = 1.12% of pay
(a 6 percentage point increase in the contribution rate for 0.06 fraction of the workforce plus a 1
percentage point increase in the contribution rate for 0.76 fraction of the workforce). With an

15
(optimistic) 25% crowd-out rate, the increase in the average total savings rate is 0.84% of
income.
Offsetting these potential savings increases are any leakages caused by the credit
availability, repayment crowd-out, and default effects. Beshears et al. (2010) report that the
median monthly payment on a newly originated loan in 2008 is $110,13 and that among
participants with a loan, the average number of outstanding loans is 1.4. If we assume an average
annual pay of $40,000, then the average monthly loan repayment is ($110 × 1.4 × 12)/$40000 =
4.6% of pay. But only 18% of participants have a loan, so the average loan repayment across all
participants is about 1% of pay. Based on our discussion of the patterns in Figure 2, we assume
that loan repayments crowd out either 25% of existing contributions (pessimistic scenario), or
10% of existing contributions (optimistic scenario). These assumptions lead to a total decline in
savings due to loans of either 0.24% of pay (pessimistic scenario), or 0.09% of pay (optimistic
scenario).14
We also need to account for the fact that 401(k) loans may not represent a net drain on
saving if they are efficiently financing consumption that would have taken place anyway, rather
than inducing new consumption. In the pessimistic scenario, we assume a 50% credit availability
effect: half of the consumption financed by the loan is consumption that would not have taken
place without a 401(k) loan option. The total consumption leakage from having a 401(k) loan
option is then 0.12% of pay (0.24% × 0.5).15 With a smaller credit availability effect of 10% in
our optimistic scenario, the total consumption leakage effect is only 0.01% of pay (0.09% ×
0.10).
Note that even under our pessimistic set of assumptions, the decrease in the savings rate
due to the loan repayment crowd-out and credit availability effects is smaller than the increase in
the savings rate from the participation and contribution rate effects. Our calibration yields a very
small 0.06% of pay increase in the 401(k) savings rate from having a loan option under our
pessimistic set of assumptions, and a somewhat larger 0.8% of pay increase under our optimistic
assumptions. If the truth lies somewhere in the middle, then these estimates are inconsistent with
a large negative savings impact of 401(k) loans.
13 See Beshears et al. (2010), Table 5. 14 See Poterba, Venti and Wise (1995), Engen and Gale (2000), and Pence (2001) for differing views on the extent to which 401(k) contributions crowd out other forms of saving. 15 This assumes that the savings crowd-out effect is the same whether a loan is a 401(k) loan or some other type of loan.

16
Our calibration so far suggests that having a loan provisions increases the 401(k) savings
rate. But we have not yet taken account of the loan default effect. This default effect impacts the
stock of wealth in the 401(k) plan rather than the savings rate. As noted above, a generous
estimate of the fraction of 401(k) participants who experience a job separation that results in a
loan default is 2.5%. The Profit Sharing/401(k) Council of American (PSCA, 2009) reports that
401(k) loans represent about 2.5% of total 401(k) balances. So 401(k) loan defaults represent
only about 0.06% (=2.5%*2.5%) of 401(k) wealth. Median 401(k) wealth in 2008 is about
$44,000 (Holden, VanDerhei and Alonso, 2009), which is very close to our assumed annual pay
of $40,000. In our pessimistic scenario, then, loan defaults are just large enough to offset the
small net increase in savings induced by making a loan option available. In the optimistic
scenario, the net increase in savings is large enough that it still dominates any leakage due to
loan defaults.
Of course, as some of the parameter estimates used in our calculations are best guesses,
these conclusions are only suggestive. But they are corroborated to some extent by the research
findings of Li and Smith (2008) who examine the savings behavior and wealth accumulation of
households in the Survey of Consumer Finance (SCF) who do and do not have an outstanding
401(k) loan. Li and Smith find that 401(k) contribution rates are similar for households that do
and do not have an outstanding 401(k) loan, suggesting that the extent of loan repayment crowd-
out may not be large. They also find that households with 401(k) loans have a higher share of
their financial assets in a 401(k) and a lower share in other financial assets, consistent with a
positive contribution rate effect from 401(k) loan availability. Finally, they find no difference in
the rate of growth in household wealth between 1992 and 2004 for households who have access
to 401(k) loans relative to households without access to such loans, suggesting that the overall
effect of 401(k) loans and wealth is small, as with our calibration here.16
VI. Conclusions and Future Research This paper has examined how 401(k) loans compare to other sources of credit and how
401(k) loans affect 401(k) savings. We find that a 401(k) loan dominates credit card borrowing
16 Note that the SCF is not a panel dataset, so the comparison of the rate of growth in wealth from 1992 to 2004 is based on cross-sectional wealth estimates for the households with and without access to 401(k) loans in each of the SCF survey years.

17
in all circumstances. We also find that a 401(k) loan dominates a personal loan, although they
appear to be close substitutes as the assumed return on plan assets increases. A 401(k) loan is
weakly dominated by a home equity loan for consumers with a very high marginal tax rate ( =
35%). At lower tax rates (0% or 15%), a 401(k) loan is preferable to a home equity loan.
In our calibration of the impact of 401(k) loans on overall wealth accumulation, we find
that loans have at worst no impact on wealth accumulation, and at best, they generate a modest
increase in 401(k) savings rate. These results are driven largely by the fact that the positive
effects of loan availability on savings rates are experienced by all participants, whereas only a
minority of savings plan participants actually take out a 401(k) loan. Furthermore, many of the
presumed negative effects of 401(k) loans turn out to be quite small. Loan repayments crowd out
very little active savings, and loan defaults impact only a small fraction of total 401(k) assets.

18
References Appleby, Denise. “Qualified Plan Loans: Guidelines to Operations,”
http://www.investopedia.com/articles/retirement/03/071603.asp (accessed July 10, 2008). Applegarth, Ginger. “Warning: 401(k) Loans are Hazardous to Your Wealth,”
http://moneycentral.msn.com/articles/retire/basics/4714.asp (accessed August 1, 2008). Beshears, John, James J. Choi, David Laibson and Brigitte C. Madrian (2010). “The Availability
and Utilization of 401(k) Loans.” Working Paper. Burton, Jonathan (2008). “Critics Detail the Ills of 401(k) Debit Cards,” Wall Street Journal, July
22, 2008, page D6, http://online.wsj.com/article/SB121668972397572373.html (accessed August 1, 2008).
Engen, Eric M. and William G. Gale, (2000) “The Effects of 401(k) Plans on Household Wealth:
Differences Across Earnings Groups.” NBER Working Paper No. 8032. Cambridge, MA: National Bureau of Economic Research.
General Accounting Office (1997). “401(k) Pension Plans: Loan Provisions Enhance
Participation But May Affect Retirement Income Security for Some.” Washington DC: United Stated General Accounting Office.
Holden, Sarah, Jack VanDerhei and Luis Alonso (2009). “401(k) Plan Asset Allocation, Account
Balances, and Loan Activity in 2008.” Investment Company Institute Research Perspective, Vol. 15, No. 2 (October 2009) http://www.ici.org/pdf/per15-02.pdf (accessed September 27, 2010).
Internal Revenue Service, United States Department of Treasury. “Retirement Plans FAQs
Regarding Loans.” http://www.irs.gov/retirement/article/0,,id=162415,00.html (accessed July 9, 2008)
Joint Committee on Taxation (2008). “Overview of the Federal Tax System As In Effect for
2008,” http://www.house.gov/jct/x-32-08.pdf (accessed August 2, 2008). Li, Geng and Paul A. Smith (2008). “Borrowing from Yourself: 401(k) Loans and Household
Balance Sheets.” Federal Reserve Board. Love, David (2006). “Buffer Stock Saving in Retirement Accounts,” Journal of Monetary
Economics 53(7): 1473-92. Love, David (2007). “What Can the Life-Cycle Model Tell Us about 401(k) Contributions and
Participation?” Journal of Pension Economics and Finance 6(2): 147-185.

19
Mitchell, Olivia, Stephen P. Utkus, and Tongxuan Yang (2007). “Turning Workers Into Savers? Incentives, Liquidity, and Choice in 401(k) Plan Design.” National Tax Journal, 60: 469-89.
Munnell, Alicia, Annika Sunden, and Catherine Taylor (2000). “What Determines 401(k)
Participation and Contributions?” Center for Retirement Research Working Paper 2000-12. Boston, MA: Boston College.
Pence, Karen M. (2001). “401(k)s and Household Saving: New Evidence from the Survey of
Consumer Finances.” Federal Reserve Board of Governors Working Paper. Poterba, James M., Steven F. Venti, and David A Wise (1995). “Do 401(k) Contributions Crowd
Out Other Personal Saving?” Journal of Public Economics 58(1): 1-32. Profit Sharing/401(k) Council of America (2009). “Annual Survey of Profit Sharing and 401(k)
Plans.” Profit Sharing/401(k) Council of America, Chicago, IL. Profit Sharing/401(k) Council of America. “401(k) Loans: When you need your money NOW”
http://www.401k.org/401kloans.html (accessed July 10, 2008) Reeves, Robert, and Pamela Villareal (2008). “401(k) Loans=Retirement Insecurity.” National
Center for Policy Analysis, Brief Analysis No. 615, April 25, 2008. Rosen, Jan (1989). “Your Money; New Rules for 401(k) Plans.” New York Times, September 9,
1989. Shimer, Robert (2005). “The Cyclicality of Hires, Separations, and Job-to-Job Transitions.”
Federal Reserve Bank of St. Louis Review, July/August 2005, 87(4): 483-507. Sunden, Annika, and Brian Surette (2000). “Household Borrowing from 401(k) Plans.” Center
for Retirement Research at Boston College. Transamerica Center for Retirement Studies (2008). “9th Annual Transamerica Retirement
Survey: Workforce.” http://www.transamericacenter.org/resources/HarrisWorkerReport.pdf (accessed September 11, 2008).
Weller, Christian E., and Jeffrey B. Wenger (2008). “Robbing Tomorrow to Pay for Today,”
Center for American Progress, Washington, DC.
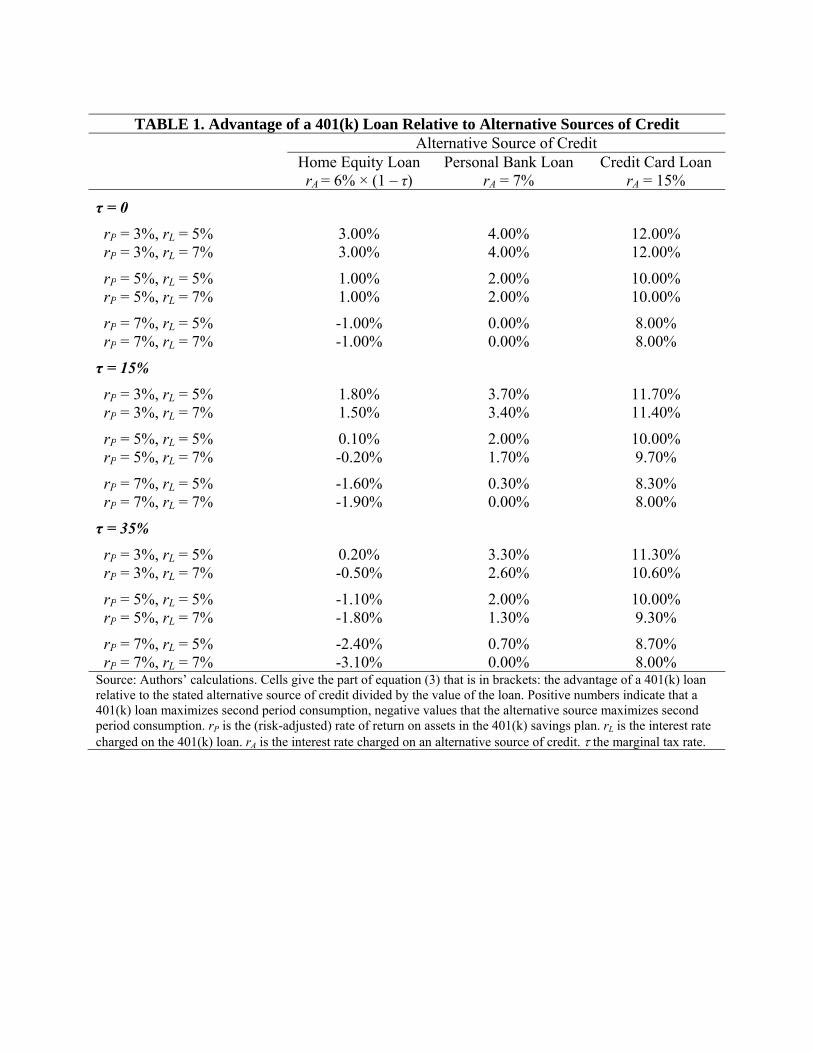
TABLE 1. Advantage of a 401(k) Loan Relative to Alternative Sources of Credit
Alternative Source of Credit Home Equity Loan
rA = 6% × (1 – τ) Personal Bank Loan
rA = 7% Credit Card Loan
rA = 15%
τ = 0
rP = 3%, rL = 5% 3.00% 4.00% 12.00% rP = 3%, rL = 7% 3.00% 4.00% 12.00%
rP = 5%, rL = 5% 1.00% 2.00% 10.00% rP = 5%, rL = 7% 1.00% 2.00% 10.00%
rP = 7%, rL = 5% -1.00% 0.00% 8.00% rP = 7%, rL = 7% -1.00% 0.00% 8.00%
τ = 15%
rP = 3%, rL = 5% 1.80% 3.70% 11.70% rP = 3%, rL = 7% 1.50% 3.40% 11.40%
rP = 5%, rL = 5% 0.10% 2.00% 10.00% rP = 5%, rL = 7% -0.20% 1.70% 9.70%
rP = 7%, rL = 5% -1.60% 0.30% 8.30% rP = 7%, rL = 7% -1.90% 0.00% 8.00%
τ = 35%
rP = 3%, rL = 5% 0.20% 3.30% 11.30% rP = 3%, rL = 7% -0.50% 2.60% 10.60%
rP = 5%, rL = 5% -1.10% 2.00% 10.00% rP = 5%, rL = 7% -1.80% 1.30% 9.30%
rP = 7%, rL = 5% -2.40% 0.70% 8.70% rP = 7%, rL = 7% -3.10% 0.00% 8.00% Source: Authors’ calculations. Cells give the part of equation (3) that is in brackets: the advantage of a 401(k) loan relative to the stated alternative source of credit divided by the value of the loan. Positive numbers indicate that a 401(k) loan maximizes second period consumption, negative values that the alternative source maximizes second period consumption. rP is the (risk-adjusted) rate of return on assets in the 401(k) savings plan. rL is the interest rate charged on the 401(k) loan. rA is the interest rate charged on an alternative source of credit. the marginal tax rate.

21
TABLE 2. Potential Savings Impact of a 401(k) Loan Option Pessimistic
assumptions Optimistic
assumptions
Assumptions
No-loan participation rate 60% 70% No-loan contribution rate 6% 6% 401(k) enrollment effect None + 6 percentage points Contribution rate effect +0.6% of pay +1.0% of pay Savings crowd out 50% 25% Repayment crowd out 25% 10% Credit availability effect 50% 10%
Impact on Savings
Induced savings effect +0.18% of pay +0.84% of pay Consumption leakage effect -0.12% of pay -0.01% of pay
TOTAL IMPACT (excluding default effects) +0.06% of pay +0.83% of pay
Source: Authors’ calculations. See text for details.

22
Source: Authors’ calculations
Source: Authors’ calculations

23
FIGURE 2
Source: Authors’ calculations.