Homelessness among Veterans with Serious Mental Illness Public Health Impact and Outreach
November 2017 Department for Communities and Local Government
The impact evaluation of the London Homelessness Social Impact Bond
2
© Crown copyright, 2017
Copyright in the typographical arrangement rests with the Crown.
You may re-use this information (not including logos) free of charge in any format or medium, under the terms of the Open Government Licence. To view this licence,http://www.nationalarchives.gov.uk/doc/open-government-licence/version/3/ or write to the Information Policy Team, The National Archives, Kew, London TW9 4DU, or email: [email protected].
This document/publication is also available on our website at www.gov.uk/dclg
If you have any enquiries regarding this document/publication, complete the form at http://forms.communities.gov.uk/ or write to us at:
Department for Communities and Local Government Fry Building 2 Marsham Street London SW1P 4DF Telephone: 030 3444 0000
For all our latest news and updates follow us on Twitter: https://twitter.com/CommunitiesUK
November 2017
ISBN: 978-1-4098-5134-9
3
Acknowledgments I would like to thank Ian Canadine (St Mungo’s) for his assistance in properly understanding the CHAIN data and David Eastwood (GLA) for his assistance in understanding the context behind some of the outcomes. I would also like to thank a number of my analytical colleagues who have helped with the analysis – in particular, Ricky Taylor, Angus Hawkins, Lan-Ho Man, Liucija Latanauskaite and Phil Lewis. And finally, I am very grateful to Susan Purdon for reviewing the draft report and providing the support and advice needed to improve it.
Lucy Spurling, DCLG
4
Contents
1 Summary 5
2 The London Homelessness Social Impact Bond 9
3 Evaluations of the London Homelessness Social Impact Bond 10
4 The treatment and comparison groups 11
5 Data 13
6 Characteristics of the comparison groups and SIB cohort 15
6.1 The 2010 comparison group 16
6.2 The combined 2010 and 2011 comparison group 17
6.3 The SIB intervention group 18
6.4 Differences between the groups 19
7 Propensity Score Matching 23
8 Results 25
9 Discussion of the results of the impact evaluation and the findings of the qualitative evaluation 28
10 Conclusion 34
Technical annex 36
Data cleaning and missing data 36
The outputs from the PSM process 37
PSM analysis and results comparing the 2010 and 2011 groups and the 2011 group with the SIB group 44
5
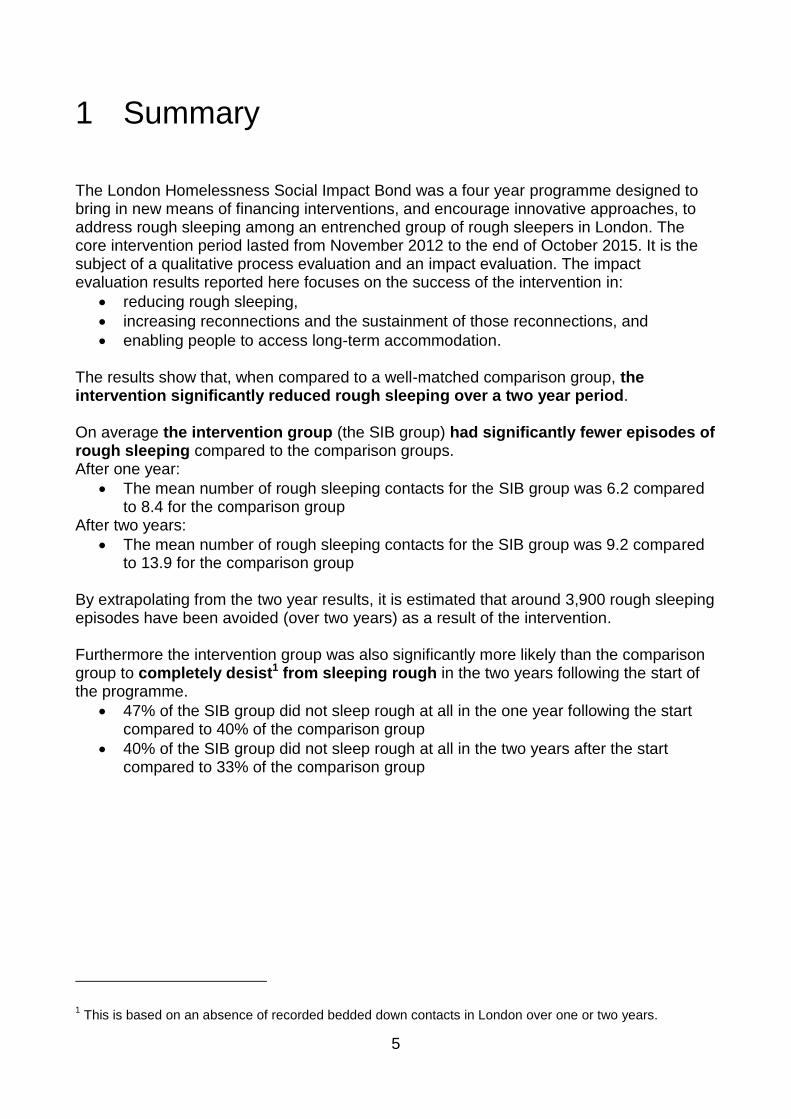
1 Summary
The London Homelessness Social Impact Bond was a four year programme designed to bring in new means of financing interventions, and encourage innovative approaches, to address rough sleeping among an entrenched group of rough sleepers in London. The core intervention period lasted from November 2012 to the end of October 2015. It is the subject of a qualitative process evaluation and an impact evaluation. The impact evaluation results reported here focuses on the success of the intervention in:
reducing rough sleeping,
increasing reconnections and the sustainment of those reconnections, and
enabling people to access long-term accommodation. The results show that, when compared to a well-matched comparison group, the intervention significantly reduced rough sleeping over a two year period. On average the intervention group (the SIB group) had significantly fewer episodes of rough sleeping compared to the comparison groups. After one year:
The mean number of rough sleeping contacts for the SIB group was 6.2 compared to 8.4 for the comparison group
After two years:
The mean number of rough sleeping contacts for the SIB group was 9.2 compared to 13.9 for the comparison group
By extrapolating from the two year results, it is estimated that around 3,900 rough sleeping episodes have been avoided (over two years) as a result of the intervention. Furthermore the intervention group was also significantly more likely than the comparison group to completely desist1 from sleeping rough in the two years following the start of the programme.
47% of the SIB group did not sleep rough at all in the one year following the start compared to 40% of the comparison group
40% of the SIB group did not sleep rough at all in the two years after the start compared to 33% of the comparison group
1 This is based on an absence of recorded bedded down contacts in London over one or two years.
6
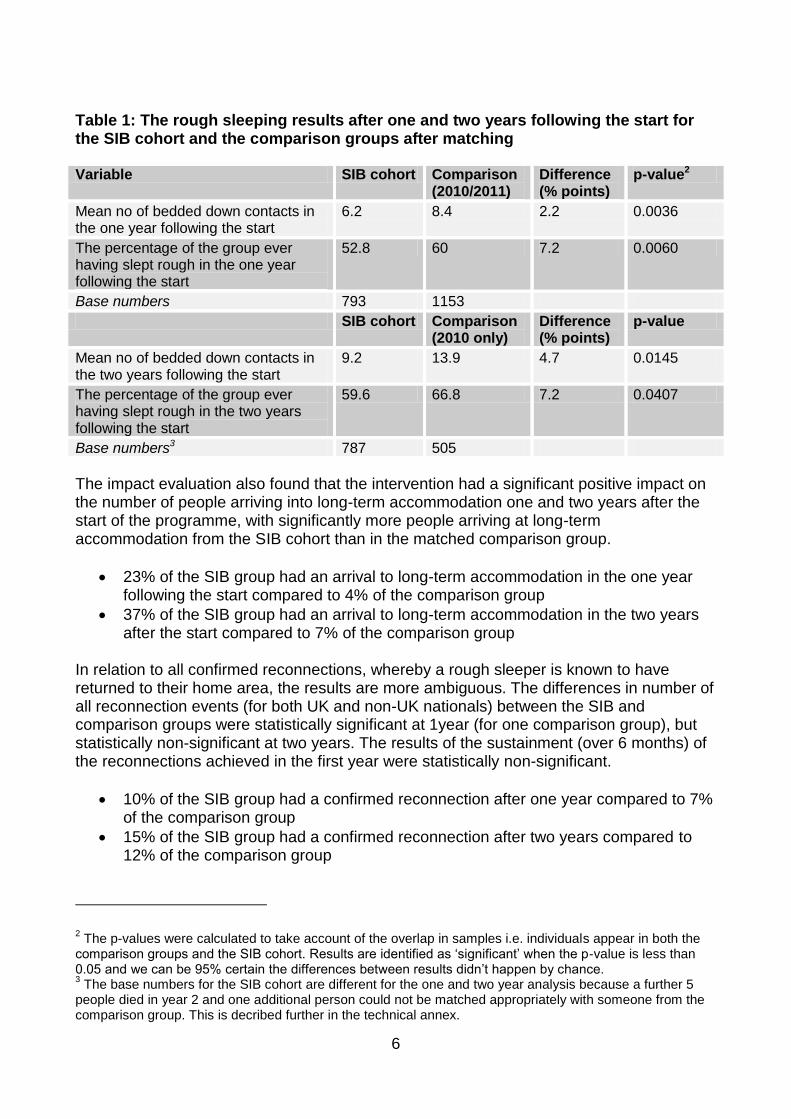
Table 1: The rough sleeping results after one and two years following the start for the SIB cohort and the comparison groups after matching Variable SIB cohort Comparison
(2010/2011) Difference (% points)
p-value2
Mean no of bedded down contacts in the one year following the start
6.2 8.4 2.2 0.0036
The percentage of the group ever having slept rough in the one year following the start
52.8 60 7.2 0.0060
Base numbers 793 1153
SIB cohort Comparison (2010 only)
Difference (% points)
p-value
Mean no of bedded down contacts in the two years following the start
9.2 13.9 4.7 0.0145
The percentage of the group ever having slept rough in the two years following the start
59.6 66.8 7.2 0.0407
Base numbers3 787 505
The impact evaluation also found that the intervention had a significant positive impact on the number of people arriving into long-term accommodation one and two years after the start of the programme, with significantly more people arriving at long-term accommodation from the SIB cohort than in the matched comparison group.
23% of the SIB group had an arrival to long-term accommodation in the one year following the start compared to 4% of the comparison group
37% of the SIB group had an arrival to long-term accommodation in the two years after the start compared to 7% of the comparison group
In relation to all confirmed reconnections, whereby a rough sleeper is known to have returned to their home area, the results are more ambiguous. The differences in number of all reconnection events (for both UK and non-UK nationals) between the SIB and comparison groups were statistically significant at 1year (for one comparison group), but statistically non-significant at two years. The results of the sustainment (over 6 months) of the reconnections achieved in the first year were statistically non-significant.
10% of the SIB group had a confirmed reconnection after one year compared to 7% of the comparison group
15% of the SIB group had a confirmed reconnection after two years compared to 12% of the comparison group
2 The p-values were calculated to take account of the overlap in samples i.e. individuals appear in both the
comparison groups and the SIB cohort. Results are identified as ‘significant’ when the p-value is less than 0.05 and we can be 95% certain the differences between results didn’t happen by chance. 3 The base numbers for the SIB cohort are different for the one and two year analysis because a further 5
people died in year 2 and one additional person could not be matched appropriately with someone from the comparison group. This is decribed further in the technical annex.
7
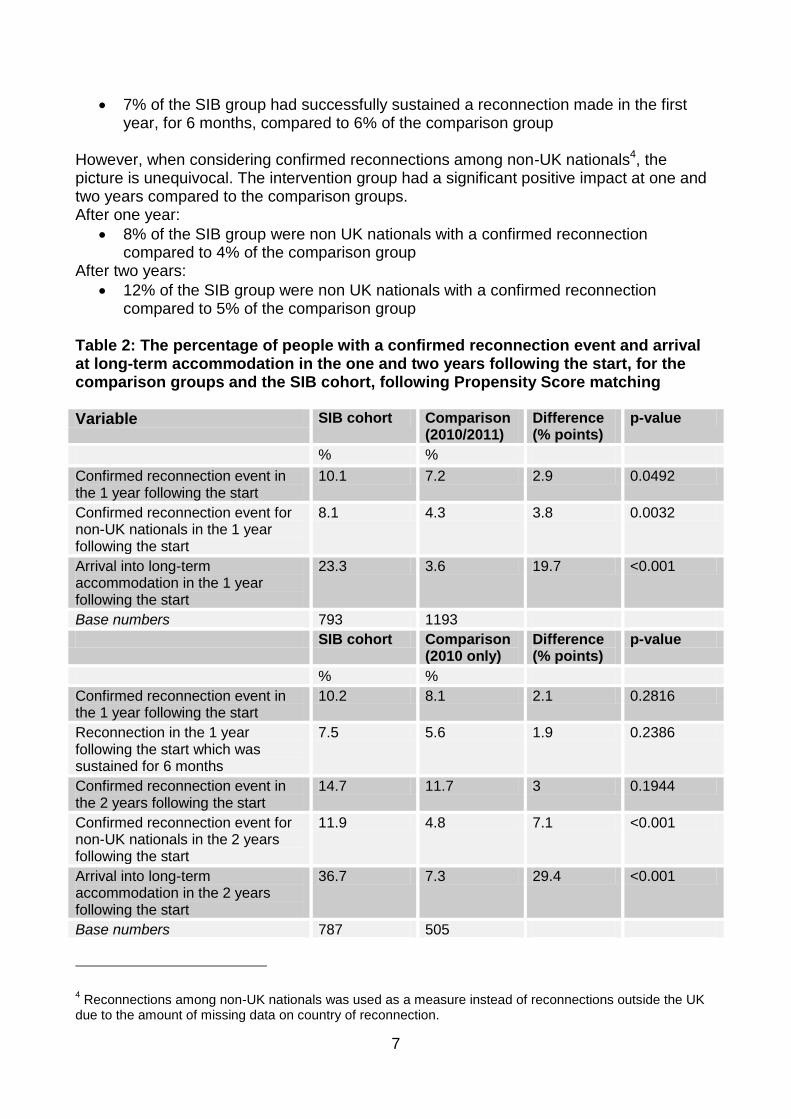
7% of the SIB group had successfully sustained a reconnection made in the first year, for 6 months, compared to 6% of the comparison group
However, when considering confirmed reconnections among non-UK nationals4, the picture is unequivocal. The intervention group had a significant positive impact at one and two years compared to the comparison groups. After one year:
8% of the SIB group were non UK nationals with a confirmed reconnection compared to 4% of the comparison group
After two years:
12% of the SIB group were non UK nationals with a confirmed reconnection compared to 5% of the comparison group
Table 2: The percentage of people with a confirmed reconnection event and arrival at long-term accommodation in the one and two years following the start, for the comparison groups and the SIB cohort, following Propensity Score matching Variable SIB cohort Comparison
(2010/2011) Difference (% points)
p-value
% %
Confirmed reconnection event in the 1 year following the start
10.1 7.2 2.9 0.0492
Confirmed reconnection event for non-UK nationals in the 1 year following the start
8.1 4.3 3.8 0.0032
Arrival into long-term accommodation in the 1 year following the start
23.3 3.6 19.7 <0.001
Base numbers 793 1193
SIB cohort Comparison (2010 only)
Difference (% points)
p-value
% %
Confirmed reconnection event in the 1 year following the start
10.2 8.1 2.1 0.2816
Reconnection in the 1 year following the start which was sustained for 6 months
7.5 5.6 1.9 0.2386
Confirmed reconnection event in the 2 years following the start
14.7 11.7 3 0.1944
Confirmed reconnection event for non-UK nationals in the 2 years following the start
11.9 4.8 7.1 <0.001
Arrival into long-term accommodation in the 2 years following the start
36.7 7.3 29.4 <0.001
Base numbers 787 505
4 Reconnections among non-UK nationals was used as a measure instead of reconnections outside the UK
due to the amount of missing data on country of reconnection.
8
The qualitative evaluation generally supports the findings of the impact evaluation. However, it does show that the providers largely did not meet the quarterly targets set for rough sleeping, or the overall targets5 for reconnections or arrivals into long-term accommodation (the latter target was only very narrowly missed overall, following very strong performance in year one, but underperformance in year two by one provider and in year three by both providers). The impact study findings suggest that targets were stretching. Whilst it is possible that the difficulty of reducing rough sleeping6 and achieving positive reconnection and long-term accommodation outcomes among a complex and entrenched group was underestimated, the SIB was designed to test what was possible through an innovative approach. Providers set their own targets as part of the competitive tendering process and this may well have contributed to the setting of ambitious targets. Nevertheless, the qualitative evaluation reports that social investors were happy with the return on their investment and providers were proud of their achievements. While the findings from the impact evaluation are very positive, and clearly show that the intervention was effective against key outcomes, they do not necessarily prove that social investment and payment incentives drove the results. This is because it was not possible, within this impact evaluation, to disentangle the effect of the social investment model from the intervention service. However, the qualitative evaluation suggests that the Payment by Result (PbR) element of the SIB contract had a greater impact on the providers than the investors’ involvement. Testing this further could be an area for future research.
5 The combined targets for years one to three.
6 It is also important to note that the rough sleeping outcome measures for this evaluation are not exactly the
same as the rough sleeping target measure for the intervention
9
2 The London Homelessness Social Impact Bond
The London Homelessness Social Impact Bond was a four year programme commissioned by the Greater London Assembly, and funded by the Department of Communities and Local Government (DCLG). The core delivery period lasted for three years from 1st November 2012-31st October 20157. It was designed to bring in new means of financing interventions, and encourage innovative approaches, to provide personalised support to among an entrenched group of rough sleepers in London. Outcomes were specified in detail, but not the means of achieving them. Social Investors provided the up-front investment needed for two providers to deliver interventions to 830 rough sleepers. The interventions were designed around a Navigator approach, whereby key workers adopted a personalised and flexible approach, supporting the cohort to access existing provision and achieve sustained long-term outcomes. Providers were paid for the results (Payment by Result) they achieved in relation to five core objectives – reducing rough sleeping, achieving long-term sustained accommodation outcomes, achieving sustained reconnections8 where appropriate, improving employability, and employment and health outcomes. Social investors received a return on their investment dependent on the results achieved.
7 There was an additional 12 months payment tail to allow final outcomes to be recognised
8 Providers were paid for reconnection outcomes for people returning to their (non UK) home country, where
these were confirmed.
10
3 Evaluations of the London Homelessness Social Impact Bond
The London Homelessness Social Impact Bond is the subject of a qualitative process evaluation and an impact evaluation. In 2013, DCLG commissioned a qualitative process evaluation of the London Homelessness Social Impact Bond, which was undertaken by ICF. The interim reports9 and final report10 from the qualitative evaluation explore the development and commissioning of the Social Impact Bond (SIB) and use of Payment by Result (PbR), and provider performance in relation to the five core objectives for which targets were set. The qualitative evaluation found that while many targets were not met, providers were proud of their achievements and investors were happy with the return on their investment. This report presents the findings of the Impact Evaluation, which was undertaken internally by Department analysts in 2016 before being peer reviewed by an external analyst. The Impact Evaluation assesses whether the intervention (rather than the mode of finance11) has been successful in:
reducing rough sleeping,
increasing reconnections and the sustainment of those reconnections12, and
enabling people to access long-term accommodation over and above what would have happened anyway (the counterfactual or the outcomes achieved by the comparison group). An assessment of impact in relation to employment and health is not possible because data on employment and health outcomes is not routinely recorded for all rough sleepers.
9https://www.gov.uk/government/uploads/system/uploads/attachment_data/file/357785/Qualitative_Evaluatio
n_of_the_London_Homelessness_SIB.pdf https://www.gov.uk/government/publications/qualitative-evaluation-of-the-london-homelessness-social-impact-bond-second-interim-report 10
Qualitative Evaluation of the London Homelessness Social Impact Bond Final Report 11
The process evaluation explores the role and contribution of social finance and payment by result (PbR) within the intervention. It suggests that the the PbR element had a greater impact on the provider organisaitons than the investors’ involvement. 12
People are recorded in CHAIN as being ‘reconnected’ when they are known to return to their home area, both within and outside the UK. Providers were only paid for non-UK reconnections, but both non-UK and UK reconnections were examined for the purposes of this evaluation. The evaluation measures sustainment in the same way to that used for payment purposes: through an absence of recorded rough sleeping contacts in the six months following the reconnection.
11
4 The treatment and comparison groups
The London Homelessness Social Impact Bond aimed to improve the outcomes of 830 individuals. These 830 people were selected because, on 31st October 2012, they met the following criteria:
Recorded sleeping rough or in a rough sleeping hostel in London between July-September 2012, and
Recorded sleeping rough in London at least 6 times in the previous two years. The comparison groups were selected using the same criteria and time frame but in relation to different years. 542 people were selected because they had been:
Recorded sleeping rough or in a rough sleeping hostel in London between July-September 2010, and
Recorded sleeping rough in London at least 6 times in the previous two years (2008-2010).
660 people were selected because they had been:
Recorded sleeping rough or in a rough sleeping hostel in London between July-September 2011, and
Recorded sleeping rough in London at least 6 times in the previous two years (2009-2011).
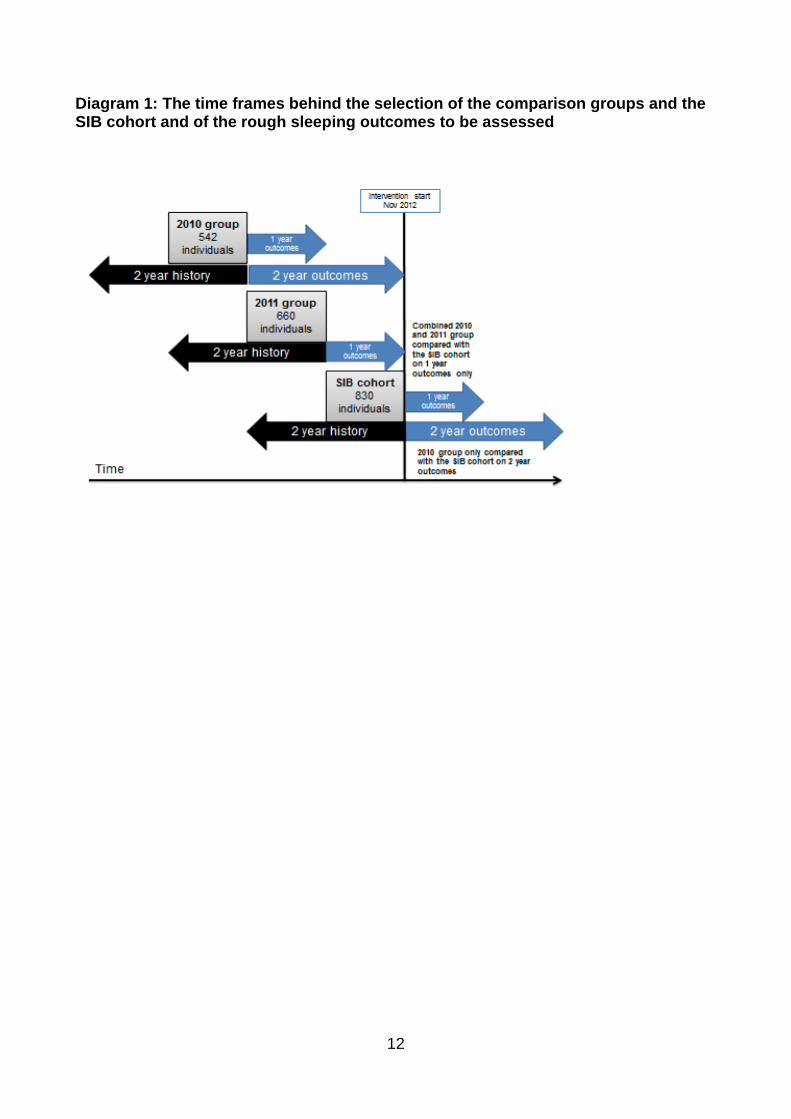
The method of drawing the comparison group means that individuals appear in multiple groups if they meet the criteria for different years13. It is necessary to include all the people who meet the criteria for the relevant year, rather than allocate them to either the SIB cohort or a comparison group, although this may seem counterintuitive. If individuals are not included in multiple groups, and for example, none of the SIB cohort appeared in the 2010 or 2011 comparison groups, the results would be heavily biased because people still sleeping rough in 2012, who would have poor outcomes, would be excluded from the comparison groups. However, having people appear in multiple groups does constrain the time period over which outcomes can be examined. It is possible to assess the impact achieved on outcomes at one year through comparisons with the combined 2010 and 2011 comparison group against the SIB cohort but assess the impact on two year outcomes using comparisons with the 2010 comparison group only. This prevents any comparison group outcomes overlapping with the time period of the intervention. This is presented diagrammatically below.
13
122 of the SIB cohort are also included in the 2010 comparison group and 292 in the 2011 comparison group. 87 of the SIB cohort appear in all three groups.
12
Diagram 1: The time frames behind the selection of the comparison groups and the SIB cohort and of the rough sleeping outcomes to be assessed
13
5 Data
The data from which the SIB cohort and the comparison groups were identified comes from the CHAIN14 database. DCLG received an anonymised data set after requesting special access to use the data. CHAIN is a database used by staff working with homeless people across London to record when people are seen rough sleeping (described as bedded down15 on the streets). It is also used to capture their demographic details, the outcomes of need assessments (made by homelessness staff), information such as their past experience of institutions (prison, care, the armed forces), as well as other outcomes, including stays in accommodation and reconnections. This dataset provides a wealth of information on rough sleepers in London, which is largely unavailable elsewhere. However, due to the constraints of the data collection and recording process, there will always be some errors and inconsistencies associated with the data. This should be recognised when interpreting the results of this study. Further information on the data held on CHAIN is available from the St Mungo’s website16. The key information for an assessment of the impact of the SIB on rough sleeping is the number of recorded bedded down contacts for individuals from their start/pseudo start date over one or two years17. A pseudo-start date is a date identified as an appropriate time from which to measure outcomes for the comparison group so they can be compared to outcomes achieved by the treatment group from the start date of the intervention. The start date for all individuals in the SIB cohort for the purpose of this assessment is 1st November 2012, when the intervention was launched officially. Individuals in the 2010 comparison group were given a pseudo-start date of 1st November 2010 and individuals in the 2011 comparison group were given a pseudo-start date of 1st November 2011. Bedded down contacts were counted over the one/two years following the relevant start date to generate a mean number of contacts for the comparison and SIB groups. Whether someone had ever slept rough in the one or two years after the start/pseudo-start was also calculated. The accuracy of this information is dependent upon an individual being seen on the street by an outreach worker and being recorded as bedded down. The key data for measuring reconnections are records of ‘confirmed reconnections’18 in CHAIN. Confirmed reconnections are recorded when it is known that someone has returned to their home area, whether within or outside the UK. Reconnection advice and events are routinely recorded for homeless individuals in London but additional evidence
14
CHAIN stands for the Combined Homelessness and Information Network. It is commissioned and funded by the Mayor of London and managed by St Mungo’s. 15
Bedded down contacts are defined as seeing someone sleeping, or readying for a nights’ sleep on the street, as compared with being on the street drinking or begging. Only bedded down contacts were included in the rough sleeping counts. The terms ‘rough sleeping’ and ‘bedded down contact’ are used interchangeably in this report. 16
http://www.mungos.org/chain/information_chain 17
Data derived from the routine recording of bedded down contacts was also the basis for outcome payments to providers, in contrast to other payment outcomes which required additional evidence 18
It is also recorded when a reconnection has been advised.
14
was required for payment purposes19. It is not possible to identify which outcomes recorded on CHAIN have been verified. The measure of sustainment of reconnections was based upon an absence of recorded bedded down contacts, accommodation stays or further reconnection events for an individual over the six months after their confirmed reconnection. The evaluation assessed sustainment from the last confirmed reconnection event in the first year and based it upon an absence of bedded down contacts. Accommodation outcomes are routinely recorded on CHAIN when they are known, however, the level of recording quality and/or staff knowledge of someone’s arrival into accommodation may differ according to the type of accommodation being accessed. For example, when an individual enters a staffed hostel, it seems very likely that their arrival will be entered into CHAIN, as they will come into contact with members of staff. The date they leave a hostel is also likely to be entered, although this field is more poorly completed than that recording their arrival date. In comparison, if someone enters long-term private accommodation for example, it is possible that no homelessness worker will know about it unless they have helped the individual to access it. Arrival dates may be entered if the accommodation has been found with assistance, but leaving dates are generally even less likely to be known or recorded. For purposes of outcome verification for payment for the SIB intervention, additional evidence of entry into, and sustainment of long-term accommodation was required. However, accommodation outcomes can be recorded on CHAIN without this additional evidence and it is not possible to identify which have been verified. Although the results of entry (not sustainment20) into long-term accommodation21 are presented, some caution should be exercised when drawing conclusions from them. Data on people’s demographics, past experiences and need assessments was also used as part of the propensity score matching process. This process is described in more detail in section 7, but the data relies upon homelessness workers finding out about peoples’ past experiences and recording that information, and making an assessment of their needs and recording that assessment. The recording quality of this data, and in particular the data on need assessments22, has improved over time. Where need assessments and data on past experiences were missing, it was necessary to impute data. This is described in more detail in the technical annex, but could lead to biases.
19
However, it should be noted that payments were only received for reconnections of non-UK nationals with a confirmed reconnection outside the UK. The impact evaluation considered all confirmed reconnection outcomes – within and outside the UK as well as looking separately at reconnections of non-UK nationals. A small number of non-UK nationals with a confirmed reconnection were actually reconnected within the UK e.g for one year outcomes, 2 out of 65 non-UK nationals in the SIB group with a confirmed reconnection were reconnected in the UK. The figure is 7 out of 48 non-UK nationals reconnected from the 2010/2011 comparison group. A measure of reconnections outside of the UK was not used because country of reconnection has not always been recorded. 20
Levels of completion of the field of ‘leaving date’ for accommodation was assessed as being too poor to allow an assessment of the impact of the SIB intervention on sustainment. 21
Long-term accommodation is defined as accommodation with a tenancy or living with friends or family (with own bedroom) or in a care home (where this is for life). 22
For example, levels of needs were not originally recorded, with no differentiation between high, medium and low needs.
15
6 Characteristics of the comparison groups and SIB cohort
Rather than simply making a comparison of the mean number of contacts/reconnections/accommodation arrivals between the two groups, it was hypothesised that, in addition to the intervention, an individuals’ demographics and history might affect their rough sleeping outcomes. Therefore, it was deemed important to be able to control for any differences between the comparison groups and the SIB cohort on characteristics and past experiences using the statistical method Propensity Score Matching (PSM). Before outlining the PSM method, the characteristics of the Comparison groups and SIB cohort are described below. In order to explore this (and carry out the matching process), a number of variables were derived from the data, including:
the number of bedded down contacts in the one year prior to the start/pseudo-start date,
the number of bedded down contacts in the two years prior to the start/pseudo-start date,23
the number of bedded down contacts in total in the years prior to the start/pseudo-start date,
the number of months between the start/pseudo-start date and the date first recorded as rough sleeping,
age at the start/pseudo-start date,24
whether someone had ever been identified as having a drug need prior to their start/pseudo-start date,
whether someone had ever been identified as having a mental health need prior to their start/pseudo-start date,
whether someone had ever been identified as having an alcohol need prior to their start/pseudo-start date,25
whether or not they were from the UK,
whether or not they were white,
whether or not they had experience of prison,
whether or not they had experience of care.
23
This count is not exactly the same as the count made for selection purposes because it runs from two years up until the end of October, rather than two years prior to the end of September
(used for selection)
There are a small number of cases (7 in 2010 comparison group, 6 in 2011 comparison group and 15 in the SIB group) for whom this measure shows a count of less than 6. This may be due to the slightly different time period used or recording error. For example, one individual was included in the SIB intervention because of a case of mistaken identity. 24
This variable was derived by St Mungo’s prior to DCLG receiving the data so it was not necessary for DCLG to request information on dates of birth. 25
Not everyone had an assessment prior to their start date. For the purposes of Propensity Score Matching, where there was no assessment, this was noted as missing and an imputed value of 0 (no need) was given. 82 people from the 2010 comparison group had a missing assessment, 150 from the 2010/2011 comparison group and 72 from the SIB cohort. If someone had an assessment but the field for a particular need was blank (as supposed to being filled in with either no need or a need) this was coded as 0, but not missing.
16
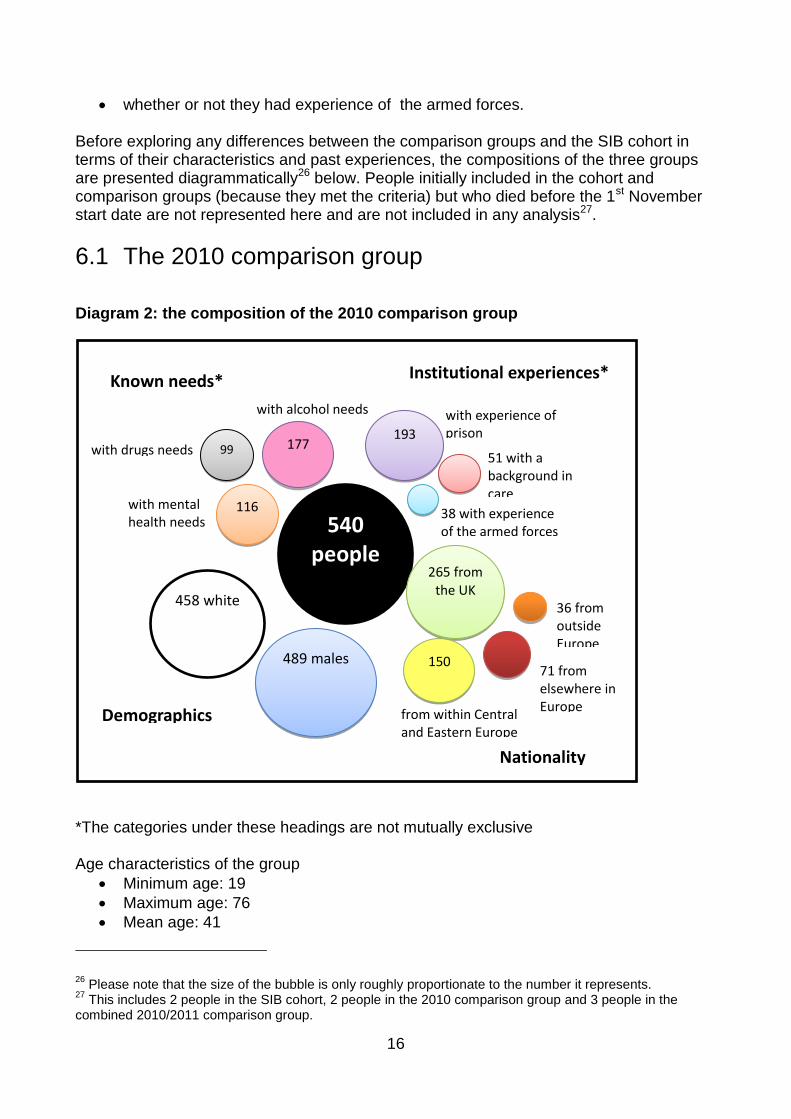
whether or not they had experience of the armed forces. Before exploring any differences between the comparison groups and the SIB cohort in terms of their characteristics and past experiences, the compositions of the three groups are presented diagrammatically26 below. People initially included in the cohort and comparison groups (because they met the criteria) but who died before the 1st November start date are not represented here and are not included in any analysis27.
6.1 The 2010 comparison group
Diagram 2: the composition of the 2010 comparison group *The categories under these headings are not mutually exclusive Age characteristics of the group
Minimum age: 19
Maximum age: 76
Mean age: 41
26
Please note that the size of the bubble is only roughly proportionate to the number it represents. 27
This includes 2 people in the SIB cohort, 2 people in the 2010 comparison group and 3 people in the combined 2010/2011 comparison group.
540 people
458 white
489 males
265 from the UK
150
116
99
177
36 from outside Europe
71 from elsewhere in Europe
from within Central and Eastern Europe
51 with a background in care
38 with experience of the armed forces
with mental health needs
with drugs needs
with experience of prison
with alcohol needs
Institutional experiences*
Nationality
Known needs*
Demographics
193
17
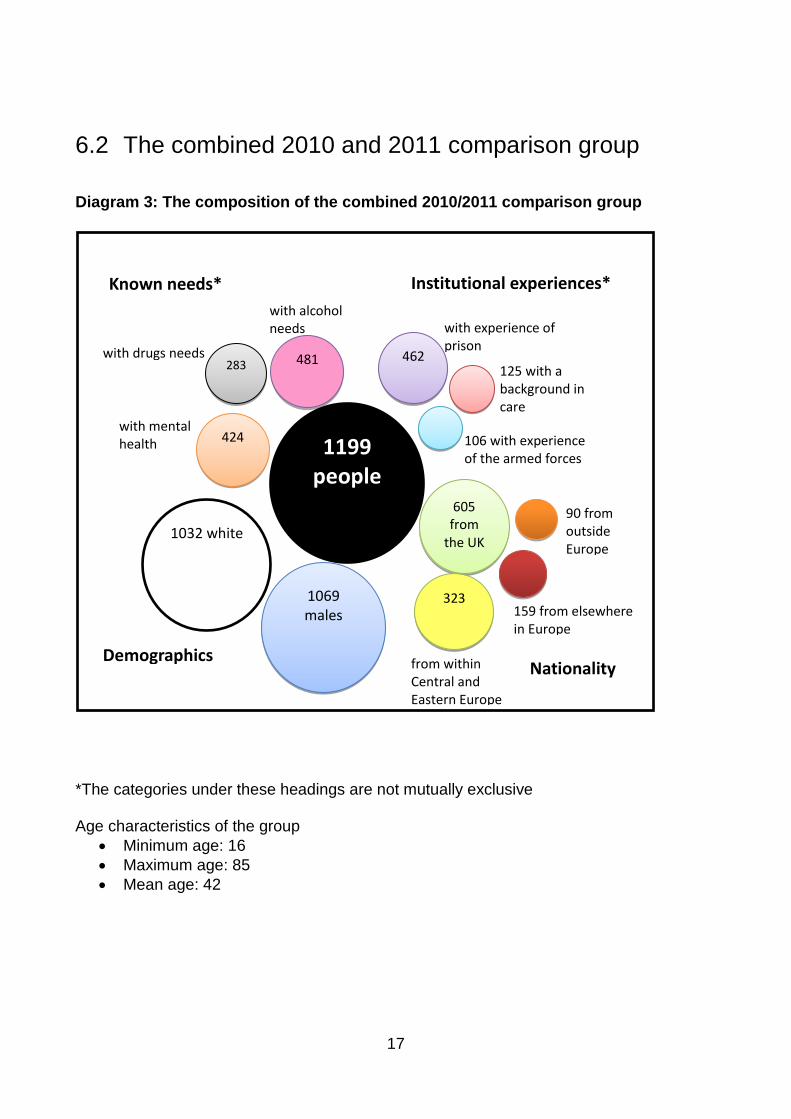
6.2 The combined 2010 and 2011 comparison group
Diagram 3: The composition of the combined 2010/2011 comparison group *The categories under these headings are not mutually exclusive Age characteristics of the group
Minimum age: 16
Maximum age: 85
Mean age: 42
1199 people
1032 white
1069 males
605 from
the UK
323
462
424
283
481
90 from outside Europe
159 from elsewhere in Europe
from within Central and Eastern Europe
125 with a background in care
106 with experience of the armed forces
with mental health needs
with drugs needs
with experience of prison
with alcohol needs
Institutional experiences*
Nationality
Known needs*
Demographics
18
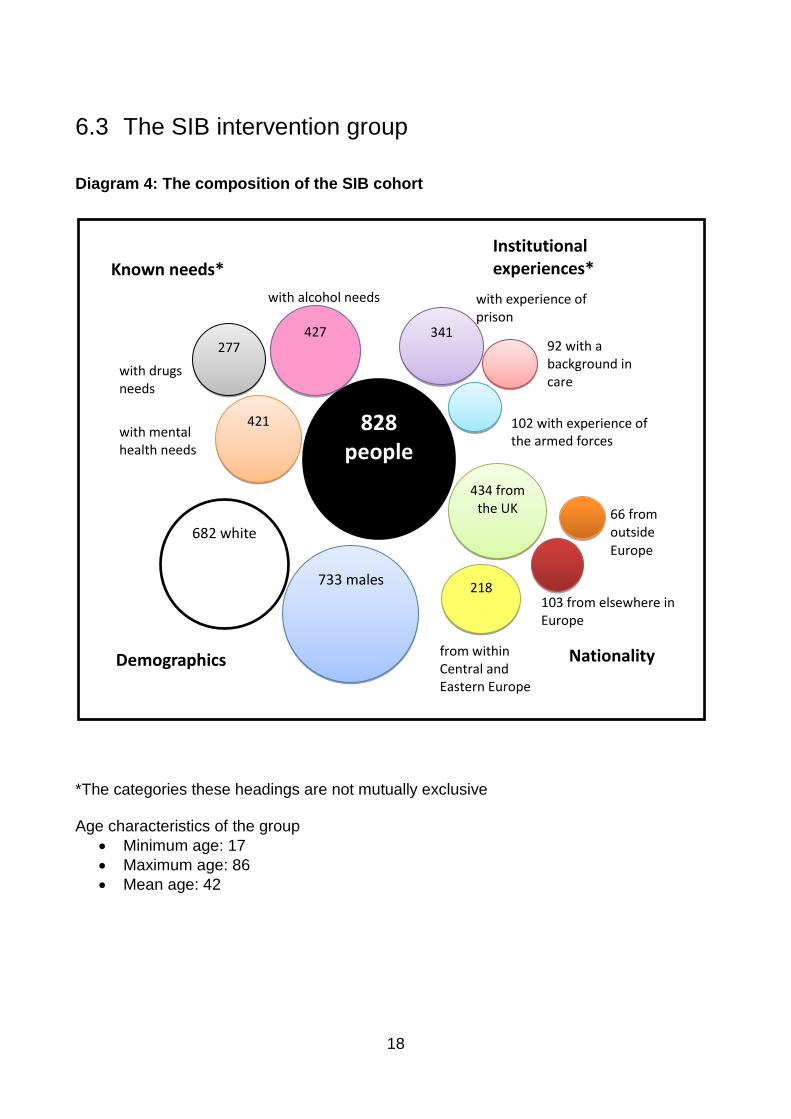
6.3 The SIB intervention group
Diagram 4: The composition of the SIB cohort *The categories these headings are not mutually exclusive Age characteristics of the group
Minimum age: 17
Maximum age: 86
Mean age: 42
*These are not mutually exclusive
828 people
682 white
733 males
434 from the UK
218
341
421
277
427
66 from outside Europe
103 from elsewhere in Europe
from within Central and Eastern Europe
92 with a background in care
102 with experience of the armed forces
with mental health needs
with drugs needs
with experience of prison
with alcohol needs
Institutional experiences*
Nationality
Known needs*
Demographics
19
6.4 Differences between the groups
Descriptive analysis shows that there are significant differences between the comparison groups and the SIB cohort in terms of their characteristics, and in particular, the proportion of the groups with an identified mental health, drug or alcohol need. This suggests either that more/better need assessments have been carried out over time and/or the recording of need assessments have improved or that there are fundamental differences between the groups in terms of their level of need. Annual reports on the CHAIN data covering all rough sleepers suggest that alcohol support needs dropped over the three years from 2010-11 to 2012-13, drugs support needs also dropped slightly over the three years and mental health needs remained similar from 2012-13 from 2011-1228, suggesting there are fundamental differences between the groups. It is not surprising that the combined 2010/2011 comparison group more closely matches the SIB group as there is a bigger overlap in individuals appearing in both the 2011 comparison group and the SIB cohort (292) than in the 2010 comparison group and the SIB cohort (122) and the majority of the characteristics (with the exception of the need assessments) are recorded only once in the data i.e. there is no recorded change over time.
28
Street to Home Annual Report 2012-13 http://www.mungos.org/chain/street_home_annual_reports
20
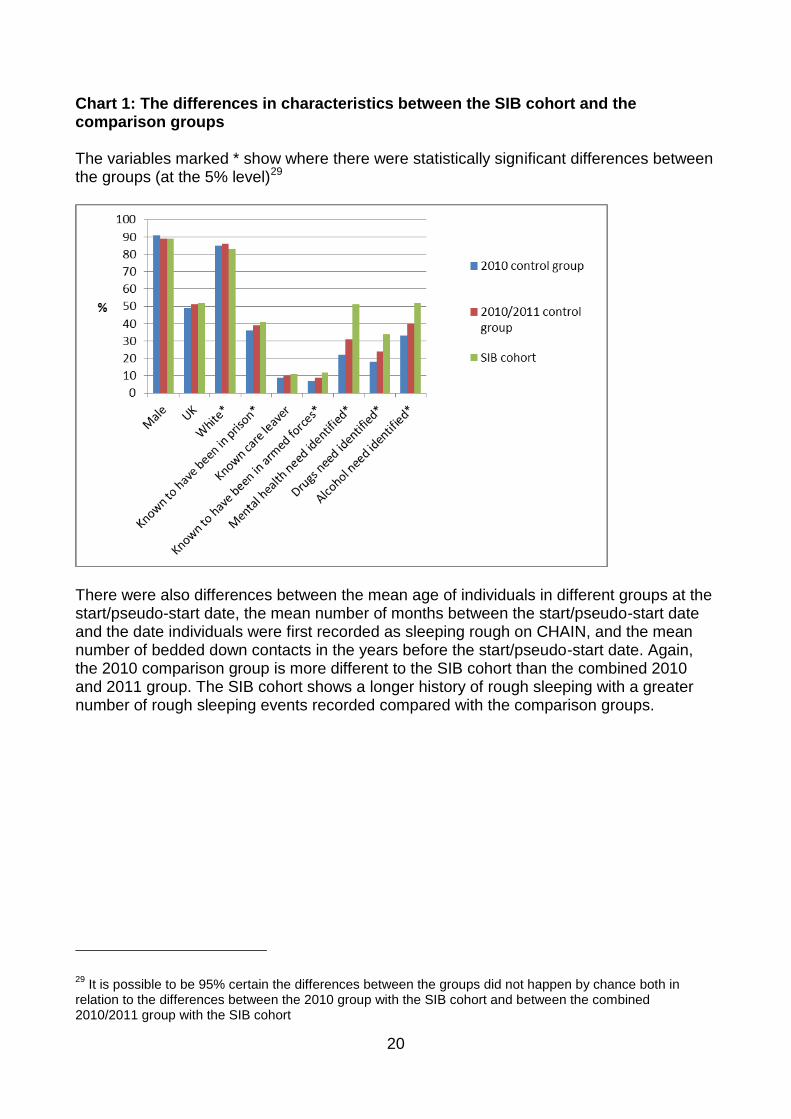
Chart 1: The differences in characteristics between the SIB cohort and the comparison groups The variables marked * show where there were statistically significant differences between the groups (at the 5% level)29
There were also differences between the mean age of individuals in different groups at the start/pseudo-start date, the mean number of months between the start/pseudo-start date and the date individuals were first recorded as sleeping rough on CHAIN, and the mean number of bedded down contacts in the years before the start/pseudo-start date. Again, the 2010 comparison group is more different to the SIB cohort than the combined 2010 and 2011 group. The SIB cohort shows a longer history of rough sleeping with a greater number of rough sleeping events recorded compared with the comparison groups.
29
It is possible to be 95% certain the differences between the groups did not happen by chance both in relation to the differences between the 2010 group with the SIB cohort and between the combined 2010/2011 group with the SIB cohort
21
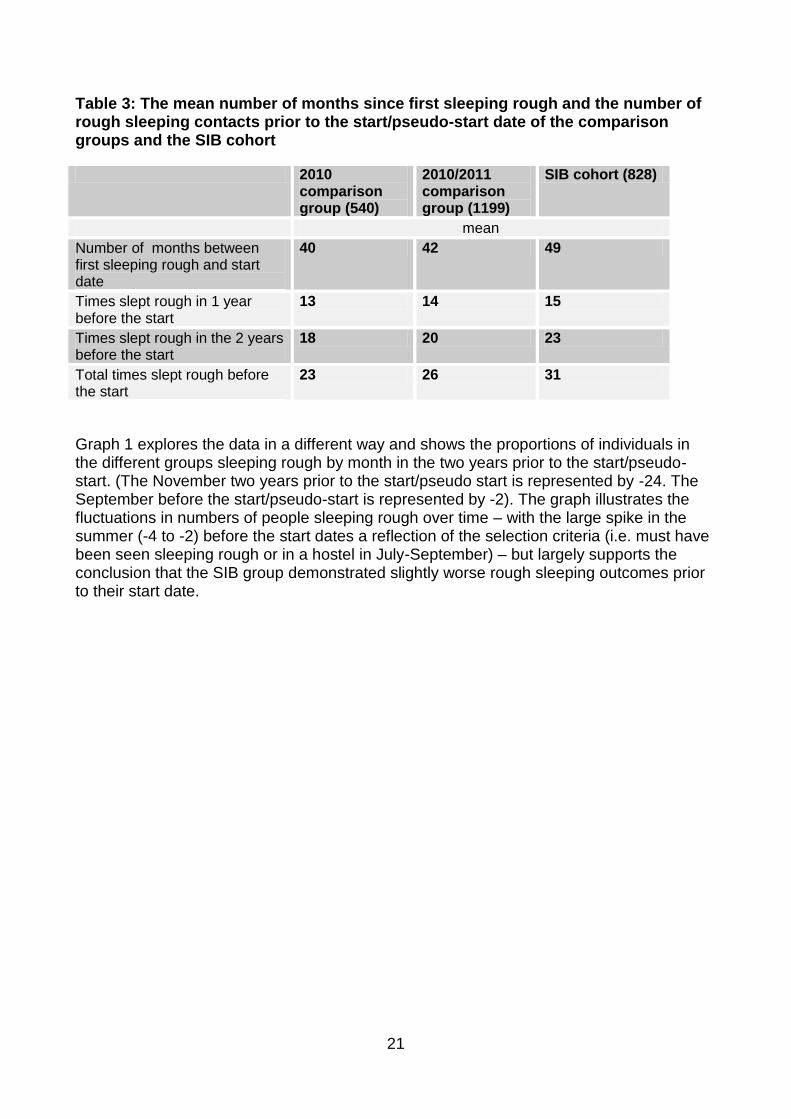
Table 3: The mean number of months since first sleeping rough and the number of rough sleeping contacts prior to the start/pseudo-start date of the comparison groups and the SIB cohort 2010
comparison group (540)
2010/2011 comparison group (1199)
SIB cohort (828)
mean
Number of months between first sleeping rough and start date
40 42 49
Times slept rough in 1 year before the start
13 14 15
Times slept rough in the 2 years before the start
18 20 23
Total times slept rough before the start
23 26 31
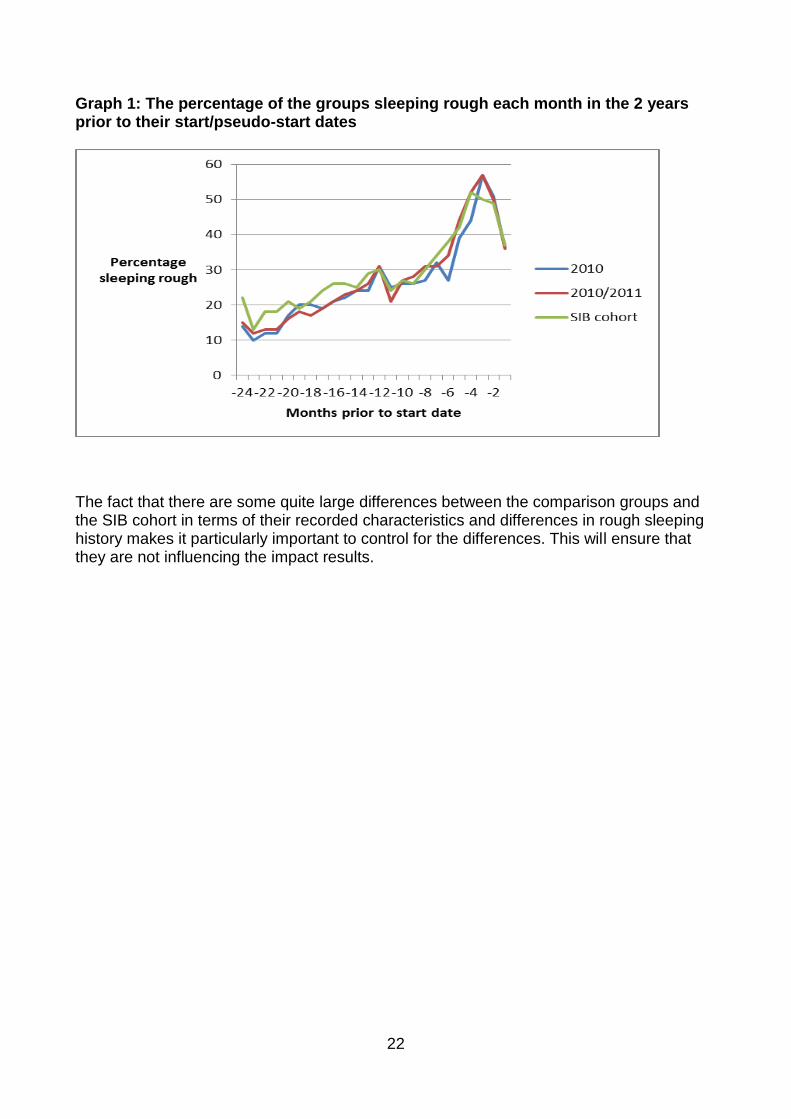
Graph 1 explores the data in a different way and shows the proportions of individuals in the different groups sleeping rough by month in the two years prior to the start/pseudo-start. (The November two years prior to the start/pseudo start is represented by -24. The September before the start/pseudo-start is represented by -2). The graph illustrates the fluctuations in numbers of people sleeping rough over time – with the large spike in the summer (-4 to -2) before the start dates a reflection of the selection criteria (i.e. must have been seen sleeping rough or in a hostel in July-September) – but largely supports the conclusion that the SIB group demonstrated slightly worse rough sleeping outcomes prior to their start date.
22
Graph 1: The percentage of the groups sleeping rough each month in the 2 years prior to their start/pseudo-start dates
The fact that there are some quite large differences between the comparison groups and the SIB cohort in terms of their recorded characteristics and differences in rough sleeping history makes it particularly important to control for the differences. This will ensure that they are not influencing the impact results.
23
7 Propensity Score Matching
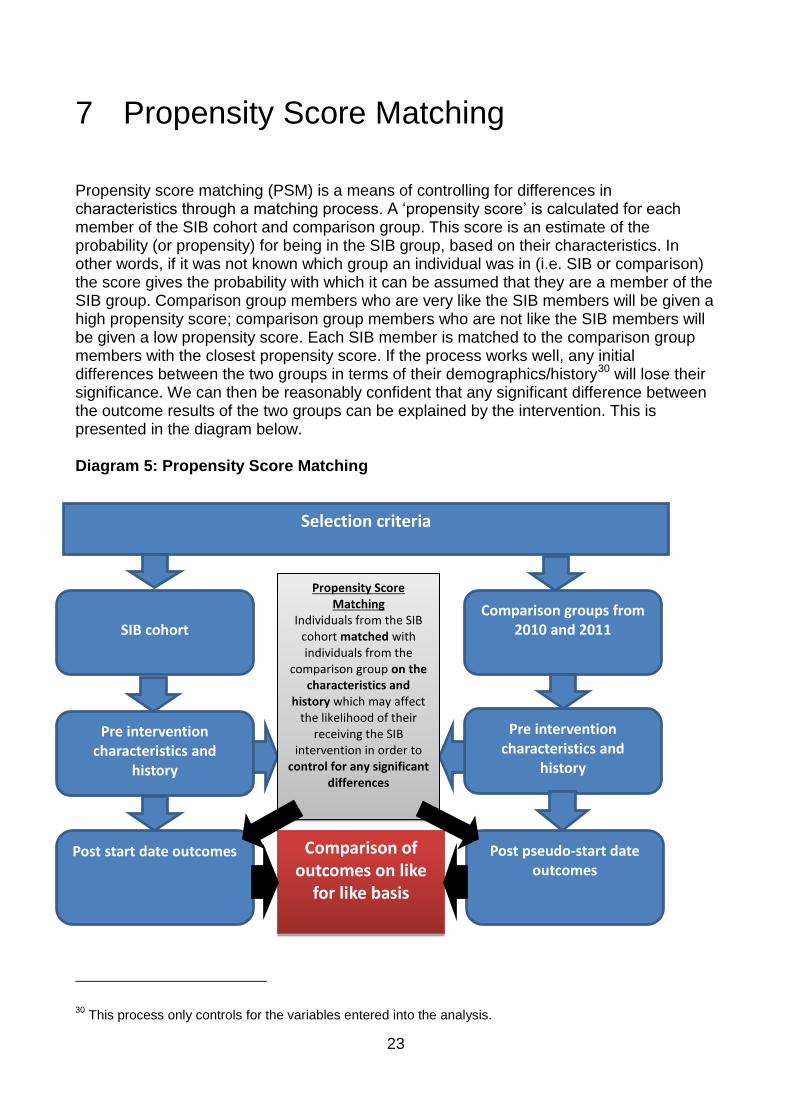
Propensity score matching (PSM) is a means of controlling for differences in characteristics through a matching process. A ‘propensity score’ is calculated for each member of the SIB cohort and comparison group. This score is an estimate of the probability (or propensity) for being in the SIB group, based on their characteristics. In other words, if it was not known which group an individual was in (i.e. SIB or comparison) the score gives the probability with which it can be assumed that they are a member of the SIB group. Comparison group members who are very like the SIB members will be given a high propensity score; comparison group members who are not like the SIB members will be given a low propensity score. Each SIB member is matched to the comparison group members with the closest propensity score. If the process works well, any initial differences between the two groups in terms of their demographics/history30 will lose their significance. We can then be reasonably confident that any significant difference between the outcome results of the two groups can be explained by the intervention. This is presented in the diagram below. Diagram 5: Propensity Score Matching 30
This process only controls for the variables entered into the analysis.
Selection criteria
SIB cohort
Comparison groups from 2010 and 2011
Pre intervention characteristics and
history
Pre intervention characteristics and
history
Post pseudo-start date outcomes
Post start date outcomes
Propensity Score Matching
Individuals from the SIB cohort matched with individuals from the
comparison group on the characteristics and
history which may affect the likelihood of their
receiving the SIB intervention in order to
control for any significant differences
Comparison of outcomes on like
for like basis
24
The PSM process31 successfully controlled for differences between the groups in terms of their demographics, need assessments and past experiences. Significant initial differences between the groups were successfully smoothed out. The differences in characteristics/experiences after matching are shown in the technical annex.
31
There are several different methods for carrying out PSM analysis. For this study, Nearest Neighbour (5) matching was found to be most effective method of Propensity Score Matching across all the analysis carried out.
25
8 Results
This section presents the results of the PSM matching process for rough sleeping, reconnections and arrival to long-term accommodation. It shows that after one year:
The mean number of rough sleeping contacts for the SIB group was 6.2 compared to 8.4 for the comparison group
53% of the SIB group slept rough once or more compared to 60% of the comparison group
10% of the SIB group had a confirmed reconnection compared to 7% of the comparison group (combined 2010/2011 comparison group)
8% of the SIB group were non-UK nationals with a confirmed reconnection compared to 4% of the comparison group
23% of the SIB group had an arrival to long-term accommodation in the one year following the start compared to 4% of the comparison group
It shows that after two years:
The mean number of rough sleeping contacts for the SIB group was 9.2 compared to 13.9 for the comparison group
60% of the SIB group slept rough once or more in the two years after the start compared to 67% of the comparison group
15% of the SIB group had a confirmed reconnection compared to 12% of the comparison group
12% of the SIB group were non-uk nationals with a confirmed reconnection compared to 5% of the comparison group
37% of the SIB group had an arrival to long-term accommodation compared to 7% of the comparison group
7% of the SIB group had successfully sustained a reconnection made in the first year, for 6 months, compared to 6% of the comparison group
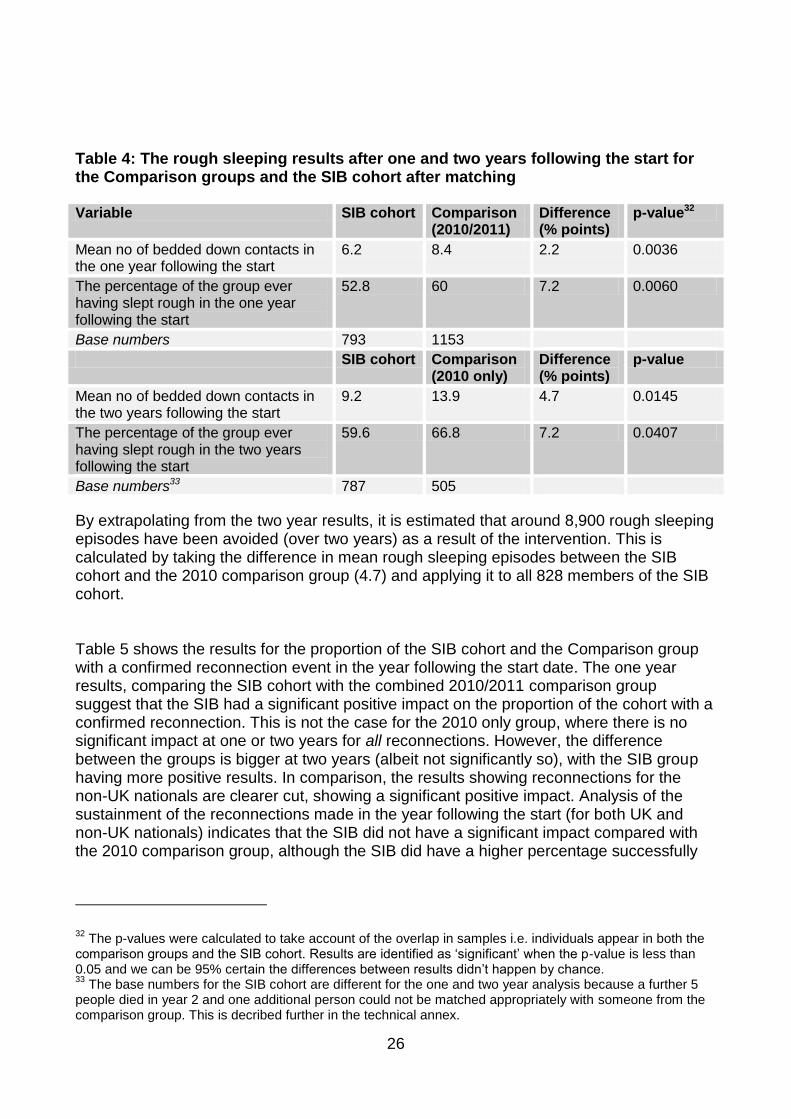
Table 4 shows the results after the matching process for the mean number of bedded down contacts (rough sleeping) for the comparison groups and the SIB cohort and whether individuals have ever slept rough since the start/pseudo-start date. All results show that the London Homelessness SIB had a significant positive impact on the rough sleeping of the cohort at both one and two years over and above what would have happened in the absence of the intervention. The difference in the likelihood of the group ever having slept rough are similar for both years. The difference between the mean number of bedded down contacts is also similar when you compare the yearly rate rather than the overall total – a difference of 2.2 over one year and 4.7 over two years, giving a yearly rate of 2.2 and 2.35 respectively.
26
Table 4: The rough sleeping results after one and two years following the start for the Comparison groups and the SIB cohort after matching Variable SIB cohort Comparison
(2010/2011) Difference (% points)
p-value32
Mean no of bedded down contacts in the one year following the start
6.2 8.4 2.2 0.0036
The percentage of the group ever having slept rough in the one year following the start
52.8 60 7.2 0.0060
Base numbers 793 1153
SIB cohort Comparison (2010 only)
Difference (% points)
p-value
Mean no of bedded down contacts in the two years following the start
9.2 13.9 4.7 0.0145
The percentage of the group ever having slept rough in the two years following the start
59.6 66.8 7.2 0.0407
Base numbers33 787 505
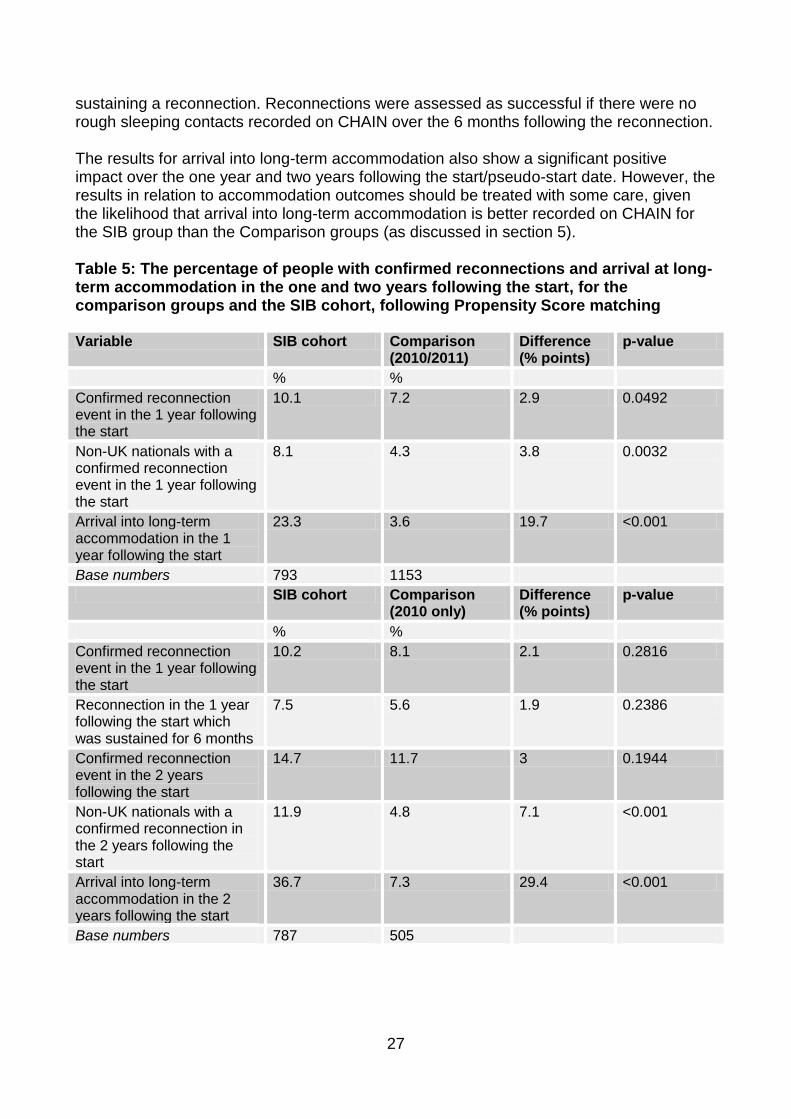
By extrapolating from the two year results, it is estimated that around 8,900 rough sleeping episodes have been avoided (over two years) as a result of the intervention. This is calculated by taking the difference in mean rough sleeping episodes between the SIB cohort and the 2010 comparison group (4.7) and applying it to all 828 members of the SIB cohort. Table 5 shows the results for the proportion of the SIB cohort and the Comparison group with a confirmed reconnection event in the year following the start date. The one year results, comparing the SIB cohort with the combined 2010/2011 comparison group suggest that the SIB had a significant positive impact on the proportion of the cohort with a confirmed reconnection. This is not the case for the 2010 only group, where there is no significant impact at one or two years for all reconnections. However, the difference between the groups is bigger at two years (albeit not significantly so), with the SIB group having more positive results. In comparison, the results showing reconnections for the non-UK nationals are clearer cut, showing a significant positive impact. Analysis of the sustainment of the reconnections made in the year following the start (for both UK and non-UK nationals) indicates that the SIB did not have a significant impact compared with the 2010 comparison group, although the SIB did have a higher percentage successfully
32
The p-values were calculated to take account of the overlap in samples i.e. individuals appear in both the comparison groups and the SIB cohort. Results are identified as ‘significant’ when the p-value is less than 0.05 and we can be 95% certain the differences between results didn’t happen by chance. 33
The base numbers for the SIB cohort are different for the one and two year analysis because a further 5 people died in year 2 and one additional person could not be matched appropriately with someone from the comparison group. This is decribed further in the technical annex.
27
sustaining a reconnection. Reconnections were assessed as successful if there were no rough sleeping contacts recorded on CHAIN over the 6 months following the reconnection. The results for arrival into long-term accommodation also show a significant positive impact over the one year and two years following the start/pseudo-start date. However, the results in relation to accommodation outcomes should be treated with some care, given the likelihood that arrival into long-term accommodation is better recorded on CHAIN for the SIB group than the Comparison groups (as discussed in section 5). Table 5: The percentage of people with confirmed reconnections and arrival at long-term accommodation in the one and two years following the start, for the comparison groups and the SIB cohort, following Propensity Score matching Variable SIB cohort Comparison
(2010/2011) Difference (% points)
p-value
% %
Confirmed reconnection event in the 1 year following the start
10.1 7.2 2.9 0.0492
Non-UK nationals with a confirmed reconnection event in the 1 year following the start
8.1 4.3 3.8 0.0032
Arrival into long-term accommodation in the 1 year following the start
23.3 3.6 19.7 <0.001
Base numbers 793 1153
SIB cohort Comparison (2010 only)
Difference (% points)
p-value
% %
Confirmed reconnection event in the 1 year following the start
10.2 8.1 2.1 0.2816
Reconnection in the 1 year following the start which was sustained for 6 months
7.5 5.6 1.9 0.2386
Confirmed reconnection event in the 2 years following the start
14.7 11.7 3 0.1944
Non-UK nationals with a confirmed reconnection in the 2 years following the start
11.9 4.8 7.1 <0.001
Arrival into long-term accommodation in the 2 years following the start
36.7 7.3 29.4 <0.001
Base numbers 787 505
28
9 Discussion of the results of the impact evaluation and the findings of the qualitative evaluation
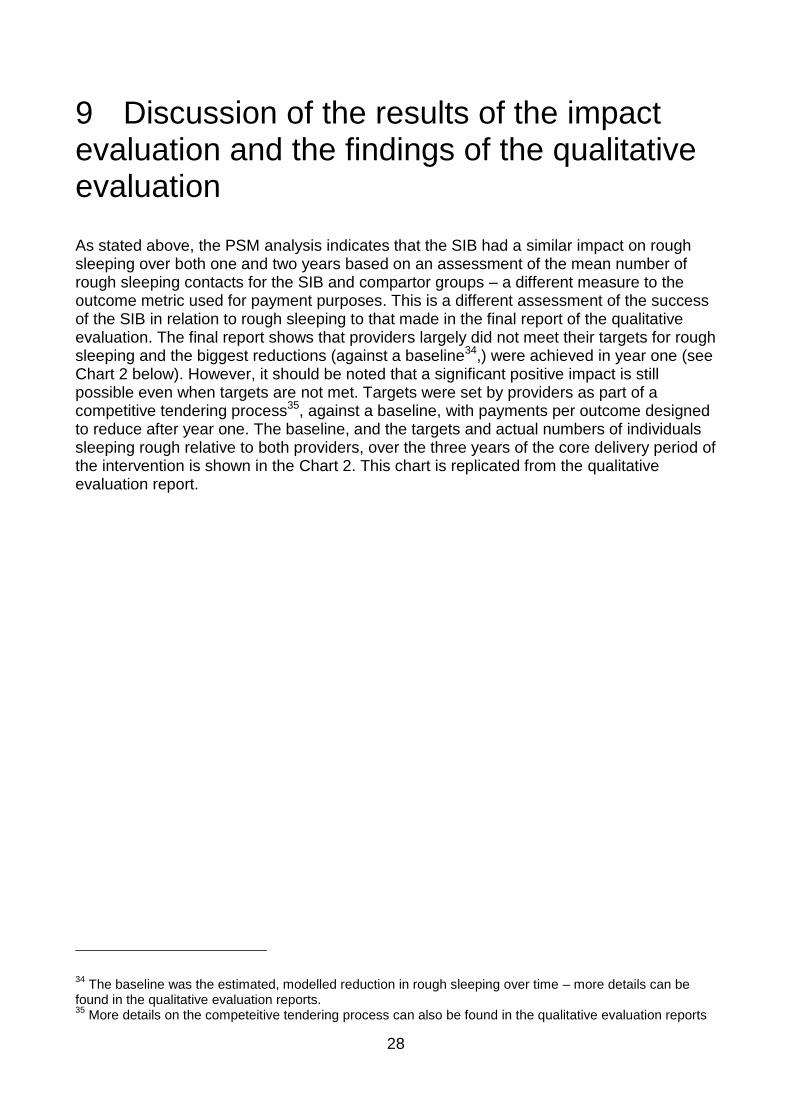
As stated above, the PSM analysis indicates that the SIB had a similar impact on rough sleeping over both one and two years based on an assessment of the mean number of rough sleeping contacts for the SIB and compartor groups – a different measure to the outcome metric used for payment purposes. This is a different assessment of the success of the SIB in relation to rough sleeping to that made in the final report of the qualitative evaluation. The final report shows that providers largely did not meet their targets for rough sleeping and the biggest reductions (against a baseline34,) were achieved in year one (see Chart 2 below). However, it should be noted that a significant positive impact is still possible even when targets are not met. Targets were set by providers as part of a competitive tendering process35, against a baseline, with payments per outcome designed to reduce after year one. The baseline, and the targets and actual numbers of individuals sleeping rough relative to both providers, over the three years of the core delivery period of the intervention is shown in the Chart 2. This chart is replicated from the qualitative evaluation report.
34
The baseline was the estimated, modelled reduction in rough sleeping over time – more details can be found in the qualitative evaluation reports. 35
More details on the competeitive tendering process can also be found in the qualitative evaluation reports
29
Chart 2: The quarterly rough sleeping results, targets and baseline for the SIB over the three years of the core intervention period
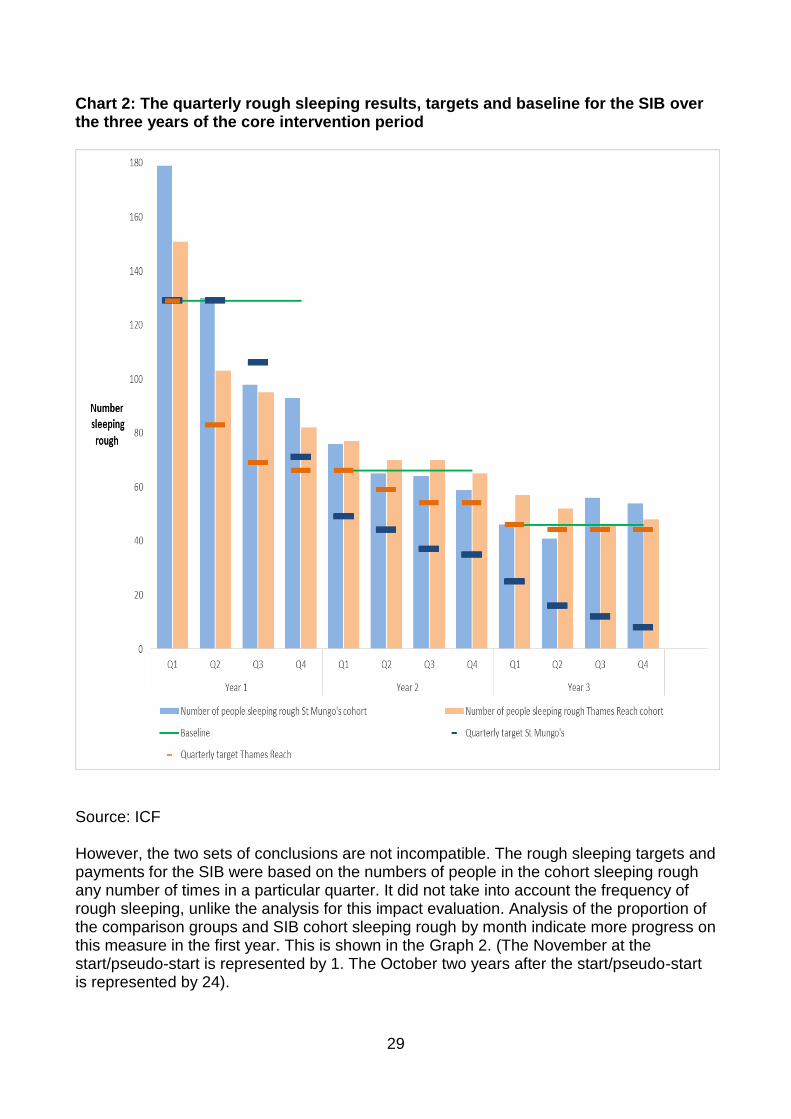
Source: ICF However, the two sets of conclusions are not incompatible. The rough sleeping targets and payments for the SIB were based on the numbers of people in the cohort sleeping rough any number of times in a particular quarter. It did not take into account the frequency of rough sleeping, unlike the analysis for this impact evaluation. Analysis of the proportion of the comparison groups and SIB cohort sleeping rough by month indicate more progress on this measure in the first year. This is shown in the Graph 2. (The November at the start/pseudo-start is represented by 1. The October two years after the start/pseudo-start is represented by 24).
30
Graph 2: The percentage of the comparison groups and SIB cohort with a bedded down contact recorded in the two years after the start/pseudo-start date, by month
0
5
10
15
20
25
30
35
1 3 5 7 9 11 13 15 17 19 21 23
Percentage sleeping rough
Months
2010
2010/2011
SIB Cohort
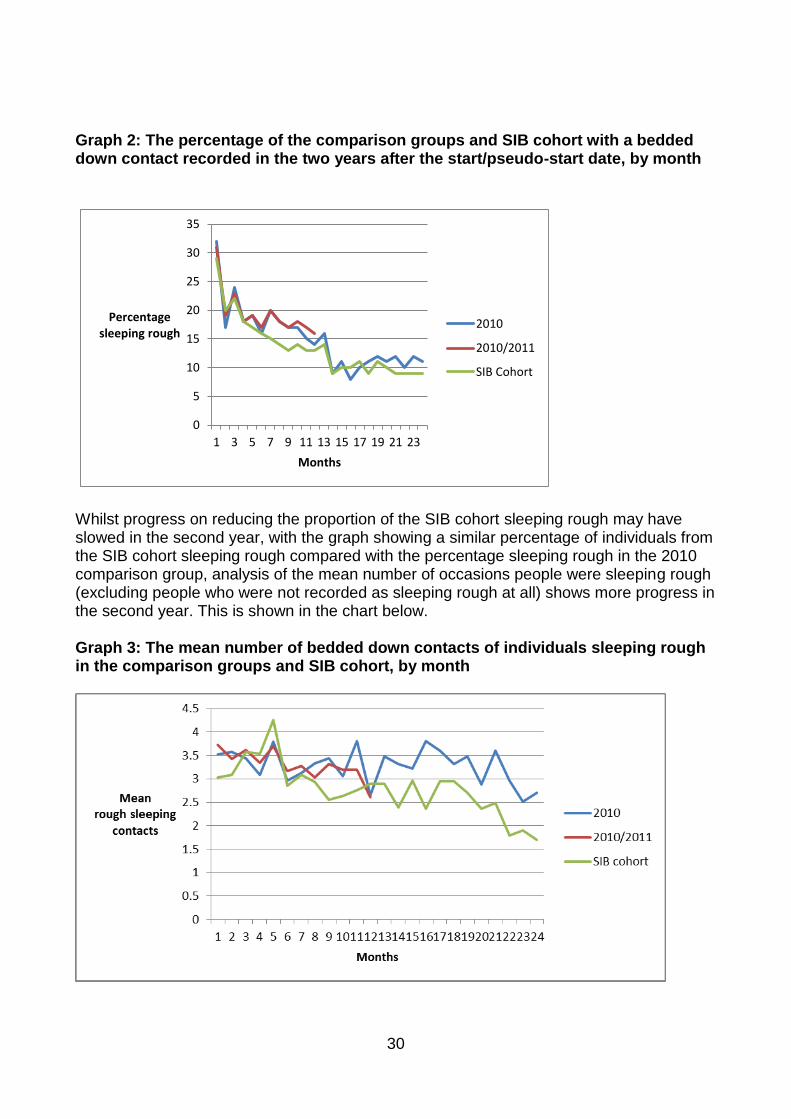
Whilst progress on reducing the proportion of the SIB cohort sleeping rough may have slowed in the second year, with the graph showing a similar percentage of individuals from the SIB cohort sleeping rough compared with the percentage sleeping rough in the 2010 comparison group, analysis of the mean number of occasions people were sleeping rough (excluding people who were not recorded as sleeping rough at all) shows more progress in the second year. This is shown in the chart below. Graph 3: The mean number of bedded down contacts of individuals sleeping rough in the comparison groups and SIB cohort, by month
31
This supports the conclusion made in the qualitative evaluation that there is an entrenched group of rough sleepers for whom a longer period of intervention time is required to move them away from the streets completely. Nevertheless, the results suggest that progress in reducing the levels of their exposure to rough sleeping can still be made and this appears to be more marked as the intervention time increases. The measure of rough sleeping used is influential in judging levels of success. Although the impact estimates suggest that the SIB did lead to improved rough sleeping outcomes, an alternative ‘explanation’ is that those improved outcomes may simply reflect natural change over time. This is a risk because the comparison groups are taken from earlier time periods rather than the same time period36. Analysis of one year results include rough sleeping in the years 2010-2012 for the comparison group and 2012-2013 for the SIB cohort. Two year results span 2010-2012 for the comparison group but 2012-2014 for the SIB cohort. It is possible that both one and two year rough sleeping results could be affected by any change in general patterns of rough sleeping. However, we have done analysis to test this (described below) and judge it an unlikely explanation. The annual reports produced on the data held in CHAIN by St Mungo’s show how recorded rough sleeping in London has changed over time. Of particular interest are the figures on the number of rough sleeping contacts of people who have been seen sleeping rough in two consecutive years – called ‘stock’. This group37 is the one most likely to include people from the comparison and intervention groups (as well as many others). Chart 3 is based on charts in the 2011/12 annual report and 2015/16 annual report38.
36
The design of the study means that it is assumed that the propensity for sleeping rough in 2010-2012 is the same as for 2012-2014 once personal characteristics are controlled for. 37
Other classifications are ‘flow’ (new rough sleepers) and ‘returners’ (people who were not seen in the previous year but who have been seen before). 38
Street to Home Annual Report 2011-12 http://www.mungos.org/chain/street_home_annual_reports and Greater London full report 2015-16 http://data.london.gov.uk/dataset/chain-reports
32
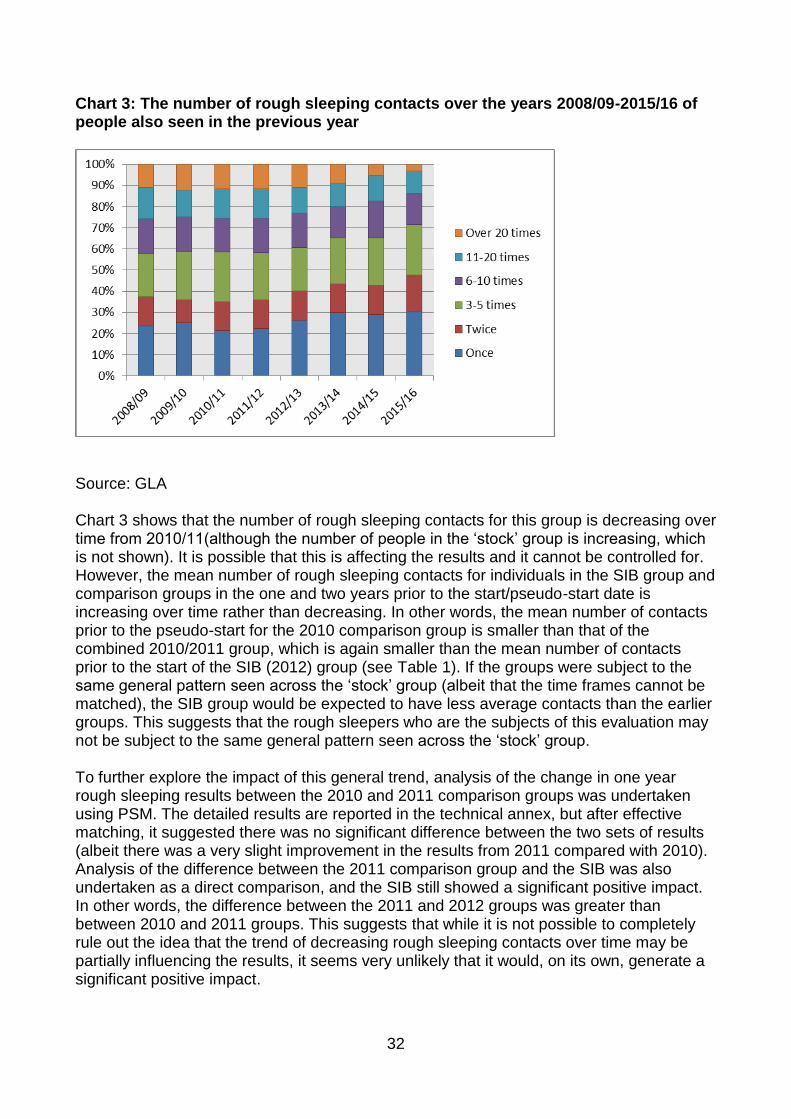
Chart 3: The number of rough sleeping contacts over the years 2008/09-2015/16 of people also seen in the previous year
Source: GLA Chart 3 shows that the number of rough sleeping contacts for this group is decreasing over time from 2010/11(although the number of people in the ‘stock’ group is increasing, which is not shown). It is possible that this is affecting the results and it cannot be controlled for. However, the mean number of rough sleeping contacts for individuals in the SIB group and comparison groups in the one and two years prior to the start/pseudo-start date is increasing over time rather than decreasing. In other words, the mean number of contacts prior to the pseudo-start for the 2010 comparison group is smaller than that of the combined 2010/2011 group, which is again smaller than the mean number of contacts prior to the start of the SIB (2012) group (see Table 1). If the groups were subject to the same general pattern seen across the ‘stock’ group (albeit that the time frames cannot be matched), the SIB group would be expected to have less average contacts than the earlier groups. This suggests that the rough sleepers who are the subjects of this evaluation may not be subject to the same general pattern seen across the ‘stock’ group. To further explore the impact of this general trend, analysis of the change in one year rough sleeping results between the 2010 and 2011 comparison groups was undertaken using PSM. The detailed results are reported in the technical annex, but after effective matching, it suggested there was no significant difference between the two sets of results (albeit there was a very slight improvement in the results from 2011 compared with 2010). Analysis of the difference between the 2011 comparison group and the SIB was also undertaken as a direct comparison, and the SIB still showed a significant positive impact. In other words, the difference between the 2011 and 2012 groups was greater than between 2010 and 2011 groups. This suggests that while it is not possible to completely rule out the idea that the trend of decreasing rough sleeping contacts over time may be partially influencing the results, it seems very unlikely that it would, on its own, generate a significant positive impact.
33
As discussed above, the impact of the SIB intervention on reconnection and sustainment rates shows slightly mixed results. When considering the number of all confirmed reconnections achieved (both among UK and non-UK nationals), the intervention was shown not to have a significant impact compared with the 2010 comparison group, at either one or two years. However, it was found to have a significant positive impact compared with the combined 2010/2011 comparison group (at one year). When considering sustainment of all reconnections over 6 months, the intervention did not appear to have any impact at one year, compared with the 2010 comparison group. In contrast, the impact evaluation showed the strong positive impact of the intervention on confirmed reconnections for non-UK nationals. This (and the sustainment of it) was the only reconnection measure for which providers were paid. Nevertheless, providers did not meet their initial reconnection targets overall or their 6 month sustainment targets (as outlined in the qualitative evaluation)39.There were expectations that the outcomes would improve in year three due to changes to benefit entitlement for individuals from the European Economic Area. Welfare reforms introduced in April 2014 mean that individuals from the European Economic Area can only claim housing benefit in specific circumstances. This was expected to provide non-UK nationals not claiming asylum more reason to return to their home country40. Targets were met in year three, but these were set at relatively low levels. The final report of the qualitative evaluation (section 5.2) explains the fact that these changes did not have the expected impact in terms of the complexity of the cases and the long-term nature of the process of facilitating reconnections - although it is reported that there may have been some early impact in the latter half of year two. Higher than expected levels of complex needs and entrenched rough sleeping amongst the cohort was also identified as the reason behind missed targets. The results of the analysis on long-term accommodation show that the SIB intervention had a very large significant positive impact compared to both comparison groups. As noted above, there are concerns that there may be biases in data recording. However, whilst it is not known how many people in the comparison group will have entered long-term accommodation without any help from homelessness providers, the data strongly suggests that facilitating entry into long-term accommodation had not previously been a top priority for staff. The SIB intervention changed this. The process evaluation notes the success achieved:
targets for numbers of individuals entering long-term accommodation were very narrowly missed - 304 entered long-term accommodation against a target of 306 - with an over-achievement in the first two years,
there was an over-achievement in relation to sustainment targets (241 people sustained their accommodation for 12 months against a target of 219, 184 people sustained their accommodation for 18 months against a target of 154).
39
However, it should be noted that the there was a relaxation of the evidence requirements for confirmed reconnections during year one. Paid outcomes for year one will not have included all the confirmed reconnections recorded in CHAIN which are included in the impact evaluation results. 40
This is explained further in the second interim report of the Qualitative Evaluation of the London homelessness social impact bond https://www.gov.uk/government/uploads/system/uploads/attachment_data/file/414787/Qualitative_evaluation_of_the_London_homelessness_SIB.pdf
34
10 Conclusion
The results show that, when compared to a well-matched comparison group, the intervention significantly reduced rough sleeping over a two year period. The intervention group was significantly more likely than the comparison group to completely desist41 from sleeping rough in the two years following the start of the programme. Furthermore, on average the intervention group had significantly fewer episodes of rough sleeping compared to the comparison groups, with a similar impact over one and two years. Analysis of the performance of the SIB against rough sleeping targets in the qualitative evaluation is a bit different – performance data shows that targets were largely missed and the biggest reductions in rough sleeping against the baseline were made in year one. However, it should be noted that a significant positive impact is still possible even when targets are not met and the rough sleeping outcome metric used for the targets was not the same as the measures of rough sleeping used in this evaluation. When a similar measure of rough sleeping is used - the proportion of the comparison groups and SIB cohort sleeping rough by month – it also shows greater progress in the first year. In contrast, analysis of the mean number of occasions people were sleeping rough (excluding people who were not recorded as sleeping rough at all) shows more progress in the second year. This supports the conclusion made in the qualitative evaluation that there is an entrenched group of rough sleepers for whom a longer period of intervention time is required to move them away from the streets completely. Nevertheless, the results suggest that progress in reducing the levels of their exposure to rough sleeping can still be made. The measure of rough sleeping used is influential in judging levels of success. Although the impact estimates suggest that the SIB did lead to improved rough sleeping outcomes, an alternative ‘explanation’ is that those improved outcomes may simply reflect natural change over time. This is a risk because the comparison groups are taken from earlier time periods rather than the same time period42. It is possible that the rough sleeping results could be affected by any change in general patterns of rough sleeping. However, the analysis undertaken to test this indicates that this is an unlikely explanation. In relation to all confirmed reconnections, whereby a rough sleeper is known to have returned to their home area, the results of the impact evaluation are more ambiguous. The differences in number of all reconnection events (for both UK and non-UK nationals) between the SIB group and the comparison group were statistically significant at one year (for the joint 2010/2011 comparison group), but statistically non-significant at two years. The results of the sustainment (over six months) of the reconnections achieved in the first year were statistically non-significant.
41
This is based on an absence of recorded bedded down contacts in London over one or two years. 42
The design of the study means that it is assumed that the propensity for sleeping rough in 2010-2012 is the same as for 2012-2014 once personal characteristics are controlled for.
35
However, when considering confirmed reconnections among non-UK nationals43, the picture is unequivocal. The intervention group had a significant positive impact at one and two years compared to the comparison groups, despite providers not meeting their initial reconnection targets or their 6 month sustainment targets in the first two years. Higher than expected levels of complex needs, the long-term nature of the process of facilitating reconnections and entrenched rough sleeping amongst the cohort were identified as the reason behind missed targets. The impact evaluation found that the intervention had a significant positive impact on the number of people arriving into long-term accommodation one and two years after the start of the programme, with significantly more people arriving at long-term accommodation from the SIB cohort than in the matched comparison group. The qualitative evaluation reports that targets were very narrowly missed for initial entry into stable accommodation overall, but there was over-achievment in the first two years. Whilst there are some issues around data quality for this measure, the results strongly suggest that facilitating entry into long-term accommodation was not a top priority for staff previously - and the SIB intervention changed this. The impact study findings suggest that targets were stretching. It is possible that the difficulty of reducing rough sleeping44 and achieving positive reconnection and long-term accommodation outcomes among a complex and entrenched group was underestimated, but the SIB was designed to test what was possible through an innovative approach.
43
Reconnections among non-UK nationals was used as a measure instead of reconnections outside the UK due to the amount of missing data on country of reconnection. 44
It is also important to note that the rough sleeping outcome measures for this evaluation are not exactly the same as the rough sleeping target measure for the intervention
36
Technical annex
The technical annex sets out:
the data cleaning process and how missing data was dealt with,
the outputs from the PSM process, the results of PSM analysis comparing the 2010 group with the 2011 group and the
2011 group with the SIB group
Data cleaning and missing data
The data was cleaned by St Mungo’s prior to being provided to DCLG. Therefore no significant cleaning was undertaken prior to the analysis process being undertaken, although the records of people who had died before the start date/pseudo-start date for their relevant group were removed from the database (this excluded 2 people in the SIB cohort, 2 people in the 2010 comparison group and 1 person from the 2011 comparison group). Full data was not available for every individual included in the evaluation. For the variables on which matching was undertaken, there was missing data on nationality, ethnicity, experience of prison, care and the armed forces and need assessments. This missing data was handled in different ways:
missing data on ethnicity and nationality for 29 individuals45 was not imputed
missing data on experience of care was imputed for 537 individuals, where individuals with no recorded information were given an imputed value of 0 (no experience)
missing data on experience of prison was imputed for 558 individuals, where individuals with no recorded information were given an imputed value of 0 (no experience)
missing data on experience of the armed forces was imputed for 505 individuals, where individuals with no recorded information were given an imputed value of 0 (no experience)
222 individuals with no recorded need assessments prior to their start date were classed as having missing data and were given a an imputed value of 0 (no need)
individuals with a need assessment prior to their start date, but which did not necessarily record an assessment for each need (drug/alcohol/mental health) were not given ‘missing data’ status, but where no need was identified they were coded 0 (no need).
Cases were matched both on the data including the imputed data and on whether or not data was missing for each relevant variable.
Where an individual died in the one or two years following their start date, their results were not included in the relevant analysis. For example, rough sleeping results for the two
45
This figure refers to the number of cases. Because individuals can appear in multiple groups, the figure does not strictly refer to the number of individuals.
37
years following the start date excluded all individuals who died within that time frame, in order to prevent a 0 rough sleeping count being counted as a positive result. They would not however, necessarily have been excluded from the one year results if they died in year two.
The outputs from the PSM process
Propensity Score Matching was carried out twice using different comparison groups. The main analysis was undertaken based on PSM results for the 2010 comparison group and the SIB cohort, and the combined 2010 and 2011 comparison group and the SIB cohort. The results of the matching process for these samples are set out below.
2010 only comparison group Results are based on 1292 observations from an original sample of 1368. This excludes:
6 of the treatment group (the SIB cohort) who could not be matched (described as ‘off support’)
33 people who died in the 2 years following the start date (9 in the comparison group and 24 in the SIB cohort)
25 people with missing data on nationality or ethnicity, (where no data imputations were carried out)
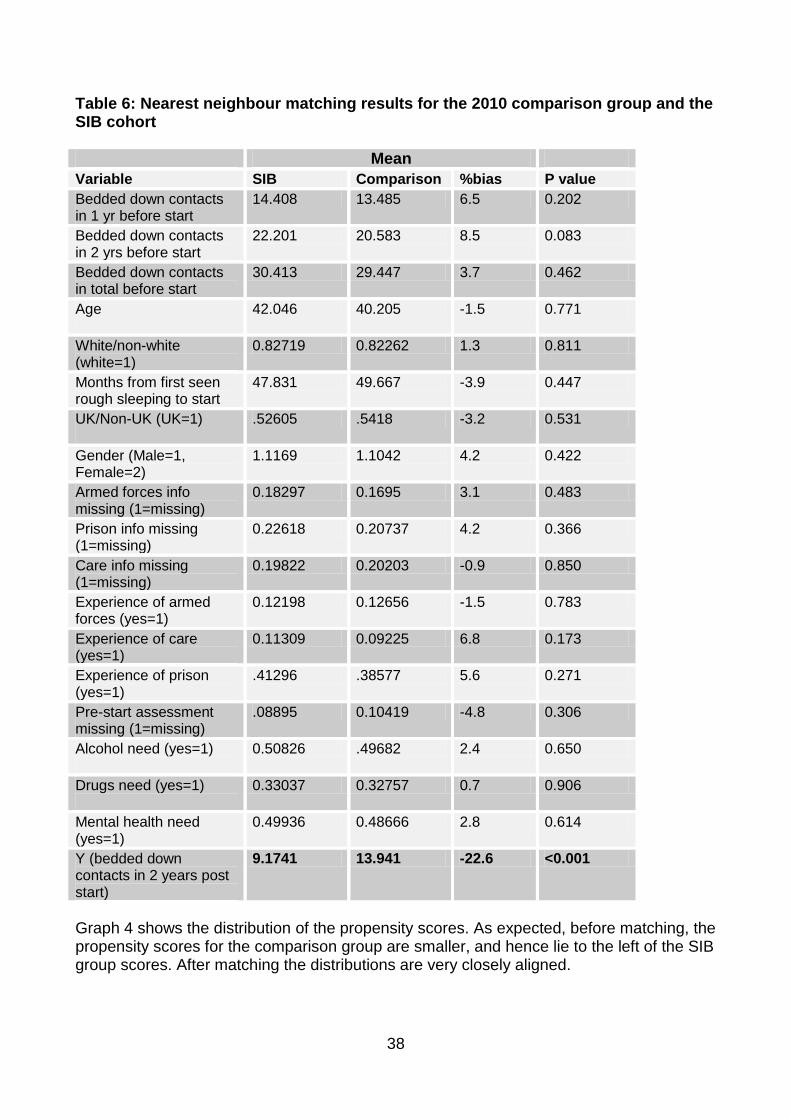
Nearest neighbour matching (5)46 was undertaken for the 2010 only comparison group and the SIB cohort. Table 6 shows the differences in characteristics and experiences between the comparison group and the SIB group, after matching. As can be seen from the table, there are no statistically significant differences between the characteristics after matching although some of the variables are biased by more than is preferable.
46
The means that individuals in the SIB cohort were matched to the 5 individuals (nearest neighbours) who were most like them from the Comparison group.
38
Table 6: Nearest neighbour matching results for the 2010 comparison group and the SIB cohort Mean
Variable SIB Comparison %bias P value
Bedded down contacts in 1 yr before start
14.408 13.485 6.5 0.202
Bedded down contacts in 2 yrs before start
22.201 20.583 8.5 0.083
Bedded down contacts in total before start
30.413 29.447 3.7 0.462
Age
42.046 40.205 -1.5 0.771
White/non-white (white=1)
0.82719 0.82262 1.3 0.811
Months from first seen rough sleeping to start
47.831 49.667 -3.9 0.447
UK/Non-UK (UK=1)
.52605 .5418 -3.2 0.531
Gender (Male=1, Female=2)
1.1169 1.1042 4.2 0.422
Armed forces info missing (1=missing)
0.18297 0.1695 3.1 0.483
Prison info missing (1=missing)
0.22618 0.20737 4.2 0.366
Care info missing (1=missing)
0.19822 0.20203 -0.9 0.850
Experience of armed forces (yes=1)
0.12198 0.12656 -1.5 0.783
Experience of care (yes=1)
0.11309 0.09225 6.8 0.173
Experience of prison (yes=1)
.41296 .38577 5.6 0.271
Pre-start assessment missing (1=missing)
.08895 0.10419 -4.8 0.306
Alcohol need (yes=1)
0.50826 .49682 2.4 0.650
Drugs need (yes=1)
0.33037 0.32757 0.7 0.906
Mental health need (yes=1)
0.49936 0.48666 2.8 0.614
Y (bedded down contacts in 2 years post start)
9.1741 13.941 -22.6 <0.001
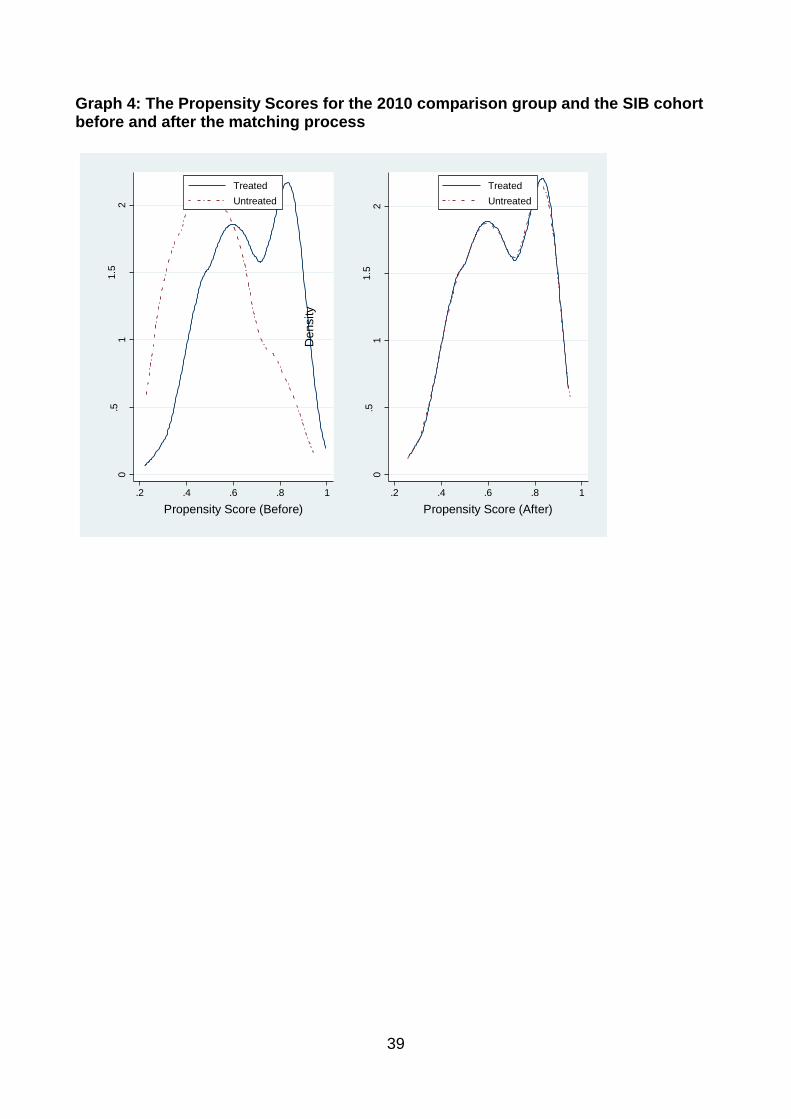
Graph 4 shows the distribution of the propensity scores. As expected, before matching, the propensity scores for the comparison group are smaller, and hence lie to the left of the SIB group scores. After matching the distributions are very closely aligned.
39
Graph 4: The Propensity Scores for the 2010 comparison group and the SIB cohort before and after the matching process
0.5
11.5
2
Density
.2 .4 .6 .8 1
Propensity Score (Before)
Treated
Untreated
0.5
11.5
2
Density
.2 .4 .6 .8 1
Propensity Score (After)
Treated
Untreated
40
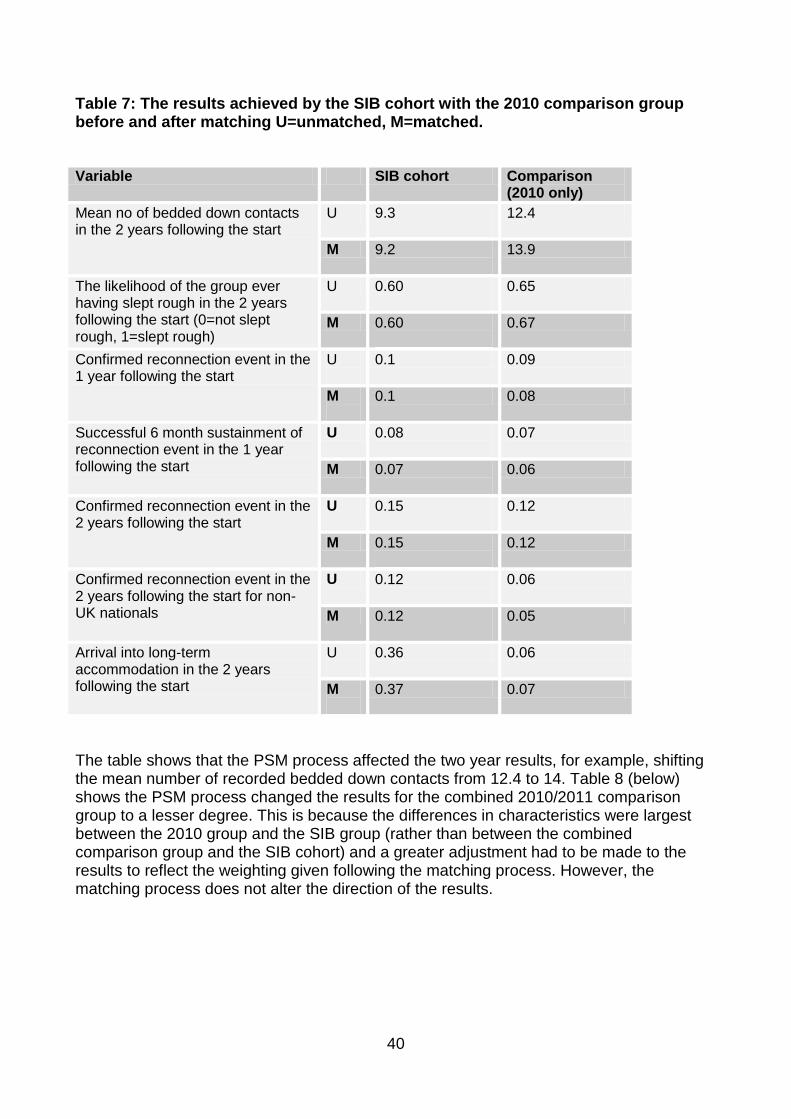
Table 7: The results achieved by the SIB cohort with the 2010 comparison group before and after matching U=unmatched, M=matched. Variable SIB cohort Comparison
(2010 only)
Mean no of bedded down contacts in the 2 years following the start
U 9.3
12.4
M 9.2
13.9
The likelihood of the group ever having slept rough in the 2 years following the start (0=not slept rough, 1=slept rough)
U 0.60
0.65
M 0.60
0.67
Confirmed reconnection event in the 1 year following the start
U
0.1 0.09
M
0.1 0.08
Successful 6 month sustainment of reconnection event in the 1 year following the start
U 0.08
0.07
M 0.07
0.06
Confirmed reconnection event in the 2 years following the start
U 0.15
0.12
M 0.15
0.12
Confirmed reconnection event in the 2 years following the start for non-UK nationals
U 0.12
0.06
M 0.12
0.05
Arrival into long-term accommodation in the 2 years following the start
U
0.36 0.06
M
0.37 0.07
The table shows that the PSM process affected the two year results, for example, shifting the mean number of recorded bedded down contacts from 12.4 to 14. Table 8 (below) shows the PSM process changed the results for the combined 2010/2011 comparison group to a lesser degree. This is because the differences in characteristics were largest between the 2010 group and the SIB group (rather than between the combined comparison group and the SIB cohort) and a greater adjustment had to be made to the results to reflect the weighting given following the matching process. However, the matching process does not alter the direction of the results.
41
Combined 2010 and 2011 comparison group Results are based on 1946 observations from an original sample of 2027. This excludes:
5 of the treatment group (the SIB cohort) who could not be matched (described as ‘off support’)
33 people who died in the 1 year following the start date (14 in the comparison group and 19 in the SIB cohort)
29 people with missing data on nationality and/or ethnicity, (where no data imputations were carried out)
Nearest Neighbour (5) matching was undertaken for the combined 2010/2011 comparison group and the SIB cohort, with the following results. As can be seen from the table, there are no statistically significant differences between the characteristics after matching and the biases in the variables are low.
42
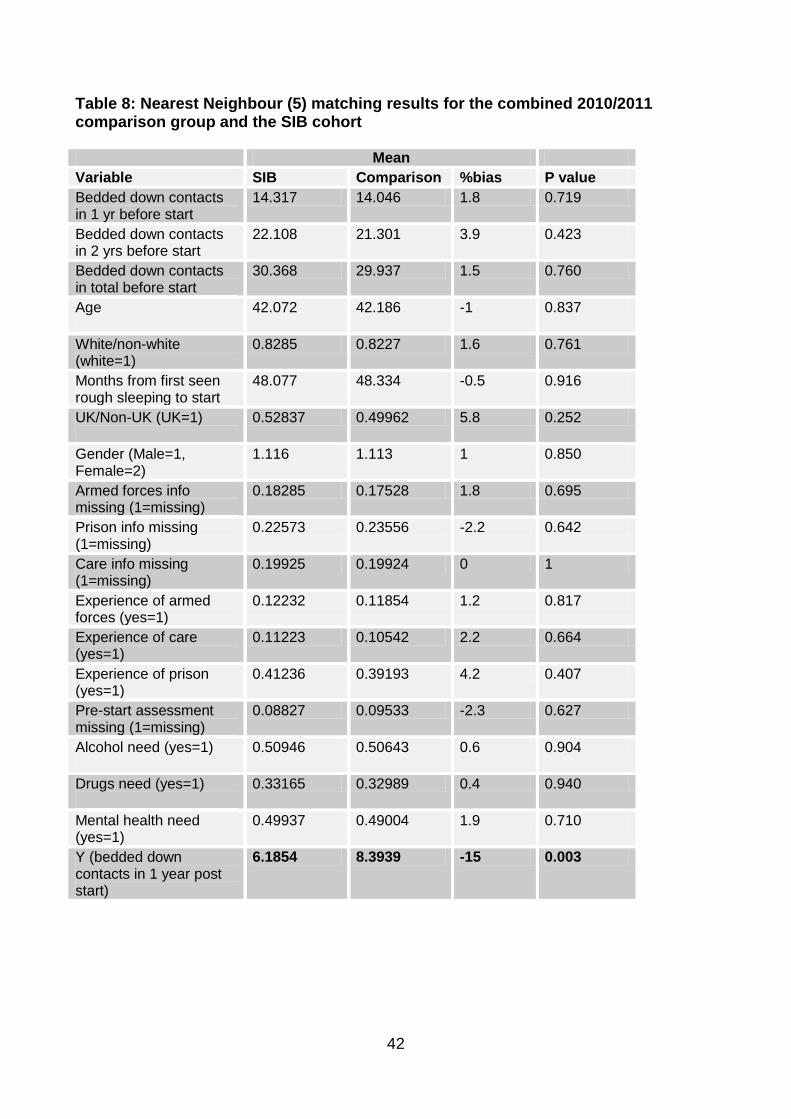
Table 8: Nearest Neighbour (5) matching results for the combined 2010/2011 comparison group and the SIB cohort Mean
Variable SIB Comparison %bias P value
Bedded down contacts in 1 yr before start
14.317 14.046 1.8 0.719
Bedded down contacts in 2 yrs before start
22.108 21.301 3.9 0.423
Bedded down contacts in total before start
30.368 29.937 1.5 0.760
Age
42.072 42.186 -1 0.837
White/non-white (white=1)
0.8285 0.8227 1.6 0.761
Months from first seen rough sleeping to start
48.077 48.334 -0.5 0.916
UK/Non-UK (UK=1)
0.52837 0.49962 5.8 0.252
Gender (Male=1, Female=2)
1.116 1.113 1 0.850
Armed forces info missing (1=missing)
0.18285 0.17528 1.8 0.695
Prison info missing (1=missing)
0.22573 0.23556 -2.2 0.642
Care info missing (1=missing)
0.19925 0.19924 0 1
Experience of armed forces (yes=1)
0.12232 0.11854 1.2 0.817
Experience of care (yes=1)
0.11223 0.10542 2.2 0.664
Experience of prison (yes=1)
0.41236 0.39193 4.2 0.407
Pre-start assessment missing (1=missing)
0.08827 0.09533 -2.3 0.627
Alcohol need (yes=1)
0.50946 0.50643 0.6 0.904
Drugs need (yes=1)
0.33165 0.32989 0.4 0.940
Mental health need (yes=1)
0.49937 0.49004 1.9 0.710
Y (bedded down contacts in 1 year post start)
6.1854 8.3939 -15 0.003
43
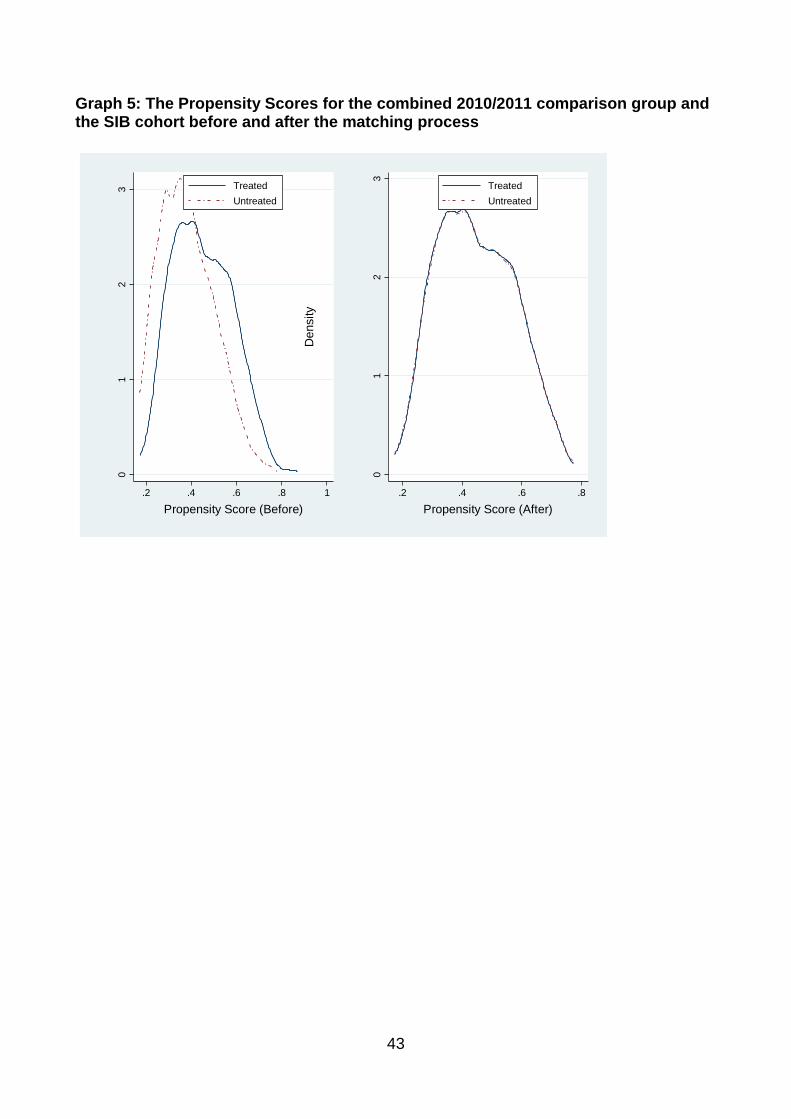
Graph 5: The Propensity Scores for the combined 2010/2011 comparison group and the SIB cohort before and after the matching process
01
23
Density
.2 .4 .6 .8 1
Propensity Score (Before)
Treated
Untreated
01
23
Density
.2 .4 .6 .8
Propensity Score (After)
Treated
Untreated
44
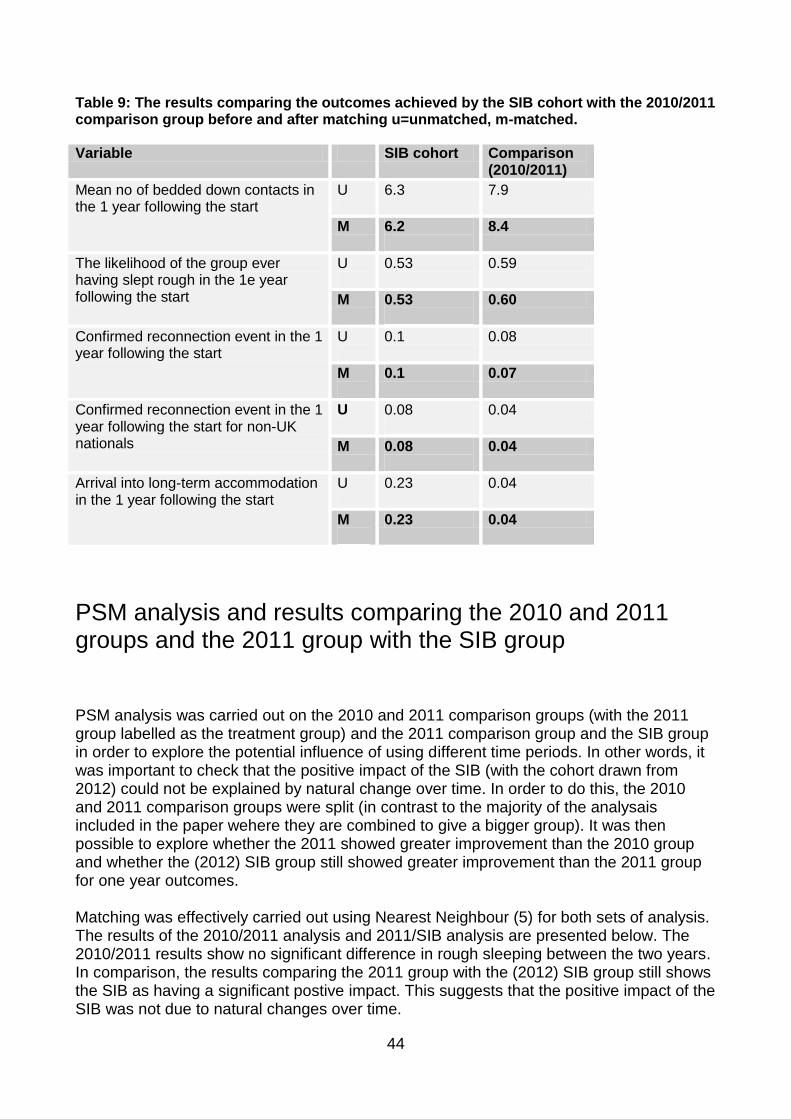
Table 9: The results comparing the outcomes achieved by the SIB cohort with the 2010/2011 comparison group before and after matching u=unmatched, m-matched. Variable SIB cohort Comparison
(2010/2011)
Mean no of bedded down contacts in the 1 year following the start
U
6.3 7.9
M 6.2
8.4
The likelihood of the group ever having slept rough in the 1e year following the start
U
0.53 0.59
M 0.53
0.60
Confirmed reconnection event in the 1 year following the start
U
0.1 0.08
M
0.1 0.07
Confirmed reconnection event in the 1 year following the start for non-UK nationals
U 0.08
0.04
M 0.08
0.04
Arrival into long-term accommodation in the 1 year following the start
U
0.23 0.04
M
0.23 0.04
PSM analysis and results comparing the 2010 and 2011 groups and the 2011 group with the SIB group
PSM analysis was carried out on the 2010 and 2011 comparison groups (with the 2011 group labelled as the treatment group) and the 2011 comparison group and the SIB group in order to explore the potential influence of using different time periods. In other words, it was important to check that the positive impact of the SIB (with the cohort drawn from 2012) could not be explained by natural change over time. In order to do this, the 2010 and 2011 comparison groups were split (in contrast to the majority of the analysais included in the paper wehere they are combined to give a bigger group). It was then possible to explore whether the 2011 showed greater improvement than the 2010 group and whether the (2012) SIB group still showed greater improvement than the 2011 group for one year outcomes. Matching was effectively carried out using Nearest Neighbour (5) for both sets of analysis. The results of the 2010/2011 analysis and 2011/SIB analysis are presented below. The 2010/2011 results show no significant difference in rough sleeping between the two years. In comparison, the results comparing the 2011 group with the (2012) SIB group still shows the SIB as having a significant postive impact. This suggests that the positive impact of the SIB was not due to natural changes over time.
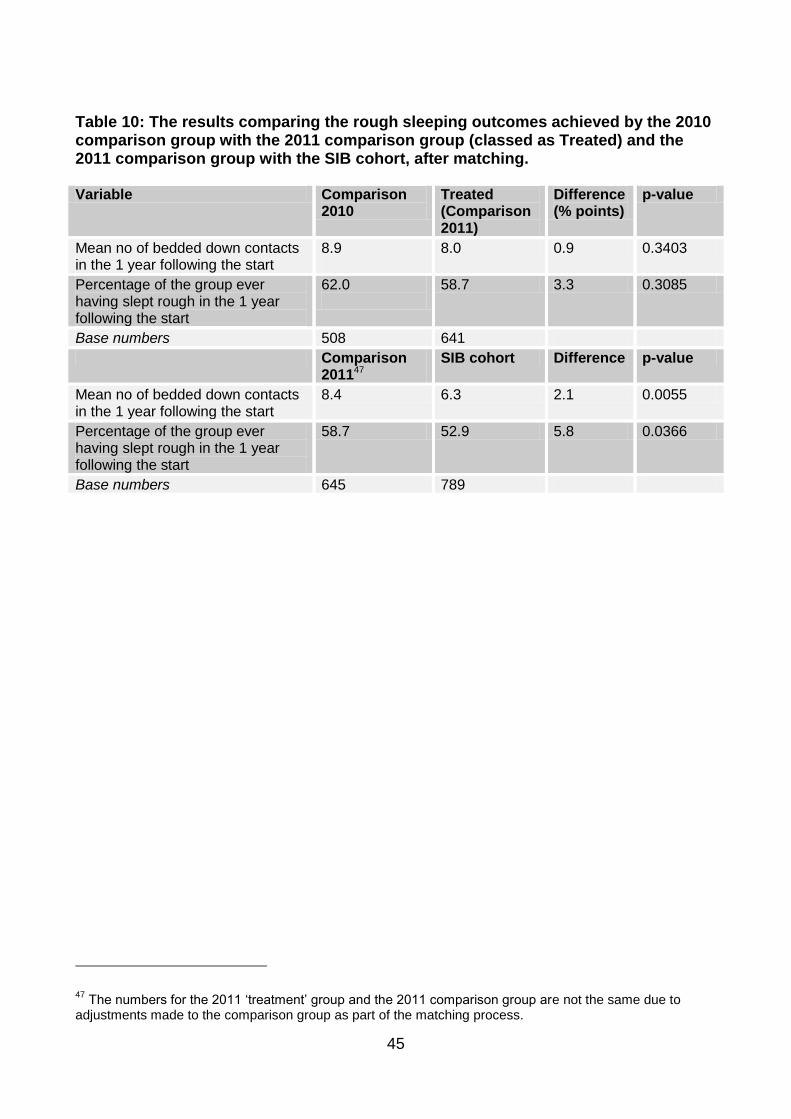
45
Table 10: The results comparing the rough sleeping outcomes achieved by the 2010 comparison group with the 2011 comparison group (classed as Treated) and the 2011 comparison group with the SIB cohort, after matching. Variable Comparison
2010 Treated (Comparison 2011)
Difference (% points)
p-value
Mean no of bedded down contacts in the 1 year following the start
8.9
8.0 0.9 0.3403
Percentage of the group ever having slept rough in the 1 year following the start
62.0
58.7 3.3 0.3085
Base numbers 508 641
Comparison 201147
SIB cohort Difference p-value
Mean no of bedded down contacts in the 1 year following the start
8.4 6.3 2.1 0.0055
Percentage of the group ever having slept rough in the 1 year following the start
58.7 52.9 5.8 0.0366
Base numbers 645 789
47
The numbers for the 2011 ‘treatment’ group and the 2011 comparison group are not the same due to adjustments made to the comparison group as part of the matching process.